Project
GSE53960: rat RNA-Seq transcriptomic Bodymap
Navigation
Downloads
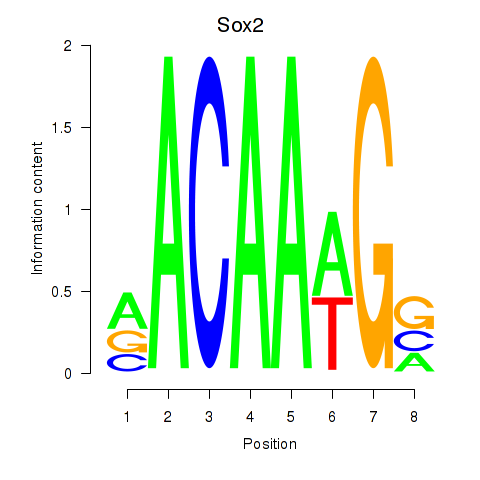
Results for Sox2
Z-value: 1.57
Motif logo
Transcription factors associated with Sox2
| Gene Symbol | Gene ID | Gene Info |
|---|---|---|
|
Sox2
|
ENSRNOG00000012199 | SRY box 2 |
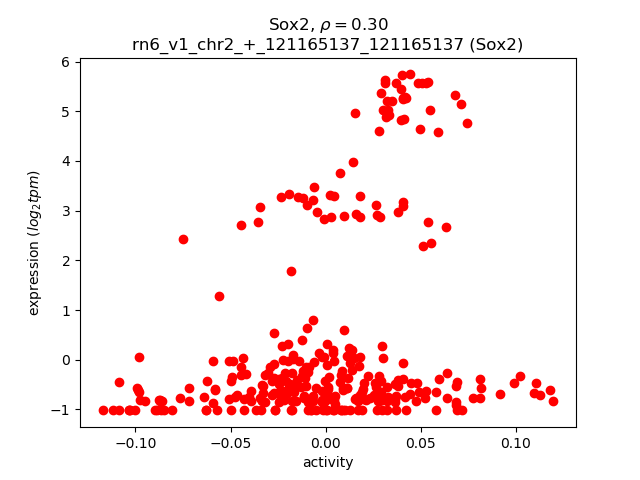
Activity-expression correlation:
| Gene | Promoter | Pearson corr. coef. | P-value | Plot |
|---|---|---|---|---|
| Sox2 | rn6_v1_chr2_+_121165137_121165137 | 0.30 | 3.0e-08 | Click! |
Activity profile of Sox2 motif
Sorted Z-values of Sox2 motif
| Promoter | Log-likelihood | Transcript | Gene | Gene Info |
|---|---|---|---|---|
| chr10_+_45289741 | 44.84 |
ENSRNOT00000066190
|
Hist3h2ba
|
histone cluster 3, H2ba |
| chr5_+_64326733 | 36.24 |
ENSRNOT00000065775
|
Tmeff1
|
transmembrane protein with EGF-like and two follistatin-like domains 1 |
| chr5_-_48165317 | 35.28 |
ENSRNOT00000088179
|
Ankrd6
|
ankyrin repeat domain 6 |
| chr9_-_61810417 | 32.01 |
ENSRNOT00000020910
|
Rftn2
|
raftlin family member 2 |
| chr18_+_79406381 | 28.40 |
ENSRNOT00000022303
ENSRNOT00000058295 ENSRNOT00000058296 ENSRNOT00000022280 |
Mbp
|
myelin basic protein |
| chr17_+_9679628 | 28.18 |
ENSRNOT00000019569
ENSRNOT00000019393 |
Dbn1
|
drebrin 1 |
| chr18_+_30562178 | 26.96 |
ENSRNOT00000040998
|
LOC108348771
|
protocadherin beta-16-like |
| chr16_+_22250470 | 24.68 |
ENSRNOT00000015799
|
Lzts1
|
leucine zipper tumor suppressor 1 |
| chr5_+_152681101 | 24.31 |
ENSRNOT00000076052
ENSRNOT00000022574 |
Stmn1
|
stathmin 1 |
| chr11_+_86512797 | 24.30 |
ENSRNOT00000051680
|
Gp1bb
|
glycoprotein Ib platelet beta subunit |
| chr8_+_128824508 | 23.68 |
ENSRNOT00000025343
|
Mobp
|
myelin-associated oligodendrocyte basic protein |
| chr6_-_147172022 | 22.45 |
ENSRNOT00000080675
|
Itgb8
|
integrin subunit beta 8 |
| chr1_+_101214593 | 21.46 |
ENSRNOT00000028086
|
Tead2
|
TEA domain transcription factor 2 |
| chr1_+_142679345 | 21.37 |
ENSRNOT00000034267
|
Zscan2
|
zinc finger and SCAN domain containing 2 |
| chr18_-_26211445 | 21.32 |
ENSRNOT00000027739
|
Nrep
|
neuronal regeneration related protein |
| chr13_-_95250235 | 21.18 |
ENSRNOT00000085648
|
Akt3
|
AKT serine/threonine kinase 3 |
| chr16_-_39476025 | 21.13 |
ENSRNOT00000014312
|
Gpm6a
|
glycoprotein m6a |
| chr8_+_60709851 | 20.98 |
ENSRNOT00000021817
|
Rcn2
|
reticulocalbin 2 |
| chr12_+_28381982 | 20.79 |
ENSRNOT00000076101
|
Wbscr17
|
Williams-Beuren syndrome chromosome region 17 |
| chr14_+_77380262 | 20.65 |
ENSRNOT00000008030
|
Nsg1
|
neuron specific gene family member 1 |
| chr20_+_42966140 | 20.50 |
ENSRNOT00000000707
|
Marcks
|
myristoylated alanine rich protein kinase C substrate |
| chr1_+_40816107 | 20.43 |
ENSRNOT00000060767
|
Akap12
|
A-kinase anchoring protein 12 |
| chrX_+_105134498 | 19.94 |
ENSRNOT00000002058
|
Tmem35
|
transmembrane protein 35 |
| chrX_-_115175299 | 19.88 |
ENSRNOT00000074322
|
Dcx
|
doublecortin |
| chr2_-_57935334 | 19.71 |
ENSRNOT00000022319
ENSRNOT00000085599 ENSRNOT00000077790 ENSRNOT00000035821 |
Slc1a3
|
solute carrier family 1 member 3 |
| chr5_+_127404450 | 19.20 |
ENSRNOT00000017575
|
Lrp8
|
LDL receptor related protein 8 |
| chr1_+_264059374 | 19.02 |
ENSRNOT00000075397
|
Scd2
|
stearoyl-Coenzyme A desaturase 2 |
| chr4_-_64330996 | 18.92 |
ENSRNOT00000016088
|
Ptn
|
pleiotrophin |
| chr20_+_44521279 | 18.83 |
ENSRNOT00000085987
|
Fyn
|
FYN proto-oncogene, Src family tyrosine kinase |
| chr14_+_71542057 | 18.71 |
ENSRNOT00000082592
ENSRNOT00000083701 ENSRNOT00000084322 |
Prom1
|
prominin 1 |
| chr10_-_94352880 | 18.35 |
ENSRNOT00000035973
|
Limd2
|
LIM domain containing 2 |
| chr1_-_48825364 | 18.30 |
ENSRNOT00000024213
|
Agpat4
|
1-acylglycerol-3-phosphate O-acyltransferase 4 |
| chr17_+_47721977 | 18.25 |
ENSRNOT00000080800
|
LOC100910792
|
amphiphysin-like |
| chr1_+_78800754 | 18.07 |
ENSRNOT00000084601
|
Dact3
|
dishevelled-binding antagonist of beta-catenin 3 |
| chr1_+_72860218 | 17.92 |
ENSRNOT00000024547
|
Syt5
|
synaptotagmin 5 |
| chr1_-_146556171 | 17.66 |
ENSRNOT00000017636
|
Arnt2
|
aryl hydrocarbon receptor nuclear translocator 2 |
| chr12_+_27155587 | 17.37 |
ENSRNOT00000044800
|
AABR07035916.1
|
|
| chr2_-_29768750 | 17.29 |
ENSRNOT00000023460
|
Map1b
|
microtubule-associated protein 1B |
| chr18_+_30435119 | 17.29 |
ENSRNOT00000027190
|
Pcdhb8
|
protocadherin beta 8 |
| chr2_-_18531210 | 17.23 |
ENSRNOT00000088313
|
Vcan
|
versican |
| chr5_+_152680407 | 17.08 |
ENSRNOT00000076864
|
Stmn1
|
stathmin 1 |
| chr5_+_49311030 | 17.04 |
ENSRNOT00000010850
|
Cnr1
|
cannabinoid receptor 1 |
| chr3_+_35014538 | 16.77 |
ENSRNOT00000006341
|
Kif5c
|
kinesin family member 5C |
| chr5_+_147714163 | 16.74 |
ENSRNOT00000012663
|
Marcksl1
|
MARCKS-like 1 |
| chr7_-_12275609 | 16.74 |
ENSRNOT00000086061
|
Apc2
|
APC2, WNT signaling pathway regulator |
| chr6_-_147172813 | 16.60 |
ENSRNOT00000066545
|
Itgb8
|
integrin subunit beta 8 |
| chr10_-_4644570 | 16.40 |
ENSRNOT00000088279
|
Snn
|
stannin |
| chr19_+_56220755 | 16.27 |
ENSRNOT00000023452
|
Tubb3
|
tubulin, beta 3 class III |
| chr8_-_62987182 | 16.13 |
ENSRNOT00000070885
|
Islr2
|
immunoglobulin superfamily containing leucine-rich repeat 2 |
| chr6_+_44009872 | 16.12 |
ENSRNOT00000082657
|
Mboat2
|
membrane bound O-acyltransferase domain containing 2 |
| chr14_-_78308933 | 16.11 |
ENSRNOT00000065334
|
Crmp1
|
collapsin response mediator protein 1 |
| chr9_-_100253609 | 15.93 |
ENSRNOT00000036061
|
Kif1a
|
kinesin family member 1A |
| chr10_-_56167426 | 15.90 |
ENSRNOT00000013955
|
Efnb3
|
ephrin B3 |
| chr12_+_48316143 | 15.90 |
ENSRNOT00000084511
|
Svop
|
SV2 related protein |
| chr12_+_25173005 | 15.81 |
ENSRNOT00000033200
ENSRNOT00000091328 |
Clip2
|
CAP-GLY domain containing linker protein 2 |
| chr1_-_47213749 | 15.73 |
ENSRNOT00000024656
|
Dynlt1
|
dynein light chain Tctex-type 1 |
| chr19_+_22450030 | 15.69 |
ENSRNOT00000021739
|
Neto2
|
neuropilin and tolloid like 2 |
| chr3_+_161121697 | 15.64 |
ENSRNOT00000036020
|
Wfdc10a
|
WAP four-disulfide core domain 10A |
| chr20_+_46199981 | 15.48 |
ENSRNOT00000000337
|
Mical1
|
microtubule associated monooxygenase, calponin and LIM domain containing 1 |
| chr13_-_107831014 | 15.42 |
ENSRNOT00000003684
|
Kcnk2
|
potassium two pore domain channel subfamily K member 2 |
| chr3_-_168018410 | 15.29 |
ENSRNOT00000087579
|
Bcas1
|
breast carcinoma amplified sequence 1 |
| chr4_-_119131202 | 15.03 |
ENSRNOT00000011675
|
Antxr1
|
anthrax toxin receptor 1 |
| chr4_+_29535852 | 14.94 |
ENSRNOT00000087619
|
NEWGENE_621351
|
collagen, type I, alpha 2 |
| chr7_+_110031696 | 14.93 |
ENSRNOT00000012753
|
Khdrbs3
|
KH RNA binding domain containing, signal transduction associated 3 |
| chrX_+_28593405 | 14.92 |
ENSRNOT00000071708
|
Tmsb4x
|
thymosin beta 4, X-linked |
| chr13_-_72063347 | 14.91 |
ENSRNOT00000090544
ENSRNOT00000003869 |
Cacna1e
|
calcium voltage-gated channel subunit alpha1 E |
| chr9_-_17866927 | 14.89 |
ENSRNOT00000027031
|
Tcte1
|
t-complex-associated testis expressed 1 |
| chr10_-_107386072 | 14.85 |
ENSRNOT00000004290
|
Timp2
|
TIMP metallopeptidase inhibitor 2 |
| chr6_+_132510757 | 14.79 |
ENSRNOT00000080230
|
Evl
|
Enah/Vasp-like |
| chr18_+_15467870 | 14.76 |
ENSRNOT00000091696
|
B4galt6
|
beta-1,4-galactosyltransferase 6 |
| chr8_-_39460844 | 14.60 |
ENSRNOT00000048875
|
Pknox2
|
PBX/knotted 1 homeobox 2 |
| chr11_+_73738433 | 14.56 |
ENSRNOT00000002353
|
Tmem44
|
transmembrane protein 44 |
| chr4_-_108008484 | 14.43 |
ENSRNOT00000007971
|
Ctnna2
|
catenin alpha 2 |
| chr19_-_9801942 | 14.37 |
ENSRNOT00000051414
ENSRNOT00000017494 |
Ndrg4
|
NDRG family member 4 |
| chr3_+_131351587 | 14.36 |
ENSRNOT00000010835
|
Btbd3
|
BTB domain containing 3 |
| chr7_-_136853957 | 14.24 |
ENSRNOT00000008985
|
Nell2
|
neural EGFL like 2 |
| chr3_-_3747440 | 14.06 |
ENSRNOT00000036178
|
Ccdc187
|
coiled-coil domain containing 187 |
| chr10_+_31146107 | 13.82 |
ENSRNOT00000008184
|
Adam19
|
ADAM metallopeptidase domain 19 |
| chr7_-_144837583 | 13.77 |
ENSRNOT00000055289
|
Cbx5
|
chromobox 5 |
| chrX_+_62727755 | 13.67 |
ENSRNOT00000077055
|
Pcyt1b
|
phosphate cytidylyltransferase 1, choline, beta |
| chr7_-_64251110 | 13.67 |
ENSRNOT00000006180
|
Srgap1
|
SLIT-ROBO Rho GTPase activating protein 1 |
| chr3_-_51643140 | 13.59 |
ENSRNOT00000006646
|
Scn3a
|
sodium voltage-gated channel alpha subunit 3 |
| chr2_-_88414012 | 13.44 |
ENSRNOT00000014762
|
Lrrcc1
|
leucine rich repeat and coiled-coil centrosomal protein 1 |
| chr15_-_44411004 | 13.40 |
ENSRNOT00000031163
|
Cdca2
|
cell division cycle associated 2 |
| chr1_+_100447998 | 13.28 |
ENSRNOT00000026259
|
Lrrc4b
|
leucine rich repeat containing 4B |
| chr12_-_33016885 | 13.28 |
ENSRNOT00000048474
|
Tmem132c
|
transmembrane protein 132C |
| chr4_+_160455986 | 13.28 |
ENSRNOT00000087834
|
Tspan11
|
tetraspanin 11 |
| chr5_+_18901039 | 13.27 |
ENSRNOT00000012066
|
Fam110b
|
family with sequence similarity 110, member B |
| chr8_-_30222036 | 13.18 |
ENSRNOT00000035454
|
Ntm
|
neurotrimin |
| chr12_-_13668515 | 13.08 |
ENSRNOT00000086847
|
Fscn1
|
fascin actin-bundling protein 1 |
| chr20_+_3553455 | 12.94 |
ENSRNOT00000090080
|
Ddr1
|
discoidin domain receptor tyrosine kinase 1 |
| chr13_-_100405339 | 12.83 |
ENSRNOT00000039974
|
Enah
|
enabled homolog (Drosophila) |
| chr3_+_139695028 | 12.75 |
ENSRNOT00000089098
|
Slc24a3
|
solute carrier family 24 member 3 |
| chr18_+_27424328 | 12.72 |
ENSRNOT00000033784
|
Kif20a
|
kinesin family member 20A |
| chr4_+_77623538 | 12.63 |
ENSRNOT00000059263
|
Zfp956
|
zinc finger protein 956 |
| chr18_+_30574627 | 12.54 |
ENSRNOT00000060484
|
Pcdhb19
|
protocadherin beta 19 |
| chr3_-_123849788 | 12.49 |
ENSRNOT00000028869
|
Rnf24
|
ring finger protein 24 |
| chr12_-_21746236 | 12.49 |
ENSRNOT00000001869
|
LOC102550456
|
TSC22 domain family protein 4-like |
| chr2_-_23909016 | 12.39 |
ENSRNOT00000084044
|
Scamp1
|
secretory carrier membrane protein 1 |
| chr18_+_53915807 | 12.33 |
ENSRNOT00000026543
|
Adamts19
|
ADAM metallopeptidase with thrombospondin type 1 motif, 19 |
| chr2_-_139528162 | 12.24 |
ENSRNOT00000014317
|
Slc7a11
|
solute carrier family 7 member 11 |
| chrX_-_123662350 | 12.21 |
ENSRNOT00000092624
|
Sept6
|
septin 6 |
| chr5_-_1347921 | 12.04 |
ENSRNOT00000007994
|
Gdap1
|
ganglioside-induced differentiation-associated-protein 1 |
| chr2_+_187893875 | 12.04 |
ENSRNOT00000093014
|
Mex3a
|
mex-3 RNA binding family member A |
| chr1_-_190914610 | 12.00 |
ENSRNOT00000023189
|
Cdr2
|
cerebellar degeneration-related protein 2 |
| chr9_+_2202511 | 11.97 |
ENSRNOT00000017556
|
Satb1
|
SATB homeobox 1 |
| chrX_+_6791136 | 11.96 |
ENSRNOT00000003984
|
LOC100909913
|
norrin-like |
| chr1_+_277689729 | 11.96 |
ENSRNOT00000051834
|
Vwa2
|
von Willebrand factor A domain containing 2 |
| chr20_+_3552929 | 11.95 |
ENSRNOT00000083223
|
Ddr1
|
discoidin domain receptor tyrosine kinase 1 |
| chrX_-_63999622 | 11.81 |
ENSRNOT00000090902
|
LOC103694487
|
protein gar2-like |
| chr1_-_170404056 | 11.70 |
ENSRNOT00000024402
|
Apbb1
|
amyloid beta precursor protein binding family B member 1 |
| chr5_+_62840360 | 11.66 |
ENSRNOT00000088385
|
Col15a1
|
collagen type XV alpha 1 chain |
| chr6_+_109710781 | 11.57 |
ENSRNOT00000012895
|
Ttll5
|
tubulin tyrosine ligase like 5 |
| chr14_+_83560541 | 11.57 |
ENSRNOT00000057738
ENSRNOT00000085228 |
Pik3ip1
|
phosphoinositide-3-kinase interacting protein 1 |
| chr2_-_223322585 | 11.49 |
ENSRNOT00000015036
|
Ptbp2
|
polypyrimidine tract binding protein 2 |
| chr12_+_2534212 | 11.43 |
ENSRNOT00000001399
|
Ctxn1
|
cortexin 1 |
| chr10_-_85974644 | 11.41 |
ENSRNOT00000006098
ENSRNOT00000082974 |
Cacnb1
|
calcium voltage-gated channel auxiliary subunit beta 1 |
| chr2_+_188528979 | 11.40 |
ENSRNOT00000087934
|
Thbs3
|
thrombospondin 3 |
| chr5_+_104362971 | 11.37 |
ENSRNOT00000058520
|
Adamtsl1
|
ADAMTS-like 1 |
| chr6_-_39363367 | 11.33 |
ENSRNOT00000088687
ENSRNOT00000065531 |
Fam84a
|
family with sequence similarity 84, member A |
| chr6_+_100337226 | 11.32 |
ENSRNOT00000011220
|
Fut8
|
fucosyltransferase 8 |
| chr17_+_75190783 | 11.22 |
ENSRNOT00000085840
|
AABR07028568.1
|
|
| chr17_-_15566332 | 11.12 |
ENSRNOT00000093743
|
Ecm2
|
extracellular matrix protein 2 |
| chr8_-_66893083 | 11.06 |
ENSRNOT00000037028
ENSRNOT00000091755 |
Kif23
|
kinesin family member 23 |
| chr9_+_9961021 | 11.01 |
ENSRNOT00000075767
|
Tubb4a
|
tubulin, beta 4A class IVa |
| chr8_+_62925357 | 10.98 |
ENSRNOT00000011074
ENSRNOT00000090588 |
Stra6
|
stimulated by retinoic acid 6 |
| chr18_+_30904498 | 10.90 |
ENSRNOT00000026969
|
Pcdhga11
|
protocadherin gamma subfamily A, 11 |
| chr5_+_139468546 | 10.90 |
ENSRNOT00000013193
|
Slfnl1
|
schlafen-like 1 |
| chr7_-_140640953 | 10.88 |
ENSRNOT00000083156
|
Tuba1a
|
tubulin, alpha 1A |
| chr15_-_6587367 | 10.81 |
ENSRNOT00000038449
|
Zfp385d
|
zinc finger protein 385D |
| chr7_-_116607674 | 10.80 |
ENSRNOT00000076014
|
Ly6h
|
lymphocyte antigen 6 complex, locus H |
| chr3_-_124610267 | 10.74 |
ENSRNOT00000028883
|
Rassf2
|
Ras association domain family member 2 |
| chr3_+_129599353 | 10.69 |
ENSRNOT00000008734
|
Snap25
|
synaptosomal-associated protein 25 |
| chrX_-_134866210 | 10.61 |
ENSRNOT00000005331
|
Apln
|
apelin |
| chr10_-_56511583 | 10.60 |
ENSRNOT00000021402
|
LOC497940
|
similar to RIKEN cDNA 2810408A11 |
| chr9_+_46657922 | 10.58 |
ENSRNOT00000019180
|
Map4k4
|
mitogen-activated protein kinase kinase kinase kinase 4 |
| chr2_-_165641573 | 10.54 |
ENSRNOT00000013987
|
Trim59
|
tripartite motif-containing 59 |
| chr7_-_70577147 | 10.47 |
ENSRNOT00000008854
|
Mbd6
|
methyl-CpG binding domain protein 6 |
| chr18_-_55771730 | 10.41 |
ENSRNOT00000026426
|
Smim3
|
small integral membrane protein 3 |
| chr18_+_30909490 | 10.39 |
ENSRNOT00000026967
|
Pcdhgb8
|
protocadherin gamma subfamily B, 8 |
| chr1_+_78876205 | 10.38 |
ENSRNOT00000022610
|
Pnmal2
|
paraneoplastic Ma antigen family-like 2 |
| chr13_-_113817995 | 10.38 |
ENSRNOT00000057151
|
Cd46
|
CD46 molecule |
| chr1_+_211582077 | 10.31 |
ENSRNOT00000023619
|
Pwwp2b
|
PWWP domain containing 2B |
| chr10_-_15155412 | 10.29 |
ENSRNOT00000026536
|
Haghl
|
hydroxyacylglutathione hydrolase-like |
| chr8_-_60830448 | 10.24 |
ENSRNOT00000022419
|
Tspan3
|
tetraspanin 3 |
| chr12_-_12712742 | 10.22 |
ENSRNOT00000034483
|
Rsph10b
|
radial spoke head 10 homolog B |
| chr4_-_83972540 | 10.19 |
ENSRNOT00000036951
|
Tril
|
TLR4 interactor with leucine-rich repeats |
| chr3_+_153580861 | 10.18 |
ENSRNOT00000080516
ENSRNOT00000012739 |
Src
|
SRC proto-oncogene, non-receptor tyrosine kinase |
| chr15_+_40665041 | 10.11 |
ENSRNOT00000018300
|
Amer2
|
APC membrane recruitment protein 2 |
| chr18_-_16543992 | 10.09 |
ENSRNOT00000036306
|
Slc39a6
|
solute carrier family 39 member 6 |
| chr4_-_11497531 | 10.08 |
ENSRNOT00000078799
|
Magi2
|
membrane associated guanylate kinase, WW and PDZ domain containing 2 |
| chr14_-_84106997 | 10.05 |
ENSRNOT00000065501
|
Osbp2
|
oxysterol binding protein 2 |
| chr16_+_74752655 | 9.99 |
ENSRNOT00000029266
|
Ckap2
|
cytoskeleton associated protein 2 |
| chr7_-_136853154 | 9.99 |
ENSRNOT00000087376
|
Nell2
|
neural EGFL like 2 |
| chr10_+_62674561 | 9.99 |
ENSRNOT00000019946
ENSRNOT00000056110 |
Ankrd13b
|
ankyrin repeat domain 13B |
| chr4_-_157304653 | 9.98 |
ENSRNOT00000051613
|
Lrrc23
|
leucine rich repeat containing 23 |
| chr17_-_77687456 | 9.96 |
ENSRNOT00000045765
ENSRNOT00000081645 |
Frmd4a
|
FERM domain containing 4A |
| chr2_+_220298245 | 9.89 |
ENSRNOT00000022625
|
Plppr4
|
phospholipid phosphatase related 4 |
| chr3_-_46457201 | 9.85 |
ENSRNOT00000010683
|
Ly75
|
lymphocyte antigen 75 |
| chr6_+_110624856 | 9.82 |
ENSRNOT00000014017
|
Vash1
|
vasohibin 1 |
| chr6_-_94980004 | 9.78 |
ENSRNOT00000006373
|
Rtn1
|
reticulon 1 |
| chr1_-_81881549 | 9.76 |
ENSRNOT00000027497
|
Atp1a3
|
ATPase Na+/K+ transporting subunit alpha 3 |
| chr3_+_155160481 | 9.74 |
ENSRNOT00000021133
|
Ppp1r16b
|
protein phosphatase 1, regulatory subunit 16B |
| chr10_-_56429748 | 9.72 |
ENSRNOT00000020675
ENSRNOT00000092704 |
Spem1
|
spermatid maturation 1 |
| chr7_-_83670356 | 9.72 |
ENSRNOT00000005584
|
Sybu
|
syntabulin |
| chr12_-_8156151 | 9.71 |
ENSRNOT00000064721
|
Mtus2
|
microtubule associated tumor suppressor candidate 2 |
| chrX_-_68562301 | 9.68 |
ENSRNOT00000076720
|
Ophn1
|
oligophrenin 1 |
| chr11_-_87017115 | 9.68 |
ENSRNOT00000051037
|
Rtn4r
|
reticulon 4 receptor |
| chr7_+_141355994 | 9.66 |
ENSRNOT00000081195
|
Smarcd1
|
SWI/SNF related, matrix associated, actin dependent regulator of chromatin, subfamily d, member 1 |
| chr4_-_100883038 | 9.65 |
ENSRNOT00000041880
|
LOC100364435
|
thymosin, beta 10-like |
| chr3_-_10602672 | 9.64 |
ENSRNOT00000011648
|
Ncs1
|
neuronal calcium sensor 1 |
| chr7_+_141702038 | 9.64 |
ENSRNOT00000086577
|
Dip2b
|
disco-interacting protein 2 homolog B |
| chr4_+_44321883 | 9.61 |
ENSRNOT00000091095
|
Tes
|
testin LIM domain protein |
| chr6_+_43884678 | 9.58 |
ENSRNOT00000091551
|
Rrm2
|
ribonucleotide reductase regulatory subunit M2 |
| chr7_-_15852930 | 9.56 |
ENSRNOT00000009270
|
LOC691422
|
similar to zinc finger protein 101 |
| chr8_+_23113048 | 9.52 |
ENSRNOT00000029577
|
Cnn1
|
calponin 1 |
| chr7_+_140315368 | 9.51 |
ENSRNOT00000081206
|
Cacnb3
|
calcium voltage-gated channel auxiliary subunit beta 3 |
| chr18_+_30900291 | 9.50 |
ENSRNOT00000060461
|
Pcdhgb7
|
protocadherin gamma subfamily B, 7 |
| chr18_-_74485139 | 9.49 |
ENSRNOT00000022598
|
Slc14a1
|
solute carrier family 14 member 1 |
| chrX_+_70563570 | 9.49 |
ENSRNOT00000003772
|
Gdpd2
|
glycerophosphodiester phosphodiesterase domain containing 2 |
| chr11_+_32440237 | 9.47 |
ENSRNOT00000040844
|
Kcne2
|
potassium voltage-gated channel subfamily E regulatory subunit 2 |
| chr1_-_140262452 | 9.45 |
ENSRNOT00000046849
ENSRNOT00000045165 ENSRNOT00000025536 ENSRNOT00000041839 |
Ntrk3
|
neurotrophic receptor tyrosine kinase 3 |
| chr13_-_86451002 | 9.45 |
ENSRNOT00000043004
ENSRNOT00000027996 |
Pbx1
|
PBX homeobox 1 |
| chr18_+_29993361 | 9.43 |
ENSRNOT00000075810
|
Pcdha4
|
protocadherin alpha 4 |
| chr20_+_3351303 | 9.37 |
ENSRNOT00000080419
ENSRNOT00000001065 ENSRNOT00000086503 |
Atat1
|
alpha tubulin acetyltransferase 1 |
| chr18_+_30381322 | 9.36 |
ENSRNOT00000027216
|
Pcdhb3
|
protocadherin beta 3 |
| chr6_+_147876557 | 9.35 |
ENSRNOT00000080090
|
Tmem196
|
transmembrane protein 196 |
| chr9_+_20241062 | 9.33 |
ENSRNOT00000071593
|
LOC100911585
|
leucine-rich repeat-containing protein 23-like |
| chr2_-_96520137 | 9.32 |
ENSRNOT00000066966
|
Zc2hc1a
|
zinc finger, C2HC-type containing 1A |
| chr1_-_228753422 | 9.32 |
ENSRNOT00000028626
|
Dtx4
|
deltex E3 ubiquitin ligase 4 |
| chr3_+_176102351 | 9.31 |
ENSRNOT00000013105
|
Col9a3
|
collagen type IX alpha 3 chain |
| chr20_+_5049496 | 9.28 |
ENSRNOT00000088251
ENSRNOT00000001118 |
Ddah2
|
dimethylarginine dimethylaminohydrolase 2 |
| chr11_+_42936028 | 9.24 |
ENSRNOT00000074653
|
AABR07033887.1
|
|
| chr8_+_64440214 | 9.22 |
ENSRNOT00000058339
|
Parp6
|
poly (ADP-ribose) polymerase family, member 6 |
| chr1_+_144831523 | 9.22 |
ENSRNOT00000039748
|
Mex3b
|
mex-3 RNA binding family member B |
| chr14_-_72025137 | 9.19 |
ENSRNOT00000080604
|
C1qtnf7
|
C1q and tumor necrosis factor related protein 7 |
| chr15_+_41448064 | 9.15 |
ENSRNOT00000019551
|
Sacs
|
sacsin molecular chaperone |
| chr9_+_82741920 | 9.14 |
ENSRNOT00000027337
|
Slc4a3
|
solute carrier family 4 member 3 |
| chr11_-_36533073 | 9.13 |
ENSRNOT00000033486
|
Lca5l
|
LCA5L, lebercilin like |
| chr7_+_64672722 | 9.11 |
ENSRNOT00000064448
ENSRNOT00000005539 |
Grip1
|
glutamate receptor interacting protein 1 |
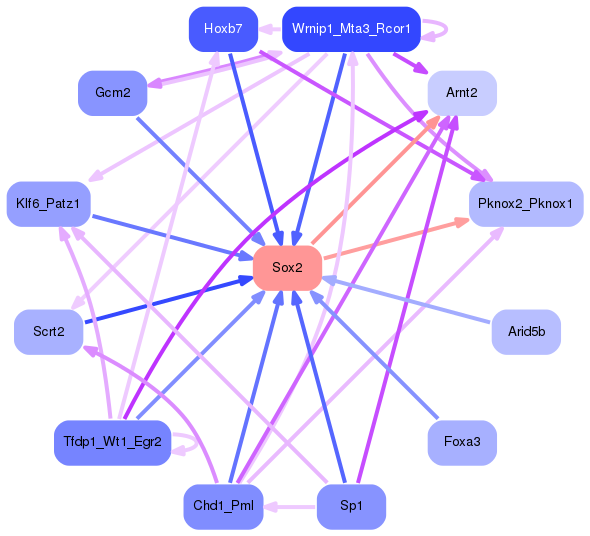
Network of associatons between targets according to the STRING database.

First level regulatory network of Sox2
Gene Ontology Analysis
Gene overrepresentation in biological process category:
| Log-likelihood per target | Total log-likelihood | Term | Description |
|---|---|---|---|
| 10.5 | 31.5 | GO:0010643 | cell communication by chemical coupling(GO:0010643) |
| 10.1 | 30.4 | GO:1904685 | regulation of chemokine (C-C motif) ligand 2 secretion(GO:1904207) positive regulation of chemokine (C-C motif) ligand 2 secretion(GO:1904209) positive regulation of metalloendopeptidase activity(GO:1904685) |
| 6.2 | 24.8 | GO:1904616 | regulation of actin filament binding(GO:1904529) regulation of actin binding(GO:1904616) |
| 6.2 | 24.7 | GO:0072139 | glomerular parietal epithelial cell differentiation(GO:0072139) |
| 5.9 | 23.6 | GO:0070495 | regulation of thrombin receptor signaling pathway(GO:0070494) negative regulation of thrombin receptor signaling pathway(GO:0070495) |
| 5.7 | 17.0 | GO:0099552 | trans-synaptic signaling by lipid, modulating synaptic transmission(GO:0099552) trans-synaptic signaling by endocannabinoid, modulating synaptic transmission(GO:0099553) |
| 5.5 | 27.3 | GO:0070777 | D-aspartate transport(GO:0070777) D-aspartate import(GO:0070779) |
| 5.2 | 15.5 | GO:0019417 | sulfur oxidation(GO:0019417) |
| 5.1 | 15.4 | GO:1900039 | positive regulation of cellular response to hypoxia(GO:1900039) |
| 5.0 | 35.3 | GO:2000096 | positive regulation of Wnt signaling pathway, planar cell polarity pathway(GO:2000096) |
| 4.8 | 28.7 | GO:0033227 | dsRNA transport(GO:0033227) |
| 4.8 | 19.0 | GO:1903966 | monounsaturated fatty acid metabolic process(GO:1903964) monounsaturated fatty acid biosynthetic process(GO:1903966) |
| 4.7 | 18.9 | GO:1904373 | retinal rod cell differentiation(GO:0060221) response to kainic acid(GO:1904373) |
| 4.5 | 13.4 | GO:0043382 | positive regulation of memory T cell differentiation(GO:0043382) |
| 4.5 | 13.4 | GO:2000312 | regulation of kainate selective glutamate receptor activity(GO:2000312) |
| 4.2 | 16.8 | GO:0098961 | dendritic transport of ribonucleoprotein complex(GO:0098961) dendritic transport of messenger ribonucleoprotein complex(GO:0098963) anterograde dendritic transport of messenger ribonucleoprotein complex(GO:0098964) |
| 4.0 | 11.9 | GO:0007161 | calcium-independent cell-matrix adhesion(GO:0007161) |
| 3.9 | 15.7 | GO:0019060 | intracellular transport of viral protein in host cell(GO:0019060) symbiont intracellular protein transport in host(GO:0030581) intracellular protein transport in other organism involved in symbiotic interaction(GO:0051708) |
| 3.9 | 11.6 | GO:0043553 | negative regulation of phosphatidylinositol 3-kinase activity(GO:0043553) |
| 3.8 | 3.8 | GO:0034724 | DNA replication-independent nucleosome organization(GO:0034724) |
| 3.7 | 11.0 | GO:0046865 | isoprenoid transport(GO:0046864) terpenoid transport(GO:0046865) |
| 3.6 | 25.1 | GO:1905049 | negative regulation of metallopeptidase activity(GO:1905049) |
| 3.6 | 10.7 | GO:1990926 | short-term synaptic potentiation(GO:1990926) |
| 3.5 | 3.5 | GO:0060857 | establishment of glial blood-brain barrier(GO:0060857) |
| 3.5 | 17.4 | GO:0051902 | negative regulation of mitochondrial depolarization(GO:0051902) |
| 3.4 | 20.7 | GO:0098887 | neurotransmitter receptor transport, endosome to postsynaptic membrane(GO:0098887) |
| 3.3 | 13.1 | GO:0030035 | microspike assembly(GO:0030035) |
| 3.2 | 9.7 | GO:1902309 | negative regulation of peptidyl-serine dephosphorylation(GO:1902309) regulation of blood vessel endothelial cell proliferation involved in sprouting angiogenesis(GO:1903587) |
| 3.2 | 34.8 | GO:0035414 | negative regulation of catenin import into nucleus(GO:0035414) |
| 3.2 | 9.5 | GO:1901979 | regulation of inward rectifier potassium channel activity(GO:1901979) |
| 3.1 | 18.8 | GO:1902951 | negative regulation of dendritic spine maintenance(GO:1902951) |
| 3.1 | 9.4 | GO:0071929 | alpha-tubulin acetylation(GO:0071929) |
| 3.1 | 15.4 | GO:1900620 | acetylcholine biosynthetic process(GO:0008292) acetate ester biosynthetic process(GO:1900620) |
| 3.0 | 15.0 | GO:0021827 | cerebral cortex tangential migration using cell-cell interactions(GO:0021823) postnatal olfactory bulb interneuron migration(GO:0021827) |
| 3.0 | 9.0 | GO:0060082 | eye blink reflex(GO:0060082) |
| 2.9 | 20.5 | GO:1900020 | regulation of protein kinase C activity(GO:1900019) positive regulation of protein kinase C activity(GO:1900020) |
| 2.8 | 11.3 | GO:0046368 | GDP-L-fucose metabolic process(GO:0046368) |
| 2.7 | 8.2 | GO:0070649 | formin-nucleated actin cable assembly(GO:0070649) |
| 2.7 | 10.6 | GO:0043397 | corticotropin-releasing hormone secretion(GO:0043396) regulation of corticotropin-releasing hormone secretion(GO:0043397) |
| 2.6 | 26.1 | GO:0006688 | glycosphingolipid biosynthetic process(GO:0006688) |
| 2.6 | 25.7 | GO:1901223 | negative regulation of NIK/NF-kappaB signaling(GO:1901223) |
| 2.5 | 7.5 | GO:0060697 | positive regulation of phospholipid catabolic process(GO:0060697) |
| 2.5 | 15.0 | GO:1905050 | positive regulation of metallopeptidase activity(GO:1905050) |
| 2.5 | 9.8 | GO:1901491 | negative regulation of lymphangiogenesis(GO:1901491) |
| 2.4 | 19.5 | GO:0090273 | regulation of somatostatin secretion(GO:0090273) |
| 2.4 | 7.3 | GO:0060490 | orthogonal dichotomous subdivision of terminal units involved in lung branching morphogenesis(GO:0060488) planar dichotomous subdivision of terminal units involved in lung branching morphogenesis(GO:0060489) lateral sprouting involved in lung morphogenesis(GO:0060490) |
| 2.4 | 26.7 | GO:0061302 | smooth muscle cell-matrix adhesion(GO:0061302) |
| 2.4 | 9.7 | GO:0038109 | Kit signaling pathway(GO:0038109) |
| 2.4 | 9.5 | GO:0048687 | positive regulation of sprouting of injured axon(GO:0048687) positive regulation of axon extension involved in regeneration(GO:0048691) |
| 2.4 | 7.1 | GO:0000912 | assembly of actomyosin apparatus involved in cytokinesis(GO:0000912) actomyosin contractile ring assembly(GO:0000915) actomyosin contractile ring organization(GO:0044837) |
| 2.3 | 7.0 | GO:1902103 | metaphase/anaphase transition of meiotic cell cycle(GO:0044785) regulation of metaphase/anaphase transition of meiotic cell cycle(GO:1902102) negative regulation of metaphase/anaphase transition of meiotic cell cycle(GO:1902103) regulation of meiotic chromosome separation(GO:1905132) negative regulation of meiotic chromosome separation(GO:1905133) |
| 2.3 | 9.2 | GO:0072697 | protein localization to cell cortex(GO:0072697) |
| 2.3 | 20.5 | GO:1904116 | response to vasopressin(GO:1904116) |
| 2.3 | 20.4 | GO:0010739 | positive regulation of protein kinase A signaling(GO:0010739) |
| 2.3 | 6.8 | GO:0071454 | cellular response to anoxia(GO:0071454) regulation of establishment of Sertoli cell barrier(GO:1904444) |
| 2.3 | 6.8 | GO:0060988 | lipid tube assembly(GO:0060988) |
| 2.3 | 9.0 | GO:0044313 | protein K6-linked deubiquitination(GO:0044313) |
| 2.2 | 6.7 | GO:1902268 | negative regulation of polyamine transmembrane transport(GO:1902268) |
| 2.2 | 24.2 | GO:0046543 | development of secondary female sexual characteristics(GO:0046543) |
| 2.2 | 8.7 | GO:0002032 | desensitization of G-protein coupled receptor protein signaling pathway by arrestin(GO:0002032) |
| 2.2 | 6.5 | GO:0048014 | Tie signaling pathway(GO:0048014) |
| 2.2 | 39.1 | GO:0001573 | ganglioside metabolic process(GO:0001573) |
| 2.2 | 4.3 | GO:0030997 | regulation of centriole-centriole cohesion(GO:0030997) |
| 2.1 | 10.3 | GO:0061727 | methylglyoxal catabolic process to D-lactate via S-lactoyl-glutathione(GO:0019243) methylglyoxal catabolic process(GO:0051596) methylglyoxal catabolic process to lactate(GO:0061727) |
| 2.0 | 10.2 | GO:0060282 | positive regulation of oocyte development(GO:0060282) |
| 2.0 | 18.3 | GO:0016024 | CDP-diacylglycerol biosynthetic process(GO:0016024) |
| 1.9 | 5.8 | GO:0051037 | regulation of transcription involved in meiotic cell cycle(GO:0051037) |
| 1.9 | 5.7 | GO:0052572 | response to immune response of other organism involved in symbiotic interaction(GO:0052564) response to host immune response(GO:0052572) |
| 1.9 | 7.5 | GO:0060729 | intestinal epithelial structure maintenance(GO:0060729) |
| 1.9 | 5.6 | GO:0018201 | peptidyl-glycine modification(GO:0018201) |
| 1.9 | 5.6 | GO:0002572 | pro-T cell differentiation(GO:0002572) |
| 1.9 | 5.6 | GO:2000078 | positive regulation of type B pancreatic cell development(GO:2000078) |
| 1.9 | 5.6 | GO:0015891 | iron chelate transport(GO:0015688) siderophore transport(GO:0015891) |
| 1.8 | 24.0 | GO:0061162 | establishment of monopolar cell polarity(GO:0061162) |
| 1.8 | 14.6 | GO:0021942 | radial glia guided migration of Purkinje cell(GO:0021942) |
| 1.8 | 5.4 | GO:0003322 | pancreatic A cell development(GO:0003322) forebrain-midbrain boundary formation(GO:0021905) somatic motor neuron fate commitment(GO:0021917) regulation of transcription from RNA polymerase II promoter involved in somatic motor neuron fate commitment(GO:0021918) sensory neuron migration(GO:1904937) |
| 1.8 | 8.9 | GO:0060373 | regulation of ventricular cardiac muscle cell membrane depolarization(GO:0060373) |
| 1.8 | 15.9 | GO:0016198 | axon choice point recognition(GO:0016198) |
| 1.7 | 5.2 | GO:0046103 | inosine biosynthetic process(GO:0046103) |
| 1.7 | 3.5 | GO:2000974 | negative regulation of pro-B cell differentiation(GO:2000974) |
| 1.7 | 5.2 | GO:0090027 | negative regulation of monocyte chemotaxis(GO:0090027) |
| 1.7 | 36.4 | GO:0021819 | layer formation in cerebral cortex(GO:0021819) |
| 1.7 | 6.9 | GO:0032696 | negative regulation of interleukin-13 production(GO:0032696) |
| 1.7 | 20.6 | GO:1900028 | negative regulation of ruffle assembly(GO:1900028) |
| 1.7 | 8.3 | GO:0000727 | double-strand break repair via break-induced replication(GO:0000727) |
| 1.7 | 3.3 | GO:0035425 | autocrine signaling(GO:0035425) |
| 1.7 | 5.0 | GO:0014908 | myotube differentiation involved in skeletal muscle regeneration(GO:0014908) |
| 1.7 | 6.6 | GO:0060354 | negative regulation of cell adhesion molecule production(GO:0060354) |
| 1.6 | 4.9 | GO:0060392 | negative regulation of SMAD protein import into nucleus(GO:0060392) |
| 1.6 | 8.2 | GO:0019371 | cyclooxygenase pathway(GO:0019371) |
| 1.6 | 21.1 | GO:0051013 | microtubule severing(GO:0051013) |
| 1.6 | 9.7 | GO:0023041 | neuronal signal transduction(GO:0023041) |
| 1.6 | 12.9 | GO:2001135 | regulation of endocytic recycling(GO:2001135) |
| 1.6 | 9.5 | GO:0071918 | urea transmembrane transport(GO:0071918) |
| 1.6 | 15.8 | GO:0036376 | sodium ion export from cell(GO:0036376) |
| 1.5 | 6.2 | GO:0090234 | regulation of kinetochore assembly(GO:0090234) |
| 1.5 | 3.1 | GO:0006438 | valyl-tRNA aminoacylation(GO:0006438) |
| 1.5 | 6.1 | GO:0061084 | negative regulation of protein refolding(GO:0061084) |
| 1.5 | 7.4 | GO:0099566 | regulation of postsynaptic cytosolic calcium ion concentration(GO:0099566) |
| 1.5 | 10.4 | GO:0060287 | epithelial cilium movement involved in determination of left/right asymmetry(GO:0060287) |
| 1.4 | 4.3 | GO:0046038 | guanine salvage(GO:0006178) GMP catabolic process(GO:0046038) guanine biosynthetic process(GO:0046099) |
| 1.4 | 11.6 | GO:0018095 | protein polyglutamylation(GO:0018095) |
| 1.4 | 4.3 | GO:0072156 | distal tubule morphogenesis(GO:0072156) |
| 1.4 | 7.2 | GO:2000327 | positive regulation of ligand-dependent nuclear receptor transcription coactivator activity(GO:2000327) |
| 1.4 | 4.3 | GO:0018199 | peptidyl-glutamine modification(GO:0018199) |
| 1.4 | 20.0 | GO:0061179 | negative regulation of insulin secretion involved in cellular response to glucose stimulus(GO:0061179) |
| 1.4 | 4.3 | GO:0048143 | astrocyte activation(GO:0048143) |
| 1.4 | 5.7 | GO:0042091 | interleukin-10 biosynthetic process(GO:0042091) regulation of interleukin-10 biosynthetic process(GO:0045074) |
| 1.4 | 12.7 | GO:0098903 | regulation of membrane repolarization during action potential(GO:0098903) |
| 1.4 | 16.8 | GO:0043374 | CD8-positive, alpha-beta T cell differentiation(GO:0043374) |
| 1.4 | 2.8 | GO:0048105 | establishment of body hair or bristle planar orientation(GO:0048104) establishment of body hair planar orientation(GO:0048105) |
| 1.4 | 5.5 | GO:0060414 | aorta smooth muscle tissue morphogenesis(GO:0060414) |
| 1.4 | 9.7 | GO:0048096 | chromatin-mediated maintenance of transcription(GO:0048096) |
| 1.4 | 2.7 | GO:0042631 | cellular response to water deprivation(GO:0042631) |
| 1.3 | 5.3 | GO:0000414 | regulation of histone H3-K36 methylation(GO:0000414) |
| 1.3 | 5.3 | GO:0051643 | endoplasmic reticulum localization(GO:0051643) |
| 1.3 | 5.3 | GO:0021747 | cochlear nucleus development(GO:0021747) |
| 1.3 | 9.1 | GO:2000002 | negative regulation of DNA damage checkpoint(GO:2000002) |
| 1.3 | 2.6 | GO:0042323 | negative regulation of circadian sleep/wake cycle, non-REM sleep(GO:0042323) negative regulation of mucus secretion(GO:0070256) |
| 1.3 | 5.2 | GO:0010641 | positive regulation of platelet-derived growth factor receptor signaling pathway(GO:0010641) |
| 1.3 | 3.9 | GO:1903553 | positive regulation of extracellular exosome assembly(GO:1903553) |
| 1.3 | 7.7 | GO:1904263 | positive regulation of TORC1 signaling(GO:1904263) |
| 1.3 | 6.3 | GO:1990573 | potassium ion import across plasma membrane(GO:1990573) |
| 1.2 | 3.7 | GO:0072137 | mitral valve formation(GO:0003192) condensed mesenchymal cell proliferation(GO:0072137) |
| 1.2 | 8.7 | GO:0008065 | establishment of blood-nerve barrier(GO:0008065) |
| 1.2 | 3.7 | GO:0072720 | response to dithiothreitol(GO:0072720) |
| 1.2 | 6.2 | GO:0044691 | tooth eruption(GO:0044691) |
| 1.2 | 4.9 | GO:0072658 | positive regulation of cell communication by electrical coupling(GO:0010650) maintenance of protein location in membrane(GO:0072658) maintenance of protein location in plasma membrane(GO:0072660) positive regulation of membrane depolarization during cardiac muscle cell action potential(GO:1900827) |
| 1.2 | 4.9 | GO:1904158 | axonemal central apparatus assembly(GO:1904158) |
| 1.2 | 3.7 | GO:0032241 | positive regulation of nucleobase-containing compound transport(GO:0032241) |
| 1.2 | 7.3 | GO:1901552 | positive regulation of endothelial cell development(GO:1901552) positive regulation of establishment of endothelial barrier(GO:1903142) |
| 1.2 | 4.9 | GO:0051586 | positive regulation of neurotransmitter uptake(GO:0051582) positive regulation of dopamine uptake involved in synaptic transmission(GO:0051586) positive regulation of catecholamine uptake involved in synaptic transmission(GO:0051944) |
| 1.2 | 2.4 | GO:1904528 | positive regulation of microtubule binding(GO:1904528) |
| 1.2 | 7.2 | GO:1904674 | positive regulation of somatic stem cell population maintenance(GO:1904674) |
| 1.2 | 6.0 | GO:0036438 | maintenance of lens transparency(GO:0036438) |
| 1.2 | 3.6 | GO:0007290 | spermatid nucleus elongation(GO:0007290) |
| 1.2 | 3.6 | GO:0045590 | negative regulation of regulatory T cell differentiation(GO:0045590) |
| 1.2 | 42.6 | GO:0007026 | negative regulation of microtubule depolymerization(GO:0007026) |
| 1.2 | 8.3 | GO:0036123 | histone H3-K9 dimethylation(GO:0036123) |
| 1.2 | 8.2 | GO:0061086 | negative regulation of histone H3-K27 methylation(GO:0061086) |
| 1.2 | 3.5 | GO:1900738 | positive regulation of phospholipase C-activating G-protein coupled receptor signaling pathway(GO:1900738) |
| 1.2 | 7.0 | GO:0050915 | sensory perception of sour taste(GO:0050915) |
| 1.2 | 8.1 | GO:0035509 | negative regulation of myosin-light-chain-phosphatase activity(GO:0035509) |
| 1.1 | 2.3 | GO:0045110 | intermediate filament bundle assembly(GO:0045110) |
| 1.1 | 11.4 | GO:0060346 | bone trabecula formation(GO:0060346) |
| 1.1 | 6.8 | GO:0060633 | negative regulation of transcription initiation from RNA polymerase II promoter(GO:0060633) |
| 1.1 | 4.6 | GO:1902164 | mRNA localization resulting in posttranscriptional regulation of gene expression(GO:0010609) positive regulation of DNA damage response, signal transduction by p53 class mediator resulting in transcription of p21 class mediator(GO:1902164) |
| 1.1 | 6.8 | GO:1901898 | negative regulation of relaxation of cardiac muscle(GO:1901898) |
| 1.1 | 14.7 | GO:0014049 | positive regulation of glutamate secretion(GO:0014049) |
| 1.1 | 7.9 | GO:0070236 | negative regulation of activation-induced cell death of T cells(GO:0070236) |
| 1.1 | 12.4 | GO:0090527 | actin filament reorganization(GO:0090527) |
| 1.1 | 3.4 | GO:1903774 | positive regulation of viral budding via host ESCRT complex(GO:1903774) |
| 1.1 | 6.7 | GO:0035609 | C-terminal protein deglutamylation(GO:0035609) |
| 1.1 | 3.3 | GO:0032915 | positive regulation of transforming growth factor beta2 production(GO:0032915) |
| 1.1 | 17.4 | GO:0038180 | nerve growth factor signaling pathway(GO:0038180) |
| 1.1 | 2.2 | GO:0036515 | serotonergic neuron axon guidance(GO:0036515) |
| 1.1 | 2.2 | GO:0006344 | maintenance of chromatin silencing(GO:0006344) |
| 1.1 | 3.2 | GO:0002949 | tRNA threonylcarbamoyladenosine modification(GO:0002949) |
| 1.1 | 6.4 | GO:0060718 | chorionic trophoblast cell differentiation(GO:0060718) |
| 1.1 | 4.2 | GO:1902969 | mitotic DNA replication(GO:1902969) |
| 1.1 | 8.5 | GO:0031914 | negative regulation of synaptic plasticity(GO:0031914) |
| 1.1 | 4.2 | GO:0038108 | negative regulation of appetite by leptin-mediated signaling pathway(GO:0038108) |
| 1.1 | 16.9 | GO:0045653 | negative regulation of megakaryocyte differentiation(GO:0045653) |
| 1.0 | 2.1 | GO:2000437 | regulation of monocyte extravasation(GO:2000437) |
| 1.0 | 14.4 | GO:0000920 | cell separation after cytokinesis(GO:0000920) |
| 1.0 | 11.2 | GO:0051988 | regulation of attachment of spindle microtubules to kinetochore(GO:0051988) |
| 1.0 | 1.0 | GO:0086048 | membrane depolarization during bundle of His cell action potential(GO:0086048) |
| 1.0 | 6.1 | GO:0060723 | regulation of spongiotrophoblast cell proliferation(GO:0060721) regulation of cell proliferation involved in embryonic placenta development(GO:0060723) |
| 1.0 | 3.0 | GO:2001160 | regulation of histone H3-K79 methylation(GO:2001160) |
| 1.0 | 4.0 | GO:0097401 | synaptic vesicle lumen acidification(GO:0097401) |
| 1.0 | 22.1 | GO:0034453 | microtubule anchoring(GO:0034453) |
| 1.0 | 11.0 | GO:2000480 | negative regulation of cAMP-dependent protein kinase activity(GO:2000480) |
| 1.0 | 4.0 | GO:0061366 | behavioral response to chemical pain(GO:0061366) behavioral response to formalin induced pain(GO:0061368) NMDA selective glutamate receptor signaling pathway(GO:0098989) |
| 1.0 | 5.9 | GO:0035865 | cellular response to potassium ion(GO:0035865) |
| 1.0 | 12.7 | GO:0051764 | actin crosslink formation(GO:0051764) |
| 1.0 | 15.6 | GO:0090083 | regulation of inclusion body assembly(GO:0090083) |
| 1.0 | 2.9 | GO:0043974 | histone H3-K27 acetylation(GO:0043974) regulation of histone H3-K27 acetylation(GO:1901674) |
| 1.0 | 2.9 | GO:1903849 | regulation of aorta morphogenesis(GO:1903847) positive regulation of aorta morphogenesis(GO:1903849) |
| 1.0 | 40.8 | GO:0046426 | negative regulation of JAK-STAT cascade(GO:0046426) negative regulation of STAT cascade(GO:1904893) |
| 1.0 | 6.7 | GO:0060052 | neurofilament cytoskeleton organization(GO:0060052) |
| 1.0 | 1.9 | GO:0033600 | negative regulation of mammary gland epithelial cell proliferation(GO:0033600) |
| 0.9 | 15.1 | GO:0008090 | retrograde axonal transport(GO:0008090) |
| 0.9 | 19.6 | GO:0070932 | histone H3 deacetylation(GO:0070932) |
| 0.9 | 3.7 | GO:0052422 | modulation of catalytic activity in other organism involved in symbiotic interaction(GO:0052203) modulation by host of symbiont catalytic activity(GO:0052422) |
| 0.9 | 6.3 | GO:0000103 | sulfate assimilation(GO:0000103) |
| 0.9 | 2.7 | GO:0043314 | negative regulation of neutrophil degranulation(GO:0043314) |
| 0.9 | 4.5 | GO:0014878 | response to electrical stimulus involved in regulation of muscle adaptation(GO:0014878) |
| 0.9 | 3.6 | GO:0009212 | dTTP biosynthetic process(GO:0006235) pyrimidine deoxyribonucleoside triphosphate biosynthetic process(GO:0009212) |
| 0.9 | 5.3 | GO:0090308 | regulation of methylation-dependent chromatin silencing(GO:0090308) |
| 0.9 | 8.0 | GO:0007196 | adenylate cyclase-inhibiting G-protein coupled glutamate receptor signaling pathway(GO:0007196) |
| 0.9 | 1.8 | GO:0060166 | olfactory pit development(GO:0060166) |
| 0.9 | 1.7 | GO:0071503 | response to heparin(GO:0071503) |
| 0.9 | 8.7 | GO:2000042 | negative regulation of double-strand break repair via homologous recombination(GO:2000042) |
| 0.9 | 6.1 | GO:0070317 | negative regulation of G0 to G1 transition(GO:0070317) |
| 0.9 | 9.5 | GO:1904706 | negative regulation of vascular smooth muscle cell proliferation(GO:1904706) |
| 0.9 | 46.7 | GO:0036465 | synaptic vesicle recycling(GO:0036465) |
| 0.9 | 12.0 | GO:0046855 | inositol phosphate dephosphorylation(GO:0046855) |
| 0.9 | 2.6 | GO:2000111 | positive regulation of macrophage apoptotic process(GO:2000111) |
| 0.9 | 3.4 | GO:1904009 | cellular response to monosodium glutamate(GO:1904009) |
| 0.9 | 23.0 | GO:0032008 | positive regulation of TOR signaling(GO:0032008) |
| 0.8 | 11.9 | GO:0010971 | positive regulation of G2/M transition of mitotic cell cycle(GO:0010971) |
| 0.8 | 3.4 | GO:0009157 | deoxyribonucleoside monophosphate biosynthetic process(GO:0009157) |
| 0.8 | 8.5 | GO:0051901 | positive regulation of mitochondrial depolarization(GO:0051901) |
| 0.8 | 1.7 | GO:0008582 | regulation of synaptic growth at neuromuscular junction(GO:0008582) |
| 0.8 | 2.5 | GO:0000105 | histidine biosynthetic process(GO:0000105) |
| 0.8 | 12.4 | GO:2000114 | regulation of establishment of cell polarity(GO:2000114) |
| 0.8 | 2.5 | GO:0035022 | positive regulation of Rac protein signal transduction(GO:0035022) |
| 0.8 | 9.0 | GO:0032534 | regulation of microvillus assembly(GO:0032534) |
| 0.8 | 3.2 | GO:0048496 | maintenance of organ identity(GO:0048496) |
| 0.8 | 2.4 | GO:0042489 | negative regulation of odontogenesis(GO:0042483) negative regulation of odontogenesis of dentin-containing tooth(GO:0042489) |
| 0.8 | 2.4 | GO:0045077 | negative regulation of interferon-gamma biosynthetic process(GO:0045077) |
| 0.8 | 2.4 | GO:0032831 | regulation of CD4-positive, CD25-positive, alpha-beta regulatory T cell differentiation(GO:0032829) positive regulation of CD4-positive, CD25-positive, alpha-beta regulatory T cell differentiation(GO:0032831) |
| 0.8 | 1.6 | GO:0090230 | regulation of centromere complex assembly(GO:0090230) |
| 0.8 | 1.6 | GO:0008063 | Toll signaling pathway(GO:0008063) |
| 0.8 | 31.2 | GO:0007214 | gamma-aminobutyric acid signaling pathway(GO:0007214) |
| 0.8 | 2.3 | GO:0045578 | negative regulation of B cell differentiation(GO:0045578) |
| 0.8 | 3.1 | GO:0048478 | replication fork protection(GO:0048478) |
| 0.8 | 9.3 | GO:0089711 | L-glutamate transmembrane transport(GO:0089711) |
| 0.8 | 2.3 | GO:0009609 | response to symbiotic bacterium(GO:0009609) |
| 0.8 | 9.2 | GO:0009263 | deoxyribonucleotide biosynthetic process(GO:0009263) |
| 0.8 | 3.0 | GO:0015870 | acetylcholine transport(GO:0015870) |
| 0.7 | 5.2 | GO:0035356 | cellular triglyceride homeostasis(GO:0035356) |
| 0.7 | 8.1 | GO:0043045 | DNA methylation involved in embryo development(GO:0043045) changes to DNA methylation involved in embryo development(GO:1901538) |
| 0.7 | 5.2 | GO:0000012 | single strand break repair(GO:0000012) |
| 0.7 | 7.3 | GO:0007175 | negative regulation of epidermal growth factor-activated receptor activity(GO:0007175) |
| 0.7 | 2.1 | GO:0072600 | establishment of protein localization to Golgi(GO:0072600) |
| 0.7 | 9.3 | GO:0006527 | arginine catabolic process(GO:0006527) |
| 0.7 | 7.1 | GO:0001842 | neural fold formation(GO:0001842) |
| 0.7 | 18.4 | GO:0033120 | positive regulation of RNA splicing(GO:0033120) |
| 0.7 | 4.9 | GO:0098535 | de novo centriole assembly(GO:0098535) |
| 0.7 | 10.5 | GO:0001675 | acrosome assembly(GO:0001675) |
| 0.7 | 4.2 | GO:0032049 | cardiolipin biosynthetic process(GO:0032049) |
| 0.7 | 4.2 | GO:0006398 | mRNA 3'-end processing by stem-loop binding and cleavage(GO:0006398) |
| 0.7 | 7.6 | GO:0007258 | JUN phosphorylation(GO:0007258) |
| 0.7 | 4.9 | GO:0002887 | negative regulation of myeloid leukocyte mediated immunity(GO:0002887) negative regulation of mast cell activation involved in immune response(GO:0033007) negative regulation of mast cell degranulation(GO:0043305) |
| 0.7 | 28.4 | GO:0046854 | phosphatidylinositol phosphorylation(GO:0046854) |
| 0.7 | 21.4 | GO:0051491 | positive regulation of filopodium assembly(GO:0051491) |
| 0.7 | 5.5 | GO:0032808 | lacrimal gland development(GO:0032808) |
| 0.7 | 4.1 | GO:0006449 | regulation of translational termination(GO:0006449) |
| 0.7 | 10.9 | GO:0090382 | phagosome maturation(GO:0090382) |
| 0.7 | 8.1 | GO:0005513 | detection of calcium ion(GO:0005513) |
| 0.7 | 2.0 | GO:0021898 | regulation of transcription from RNA polymerase II promoter involved in forebrain neuron fate commitment(GO:0021882) commitment of multipotent stem cells to neuronal lineage in forebrain(GO:0021898) |
| 0.7 | 4.0 | GO:0018231 | peptidyl-L-cysteine S-palmitoylation(GO:0018230) peptidyl-S-diacylglycerol-L-cysteine biosynthetic process from peptidyl-cysteine(GO:0018231) |
| 0.7 | 4.6 | GO:1900113 | negative regulation of histone H3-K9 trimethylation(GO:1900113) |
| 0.6 | 18.1 | GO:0016242 | negative regulation of macroautophagy(GO:0016242) |
| 0.6 | 7.0 | GO:0043653 | mitochondrial fragmentation involved in apoptotic process(GO:0043653) |
| 0.6 | 1.9 | GO:0045200 | establishment or maintenance of neuroblast polarity(GO:0045196) establishment of neuroblast polarity(GO:0045200) |
| 0.6 | 6.4 | GO:0048251 | elastic fiber assembly(GO:0048251) |
| 0.6 | 2.5 | GO:0039534 | negative regulation of MDA-5 signaling pathway(GO:0039534) |
| 0.6 | 6.9 | GO:1900363 | regulation of mRNA polyadenylation(GO:1900363) |
| 0.6 | 9.4 | GO:0035970 | peptidyl-threonine dephosphorylation(GO:0035970) |
| 0.6 | 4.3 | GO:1903817 | negative regulation of delayed rectifier potassium channel activity(GO:1902260) negative regulation of voltage-gated potassium channel activity(GO:1903817) |
| 0.6 | 4.3 | GO:2000766 | negative regulation of cytoplasmic translation(GO:2000766) |
| 0.6 | 29.8 | GO:0000245 | spliceosomal complex assembly(GO:0000245) |
| 0.6 | 1.8 | GO:0070425 | negative regulation of toll-like receptor 3 signaling pathway(GO:0034140) toll-like receptor 5 signaling pathway(GO:0034146) negative regulation of nucleotide-binding oligomerization domain containing signaling pathway(GO:0070425) negative regulation of nucleotide-binding oligomerization domain containing 2 signaling pathway(GO:0070433) protein deubiquitination involved in ubiquitin-dependent protein catabolic process(GO:0071947) |
| 0.6 | 1.2 | GO:0043152 | induction of bacterial agglutination(GO:0043152) |
| 0.6 | 8.3 | GO:0080111 | DNA demethylation(GO:0080111) |
| 0.6 | 1.2 | GO:0050717 | positive regulation of interleukin-1 alpha secretion(GO:0050717) |
| 0.6 | 4.1 | GO:0042270 | protection from natural killer cell mediated cytotoxicity(GO:0042270) |
| 0.6 | 5.3 | GO:0030643 | cellular phosphate ion homeostasis(GO:0030643) cellular trivalent inorganic anion homeostasis(GO:0072502) |
| 0.6 | 1.8 | GO:0046340 | diacylglycerol catabolic process(GO:0046340) |
| 0.6 | 80.7 | GO:0007156 | homophilic cell adhesion via plasma membrane adhesion molecules(GO:0007156) |
| 0.6 | 4.1 | GO:0035360 | positive regulation of peroxisome proliferator activated receptor signaling pathway(GO:0035360) |
| 0.6 | 2.9 | GO:1903377 | negative regulation of oxidative stress-induced neuron intrinsic apoptotic signaling pathway(GO:1903377) |
| 0.6 | 7.5 | GO:0031115 | negative regulation of microtubule polymerization(GO:0031115) |
| 0.6 | 9.7 | GO:0035404 | histone-serine phosphorylation(GO:0035404) |
| 0.6 | 2.3 | GO:2000672 | negative regulation of motor neuron apoptotic process(GO:2000672) |
| 0.6 | 5.1 | GO:0021860 | pyramidal neuron development(GO:0021860) |
| 0.6 | 1.1 | GO:0071282 | cellular response to iron(II) ion(GO:0071282) |
| 0.6 | 2.8 | GO:0038007 | netrin-activated signaling pathway(GO:0038007) |
| 0.6 | 1.1 | GO:0046985 | positive regulation of hemoglobin biosynthetic process(GO:0046985) |
| 0.6 | 1.7 | GO:0097026 | dendritic cell dendrite assembly(GO:0097026) |
| 0.6 | 5.6 | GO:0071578 | zinc II ion transmembrane import(GO:0071578) |
| 0.6 | 1.7 | GO:0036506 | maintenance of unfolded protein(GO:0036506) maintenance of unfolded protein involved in ERAD pathway(GO:1904378) |
| 0.6 | 12.1 | GO:0071305 | cellular response to vitamin D(GO:0071305) |
| 0.5 | 5.5 | GO:0033623 | regulation of integrin activation(GO:0033623) |
| 0.5 | 13.4 | GO:0095500 | acetylcholine receptor signaling pathway(GO:0095500) signal transduction involved in cellular response to ammonium ion(GO:1903831) response to acetylcholine(GO:1905144) cellular response to acetylcholine(GO:1905145) |
| 0.5 | 4.8 | GO:0021631 | optic nerve morphogenesis(GO:0021631) |
| 0.5 | 26.0 | GO:0031103 | axon regeneration(GO:0031103) |
| 0.5 | 1.6 | GO:0019541 | propionate metabolic process(GO:0019541) |
| 0.5 | 46.2 | GO:0006334 | nucleosome assembly(GO:0006334) |
| 0.5 | 4.7 | GO:0038063 | collagen-activated tyrosine kinase receptor signaling pathway(GO:0038063) |
| 0.5 | 5.2 | GO:0032287 | peripheral nervous system myelin maintenance(GO:0032287) |
| 0.5 | 3.1 | GO:0003433 | chondrocyte development involved in endochondral bone morphogenesis(GO:0003433) |
| 0.5 | 1.5 | GO:0035507 | regulation of myosin-light-chain-phosphatase activity(GO:0035507) |
| 0.5 | 2.5 | GO:0050859 | negative regulation of B cell receptor signaling pathway(GO:0050859) |
| 0.5 | 4.5 | GO:0044789 | negative regulation of DNA endoreduplication(GO:0032876) modulation by host of viral release from host cell(GO:0044789) positive regulation by host of viral release from host cell(GO:0044791) |
| 0.5 | 12.5 | GO:0046839 | phospholipid dephosphorylation(GO:0046839) |
| 0.5 | 1.9 | GO:0033030 | negative regulation of neutrophil apoptotic process(GO:0033030) |
| 0.5 | 7.2 | GO:0097435 | fibril organization(GO:0097435) |
| 0.5 | 8.2 | GO:0043666 | regulation of phosphoprotein phosphatase activity(GO:0043666) |
| 0.5 | 15.3 | GO:1904659 | hexose transmembrane transport(GO:0035428) glucose transmembrane transport(GO:1904659) |
| 0.5 | 3.8 | GO:0045602 | negative regulation of endothelial cell differentiation(GO:0045602) |
| 0.5 | 14.7 | GO:0015701 | bicarbonate transport(GO:0015701) |
| 0.5 | 4.7 | GO:0002467 | germinal center formation(GO:0002467) |
| 0.5 | 12.8 | GO:0000027 | ribosomal large subunit assembly(GO:0000027) |
| 0.5 | 1.9 | GO:0048194 | Golgi vesicle budding(GO:0048194) |
| 0.5 | 2.3 | GO:1990086 | lens fiber cell apoptotic process(GO:1990086) |
| 0.5 | 23.8 | GO:0070527 | platelet aggregation(GO:0070527) |
| 0.5 | 6.1 | GO:0019985 | translesion synthesis(GO:0019985) |
| 0.5 | 8.4 | GO:0097503 | sialylation(GO:0097503) |
| 0.5 | 5.1 | GO:0070327 | thyroid hormone transport(GO:0070327) |
| 0.5 | 13.8 | GO:0006509 | membrane protein ectodomain proteolysis(GO:0006509) |
| 0.5 | 6.0 | GO:0032274 | gonadotropin secretion(GO:0032274) |
| 0.5 | 1.4 | GO:0032978 | protein insertion into membrane from inner side(GO:0032978) |
| 0.5 | 11.4 | GO:1901385 | regulation of voltage-gated calcium channel activity(GO:1901385) |
| 0.4 | 2.2 | GO:0086073 | bundle of His cell-Purkinje myocyte adhesion involved in cell communication(GO:0086073) |
| 0.4 | 0.9 | GO:0009957 | epidermal cell fate specification(GO:0009957) |
| 0.4 | 3.5 | GO:0000083 | regulation of transcription involved in G1/S transition of mitotic cell cycle(GO:0000083) |
| 0.4 | 5.7 | GO:0090162 | establishment of epithelial cell polarity(GO:0090162) |
| 0.4 | 4.8 | GO:0060134 | prepulse inhibition(GO:0060134) |
| 0.4 | 0.8 | GO:0032849 | regulation of cellular pH reduction(GO:0032847) positive regulation of cellular pH reduction(GO:0032849) |
| 0.4 | 4.6 | GO:0070831 | basement membrane assembly(GO:0070831) |
| 0.4 | 2.9 | GO:0006883 | cellular sodium ion homeostasis(GO:0006883) |
| 0.4 | 7.0 | GO:0045745 | positive regulation of G-protein coupled receptor protein signaling pathway(GO:0045745) |
| 0.4 | 5.4 | GO:0097094 | craniofacial suture morphogenesis(GO:0097094) |
| 0.4 | 5.3 | GO:0042492 | gamma-delta T cell differentiation(GO:0042492) |
| 0.4 | 24.3 | GO:0043967 | histone H4 acetylation(GO:0043967) |
| 0.4 | 11.7 | GO:0035307 | positive regulation of protein dephosphorylation(GO:0035307) |
| 0.4 | 13.7 | GO:0019228 | neuronal action potential(GO:0019228) |
| 0.4 | 0.8 | GO:1902263 | cellular process regulating host cell cycle in response to virus(GO:0060154) apoptotic process involved in embryonic digit morphogenesis(GO:1902263) |
| 0.4 | 3.2 | GO:0035542 | regulation of SNARE complex assembly(GO:0035542) |
| 0.4 | 1.6 | GO:0036265 | RNA (guanine-N7)-methylation(GO:0036265) |
| 0.4 | 5.1 | GO:0035313 | wound healing, spreading of epidermal cells(GO:0035313) |
| 0.4 | 4.3 | GO:0070307 | lens fiber cell development(GO:0070307) |
| 0.4 | 3.5 | GO:0070102 | interleukin-6-mediated signaling pathway(GO:0070102) |
| 0.4 | 10.5 | GO:0045662 | negative regulation of myoblast differentiation(GO:0045662) |
| 0.4 | 5.0 | GO:0060294 | cilium movement involved in cell motility(GO:0060294) |
| 0.4 | 6.9 | GO:0010738 | regulation of protein kinase A signaling(GO:0010738) |
| 0.4 | 1.1 | GO:0060279 | positive regulation of ovulation(GO:0060279) |
| 0.4 | 1.9 | GO:0043486 | histone exchange(GO:0043486) |
| 0.4 | 7.1 | GO:0034142 | toll-like receptor 4 signaling pathway(GO:0034142) |
| 0.4 | 7.5 | GO:0031572 | mitotic G2 DNA damage checkpoint(GO:0007095) G2 DNA damage checkpoint(GO:0031572) |
| 0.4 | 4.5 | GO:0051451 | myoblast migration(GO:0051451) |
| 0.4 | 4.1 | GO:0034498 | early endosome to Golgi transport(GO:0034498) |
| 0.4 | 3.0 | GO:0051382 | kinetochore assembly(GO:0051382) |
| 0.4 | 4.1 | GO:0035024 | negative regulation of Rho protein signal transduction(GO:0035024) |
| 0.4 | 3.3 | GO:0043584 | nose development(GO:0043584) |
| 0.4 | 1.1 | GO:0000738 | DNA catabolic process, exonucleolytic(GO:0000738) |
| 0.4 | 1.8 | GO:0061029 | eyelid development in camera-type eye(GO:0061029) |
| 0.4 | 0.7 | GO:0045925 | positive regulation of female receptivity(GO:0045925) |
| 0.4 | 20.9 | GO:0030317 | sperm motility(GO:0030317) |
| 0.4 | 4.3 | GO:0000185 | activation of MAPKKK activity(GO:0000185) |
| 0.4 | 13.7 | GO:0043966 | histone H3 acetylation(GO:0043966) |
| 0.4 | 3.9 | GO:1901741 | positive regulation of myoblast fusion(GO:1901741) |
| 0.4 | 3.2 | GO:0043928 | exonucleolytic nuclear-transcribed mRNA catabolic process involved in deadenylation-dependent decay(GO:0043928) |
| 0.4 | 6.0 | GO:0071786 | endoplasmic reticulum tubular network organization(GO:0071786) |
| 0.4 | 2.1 | GO:0010457 | centriole-centriole cohesion(GO:0010457) |
| 0.4 | 1.8 | GO:0038028 | insulin receptor signaling pathway via phosphatidylinositol 3-kinase(GO:0038028) |
| 0.4 | 2.8 | GO:0010826 | negative regulation of centrosome duplication(GO:0010826) negative regulation of centrosome cycle(GO:0046606) |
| 0.3 | 2.1 | GO:0031274 | positive regulation of pseudopodium assembly(GO:0031274) |
| 0.3 | 4.1 | GO:0035090 | maintenance of apical/basal cell polarity(GO:0035090) |
| 0.3 | 20.8 | GO:0050772 | positive regulation of axonogenesis(GO:0050772) |
| 0.3 | 0.7 | GO:0001545 | primary ovarian follicle growth(GO:0001545) |
| 0.3 | 7.3 | GO:1904037 | positive regulation of epithelial cell apoptotic process(GO:1904037) |
| 0.3 | 6.3 | GO:0045947 | negative regulation of translational initiation(GO:0045947) |
| 0.3 | 6.0 | GO:0006298 | mismatch repair(GO:0006298) |
| 0.3 | 1.3 | GO:0014842 | regulation of skeletal muscle satellite cell proliferation(GO:0014842) |
| 0.3 | 1.0 | GO:0006651 | diacylglycerol biosynthetic process(GO:0006651) |
| 0.3 | 5.2 | GO:0061154 | endothelial tube morphogenesis(GO:0061154) |
| 0.3 | 3.3 | GO:0060394 | negative regulation of pathway-restricted SMAD protein phosphorylation(GO:0060394) |
| 0.3 | 24.7 | GO:0014020 | primary neural tube formation(GO:0014020) |
| 0.3 | 1.6 | GO:1904424 | regulation of GTP binding(GO:1904424) |
| 0.3 | 5.3 | GO:0010771 | negative regulation of cell morphogenesis involved in differentiation(GO:0010771) |
| 0.3 | 5.6 | GO:0002092 | positive regulation of receptor internalization(GO:0002092) |
| 0.3 | 7.5 | GO:0000387 | spliceosomal snRNP assembly(GO:0000387) |
| 0.3 | 0.6 | GO:0070086 | ubiquitin-dependent endocytosis(GO:0070086) |
| 0.3 | 0.6 | GO:0051866 | general adaptation syndrome(GO:0051866) |
| 0.3 | 1.2 | GO:0001992 | regulation of systemic arterial blood pressure by vasopressin(GO:0001992) |
| 0.3 | 3.0 | GO:0035855 | megakaryocyte development(GO:0035855) |
| 0.3 | 2.4 | GO:0070914 | UV-damage excision repair(GO:0070914) |
| 0.3 | 8.7 | GO:0051310 | metaphase plate congression(GO:0051310) |
| 0.3 | 5.9 | GO:0034260 | negative regulation of GTPase activity(GO:0034260) |
| 0.3 | 5.6 | GO:0042744 | hydrogen peroxide catabolic process(GO:0042744) |
| 0.3 | 1.5 | GO:0006337 | nucleosome disassembly(GO:0006337) |
| 0.3 | 3.2 | GO:0019321 | pentose metabolic process(GO:0019321) |
| 0.3 | 5.3 | GO:0032967 | positive regulation of collagen biosynthetic process(GO:0032967) |
| 0.3 | 3.7 | GO:0050901 | leukocyte tethering or rolling(GO:0050901) |
| 0.3 | 13.6 | GO:0051865 | protein autoubiquitination(GO:0051865) |
| 0.3 | 3.0 | GO:2001224 | positive regulation of neuron migration(GO:2001224) |
| 0.3 | 1.9 | GO:0044030 | regulation of DNA methylation(GO:0044030) |
| 0.3 | 0.8 | GO:1901367 | response to L-cysteine(GO:1901367) |
| 0.3 | 1.6 | GO:2000427 | positive regulation of apoptotic cell clearance(GO:2000427) |
| 0.3 | 3.3 | GO:0032620 | interleukin-17 production(GO:0032620) |
| 0.3 | 1.6 | GO:0061737 | leukotriene signaling pathway(GO:0061737) |
| 0.3 | 1.6 | GO:0034773 | histone H4-K20 trimethylation(GO:0034773) |
| 0.3 | 1.1 | GO:0070544 | histone H3-K36 demethylation(GO:0070544) |
| 0.3 | 2.9 | GO:0006895 | Golgi to endosome transport(GO:0006895) |
| 0.3 | 1.6 | GO:0001927 | exocyst assembly(GO:0001927) |
| 0.3 | 5.2 | GO:0045746 | negative regulation of Notch signaling pathway(GO:0045746) |
| 0.3 | 1.0 | GO:0031179 | peptide modification(GO:0031179) |
| 0.3 | 0.3 | GO:0034971 | histone H3-R17 methylation(GO:0034971) |
| 0.3 | 2.0 | GO:0000463 | maturation of LSU-rRNA from tricistronic rRNA transcript (SSU-rRNA, 5.8S rRNA, LSU-rRNA)(GO:0000463) |
| 0.3 | 1.3 | GO:0098789 | pre-mRNA cleavage required for polyadenylation(GO:0098789) |
| 0.3 | 2.8 | GO:0035873 | lactate transport(GO:0015727) lactate transmembrane transport(GO:0035873) |
| 0.3 | 4.0 | GO:0000301 | retrograde transport, vesicle recycling within Golgi(GO:0000301) |
| 0.2 | 5.7 | GO:0030261 | chromosome condensation(GO:0030261) |
| 0.2 | 4.0 | GO:0060122 | inner ear receptor stereocilium organization(GO:0060122) |
| 0.2 | 1.5 | GO:2000819 | regulation of nucleotide-excision repair(GO:2000819) |
| 0.2 | 1.7 | GO:0030259 | lipid glycosylation(GO:0030259) |
| 0.2 | 4.1 | GO:0046597 | negative regulation of viral entry into host cell(GO:0046597) |
| 0.2 | 7.8 | GO:0034605 | cellular response to heat(GO:0034605) |
| 0.2 | 1.7 | GO:0018026 | peptidyl-lysine monomethylation(GO:0018026) |
| 0.2 | 12.2 | GO:0031338 | regulation of vesicle fusion(GO:0031338) |
| 0.2 | 4.3 | GO:0032012 | regulation of ARF protein signal transduction(GO:0032012) |
| 0.2 | 2.4 | GO:0036010 | protein localization to endosome(GO:0036010) |
| 0.2 | 11.9 | GO:0008277 | regulation of G-protein coupled receptor protein signaling pathway(GO:0008277) |
| 0.2 | 9.2 | GO:0000413 | protein peptidyl-prolyl isomerization(GO:0000413) |
| 0.2 | 16.1 | GO:0007229 | integrin-mediated signaling pathway(GO:0007229) |
| 0.2 | 8.4 | GO:0080171 | lysosome organization(GO:0007040) lytic vacuole organization(GO:0080171) |
| 0.2 | 1.4 | GO:0010606 | positive regulation of cytoplasmic mRNA processing body assembly(GO:0010606) |
| 0.2 | 0.9 | GO:0031053 | primary miRNA processing(GO:0031053) |
| 0.2 | 1.5 | GO:0015808 | L-alanine transport(GO:0015808) |
| 0.2 | 13.2 | GO:0010977 | negative regulation of neuron projection development(GO:0010977) |
| 0.2 | 2.1 | GO:0002430 | complement receptor mediated signaling pathway(GO:0002430) |
| 0.2 | 5.7 | GO:0061001 | regulation of dendritic spine morphogenesis(GO:0061001) |
| 0.2 | 1.3 | GO:0000212 | meiotic spindle organization(GO:0000212) |
| 0.2 | 2.5 | GO:0014912 | negative regulation of smooth muscle cell migration(GO:0014912) |
| 0.2 | 0.4 | GO:0045990 | carbon catabolite regulation of transcription from RNA polymerase II promoter(GO:0000429) regulation of transcription from RNA polymerase II promoter by glucose(GO:0000430) positive regulation of transcription from RNA polymerase II promoter by glucose(GO:0000432) carbon catabolite activation of transcription from RNA polymerase II promoter(GO:0000436) carbon catabolite regulation of transcription(GO:0045990) carbon catabolite activation of transcription(GO:0045991) positive regulation of transcription by glucose(GO:0046016) |
| 0.2 | 1.4 | GO:0046827 | positive regulation of protein export from nucleus(GO:0046827) |
| 0.2 | 2.5 | GO:0016973 | poly(A)+ mRNA export from nucleus(GO:0016973) |
| 0.2 | 6.1 | GO:0035987 | endodermal cell differentiation(GO:0035987) |
| 0.2 | 2.4 | GO:0001502 | cartilage condensation(GO:0001502) |
| 0.2 | 1.0 | GO:0071803 | positive regulation of podosome assembly(GO:0071803) |
| 0.2 | 2.1 | GO:0007141 | male meiosis I(GO:0007141) |
| 0.2 | 2.7 | GO:0006646 | phosphatidylethanolamine biosynthetic process(GO:0006646) |
| 0.2 | 2.7 | GO:0017121 | phospholipid scrambling(GO:0017121) |
| 0.2 | 1.9 | GO:0048266 | behavioral response to pain(GO:0048266) |
| 0.2 | 13.0 | GO:0048015 | phosphatidylinositol-mediated signaling(GO:0048015) |
| 0.2 | 1.5 | GO:0042759 | long-chain fatty acid biosynthetic process(GO:0042759) |
| 0.2 | 4.7 | GO:0050982 | detection of mechanical stimulus(GO:0050982) |
| 0.2 | 5.4 | GO:0006306 | DNA alkylation(GO:0006305) DNA methylation(GO:0006306) |
| 0.2 | 3.0 | GO:0001881 | receptor recycling(GO:0001881) |
| 0.2 | 1.8 | GO:0002098 | tRNA wobble uridine modification(GO:0002098) |
| 0.2 | 12.5 | GO:0048813 | dendrite morphogenesis(GO:0048813) |
| 0.2 | 2.4 | GO:0097034 | mitochondrial respiratory chain complex IV assembly(GO:0033617) mitochondrial respiratory chain complex IV biogenesis(GO:0097034) |
| 0.2 | 1.4 | GO:0090286 | cytoskeletal anchoring at nuclear membrane(GO:0090286) |
| 0.2 | 1.1 | GO:0000160 | phosphorelay signal transduction system(GO:0000160) |
| 0.2 | 0.3 | GO:0071461 | cellular response to redox state(GO:0071461) |
| 0.2 | 2.7 | GO:0097352 | autophagosome maturation(GO:0097352) |
| 0.2 | 4.6 | GO:0050770 | regulation of axonogenesis(GO:0050770) |
| 0.2 | 66.7 | GO:0007017 | microtubule-based process(GO:0007017) |
| 0.2 | 3.4 | GO:0032720 | negative regulation of tumor necrosis factor production(GO:0032720) |
| 0.2 | 0.8 | GO:0033353 | S-adenosylmethionine cycle(GO:0033353) |
| 0.2 | 12.8 | GO:0007286 | spermatid development(GO:0007286) |
| 0.2 | 3.2 | GO:0043153 | entrainment of circadian clock by photoperiod(GO:0043153) |
| 0.2 | 12.8 | GO:1903955 | positive regulation of protein targeting to mitochondrion(GO:1903955) |
| 0.2 | 5.0 | GO:0045071 | negative regulation of viral genome replication(GO:0045071) |
| 0.2 | 2.3 | GO:0051058 | negative regulation of small GTPase mediated signal transduction(GO:0051058) |
| 0.2 | 4.7 | GO:1901216 | positive regulation of neuron death(GO:1901216) |
| 0.2 | 1.7 | GO:0032674 | regulation of interleukin-5 production(GO:0032674) |
| 0.2 | 1.4 | GO:0002082 | regulation of oxidative phosphorylation(GO:0002082) |
| 0.2 | 1.8 | GO:0045736 | negative regulation of cyclin-dependent protein serine/threonine kinase activity(GO:0045736) |
| 0.1 | 0.4 | GO:2001184 | positive regulation of interleukin-12 secretion(GO:2001184) |
| 0.1 | 0.9 | GO:1902231 | positive regulation of intrinsic apoptotic signaling pathway in response to DNA damage(GO:1902231) |
| 0.1 | 2.7 | GO:0060325 | face morphogenesis(GO:0060325) |
| 0.1 | 1.0 | GO:0071800 | podosome assembly(GO:0071800) |
| 0.1 | 3.2 | GO:0018345 | protein palmitoylation(GO:0018345) |
| 0.1 | 4.6 | GO:0050852 | T cell receptor signaling pathway(GO:0050852) |
| 0.1 | 1.9 | GO:2000401 | regulation of lymphocyte migration(GO:2000401) |
| 0.1 | 1.0 | GO:0032204 | regulation of telomere maintenance(GO:0032204) |
| 0.1 | 0.2 | GO:0060017 | parathyroid gland development(GO:0060017) |
| 0.1 | 1.8 | GO:0032211 | negative regulation of telomere maintenance via telomerase(GO:0032211) |
| 0.1 | 1.6 | GO:0045943 | positive regulation of transcription from RNA polymerase I promoter(GO:0045943) |
| 0.1 | 5.3 | GO:0002028 | regulation of sodium ion transport(GO:0002028) |
| 0.1 | 1.6 | GO:0045599 | negative regulation of fat cell differentiation(GO:0045599) |
| 0.1 | 0.4 | GO:0001672 | regulation of chromatin assembly or disassembly(GO:0001672) |
| 0.1 | 4.2 | GO:0000462 | maturation of SSU-rRNA from tricistronic rRNA transcript (SSU-rRNA, 5.8S rRNA, LSU-rRNA)(GO:0000462) |
| 0.1 | 1.2 | GO:0033561 | regulation of water loss via skin(GO:0033561) establishment of skin barrier(GO:0061436) |
| 0.1 | 1.6 | GO:0006664 | glycolipid metabolic process(GO:0006664) |
| 0.1 | 1.9 | GO:0034766 | negative regulation of ion transmembrane transport(GO:0034766) |
| 0.1 | 23.0 | GO:0007283 | spermatogenesis(GO:0007283) |
| 0.1 | 0.5 | GO:0080182 | histone H3-K4 trimethylation(GO:0080182) |
| 0.1 | 2.1 | GO:0046928 | regulation of neurotransmitter secretion(GO:0046928) |
| 0.1 | 0.5 | GO:0010566 | regulation of ketone biosynthetic process(GO:0010566) |
| 0.1 | 1.4 | GO:0009299 | mRNA transcription(GO:0009299) |
| 0.1 | 2.9 | GO:0071549 | cellular response to dexamethasone stimulus(GO:0071549) |
| 0.1 | 1.2 | GO:0043550 | regulation of lipid kinase activity(GO:0043550) |
| 0.1 | 0.5 | GO:0007340 | acrosome reaction(GO:0007340) |
| 0.1 | 2.1 | GO:0046676 | negative regulation of insulin secretion(GO:0046676) |
| 0.1 | 1.5 | GO:0008156 | negative regulation of DNA replication(GO:0008156) |
| 0.1 | 1.9 | GO:0000186 | activation of MAPKK activity(GO:0000186) |
| 0.1 | 2.2 | GO:0038083 | peptidyl-tyrosine autophosphorylation(GO:0038083) |
| 0.1 | 2.9 | GO:0032024 | positive regulation of insulin secretion(GO:0032024) |
| 0.1 | 1.8 | GO:0010501 | RNA secondary structure unwinding(GO:0010501) |
| 0.1 | 11.5 | GO:0006813 | potassium ion transport(GO:0006813) |
| 0.1 | 2.5 | GO:0021915 | neural tube development(GO:0021915) |
| 0.1 | 0.2 | GO:0090367 | regulation of mRNA modification(GO:0090365) negative regulation of mRNA modification(GO:0090367) |
| 0.1 | 2.3 | GO:0033209 | tumor necrosis factor-mediated signaling pathway(GO:0033209) |
| 0.1 | 0.8 | GO:0035249 | synaptic transmission, glutamatergic(GO:0035249) |
| 0.1 | 1.2 | GO:0006891 | intra-Golgi vesicle-mediated transport(GO:0006891) |
| 0.1 | 0.4 | GO:0043162 | ubiquitin-dependent protein catabolic process via the multivesicular body sorting pathway(GO:0043162) |
| 0.1 | 1.2 | GO:0006221 | pyrimidine nucleotide biosynthetic process(GO:0006221) |
| 0.1 | 2.0 | GO:0006919 | activation of cysteine-type endopeptidase activity involved in apoptotic process(GO:0006919) |
| 0.1 | 7.6 | GO:0000398 | RNA splicing, via transesterification reactions with bulged adenosine as nucleophile(GO:0000377) mRNA splicing, via spliceosome(GO:0000398) |
| 0.1 | 3.3 | GO:0030183 | B cell differentiation(GO:0030183) |
| 0.1 | 1.6 | GO:0042472 | inner ear morphogenesis(GO:0042472) |
| 0.1 | 2.8 | GO:0007050 | cell cycle arrest(GO:0007050) |
| 0.1 | 0.7 | GO:0016540 | protein autoprocessing(GO:0016540) |
| 0.0 | 5.1 | GO:0008654 | phospholipid biosynthetic process(GO:0008654) |
| 0.0 | 2.5 | GO:0010921 | regulation of phosphatase activity(GO:0010921) |
| 0.0 | 0.1 | GO:0036102 | leukotriene catabolic process(GO:0036100) leukotriene B4 catabolic process(GO:0036101) leukotriene B4 metabolic process(GO:0036102) icosanoid catabolic process(GO:1901523) fatty acid derivative catabolic process(GO:1901569) |
| 0.0 | 0.8 | GO:0007339 | binding of sperm to zona pellucida(GO:0007339) |
| 0.0 | 0.6 | GO:0046627 | negative regulation of insulin receptor signaling pathway(GO:0046627) |
| 0.0 | 0.9 | GO:0000184 | nuclear-transcribed mRNA catabolic process, nonsense-mediated decay(GO:0000184) |
| 0.0 | 1.3 | GO:0090090 | negative regulation of canonical Wnt signaling pathway(GO:0090090) |
| 0.0 | 3.9 | GO:0006413 | translational initiation(GO:0006413) |
| 0.0 | 0.4 | GO:0071731 | response to nitric oxide(GO:0071731) cellular response to nitric oxide(GO:0071732) |
| 0.0 | 1.1 | GO:0006406 | mRNA export from nucleus(GO:0006406) mRNA-containing ribonucleoprotein complex export from nucleus(GO:0071427) |
| 0.0 | 0.5 | GO:1901642 | nucleoside transmembrane transport(GO:1901642) |
| 0.0 | 0.5 | GO:0006880 | intracellular sequestering of iron ion(GO:0006880) sequestering of iron ion(GO:0097577) |
| 0.0 | 8.3 | GO:0043547 | positive regulation of GTPase activity(GO:0043547) |
| 0.0 | 2.5 | GO:0042787 | protein ubiquitination involved in ubiquitin-dependent protein catabolic process(GO:0042787) |
| 0.0 | 1.5 | GO:0006414 | translational elongation(GO:0006414) |
| 0.0 | 0.4 | GO:1990126 | retrograde transport, endosome to plasma membrane(GO:1990126) |
| 0.0 | 0.2 | GO:0006384 | transcription initiation from RNA polymerase III promoter(GO:0006384) |
| 0.0 | 0.2 | GO:0051497 | negative regulation of actin filament bundle assembly(GO:0032232) negative regulation of stress fiber assembly(GO:0051497) |
| 0.0 | 0.6 | GO:0006400 | tRNA modification(GO:0006400) |
| 0.0 | 0.8 | GO:0006275 | regulation of DNA replication(GO:0006275) |
| 0.0 | 0.5 | GO:0001942 | hair follicle development(GO:0001942) skin epidermis development(GO:0098773) |
| 0.0 | 0.0 | GO:0021859 | pyramidal neuron differentiation(GO:0021859) |
| 0.0 | 1.9 | GO:0006887 | exocytosis(GO:0006887) |
| 0.0 | 0.5 | GO:0010811 | positive regulation of cell-substrate adhesion(GO:0010811) |
| 0.0 | 0.2 | GO:0050885 | neuromuscular process controlling balance(GO:0050885) |
Gene overrepresentation in cellular component category:
| Log-likelihood per target | Total log-likelihood | Term | Description |
|---|---|---|---|
| 13.0 | 39.1 | GO:0034686 | integrin alphav-beta8 complex(GO:0034686) |
| 6.4 | 25.7 | GO:0042585 | germinal vesicle(GO:0042585) |
| 6.2 | 37.2 | GO:0033269 | internode region of axon(GO:0033269) |
| 4.7 | 28.2 | GO:0044308 | axonal spine(GO:0044308) |
| 4.7 | 18.7 | GO:0071914 | prominosome(GO:0071914) |
| 4.4 | 13.1 | GO:0044393 | microspike(GO:0044393) |
| 4.2 | 12.5 | GO:0071149 | TEAD-2-YAP complex(GO:0071149) |
| 4.1 | 20.7 | GO:0098845 | postsynaptic endosome(GO:0098845) |
| 4.1 | 16.4 | GO:0097149 | centralspindlin complex(GO:0097149) |
| 4.1 | 12.2 | GO:0032173 | septin collar(GO:0032173) |
| 3.6 | 17.9 | GO:1990769 | proximal neuron projection(GO:1990769) |
| 3.4 | 13.7 | GO:0005593 | FACIT collagen trimer(GO:0005593) |
| 3.4 | 10.1 | GO:0060187 | cell pole(GO:0060187) |
| 3.0 | 23.9 | GO:0044305 | calyx of Held(GO:0044305) |
| 2.9 | 11.7 | GO:1990812 | growth cone lamellipodium(GO:1990761) growth cone filopodium(GO:1990812) |
| 2.9 | 28.9 | GO:0097433 | dense body(GO:0097433) |
| 2.8 | 8.3 | GO:0000811 | GINS complex(GO:0000811) |
| 2.6 | 10.4 | GO:0002079 | inner acrosomal membrane(GO:0002079) |
| 2.4 | 9.8 | GO:0044326 | dendritic spine neck(GO:0044326) |
| 2.4 | 9.6 | GO:0005971 | ribonucleoside-diphosphate reductase complex(GO:0005971) |
| 2.3 | 9.4 | GO:0097427 | microtubule bundle(GO:0097427) |
| 2.3 | 6.8 | GO:0031205 | endoplasmic reticulum Sec complex(GO:0031205) |
| 2.2 | 6.7 | GO:0038039 | G-protein coupled receptor heterodimeric complex(GO:0038039) |
| 2.1 | 10.7 | GO:0070032 | synaptobrevin 2-SNAP-25-syntaxin-1a-complexin I complex(GO:0070032) |
| 2.1 | 6.2 | GO:0016533 | cyclin-dependent protein kinase 5 holoenzyme complex(GO:0016533) |
| 2.0 | 10.2 | GO:0046696 | lipopolysaccharide receptor complex(GO:0046696) |
| 2.0 | 8.1 | GO:0097451 | glial limiting end-foot(GO:0097451) |
| 1.9 | 7.8 | GO:0034657 | GID complex(GO:0034657) |
| 1.8 | 30.5 | GO:0031258 | lamellipodium membrane(GO:0031258) |
| 1.6 | 32.7 | GO:0010369 | chromocenter(GO:0010369) |
| 1.6 | 11.4 | GO:0036128 | CatSper complex(GO:0036128) |
| 1.5 | 40.0 | GO:0005868 | cytoplasmic dynein complex(GO:0005868) |
| 1.4 | 7.0 | GO:0097165 | nuclear stress granule(GO:0097165) |
| 1.4 | 5.6 | GO:0031592 | centrosomal corona(GO:0031592) |
| 1.4 | 6.8 | GO:0031315 | extrinsic component of mitochondrial outer membrane(GO:0031315) |
| 1.3 | 6.7 | GO:0005883 | neurofilament(GO:0005883) |
| 1.3 | 5.2 | GO:0098888 | extrinsic component of presynaptic membrane(GO:0098888) |
| 1.3 | 9.0 | GO:0048787 | presynaptic active zone membrane(GO:0048787) |
| 1.3 | 3.8 | GO:0098855 | HCN channel complex(GO:0098855) |
| 1.3 | 3.8 | GO:0035101 | FACT complex(GO:0035101) |
| 1.3 | 11.3 | GO:0005641 | nuclear envelope lumen(GO:0005641) |
| 1.2 | 7.5 | GO:0036195 | muscle cell projection(GO:0036194) muscle cell projection membrane(GO:0036195) |
| 1.2 | 1.2 | GO:0031209 | SCAR complex(GO:0031209) |
| 1.2 | 18.1 | GO:0071565 | nBAF complex(GO:0071565) |
| 1.2 | 14.4 | GO:0005687 | U4 snRNP(GO:0005687) |
| 1.2 | 16.8 | GO:0035253 | ciliary rootlet(GO:0035253) |
| 1.2 | 8.4 | GO:0042382 | paraspeckles(GO:0042382) |
| 1.2 | 4.7 | GO:0019815 | B cell receptor complex(GO:0019815) |
| 1.2 | 4.6 | GO:0005607 | laminin-2 complex(GO:0005607) |
| 1.1 | 41.0 | GO:0044295 | axonal growth cone(GO:0044295) |
| 1.1 | 22.5 | GO:0001518 | voltage-gated sodium channel complex(GO:0001518) |
| 1.1 | 5.6 | GO:0044614 | nuclear pore cytoplasmic filaments(GO:0044614) |
| 1.1 | 5.4 | GO:0071953 | elastic fiber(GO:0071953) |
| 1.1 | 33.4 | GO:0035371 | microtubule plus-end(GO:0035371) |
| 1.0 | 8.1 | GO:0031314 | extrinsic component of mitochondrial inner membrane(GO:0031314) |
| 1.0 | 10.1 | GO:0036057 | filtration diaphragm(GO:0036056) slit diaphragm(GO:0036057) |
| 1.0 | 12.6 | GO:0000124 | SAGA complex(GO:0000124) |
| 1.0 | 17.2 | GO:0001520 | outer dense fiber(GO:0001520) |
| 0.9 | 8.3 | GO:0097442 | CA3 pyramidal cell dendrite(GO:0097442) |
| 0.9 | 5.4 | GO:1990752 | microtubule end(GO:1990752) |
| 0.9 | 6.3 | GO:0032584 | growth cone membrane(GO:0032584) |
| 0.9 | 2.7 | GO:0008537 | proteasome activator complex(GO:0008537) |
| 0.9 | 4.4 | GO:0044530 | supraspliceosomal complex(GO:0044530) |
| 0.9 | 6.2 | GO:0090571 | RNA polymerase II transcription repressor complex(GO:0090571) |
| 0.9 | 12.3 | GO:0071437 | invadopodium(GO:0071437) |
| 0.9 | 5.3 | GO:0002142 | stereocilia ankle link complex(GO:0002142) |
| 0.9 | 9.6 | GO:0001527 | microfibril(GO:0001527) fibril(GO:0043205) |
| 0.9 | 5.2 | GO:0005869 | dynactin complex(GO:0005869) |
| 0.9 | 8.7 | GO:0008290 | F-actin capping protein complex(GO:0008290) |
| 0.9 | 17.3 | GO:0043196 | varicosity(GO:0043196) |
| 0.8 | 4.2 | GO:0000120 | RNA polymerase I transcription factor complex(GO:0000120) |
| 0.8 | 6.7 | GO:0030877 | beta-catenin destruction complex(GO:0030877) |
| 0.8 | 6.5 | GO:0070776 | H3 histone acetyltransferase complex(GO:0070775) MOZ/MORF histone acetyltransferase complex(GO:0070776) |
| 0.8 | 4.0 | GO:0033063 | Rad51B-Rad51C-Rad51D-XRCC2 complex(GO:0033063) |
| 0.8 | 2.4 | GO:0098592 | cytoplasmic side of apical plasma membrane(GO:0098592) |
| 0.8 | 3.2 | GO:0000408 | EKC/KEOPS complex(GO:0000408) |
| 0.8 | 9.5 | GO:1990454 | L-type voltage-gated calcium channel complex(GO:1990454) |
| 0.8 | 2.4 | GO:1990590 | ATF1-ATF4 transcription factor complex(GO:1990590) |
| 0.8 | 22.4 | GO:0051233 | spindle midzone(GO:0051233) |
| 0.8 | 75.2 | GO:0000786 | nucleosome(GO:0000786) |
| 0.8 | 2.3 | GO:0097058 | CRLF-CLCF1 complex(GO:0097058) |
| 0.8 | 16.7 | GO:0005942 | phosphatidylinositol 3-kinase complex(GO:0005942) |
| 0.8 | 31.8 | GO:0005881 | cytoplasmic microtubule(GO:0005881) |
| 0.8 | 10.6 | GO:0000164 | protein phosphatase type 1 complex(GO:0000164) |
| 0.7 | 19.0 | GO:0005891 | voltage-gated calcium channel complex(GO:0005891) |
| 0.7 | 12.4 | GO:0042589 | zymogen granule membrane(GO:0042589) |
| 0.7 | 47.8 | GO:0032580 | Golgi cisterna membrane(GO:0032580) |
| 0.7 | 8.0 | GO:0097449 | astrocyte projection(GO:0097449) |
| 0.7 | 1.4 | GO:0044327 | dendritic spine head(GO:0044327) |
| 0.7 | 34.7 | GO:0005720 | nuclear heterochromatin(GO:0005720) |
| 0.7 | 8.5 | GO:0000812 | Swr1 complex(GO:0000812) |
| 0.7 | 19.0 | GO:0005875 | microtubule associated complex(GO:0005875) |
| 0.7 | 9.6 | GO:0031045 | dense core granule(GO:0031045) |
| 0.6 | 4.5 | GO:0034991 | nuclear meiotic cohesin complex(GO:0034991) |
| 0.6 | 43.4 | GO:0042734 | presynaptic membrane(GO:0042734) |
| 0.6 | 28.3 | GO:0005871 | kinesin complex(GO:0005871) |
| 0.6 | 11.2 | GO:0030014 | CCR4-NOT complex(GO:0030014) |
| 0.6 | 3.7 | GO:0000137 | Golgi cis cisterna(GO:0000137) |
| 0.6 | 8.0 | GO:0031143 | pseudopodium(GO:0031143) |
| 0.6 | 4.3 | GO:0072687 | meiotic spindle(GO:0072687) |
| 0.6 | 19.6 | GO:0045334 | clathrin-coated endocytic vesicle(GO:0045334) |
| 0.6 | 1.8 | GO:1990879 | CST complex(GO:1990879) |
| 0.6 | 7.9 | GO:0035686 | sperm fibrous sheath(GO:0035686) |
| 0.6 | 6.0 | GO:1990635 | proximal dendrite(GO:1990635) |
| 0.6 | 138.0 | GO:0005874 | microtubule(GO:0005874) |
| 0.6 | 3.0 | GO:0002189 | ribose phosphate diphosphokinase complex(GO:0002189) |
| 0.6 | 3.6 | GO:0005672 | transcription factor TFIIA complex(GO:0005672) |
| 0.6 | 4.7 | GO:0098645 | collagen type IV trimer(GO:0005587) network-forming collagen trimer(GO:0098642) collagen network(GO:0098645) |
| 0.6 | 4.6 | GO:0042105 | alpha-beta T cell receptor complex(GO:0042105) |
| 0.6 | 2.2 | GO:0070545 | PeBoW complex(GO:0070545) |
| 0.5 | 11.0 | GO:0005922 | connexon complex(GO:0005922) |
| 0.5 | 9.7 | GO:0031588 | nucleotide-activated protein kinase complex(GO:0031588) |
| 0.5 | 6.4 | GO:0035098 | ESC/E(Z) complex(GO:0035098) |
| 0.5 | 13.7 | GO:0030992 | intraciliary transport particle B(GO:0030992) |
| 0.5 | 0.5 | GO:0032059 | bleb(GO:0032059) |
| 0.5 | 35.7 | GO:0031901 | early endosome membrane(GO:0031901) |
| 0.5 | 16.6 | GO:0031941 | filamentous actin(GO:0031941) |
| 0.5 | 33.3 | GO:0030672 | synaptic vesicle membrane(GO:0030672) exocytic vesicle membrane(GO:0099501) |
| 0.5 | 21.8 | GO:0045171 | intercellular bridge(GO:0045171) |
| 0.5 | 4.9 | GO:0014731 | spectrin-associated cytoskeleton(GO:0014731) |
| 0.5 | 6.3 | GO:0097038 | perinuclear endoplasmic reticulum(GO:0097038) |
| 0.5 | 2.4 | GO:0031465 | Cul4B-RING E3 ubiquitin ligase complex(GO:0031465) |
| 0.5 | 1.4 | GO:0005853 | eukaryotic translation elongation factor 1 complex(GO:0005853) |
| 0.5 | 8.0 | GO:0036038 | MKS complex(GO:0036038) |
| 0.5 | 3.3 | GO:0031466 | Cul5-RING ubiquitin ligase complex(GO:0031466) |
| 0.5 | 3.7 | GO:0031254 | uropod(GO:0001931) cell trailing edge(GO:0031254) |
| 0.5 | 5.5 | GO:0005583 | fibrillar collagen trimer(GO:0005583) banded collagen fibril(GO:0098643) |
| 0.5 | 1.8 | GO:0045009 | melanosome membrane(GO:0033162) chitosome(GO:0045009) |
| 0.4 | 13.5 | GO:0097610 | cleavage furrow(GO:0032154) cell surface furrow(GO:0097610) |
| 0.4 | 23.2 | GO:0005581 | collagen trimer(GO:0005581) |
| 0.4 | 4.0 | GO:0001891 | phagocytic cup(GO:0001891) |
| 0.4 | 12.6 | GO:0002102 | podosome(GO:0002102) |
| 0.4 | 9.0 | GO:0071339 | MLL1/2 complex(GO:0044665) MLL1 complex(GO:0071339) |
| 0.4 | 3.0 | GO:0097197 | tetraspanin-enriched microdomain(GO:0097197) |
| 0.4 | 5.5 | GO:0044666 | MLL3/4 complex(GO:0044666) |
| 0.4 | 4.7 | GO:0016600 | flotillin complex(GO:0016600) |
| 0.4 | 4.2 | GO:0034464 | BBSome(GO:0034464) |
| 0.4 | 10.1 | GO:0030867 | rough endoplasmic reticulum membrane(GO:0030867) |
| 0.4 | 3.8 | GO:0000813 | ESCRT I complex(GO:0000813) |
| 0.4 | 10.9 | GO:0031307 | integral component of mitochondrial outer membrane(GO:0031307) |
| 0.4 | 1.7 | GO:0072379 | BAT3 complex(GO:0071818) ER membrane insertion complex(GO:0072379) |
| 0.4 | 2.9 | GO:0005579 | membrane attack complex(GO:0005579) |
| 0.4 | 1.2 | GO:0034774 | secretory granule lumen(GO:0034774) |
| 0.4 | 92.5 | GO:0060076 | excitatory synapse(GO:0060076) |
| 0.4 | 10.5 | GO:0000159 | protein phosphatase type 2A complex(GO:0000159) |
| 0.4 | 33.8 | GO:0043195 | terminal bouton(GO:0043195) |
| 0.4 | 5.1 | GO:0005686 | U2 snRNP(GO:0005686) |
| 0.4 | 31.9 | GO:0005604 | basement membrane(GO:0005604) |
| 0.4 | 5.4 | GO:0097440 | apical dendrite(GO:0097440) |
| 0.4 | 9.7 | GO:0046930 | pore complex(GO:0046930) |
| 0.4 | 7.4 | GO:0005614 | interstitial matrix(GO:0005614) |
| 0.4 | 22.8 | GO:0031463 | Cul3-RING ubiquitin ligase complex(GO:0031463) |
| 0.4 | 5.8 | GO:0042612 | MHC class I protein complex(GO:0042612) |
| 0.4 | 41.5 | GO:0030027 | lamellipodium(GO:0030027) |
| 0.4 | 6.1 | GO:0016581 | NuRD complex(GO:0016581) CHD-type complex(GO:0090545) |
| 0.3 | 5.9 | GO:0002080 | acrosomal membrane(GO:0002080) |
| 0.3 | 3.7 | GO:0005685 | U1 snRNP(GO:0005685) |
| 0.3 | 16.9 | GO:0034707 | chloride channel complex(GO:0034707) |
| 0.3 | 1.0 | GO:0034706 | sodium channel complex(GO:0034706) |
| 0.3 | 5.9 | GO:0032281 | AMPA glutamate receptor complex(GO:0032281) |
| 0.3 | 2.6 | GO:0031616 | spindle pole centrosome(GO:0031616) |
| 0.3 | 1.9 | GO:0030677 | nucleolar ribonuclease P complex(GO:0005655) ribonuclease P complex(GO:0030677) multimeric ribonuclease P complex(GO:0030681) |
| 0.3 | 1.5 | GO:0031501 | mannosyltransferase complex(GO:0031501) |
| 0.3 | 0.9 | GO:0061574 | ASAP complex(GO:0061574) |
| 0.3 | 101.2 | GO:0005813 | centrosome(GO:0005813) |
| 0.3 | 5.2 | GO:0071011 | precatalytic spliceosome(GO:0071011) |
| 0.3 | 25.4 | GO:0031514 | motile cilium(GO:0031514) |
| 0.3 | 20.2 | GO:0019005 | SCF ubiquitin ligase complex(GO:0019005) |
| 0.3 | 5.6 | GO:0045120 | pronucleus(GO:0045120) |
| 0.3 | 11.2 | GO:0045335 | phagocytic vesicle(GO:0045335) |
| 0.3 | 59.3 | GO:0005578 | proteinaceous extracellular matrix(GO:0005578) |
| 0.3 | 2.3 | GO:0045178 | basal part of cell(GO:0045178) |
| 0.3 | 4.8 | GO:0000145 | exocyst(GO:0000145) |
| 0.3 | 1.9 | GO:0030914 | STAGA complex(GO:0030914) |
| 0.3 | 6.0 | GO:0060170 | ciliary membrane(GO:0060170) |
| 0.3 | 0.8 | GO:0005642 | annulate lamellae(GO:0005642) |
| 0.3 | 6.2 | GO:0032420 | stereocilium(GO:0032420) |
| 0.3 | 2.7 | GO:0017119 | Golgi transport complex(GO:0017119) |
| 0.3 | 2.6 | GO:0005890 | sodium:potassium-exchanging ATPase complex(GO:0005890) |
| 0.3 | 17.8 | GO:0008076 | voltage-gated potassium channel complex(GO:0008076) |
| 0.2 | 9.1 | GO:0000779 | condensed chromosome, centromeric region(GO:0000779) |
| 0.2 | 7.3 | GO:0000776 | kinetochore(GO:0000776) |
| 0.2 | 1.6 | GO:0000815 | ESCRT III complex(GO:0000815) |
| 0.2 | 2.5 | GO:0030688 | preribosome, small subunit precursor(GO:0030688) |
| 0.2 | 14.0 | GO:0005811 | lipid particle(GO:0005811) |
| 0.2 | 20.4 | GO:0005815 | microtubule organizing center(GO:0005815) |
| 0.2 | 172.2 | GO:0005887 | integral component of plasma membrane(GO:0005887) |
| 0.2 | 1.6 | GO:0031931 | TORC1 complex(GO:0031931) |
| 0.2 | 1.7 | GO:0031362 | anchored component of external side of plasma membrane(GO:0031362) |
| 0.2 | 2.7 | GO:0035145 | exon-exon junction complex(GO:0035145) |
| 0.2 | 1.5 | GO:0005638 | lamin filament(GO:0005638) |
| 0.2 | 22.0 | GO:0005681 | spliceosomal complex(GO:0005681) |
| 0.2 | 8.1 | GO:0015030 | Cajal body(GO:0015030) |
| 0.2 | 4.2 | GO:0032040 | small-subunit processome(GO:0032040) |
| 0.2 | 10.3 | GO:0043204 | perikaryon(GO:0043204) |
| 0.2 | 22.0 | GO:0043209 | myelin sheath(GO:0043209) |
| 0.2 | 2.9 | GO:0042629 | mast cell granule(GO:0042629) |
| 0.2 | 3.9 | GO:0033017 | sarcoplasmic reticulum membrane(GO:0033017) |
| 0.2 | 3.0 | GO:0030136 | clathrin-coated vesicle(GO:0030136) |
| 0.2 | 1.2 | GO:0034709 | methylosome(GO:0034709) |
| 0.2 | 4.5 | GO:0016235 | aggresome(GO:0016235) |
| 0.1 | 3.3 | GO:0035861 | site of double-strand break(GO:0035861) |
| 0.1 | 5.3 | GO:0043596 | nuclear replication fork(GO:0043596) |
| 0.1 | 4.1 | GO:0043197 | dendritic spine(GO:0043197) neuron spine(GO:0044309) |
| 0.1 | 1.6 | GO:0048188 | Set1C/COMPASS complex(GO:0048188) |
| 0.1 | 8.7 | GO:0001669 | acrosomal vesicle(GO:0001669) |
| 0.1 | 7.4 | GO:0016363 | nuclear matrix(GO:0016363) |
| 0.1 | 0.6 | GO:1990316 | ATG1/ULK1 kinase complex(GO:1990316) |
| 0.1 | 6.8 | GO:0017053 | transcriptional repressor complex(GO:0017053) |
| 0.1 | 8.3 | GO:0031253 | cell projection membrane(GO:0031253) |
| 0.1 | 7.7 | GO:0048475 | membrane coat(GO:0030117) coated membrane(GO:0048475) |
| 0.1 | 2.1 | GO:0043679 | axon terminus(GO:0043679) |
| 0.1 | 7.1 | GO:0022625 | cytosolic large ribosomal subunit(GO:0022625) |
| 0.1 | 4.0 | GO:0030173 | integral component of Golgi membrane(GO:0030173) |
| 0.1 | 1.7 | GO:0016529 | sarcoplasmic reticulum(GO:0016529) |
| 0.1 | 0.9 | GO:1902555 | endoribonuclease complex(GO:1902555) |
| 0.1 | 1.3 | GO:0005847 | mRNA cleavage and polyadenylation specificity factor complex(GO:0005847) |
| 0.1 | 8.5 | GO:0005938 | cell cortex(GO:0005938) |
| 0.1 | 20.8 | GO:0005925 | focal adhesion(GO:0005925) |
| 0.1 | 7.4 | GO:0031234 | extrinsic component of cytoplasmic side of plasma membrane(GO:0031234) |
| 0.1 | 12.3 | GO:0045121 | membrane raft(GO:0045121) membrane microdomain(GO:0098857) |
| 0.1 | 4.9 | GO:0016591 | DNA-directed RNA polymerase II, holoenzyme(GO:0016591) |
| 0.1 | 10.4 | GO:0031012 | extracellular matrix(GO:0031012) |
| 0.1 | 0.3 | GO:0032389 | MutLalpha complex(GO:0032389) |
| 0.1 | 0.3 | GO:0072557 | IPAF inflammasome complex(GO:0072557) |
| 0.1 | 0.9 | GO:0005845 | mRNA cap binding complex(GO:0005845) |
| 0.1 | 12.9 | GO:0016607 | nuclear speck(GO:0016607) |
| 0.1 | 40.4 | GO:0005730 | nucleolus(GO:0005730) |
| 0.1 | 0.3 | GO:0001772 | immunological synapse(GO:0001772) |
| 0.1 | 9.2 | GO:0000790 | nuclear chromatin(GO:0000790) |
| 0.0 | 1.8 | GO:0000932 | cytoplasmic mRNA processing body(GO:0000932) |
| 0.0 | 0.2 | GO:0000127 | transcription factor TFIIIC complex(GO:0000127) |
| 0.0 | 0.1 | GO:0005968 | Rab-protein geranylgeranyltransferase complex(GO:0005968) |
| 0.0 | 0.7 | GO:0031305 | intrinsic component of mitochondrial inner membrane(GO:0031304) integral component of mitochondrial inner membrane(GO:0031305) |
| 0.0 | 0.7 | GO:0016592 | mediator complex(GO:0016592) |
| 0.0 | 0.5 | GO:0031902 | late endosome membrane(GO:0031902) |
| 0.0 | 0.3 | GO:0000118 | histone deacetylase complex(GO:0000118) |
| 0.0 | 0.1 | GO:0098827 | endoplasmic reticulum subcompartment(GO:0098827) |
Gene overrepresentation in molecular function category:
| Log-likelihood per target | Total log-likelihood | Term | Description |
|---|---|---|---|
| 5.7 | 45.7 | GO:1990430 | extracellular matrix protein binding(GO:1990430) |
| 5.5 | 27.3 | GO:0005314 | high-affinity glutamate transmembrane transporter activity(GO:0005314) |
| 5.2 | 62.3 | GO:0019911 | structural constituent of myelin sheath(GO:0019911) |
| 5.1 | 41.0 | GO:0035374 | chondroitin sulfate binding(GO:0035374) |
| 4.8 | 19.3 | GO:0042610 | CD8 receptor binding(GO:0042610) |
| 4.8 | 19.0 | GO:0032896 | stearoyl-CoA 9-desaturase activity(GO:0004768) palmitoyl-CoA 9-desaturase activity(GO:0032896) |
| 4.6 | 32.4 | GO:0038062 | protein tyrosine kinase collagen receptor activity(GO:0038062) |
| 4.3 | 25.8 | GO:0032051 | clathrin light chain binding(GO:0032051) |
| 4.3 | 17.0 | GO:0004949 | cannabinoid receptor activity(GO:0004949) |
| 4.2 | 20.9 | GO:0008332 | low voltage-gated calcium channel activity(GO:0008332) |
| 4.1 | 12.2 | GO:0005294 | neutral L-amino acid secondary active transmembrane transporter activity(GO:0005294) |
| 3.8 | 19.2 | GO:0030229 | very-low-density lipoprotein particle receptor activity(GO:0030229) |
| 3.8 | 19.0 | GO:0004105 | choline-phosphate cytidylyltransferase activity(GO:0004105) |
| 3.7 | 66.7 | GO:0005522 | profilin binding(GO:0005522) |
| 3.7 | 14.8 | GO:0008489 | UDP-galactose:glucosylceramide beta-1,4-galactosyltransferase activity(GO:0008489) |
| 3.5 | 14.0 | GO:0008309 | double-stranded DNA exodeoxyribonuclease activity(GO:0008309) |
| 3.1 | 9.3 | GO:0016403 | dimethylargininase activity(GO:0016403) |
| 3.1 | 15.4 | GO:0015220 | choline transmembrane transporter activity(GO:0015220) |
| 3.1 | 15.4 | GO:0022841 | potassium ion leak channel activity(GO:0022841) |
| 2.9 | 11.7 | GO:0030144 | alpha-1,6-mannosylglycoprotein 6-beta-N-acetylglucosaminyltransferase activity(GO:0030144) |
| 2.9 | 8.7 | GO:0031762 | follicle-stimulating hormone receptor binding(GO:0031762) |
| 2.8 | 8.4 | GO:0015489 | polyamine transmembrane transporter activity(GO:0015203) putrescine transmembrane transporter activity(GO:0015489) |
| 2.7 | 8.2 | GO:0008481 | sphinganine kinase activity(GO:0008481) |
| 2.7 | 8.0 | GO:0001641 | group II metabotropic glutamate receptor activity(GO:0001641) |
| 2.5 | 7.5 | GO:0070976 | TIR domain binding(GO:0070976) |
| 2.5 | 7.4 | GO:0031997 | N-terminal myristoylation domain binding(GO:0031997) calcium ion binding involved in regulation of postsynaptic cytosolic calcium ion concentration(GO:0099567) |
| 2.5 | 14.8 | GO:0061731 | ribonucleoside-diphosphate reductase activity, thioredoxin disulfide as acceptor(GO:0004748) oxidoreductase activity, acting on CH or CH2 groups, disulfide as acceptor(GO:0016728) ribonucleoside-diphosphate reductase activity(GO:0061731) |
| 2.4 | 14.6 | GO:0015189 | L-lysine transmembrane transporter activity(GO:0015189) |
| 2.4 | 9.6 | GO:0008427 | calcium-dependent protein kinase inhibitor activity(GO:0008427) |
| 2.4 | 7.2 | GO:0001565 | phorbol ester receptor activity(GO:0001565) |
| 2.4 | 9.5 | GO:0015265 | urea channel activity(GO:0015265) |
| 2.3 | 9.4 | GO:0000822 | inositol hexakisphosphate binding(GO:0000822) |
| 2.3 | 7.0 | GO:0044736 | acid-sensing ion channel activity(GO:0044736) |
| 2.2 | 9.0 | GO:0060072 | large conductance calcium-activated potassium channel activity(GO:0060072) |
| 2.2 | 11.1 | GO:0070052 | collagen V binding(GO:0070052) |
| 2.1 | 17.1 | GO:0005095 | GTPase inhibitor activity(GO:0005095) |
| 2.1 | 6.3 | GO:0004020 | adenylylsulfate kinase activity(GO:0004020) sulfate adenylyltransferase activity(GO:0004779) sulfate adenylyltransferase (ATP) activity(GO:0004781) |
| 2.1 | 26.8 | GO:0070097 | delta-catenin binding(GO:0070097) |
| 2.1 | 6.2 | GO:0033142 | progesterone receptor binding(GO:0033142) |
| 2.1 | 10.3 | GO:0004416 | hydroxyacylglutathione hydrolase activity(GO:0004416) |
| 2.0 | 8.0 | GO:0003835 | beta-galactoside alpha-2,6-sialyltransferase activity(GO:0003835) |
| 1.9 | 18.9 | GO:0034190 | apolipoprotein receptor binding(GO:0034190) |
| 1.8 | 12.7 | GO:0008273 | calcium, potassium:sodium antiporter activity(GO:0008273) |
| 1.7 | 5.2 | GO:0030297 | transmembrane receptor protein tyrosine kinase activator activity(GO:0030297) |
| 1.7 | 6.8 | GO:0047276 | N-acetyllactosaminide 3-alpha-galactosyltransferase activity(GO:0047276) |
| 1.7 | 20.3 | GO:0008191 | metalloendopeptidase inhibitor activity(GO:0008191) |
| 1.7 | 5.0 | GO:0008330 | protein tyrosine/threonine phosphatase activity(GO:0008330) |
| 1.6 | 9.6 | GO:0031697 | beta-1 adrenergic receptor binding(GO:0031697) |
| 1.6 | 9.5 | GO:0005030 | neurotrophin receptor activity(GO:0005030) |
| 1.6 | 6.3 | GO:0017077 | oxidative phosphorylation uncoupler activity(GO:0017077) |
| 1.6 | 6.3 | GO:0001733 | galactosylceramide sulfotransferase activity(GO:0001733) |
| 1.5 | 18.4 | GO:0017162 | aryl hydrocarbon receptor binding(GO:0017162) |
| 1.5 | 16.8 | GO:0042577 | lipid phosphatase activity(GO:0042577) |
| 1.5 | 10.5 | GO:0045504 | dynein heavy chain binding(GO:0045504) |
| 1.5 | 6.0 | GO:0008109 | N-acetyllactosaminide beta-1,6-N-acetylglucosaminyltransferase activity(GO:0008109) |
| 1.5 | 5.9 | GO:0035614 | snRNA stem-loop binding(GO:0035614) |
| 1.4 | 17.2 | GO:0003841 | 1-acylglycerol-3-phosphate O-acyltransferase activity(GO:0003841) |
| 1.4 | 4.3 | GO:0005113 | patched binding(GO:0005113) |
| 1.4 | 12.6 | GO:0043515 | kinetochore binding(GO:0043515) |
| 1.4 | 11.0 | GO:0004439 | phosphatidylinositol-4,5-bisphosphate 5-phosphatase activity(GO:0004439) |
| 1.4 | 4.1 | GO:1990460 | leptin receptor binding(GO:1990460) |
| 1.4 | 4.1 | GO:0035851 | Krueppel-associated box domain binding(GO:0035851) |
| 1.3 | 9.4 | GO:0004468 | lysine N-acetyltransferase activity, acting on acetyl phosphate as donor(GO:0004468) |
| 1.3 | 15.7 | GO:0003774 | motor activity(GO:0003774) |
| 1.3 | 23.5 | GO:0031005 | filamin binding(GO:0031005) |
| 1.3 | 36.2 | GO:0005540 | hyaluronic acid binding(GO:0005540) |
| 1.3 | 46.0 | GO:0046875 | ephrin receptor binding(GO:0046875) |
| 1.2 | 8.6 | GO:0032041 | histone deacetylase activity (H3-K14 specific)(GO:0031078) NAD-dependent histone deacetylase activity (H3-K14 specific)(GO:0032041) |
| 1.2 | 20.9 | GO:0008331 | high voltage-gated calcium channel activity(GO:0008331) |
| 1.2 | 7.3 | GO:0046935 | 1-phosphatidylinositol-3-kinase regulator activity(GO:0046935) |
| 1.2 | 8.3 | GO:1904047 | S-adenosyl-L-methionine binding(GO:1904047) |
| 1.2 | 18.8 | GO:0008179 | adenylate cyclase binding(GO:0008179) |
| 1.1 | 9.1 | GO:0017070 | U6 snRNA binding(GO:0017070) U4 snRNA binding(GO:0030621) |
| 1.1 | 8.9 | GO:0086006 | voltage-gated sodium channel activity involved in cardiac muscle cell action potential(GO:0086006) |
| 1.1 | 7.6 | GO:0045505 | dynein intermediate chain binding(GO:0045505) |
| 1.1 | 59.2 | GO:0005080 | protein kinase C binding(GO:0005080) |
| 1.1 | 9.6 | GO:0045499 | chemorepellent activity(GO:0045499) |
| 1.1 | 9.5 | GO:1902282 | voltage-gated potassium channel activity involved in ventricular cardiac muscle cell action potential repolarization(GO:1902282) |
| 1.0 | 18.6 | GO:0043395 | heparan sulfate proteoglycan binding(GO:0043395) |
| 1.0 | 8.2 | GO:0035005 | 1-phosphatidylinositol-4-phosphate 3-kinase activity(GO:0035005) |
| 1.0 | 3.1 | GO:0004832 | valine-tRNA ligase activity(GO:0004832) |
| 1.0 | 4.8 | GO:0005005 | transmembrane-ephrin receptor activity(GO:0005005) |
| 1.0 | 13.4 | GO:0030550 | acetylcholine receptor inhibitor activity(GO:0030550) |
| 0.9 | 8.5 | GO:0019992 | diacylglycerol binding(GO:0019992) |
| 0.9 | 14.9 | GO:0035174 | histone serine kinase activity(GO:0035174) |
| 0.9 | 2.8 | GO:0043533 | inositol 1,3,4,5 tetrakisphosphate binding(GO:0043533) |
| 0.9 | 16.7 | GO:0051010 | microtubule plus-end binding(GO:0051010) |
| 0.9 | 16.6 | GO:0032794 | GTPase activating protein binding(GO:0032794) |
| 0.9 | 17.5 | GO:0005248 | voltage-gated sodium channel activity(GO:0005248) voltage-gated ion channel activity involved in regulation of postsynaptic membrane potential(GO:1905030) |
| 0.9 | 11.0 | GO:0004862 | cAMP-dependent protein kinase inhibitor activity(GO:0004862) |
| 0.9 | 4.5 | GO:0005166 | neurotrophin p75 receptor binding(GO:0005166) |
| 0.9 | 2.7 | GO:0097677 | STAT family protein binding(GO:0097677) |
| 0.9 | 4.5 | GO:0036033 | mediator complex binding(GO:0036033) |
| 0.9 | 6.1 | GO:0004111 | creatine kinase activity(GO:0004111) |
| 0.9 | 223.4 | GO:0008017 | microtubule binding(GO:0008017) |
| 0.9 | 2.6 | GO:0032795 | heterotrimeric G-protein binding(GO:0032795) |
| 0.8 | 3.4 | GO:0001884 | pyrimidine nucleoside binding(GO:0001884) deoxynucleoside kinase activity(GO:0019136) |
| 0.8 | 13.2 | GO:0005351 | sugar:proton symporter activity(GO:0005351) |
| 0.8 | 11.5 | GO:0005243 | gap junction channel activity(GO:0005243) |
| 0.8 | 11.4 | GO:0050811 | GABA receptor binding(GO:0050811) |
| 0.8 | 7.9 | GO:0003680 | AT DNA binding(GO:0003680) |
| 0.8 | 3.1 | GO:0061665 | SUMO ligase activity(GO:0061665) |
| 0.8 | 4.6 | GO:0008889 | glycerophosphodiester phosphodiesterase activity(GO:0008889) |
| 0.8 | 9.9 | GO:0005092 | GDP-dissociation inhibitor activity(GO:0005092) |
| 0.8 | 7.6 | GO:0016909 | JUN kinase activity(GO:0004705) SAP kinase activity(GO:0016909) |
| 0.7 | 12.6 | GO:0004535 | poly(A)-specific ribonuclease activity(GO:0004535) |
| 0.7 | 76.7 | GO:0005200 | structural constituent of cytoskeleton(GO:0005200) |
| 0.7 | 35.2 | GO:0005201 | extracellular matrix structural constituent(GO:0005201) |
| 0.7 | 4.4 | GO:0045503 | dynein light chain binding(GO:0045503) |
| 0.7 | 3.7 | GO:0045322 | unmethylated CpG binding(GO:0045322) |
| 0.7 | 6.4 | GO:0030159 | receptor signaling complex scaffold activity(GO:0030159) |
| 0.7 | 42.2 | GO:0019003 | GDP binding(GO:0019003) |
| 0.7 | 10.4 | GO:0008409 | 5'-3' exonuclease activity(GO:0008409) |
| 0.7 | 2.7 | GO:0016300 | tRNA (uracil) methyltransferase activity(GO:0016300) |
| 0.7 | 2.7 | GO:0004609 | phosphatidylserine decarboxylase activity(GO:0004609) |
| 0.7 | 10.1 | GO:0005546 | phosphatidylinositol-4,5-bisphosphate binding(GO:0005546) |
| 0.7 | 5.4 | GO:0070990 | snRNP binding(GO:0070990) U1 snRNP binding(GO:1990446) |
| 0.7 | 5.3 | GO:0004865 | protein serine/threonine phosphatase inhibitor activity(GO:0004865) |
| 0.7 | 9.9 | GO:0043138 | 3'-5' DNA helicase activity(GO:0043138) |
| 0.6 | 5.1 | GO:0015349 | thyroid hormone transmembrane transporter activity(GO:0015349) |
| 0.6 | 2.5 | GO:0004487 | methylenetetrahydrofolate dehydrogenase (NAD+) activity(GO:0004487) |
| 0.6 | 7.5 | GO:0008417 | fucosyltransferase activity(GO:0008417) |
| 0.6 | 11.8 | GO:0015301 | anion:anion antiporter activity(GO:0015301) |
| 0.6 | 8.0 | GO:0034236 | protein kinase A catalytic subunit binding(GO:0034236) |
| 0.6 | 3.7 | GO:0008349 | MAP kinase kinase kinase kinase activity(GO:0008349) |
| 0.6 | 10.4 | GO:0001848 | complement binding(GO:0001848) |
| 0.6 | 6.6 | GO:0005372 | water transmembrane transporter activity(GO:0005372) water channel activity(GO:0015250) |
| 0.6 | 12.4 | GO:0015106 | bicarbonate transmembrane transporter activity(GO:0015106) |
| 0.6 | 3.5 | GO:1990226 | histone methyltransferase binding(GO:1990226) |
| 0.6 | 8.1 | GO:0051400 | BH domain binding(GO:0051400) |
| 0.6 | 5.8 | GO:0000774 | adenyl-nucleotide exchange factor activity(GO:0000774) |
| 0.6 | 2.9 | GO:0017034 | Rap guanyl-nucleotide exchange factor activity(GO:0017034) |
| 0.6 | 8.1 | GO:0017017 | MAP kinase tyrosine/serine/threonine phosphatase activity(GO:0017017) |
| 0.6 | 2.3 | GO:1990254 | keratin filament binding(GO:1990254) |
| 0.6 | 2.8 | GO:0005042 | netrin receptor activity(GO:0005042) |
| 0.6 | 11.2 | GO:0010485 | H4 histone acetyltransferase activity(GO:0010485) |
| 0.5 | 8.2 | GO:0048156 | tau protein binding(GO:0048156) |
| 0.5 | 46.2 | GO:0015631 | tubulin binding(GO:0015631) |
| 0.5 | 3.3 | GO:0050786 | RAGE receptor binding(GO:0050786) |
| 0.5 | 1.6 | GO:0042799 | histone methyltransferase activity (H4-K20 specific)(GO:0042799) |
| 0.5 | 2.7 | GO:0061133 | endopeptidase activator activity(GO:0061133) |
| 0.5 | 4.8 | GO:0004972 | NMDA glutamate receptor activity(GO:0004972) |
| 0.5 | 4.2 | GO:0004565 | beta-galactosidase activity(GO:0004565) |
| 0.5 | 2.6 | GO:0001665 | alpha-N-acetylgalactosaminide alpha-2,6-sialyltransferase activity(GO:0001665) |
| 0.5 | 3.1 | GO:0036310 | annealing helicase activity(GO:0036310) |
| 0.5 | 2.6 | GO:0010385 | double-stranded methylated DNA binding(GO:0010385) |
| 0.5 | 35.6 | GO:0004860 | protein kinase inhibitor activity(GO:0004860) |
| 0.5 | 7.7 | GO:0017049 | GTP-Rho binding(GO:0017049) |
| 0.5 | 2.5 | GO:0089720 | caspase binding(GO:0089720) |
| 0.5 | 2.5 | GO:0015467 | G-protein activated inward rectifier potassium channel activity(GO:0015467) |
| 0.5 | 22.2 | GO:0035255 | ionotropic glutamate receptor binding(GO:0035255) |
| 0.5 | 9.5 | GO:0001134 | transcription factor activity, transcription factor recruiting(GO:0001134) |
| 0.5 | 3.0 | GO:0004749 | ribose phosphate diphosphokinase activity(GO:0004749) |
| 0.5 | 6.0 | GO:0030296 | protein tyrosine kinase activator activity(GO:0030296) |
| 0.5 | 4.9 | GO:0001222 | transcription corepressor binding(GO:0001222) |
| 0.5 | 3.4 | GO:0004065 | arylsulfatase activity(GO:0004065) |
| 0.5 | 6.4 | GO:0000400 | four-way junction DNA binding(GO:0000400) |
| 0.5 | 3.8 | GO:0016308 | 1-phosphatidylinositol-4-phosphate 5-kinase activity(GO:0016308) |
| 0.5 | 11.4 | GO:0001530 | lipopolysaccharide binding(GO:0001530) |
| 0.5 | 4.2 | GO:0003909 | DNA ligase activity(GO:0003909) DNA ligase (ATP) activity(GO:0003910) |
| 0.5 | 8.4 | GO:0080025 | phosphatidylinositol-3,5-bisphosphate binding(GO:0080025) |
| 0.5 | 9.3 | GO:0005035 | tumor necrosis factor-activated receptor activity(GO:0005031) death receptor activity(GO:0005035) |
| 0.5 | 8.8 | GO:0070628 | proteasome binding(GO:0070628) |
| 0.5 | 4.1 | GO:0035612 | AP-2 adaptor complex binding(GO:0035612) |
| 0.5 | 1.4 | GO:0008511 | sodium:potassium:chloride symporter activity(GO:0008511) |
| 0.5 | 22.0 | GO:0042805 | actinin binding(GO:0042805) |
| 0.5 | 10.0 | GO:0004864 | protein phosphatase inhibitor activity(GO:0004864) |
| 0.4 | 11.6 | GO:0017091 | AU-rich element binding(GO:0017091) |
| 0.4 | 4.4 | GO:0005412 | glucose:sodium symporter activity(GO:0005412) |
| 0.4 | 1.8 | GO:0042134 | rRNA primary transcript binding(GO:0042134) |
| 0.4 | 20.1 | GO:0001786 | phosphatidylserine binding(GO:0001786) |
| 0.4 | 2.2 | GO:0004140 | dephospho-CoA kinase activity(GO:0004140) |
| 0.4 | 16.5 | GO:0048365 | Rac GTPase binding(GO:0048365) |
| 0.4 | 5.6 | GO:0017154 | semaphorin receptor activity(GO:0017154) |
| 0.4 | 3.8 | GO:0070016 | armadillo repeat domain binding(GO:0070016) |
| 0.4 | 10.4 | GO:0003785 | actin monomer binding(GO:0003785) |
| 0.4 | 2.1 | GO:0001515 | opioid peptide activity(GO:0001515) |
| 0.4 | 2.9 | GO:0001075 | transcription factor activity, RNA polymerase II core promoter sequence-specific binding involved in preinitiation complex assembly(GO:0001075) |
| 0.4 | 8.5 | GO:0017075 | syntaxin-1 binding(GO:0017075) |
| 0.4 | 2.4 | GO:0019976 | interleukin-2 binding(GO:0019976) |
| 0.4 | 1.6 | GO:0008174 | mRNA methyltransferase activity(GO:0008174) |
| 0.4 | 11.0 | GO:0051183 | vitamin transporter activity(GO:0051183) |
| 0.4 | 7.8 | GO:0004890 | GABA-A receptor activity(GO:0004890) |
| 0.4 | 5.7 | GO:0055106 | ubiquitin-protein transferase regulator activity(GO:0055106) |
| 0.4 | 4.1 | GO:0046703 | natural killer cell lectin-like receptor binding(GO:0046703) |
| 0.4 | 8.1 | GO:0015269 | calcium-activated potassium channel activity(GO:0015269) |
| 0.4 | 2.9 | GO:0004716 | receptor signaling protein tyrosine kinase activity(GO:0004716) |
| 0.4 | 8.7 | GO:0070412 | R-SMAD binding(GO:0070412) |
| 0.4 | 5.0 | GO:0047555 | 3',5'-cyclic-GMP phosphodiesterase activity(GO:0047555) |
| 0.4 | 7.0 | GO:0005229 | intracellular calcium activated chloride channel activity(GO:0005229) |
| 0.3 | 2.8 | GO:0015129 | lactate transmembrane transporter activity(GO:0015129) |
| 0.3 | 2.7 | GO:1990825 | sequence-specific mRNA binding(GO:1990825) |
| 0.3 | 3.3 | GO:0008140 | cAMP response element binding protein binding(GO:0008140) |
| 0.3 | 4.9 | GO:0016493 | C-C chemokine receptor activity(GO:0016493) |
| 0.3 | 1.6 | GO:0004974 | leukotriene receptor activity(GO:0004974) |
| 0.3 | 5.5 | GO:0003950 | NAD+ ADP-ribosyltransferase activity(GO:0003950) |
| 0.3 | 0.6 | GO:0017166 | vinculin binding(GO:0017166) |
| 0.3 | 29.9 | GO:0017124 | SH3 domain binding(GO:0017124) |
| 0.3 | 18.0 | GO:0035064 | methylated histone binding(GO:0035064) |
| 0.3 | 1.5 | GO:0005280 | hydrogen:amino acid symporter activity(GO:0005280) |
| 0.3 | 1.8 | GO:0061578 | Lys63-specific deubiquitinase activity(GO:0061578) |
| 0.3 | 2.4 | GO:0070300 | phosphatidic acid binding(GO:0070300) |
| 0.3 | 0.9 | GO:0005119 | smoothened binding(GO:0005119) |
| 0.3 | 3.3 | GO:0019789 | SUMO transferase activity(GO:0019789) |
| 0.3 | 10.1 | GO:0071855 | neuropeptide receptor binding(GO:0071855) |
| 0.3 | 1.7 | GO:0008035 | high-density lipoprotein particle binding(GO:0008035) |
| 0.3 | 0.9 | GO:0004525 | ribonuclease III activity(GO:0004525) double-stranded RNA-specific ribonuclease activity(GO:0032296) |
| 0.3 | 3.7 | GO:0003688 | DNA replication origin binding(GO:0003688) |
| 0.3 | 1.7 | GO:0001517 | N-acetylglucosamine 6-O-sulfotransferase activity(GO:0001517) chondroitin sulfotransferase activity(GO:0034481) |
| 0.3 | 0.8 | GO:0003921 | GMP synthase activity(GO:0003921) GMP synthase (glutamine-hydrolyzing) activity(GO:0003922) |
| 0.3 | 2.2 | GO:0030368 | interleukin-17 receptor activity(GO:0030368) |
| 0.3 | 5.8 | GO:0005112 | Notch binding(GO:0005112) |
| 0.3 | 5.5 | GO:0005388 | calcium-transporting ATPase activity(GO:0005388) |
| 0.3 | 5.2 | GO:0004622 | lysophospholipase activity(GO:0004622) |
| 0.3 | 0.8 | GO:0046974 | histone methyltransferase activity (H3-K9 specific)(GO:0046974) |
| 0.3 | 1.0 | GO:0016842 | amidine-lyase activity(GO:0016842) |
| 0.3 | 10.5 | GO:0019888 | protein phosphatase regulator activity(GO:0019888) |
| 0.3 | 4.1 | GO:0017160 | Ral GTPase binding(GO:0017160) |
| 0.3 | 7.3 | GO:0015485 | cholesterol binding(GO:0015485) |
| 0.3 | 2.5 | GO:0030215 | semaphorin receptor binding(GO:0030215) |
| 0.2 | 4.0 | GO:0030676 | Rac guanyl-nucleotide exchange factor activity(GO:0030676) |
| 0.2 | 2.2 | GO:0086080 | protein binding involved in heterotypic cell-cell adhesion(GO:0086080) |
| 0.2 | 1.9 | GO:0008440 | inositol-1,4,5-trisphosphate 3-kinase activity(GO:0008440) |
| 0.2 | 2.7 | GO:0042043 | neurexin family protein binding(GO:0042043) |
| 0.2 | 52.7 | GO:0005096 | GTPase activator activity(GO:0005096) |
| 0.2 | 4.3 | GO:0070402 | NADPH binding(GO:0070402) |
| 0.2 | 2.6 | GO:0030955 | potassium ion binding(GO:0030955) |
| 0.2 | 3.0 | GO:0004089 | carbonate dehydratase activity(GO:0004089) |
| 0.2 | 5.7 | GO:0051537 | 2 iron, 2 sulfur cluster binding(GO:0051537) |
| 0.2 | 2.7 | GO:0008097 | 5S rRNA binding(GO:0008097) |
| 0.2 | 4.7 | GO:0042800 | histone methyltransferase activity (H3-K4 specific)(GO:0042800) |
| 0.2 | 1.1 | GO:0000155 | phosphorelay sensor kinase activity(GO:0000155) |
| 0.2 | 0.8 | GO:0016802 | adenosylhomocysteinase activity(GO:0004013) trialkylsulfonium hydrolase activity(GO:0016802) |
| 0.2 | 1.5 | GO:0070679 | inositol 1,4,5 trisphosphate binding(GO:0070679) |
| 0.2 | 1.9 | GO:0031434 | mitogen-activated protein kinase kinase binding(GO:0031434) |
| 0.2 | 3.3 | GO:0032454 | histone demethylase activity (H3-K9 specific)(GO:0032454) |
| 0.2 | 8.8 | GO:0004715 | non-membrane spanning protein tyrosine kinase activity(GO:0004715) |
| 0.2 | 6.6 | GO:0019706 | protein-cysteine S-palmitoyltransferase activity(GO:0019706) protein-cysteine S-acyltransferase activity(GO:0019707) |
| 0.2 | 1.0 | GO:0004144 | 2-acylglycerol O-acyltransferase activity(GO:0003846) diacylglycerol O-acyltransferase activity(GO:0004144) |
| 0.2 | 1.8 | GO:0005159 | insulin-like growth factor receptor binding(GO:0005159) |
| 0.2 | 3.3 | GO:0052866 | phosphatidylinositol phosphate phosphatase activity(GO:0052866) |
| 0.2 | 0.4 | GO:0070573 | metallodipeptidase activity(GO:0070573) |
| 0.2 | 4.7 | GO:0061733 | histone acetyltransferase activity(GO:0004402) peptide-lysine-N-acetyltransferase activity(GO:0061733) |
| 0.2 | 4.8 | GO:0008376 | acetylgalactosaminyltransferase activity(GO:0008376) |
| 0.2 | 6.8 | GO:0003755 | peptidyl-prolyl cis-trans isomerase activity(GO:0003755) |
| 0.2 | 0.8 | GO:0045502 | dynein binding(GO:0045502) |
| 0.2 | 1.1 | GO:0030274 | LIM domain binding(GO:0030274) |
| 0.2 | 3.4 | GO:0003777 | microtubule motor activity(GO:0003777) |
| 0.2 | 14.6 | GO:0004386 | helicase activity(GO:0004386) |
| 0.2 | 0.6 | GO:0070568 | guanylyltransferase activity(GO:0070568) |
| 0.2 | 4.2 | GO:0051019 | mitogen-activated protein kinase binding(GO:0051019) |
| 0.2 | 8.2 | GO:0002039 | p53 binding(GO:0002039) |
| 0.1 | 1.6 | GO:0031210 | phosphatidylcholine binding(GO:0031210) |
| 0.1 | 9.0 | GO:0004843 | thiol-dependent ubiquitin-specific protease activity(GO:0004843) |
| 0.1 | 2.9 | GO:0003746 | translation elongation factor activity(GO:0003746) |
| 0.1 | 4.5 | GO:0005246 | calcium channel regulator activity(GO:0005246) |
| 0.1 | 13.2 | GO:0003705 | transcription factor activity, RNA polymerase II distal enhancer sequence-specific binding(GO:0003705) |
| 0.1 | 5.0 | GO:0008375 | acetylglucosaminyltransferase activity(GO:0008375) |
| 0.1 | 35.1 | GO:0003779 | actin binding(GO:0003779) |
| 0.1 | 2.5 | GO:0005545 | 1-phosphatidylinositol binding(GO:0005545) |
| 0.1 | 1.2 | GO:0005000 | vasopressin receptor activity(GO:0005000) |
| 0.1 | 4.5 | GO:0042162 | telomeric DNA binding(GO:0042162) |
| 0.1 | 2.9 | GO:0005086 | ARF guanyl-nucleotide exchange factor activity(GO:0005086) |
| 0.1 | 1.8 | GO:0071837 | HMG box domain binding(GO:0071837) |
| 0.1 | 5.3 | GO:0034062 | DNA-directed RNA polymerase activity(GO:0003899) RNA polymerase activity(GO:0034062) |
| 0.1 | 1.9 | GO:0071889 | 14-3-3 protein binding(GO:0071889) |
| 0.1 | 3.5 | GO:0004693 | cyclin-dependent protein serine/threonine kinase activity(GO:0004693) |
| 0.1 | 5.6 | GO:1990782 | protein tyrosine kinase binding(GO:1990782) |
| 0.1 | 1.8 | GO:0005161 | platelet-derived growth factor receptor binding(GO:0005161) |
| 0.1 | 4.3 | GO:0003684 | damaged DNA binding(GO:0003684) |
| 0.1 | 1.0 | GO:0022839 | ion gated channel activity(GO:0022839) |
| 0.1 | 1.9 | GO:0070273 | phosphatidylinositol-4-phosphate binding(GO:0070273) |
| 0.1 | 12.4 | GO:0016503 | pheromone receptor activity(GO:0016503) |
| 0.1 | 5.8 | GO:0070888 | E-box binding(GO:0070888) |
| 0.1 | 3.0 | GO:0030544 | Hsp70 protein binding(GO:0030544) |
| 0.1 | 14.4 | GO:0042393 | histone binding(GO:0042393) |
| 0.1 | 4.3 | GO:0016763 | transferase activity, transferring pentosyl groups(GO:0016763) |
| 0.1 | 7.0 | GO:0001948 | glycoprotein binding(GO:0001948) |
| 0.1 | 1.2 | GO:0008190 | eukaryotic initiation factor 4E binding(GO:0008190) |
| 0.1 | 52.4 | GO:0005509 | calcium ion binding(GO:0005509) |
| 0.1 | 1.7 | GO:0001594 | trace-amine receptor activity(GO:0001594) |
| 0.1 | 2.2 | GO:0016755 | transferase activity, transferring amino-acyl groups(GO:0016755) |
| 0.1 | 3.4 | GO:0048306 | calcium-dependent protein binding(GO:0048306) |
| 0.1 | 4.7 | GO:0008146 | sulfotransferase activity(GO:0008146) |
| 0.1 | 3.2 | GO:0030374 | ligand-dependent nuclear receptor transcription coactivator activity(GO:0030374) |
| 0.1 | 1.1 | GO:0008061 | chitin binding(GO:0008061) |
| 0.1 | 4.0 | GO:0019887 | protein kinase regulator activity(GO:0019887) |
| 0.1 | 0.7 | GO:0034511 | U3 snoRNA binding(GO:0034511) |
| 0.1 | 4.6 | GO:0003743 | translation initiation factor activity(GO:0003743) |
| 0.1 | 1.5 | GO:0015299 | solute:proton antiporter activity(GO:0015299) |
| 0.1 | 5.4 | GO:0035091 | phosphatidylinositol binding(GO:0035091) |
| 0.1 | 2.6 | GO:0005109 | frizzled binding(GO:0005109) |
| 0.1 | 2.1 | GO:0000980 | RNA polymerase II distal enhancer sequence-specific DNA binding(GO:0000980) |
| 0.1 | 3.5 | GO:0005262 | calcium channel activity(GO:0005262) |
| 0.1 | 1.5 | GO:0000030 | mannosyltransferase activity(GO:0000030) |
| 0.1 | 0.9 | GO:0033558 | histone deacetylase activity(GO:0004407) protein deacetylase activity(GO:0033558) |
| 0.1 | 0.5 | GO:0070403 | NAD+ binding(GO:0070403) |
| 0.1 | 1.5 | GO:0005104 | fibroblast growth factor receptor binding(GO:0005104) |
| 0.1 | 3.2 | GO:0051082 | unfolded protein binding(GO:0051082) |
| 0.1 | 1.2 | GO:0036002 | pre-mRNA binding(GO:0036002) |
| 0.0 | 0.9 | GO:0015035 | protein disulfide oxidoreductase activity(GO:0015035) |
| 0.0 | 2.2 | GO:0003725 | double-stranded RNA binding(GO:0003725) |
| 0.0 | 0.1 | GO:0052870 | leukotriene-B4 20-monooxygenase activity(GO:0050051) tocopherol omega-hydroxylase activity(GO:0052870) alpha-tocopherol omega-hydroxylase activity(GO:0052871) |
| 0.0 | 0.2 | GO:0070579 | methylcytosine dioxygenase activity(GO:0070579) |
| 0.0 | 0.3 | GO:0030983 | mismatched DNA binding(GO:0030983) |
| 0.0 | 3.2 | GO:0005267 | potassium channel activity(GO:0005267) |
| 0.0 | 0.3 | GO:0097200 | cysteine-type endopeptidase activity involved in execution phase of apoptosis(GO:0097200) |
| 0.0 | 6.7 | GO:0031625 | ubiquitin protein ligase binding(GO:0031625) |
| 0.0 | 5.0 | GO:0045296 | cadherin binding(GO:0045296) |
| 0.0 | 0.2 | GO:0030306 | ADP-ribosylation factor binding(GO:0030306) |
| 0.0 | 0.8 | GO:0008080 | N-acetyltransferase activity(GO:0008080) |
| 0.0 | 0.1 | GO:0005127 | ciliary neurotrophic factor receptor binding(GO:0005127) |
| 0.0 | 0.2 | GO:0004526 | ribonuclease P activity(GO:0004526) |
| 0.0 | 0.1 | GO:0016936 | galactoside binding(GO:0016936) |
| 0.0 | 0.8 | GO:0004197 | cysteine-type endopeptidase activity(GO:0004197) |
Gene overrepresentation in curated gene sets: canonical pathways category:
| Log-likelihood per target | Total log-likelihood | Term | Description |
|---|---|---|---|
| 2.7 | 35.6 | PID P38 GAMMA DELTA PATHWAY | Signaling mediated by p38-gamma and p38-delta |
| 2.2 | 48.6 | PID SYNDECAN 3 PATHWAY | Syndecan-3-mediated signaling events |
| 2.2 | 86.4 | PID LIS1 PATHWAY | Lissencephaly gene (LIS1) in neuronal migration and development |
| 2.0 | 75.1 | ST WNT BETA CATENIN PATHWAY | Wnt/beta-catenin Pathway |
| 1.6 | 33.3 | PID INTEGRIN5 PATHWAY | Beta5 beta6 beta7 and beta8 integrin cell surface interactions |
| 1.1 | 47.5 | PID AURORA B PATHWAY | Aurora B signaling |
| 1.0 | 1.9 | ST PAC1 RECEPTOR PATHWAY | PAC1 Receptor Pathway |
| 1.0 | 47.0 | NABA COLLAGENS | Genes encoding collagen proteins |
| 0.9 | 9.6 | ST FAS SIGNALING PATHWAY | Fas Signaling Pathway |
| 0.8 | 9.7 | PID P75 NTR PATHWAY | p75(NTR)-mediated signaling |
| 0.8 | 17.3 | PID TOLL ENDOGENOUS PATHWAY | Endogenous TLR signaling |
| 0.7 | 7.1 | PID ANTHRAX PATHWAY | Cellular roles of Anthrax toxin |
| 0.7 | 25.9 | PID THROMBIN PAR1 PATHWAY | PAR1-mediated thrombin signaling events |
| 0.6 | 31.7 | PID EPHB FWD PATHWAY | EPHB forward signaling |
| 0.6 | 8.2 | PID S1P S1P1 PATHWAY | S1P1 pathway |
| 0.6 | 4.9 | ST IL 13 PATHWAY | Interleukin 13 (IL-13) Pathway |
| 0.6 | 24.1 | ST DIFFERENTIATION PATHWAY IN PC12 CELLS | Differentiation Pathway in PC12 Cells; this is a specific case of PAC1 Receptor Pathway. |
| 0.6 | 34.0 | PID TRKR PATHWAY | Neurotrophic factor-mediated Trk receptor signaling |
| 0.6 | 5.3 | PID IL8 CXCR1 PATHWAY | IL8- and CXCR1-mediated signaling events |
| 0.6 | 5.7 | PID IL5 PATHWAY | IL5-mediated signaling events |
| 0.6 | 13.4 | PID GLYPICAN 1PATHWAY | Glypican 1 network |
| 0.6 | 20.0 | NABA BASEMENT MEMBRANES | Genes encoding structural components of basement membranes |
| 0.5 | 28.2 | PID RHOA REG PATHWAY | Regulation of RhoA activity |
| 0.5 | 13.0 | ST B CELL ANTIGEN RECEPTOR | B Cell Antigen Receptor |
| 0.5 | 12.8 | PID ALPHA SYNUCLEIN PATHWAY | Alpha-synuclein signaling |
| 0.4 | 7.3 | PID TRAIL PATHWAY | TRAIL signaling pathway |
| 0.4 | 2.4 | ST INTERLEUKIN 4 PATHWAY | Interleukin 4 (IL-4) Pathway |
| 0.4 | 22.0 | PID CDC42 PATHWAY | CDC42 signaling events |
| 0.4 | 5.1 | ST TUMOR NECROSIS FACTOR PATHWAY | Tumor Necrosis Factor Pathway. |
| 0.4 | 6.2 | PID RAC1 REG PATHWAY | Regulation of RAC1 activity |
| 0.4 | 3.7 | PID AMB2 NEUTROPHILS PATHWAY | amb2 Integrin signaling |
| 0.4 | 6.3 | PID ARF6 PATHWAY | Arf6 signaling events |
| 0.4 | 3.7 | PID NCADHERIN PATHWAY | N-cadherin signaling events |
| 0.4 | 4.2 | PID PI3K PLC TRK PATHWAY | Trk receptor signaling mediated by PI3K and PLC-gamma |
| 0.3 | 3.6 | SA MMP CYTOKINE CONNECTION | Cytokines can induce activation of matrix metalloproteinases, which degrade extracellular matrix. |
| 0.3 | 1.0 | PID TCR JNK PATHWAY | JNK signaling in the CD4+ TCR pathway |
| 0.3 | 2.6 | PID MAPK TRK PATHWAY | Trk receptor signaling mediated by the MAPK pathway |
| 0.3 | 5.8 | PID P38 MK2 PATHWAY | p38 signaling mediated by MAPKAP kinases |
| 0.3 | 8.4 | SIG REGULATION OF THE ACTIN CYTOSKELETON BY RHO GTPASES | Genes related to regulation of the actin cytoskeleton |
| 0.3 | 5.0 | ST ERK1 ERK2 MAPK PATHWAY | ERK1/ERK2 MAPK Pathway |
| 0.3 | 20.6 | PID REG GR PATHWAY | Glucocorticoid receptor regulatory network |
| 0.3 | 6.8 | PID FCER1 PATHWAY | Fc-epsilon receptor I signaling in mast cells |
| 0.3 | 2.4 | SIG IL4RECEPTOR IN B LYPHOCYTES | Genes related to IL4 rceptor signaling in B lymphocytes |
| 0.3 | 12.1 | PID LKB1 PATHWAY | LKB1 signaling events |
| 0.3 | 9.9 | PID PDGFRB PATHWAY | PDGFR-beta signaling pathway |
| 0.2 | 2.7 | SA G1 AND S PHASES | Cdk2, 4, and 6 bind cyclin D in G1, while cdk2/cyclin E promotes the G1/S transition. |
| 0.2 | 6.5 | PID TNF PATHWAY | TNF receptor signaling pathway |
| 0.2 | 39.3 | NABA ECM GLYCOPROTEINS | Genes encoding structural ECM glycoproteins |
| 0.2 | 9.7 | PID CXCR4 PATHWAY | CXCR4-mediated signaling events |
| 0.2 | 10.3 | PID BMP PATHWAY | BMP receptor signaling |
| 0.2 | 5.0 | PID IL6 7 PATHWAY | IL6-mediated signaling events |
| 0.2 | 12.6 | PID ERA GENOMIC PATHWAY | Validated nuclear estrogen receptor alpha network |
| 0.2 | 3.3 | PID DNA PK PATHWAY | DNA-PK pathway in nonhomologous end joining |
| 0.2 | 4.1 | PID RHOA PATHWAY | RhoA signaling pathway |
| 0.2 | 2.5 | ST ADRENERGIC | Adrenergic Pathway |
| 0.2 | 2.3 | PID WNT CANONICAL PATHWAY | Canonical Wnt signaling pathway |
| 0.2 | 3.4 | PID FRA PATHWAY | Validated transcriptional targets of AP1 family members Fra1 and Fra2 |
| 0.2 | 0.8 | SA PROGRAMMED CELL DEATH | Programmed cell death, or apoptosis, eliminates damaged or unneeded cells. |
| 0.2 | 5.2 | PID HEDGEHOG GLI PATHWAY | Hedgehog signaling events mediated by Gli proteins |
| 0.1 | 3.3 | PID MTOR 4PATHWAY | mTOR signaling pathway |
| 0.1 | 3.8 | PID ILK PATHWAY | Integrin-linked kinase signaling |
| 0.1 | 4.3 | PID HIF2PATHWAY | HIF-2-alpha transcription factor network |
| 0.1 | 1.6 | PID EPHA FWDPATHWAY | EPHA forward signaling |
| 0.1 | 3.6 | PID ENDOTHELIN PATHWAY | Endothelins |
| 0.1 | 1.9 | PID ERBB2 ERBB3 PATHWAY | ErbB2/ErbB3 signaling events |
| 0.1 | 2.2 | PID P38 MKK3 6PATHWAY | p38 MAPK signaling pathway |
| 0.1 | 4.1 | PID CASPASE PATHWAY | Caspase cascade in apoptosis |
| 0.1 | 1.2 | PID AURORA A PATHWAY | Aurora A signaling |
| 0.1 | 1.5 | PID PI3KCI PATHWAY | Class I PI3K signaling events |
| 0.1 | 3.3 | PID ATM PATHWAY | ATM pathway |
| 0.1 | 1.3 | PID ECADHERIN STABILIZATION PATHWAY | Stabilization and expansion of the E-cadherin adherens junction |
| 0.1 | 2.5 | PID ARF6 TRAFFICKING PATHWAY | Arf6 trafficking events |
| 0.1 | 1.4 | PID CIRCADIAN PATHWAY | Circadian rhythm pathway |
| 0.1 | 2.4 | PID AR TF PATHWAY | Regulation of Androgen receptor activity |
| 0.1 | 0.5 | PID RANBP2 PATHWAY | Sumoylation by RanBP2 regulates transcriptional repression |
| 0.1 | 0.5 | PID MET PATHWAY | Signaling events mediated by Hepatocyte Growth Factor Receptor (c-Met) |
| 0.1 | 0.7 | PID ATF2 PATHWAY | ATF-2 transcription factor network |
| 0.1 | 0.6 | PID SHP2 PATHWAY | SHP2 signaling |
| 0.0 | 2.2 | PID E2F PATHWAY | E2F transcription factor network |
| 0.0 | 6.1 | NABA SECRETED FACTORS | Genes encoding secreted soluble factors |
| 0.0 | 0.6 | PID NOTCH PATHWAY | Notch signaling pathway |
Gene overrepresentation in curated gene sets: REACTOME pathways category:
| Log-likelihood per target | Total log-likelihood | Term | Description |
|---|---|---|---|
| 3.2 | 58.2 | REACTOME CRMPS IN SEMA3A SIGNALING | Genes involved in CRMPs in Sema3A signaling |
| 2.6 | 21.2 | REACTOME NEGATIVE REGULATION OF THE PI3K AKT NETWORK | Genes involved in Negative regulation of the PI3K/AKT network |
| 2.3 | 41.2 | REACTOME POST CHAPERONIN TUBULIN FOLDING PATHWAY | Genes involved in Post-chaperonin tubulin folding pathway |
| 2.1 | 20.5 | REACTOME REGULATION OF INSULIN SECRETION BY ACETYLCHOLINE | Genes involved in Regulation of Insulin Secretion by Acetylcholine |
| 2.0 | 23.8 | REACTOME PLATELET ADHESION TO EXPOSED COLLAGEN | Genes involved in Platelet Adhesion to exposed collagen |
| 1.8 | 3.5 | REACTOME SIGNALLING TO P38 VIA RIT AND RIN | Genes involved in Signalling to p38 via RIT and RIN |
| 1.6 | 26.1 | REACTOME ACETYLCHOLINE NEUROTRANSMITTER RELEASE CYCLE | Genes involved in Acetylcholine Neurotransmitter Release Cycle |
| 1.6 | 43.6 | REACTOME GENERATION OF SECOND MESSENGER MOLECULES | Genes involved in Generation of second messenger molecules |
| 1.4 | 17.9 | REACTOME TANDEM PORE DOMAIN POTASSIUM CHANNELS | Genes involved in Tandem pore domain potassium channels |
| 1.3 | 10.2 | REACTOME PECAM1 INTERACTIONS | Genes involved in PECAM1 interactions |
| 1.2 | 49.9 | REACTOME NCAM1 INTERACTIONS | Genes involved in NCAM1 interactions |
| 1.2 | 24.7 | REACTOME RNA POL III CHAIN ELONGATION | Genes involved in RNA Polymerase III Chain Elongation |
| 1.2 | 17.3 | REACTOME CS DS DEGRADATION | Genes involved in CS/DS degradation |
| 1.2 | 21.5 | REACTOME PLATELET SENSITIZATION BY LDL | Genes involved in Platelet sensitization by LDL |
| 1.2 | 18.9 | REACTOME REGULATION OF SIGNALING BY CBL | Genes involved in Regulation of signaling by CBL |
| 1.2 | 19.8 | REACTOME N GLYCAN ANTENNAE ELONGATION | Genes involved in N-Glycan antennae elongation |
| 1.1 | 9.9 | REACTOME MEMBRANE BINDING AND TARGETTING OF GAG PROTEINS | Genes involved in Membrane binding and targetting of GAG proteins |
| 1.1 | 11.8 | REACTOME SIGNALING BY SCF KIT | Genes involved in Signaling by SCF-KIT |
| 1.1 | 24.2 | REACTOME SYNTHESIS OF PC | Genes involved in Synthesis of PC |
| 1.0 | 5.2 | REACTOME APC C CDH1 MEDIATED DEGRADATION OF CDC20 AND OTHER APC C CDH1 TARGETED PROTEINS IN LATE MITOSIS EARLY G1 | Genes involved in APC/C:Cdh1 mediated degradation of Cdc20 and other APC/C:Cdh1 targeted proteins in late mitosis/early G1 |
| 1.0 | 31.8 | REACTOME KINESINS | Genes involved in Kinesins |
| 1.0 | 8.6 | REACTOME SIGNAL ATTENUATION | Genes involved in Signal attenuation |
| 0.9 | 7.6 | REACTOME NEF MEDIATED DOWNREGULATION OF MHC CLASS I COMPLEX CELL SURFACE EXPRESSION | Genes involved in Nef mediated downregulation of MHC class I complex cell surface expression |
| 0.9 | 37.1 | REACTOME SIGNALING BY ROBO RECEPTOR | Genes involved in Signaling by Robo receptor |
| 0.9 | 10.2 | REACTOME SYNTHESIS OF PIPS AT THE LATE ENDOSOME MEMBRANE | Genes involved in Synthesis of PIPs at the late endosome membrane |
| 0.9 | 5.3 | REACTOME SIGNALING BY CONSTITUTIVELY ACTIVE EGFR | Genes involved in Signaling by constitutively active EGFR |
| 0.9 | 11.3 | REACTOME ACTIVATION OF THE AP1 FAMILY OF TRANSCRIPTION FACTORS | Genes involved in Activation of the AP-1 family of transcription factors |
| 0.9 | 11.1 | REACTOME TIE2 SIGNALING | Genes involved in Tie2 Signaling |
| 0.8 | 3.4 | REACTOME GAP JUNCTION DEGRADATION | Genes involved in Gap junction degradation |
| 0.8 | 2.4 | REACTOME MAPK TARGETS NUCLEAR EVENTS MEDIATED BY MAP KINASES | Genes involved in MAPK targets/ Nuclear events mediated by MAP kinases |
| 0.8 | 1.6 | REACTOME MRNA CAPPING | Genes involved in mRNA Capping |
| 0.8 | 8.3 | REACTOME UNWINDING OF DNA | Genes involved in Unwinding of DNA |
| 0.7 | 7.4 | REACTOME TETRAHYDROBIOPTERIN BH4 SYNTHESIS RECYCLING SALVAGE AND REGULATION | Genes involved in Tetrahydrobiopterin (BH4) synthesis, recycling, salvage and regulation |
| 0.7 | 10.4 | REACTOME REGULATION OF COMPLEMENT CASCADE | Genes involved in Regulation of Complement cascade |
| 0.7 | 1.5 | REACTOME PEPTIDE CHAIN ELONGATION | Genes involved in Peptide chain elongation |
| 0.7 | 10.1 | REACTOME CELL EXTRACELLULAR MATRIX INTERACTIONS | Genes involved in Cell-extracellular matrix interactions |
| 0.7 | 5.0 | REACTOME ERKS ARE INACTIVATED | Genes involved in ERKs are inactivated |
| 0.7 | 18.0 | REACTOME ACTIVATED NOTCH1 TRANSMITS SIGNAL TO THE NUCLEUS | Genes involved in Activated NOTCH1 Transmits Signal to the Nucleus |
| 0.7 | 13.1 | REACTOME DEGRADATION OF THE EXTRACELLULAR MATRIX | Genes involved in Degradation of the extracellular matrix |
| 0.7 | 7.8 | REACTOME ARMS MEDIATED ACTIVATION | Genes involved in ARMS-mediated activation |
| 0.7 | 37.7 | REACTOME AMINO ACID AND OLIGOPEPTIDE SLC TRANSPORTERS | Genes involved in Amino acid and oligopeptide SLC transporters |
| 0.6 | 18.8 | REACTOME NITRIC OXIDE STIMULATES GUANYLATE CYCLASE | Genes involved in Nitric oxide stimulates guanylate cyclase |
| 0.6 | 2.6 | REACTOME ERK MAPK TARGETS | Genes involved in ERK/MAPK targets |
| 0.6 | 41.9 | REACTOME INTEGRIN CELL SURFACE INTERACTIONS | Genes involved in Integrin cell surface interactions |
| 0.6 | 8.2 | REACTOME CYTOSOLIC SULFONATION OF SMALL MOLECULES | Genes involved in Cytosolic sulfonation of small molecules |
| 0.6 | 10.1 | REACTOME NEPHRIN INTERACTIONS | Genes involved in Nephrin interactions |
| 0.6 | 47.2 | REACTOME L1CAM INTERACTIONS | Genes involved in L1CAM interactions |
| 0.6 | 9.2 | REACTOME ACYL CHAIN REMODELLING OF PC | Genes involved in Acyl chain remodelling of PC |
| 0.6 | 5.3 | REACTOME HYALURONAN UPTAKE AND DEGRADATION | Genes involved in Hyaluronan uptake and degradation |
| 0.6 | 33.7 | REACTOME TRANSPORT OF INORGANIC CATIONS ANIONS AND AMINO ACIDS OLIGOPEPTIDES | Genes involved in Transport of inorganic cations/anions and amino acids/oligopeptides |
| 0.6 | 18.3 | REACTOME SYNTHESIS OF PA | Genes involved in Synthesis of PA |
| 0.6 | 33.5 | REACTOME LOSS OF NLP FROM MITOTIC CENTROSOMES | Genes involved in Loss of Nlp from mitotic centrosomes |
| 0.6 | 8.1 | REACTOME OTHER SEMAPHORIN INTERACTIONS | Genes involved in Other semaphorin interactions |
| 0.6 | 6.8 | REACTOME SYNTHESIS OF PIPS AT THE GOLGI MEMBRANE | Genes involved in Synthesis of PIPs at the Golgi membrane |
| 0.6 | 4.0 | REACTOME ENOS ACTIVATION AND REGULATION | Genes involved in eNOS activation and regulation |
| 0.6 | 12.9 | REACTOME REGULATION OF GENE EXPRESSION IN BETA CELLS | Genes involved in Regulation of gene expression in beta cells |
| 0.6 | 6.6 | REACTOME PASSIVE TRANSPORT BY AQUAPORINS | Genes involved in Passive Transport by Aquaporins |
| 0.5 | 8.7 | REACTOME REGULATION OF AMPK ACTIVITY VIA LKB1 | Genes involved in Regulation of AMPK activity via LKB1 |
| 0.5 | 21.9 | REACTOME COLLAGEN FORMATION | Genes involved in Collagen formation |
| 0.5 | 15.9 | REACTOME INHIBITION OF VOLTAGE GATED CA2 CHANNELS VIA GBETA GAMMA SUBUNITS | Genes involved in Inhibition of voltage gated Ca2+ channels via Gbeta/gamma subunits |
| 0.5 | 24.6 | REACTOME O LINKED GLYCOSYLATION OF MUCINS | Genes involved in O-linked glycosylation of mucins |
| 0.5 | 5.1 | REACTOME TRANSPORT OF ORGANIC ANIONS | Genes involved in Transport of organic anions |
| 0.5 | 9.6 | REACTOME G1 S SPECIFIC TRANSCRIPTION | Genes involved in G1/S-Specific Transcription |
| 0.5 | 5.4 | REACTOME SLBP DEPENDENT PROCESSING OF REPLICATION DEPENDENT HISTONE PRE MRNAS | Genes involved in SLBP Dependent Processing of Replication-Dependent Histone Pre-mRNAs |
| 0.5 | 9.2 | REACTOME RESOLUTION OF AP SITES VIA THE MULTIPLE NUCLEOTIDE PATCH REPLACEMENT PATHWAY | Genes involved in Resolution of AP sites via the multiple-nucleotide patch replacement pathway |
| 0.5 | 7.8 | REACTOME GABA A RECEPTOR ACTIVATION | Genes involved in GABA A receptor activation |
| 0.4 | 7.6 | REACTOME GAP JUNCTION ASSEMBLY | Genes involved in Gap junction assembly |
| 0.4 | 7.1 | REACTOME G0 AND EARLY G1 | Genes involved in G0 and Early G1 |
| 0.4 | 5.2 | REACTOME GPVI MEDIATED ACTIVATION CASCADE | Genes involved in GPVI-mediated activation cascade |
| 0.4 | 6.8 | REACTOME DARPP 32 EVENTS | Genes involved in DARPP-32 events |
| 0.4 | 2.7 | REACTOME RAP1 SIGNALLING | Genes involved in Rap1 signalling |
| 0.4 | 3.4 | REACTOME THE ACTIVATION OF ARYLSULFATASES | Genes involved in The activation of arylsulfatases |
| 0.4 | 8.2 | REACTOME SYNTHESIS OF PIPS AT THE PLASMA MEMBRANE | Genes involved in Synthesis of PIPs at the plasma membrane |
| 0.4 | 5.4 | REACTOME FACILITATIVE NA INDEPENDENT GLUCOSE TRANSPORTERS | Genes involved in Facilitative Na+-independent glucose transporters |
| 0.4 | 45.8 | REACTOME SIGNALING BY RHO GTPASES | Genes involved in Signaling by Rho GTPases |
| 0.3 | 8.0 | REACTOME DEADENYLATION OF MRNA | Genes involved in Deadenylation of mRNA |
| 0.3 | 6.3 | REACTOME CA DEPENDENT EVENTS | Genes involved in Ca-dependent events |
| 0.3 | 5.5 | REACTOME PRE NOTCH PROCESSING IN GOLGI | Genes involved in Pre-NOTCH Processing in Golgi |
| 0.3 | 2.5 | REACTOME RNA POL III TRANSCRIPTION INITIATION FROM TYPE 3 PROMOTER | Genes involved in RNA Polymerase III Transcription Initiation From Type 3 Promoter |
| 0.3 | 3.5 | REACTOME HS GAG DEGRADATION | Genes involved in HS-GAG degradation |
| 0.3 | 3.8 | REACTOME ELONGATION ARREST AND RECOVERY | Genes involved in Elongation arrest and recovery |
| 0.3 | 3.9 | REACTOME SEROTONIN RECEPTORS | Genes involved in Serotonin receptors |
| 0.3 | 10.6 | REACTOME PROTEIN FOLDING | Genes involved in Protein folding |
| 0.3 | 2.6 | REACTOME SIGNALING BY FGFR1 FUSION MUTANTS | Genes involved in Signaling by FGFR1 fusion mutants |
| 0.3 | 1.8 | REACTOME HORMONE SENSITIVE LIPASE HSL MEDIATED TRIACYLGLYCEROL HYDROLYSIS | Genes involved in Hormone-sensitive lipase (HSL)-mediated triacylglycerol hydrolysis |
| 0.2 | 6.8 | REACTOME CHONDROITIN SULFATE DERMATAN SULFATE METABOLISM | Genes involved in Chondroitin sulfate/dermatan sulfate metabolism |
| 0.2 | 5.8 | REACTOME DOWNREGULATION OF TGF BETA RECEPTOR SIGNALING | Genes involved in Downregulation of TGF-beta receptor signaling |
| 0.2 | 6.3 | REACTOME GLYCOSPHINGOLIPID METABOLISM | Genes involved in Glycosphingolipid metabolism |
| 0.2 | 1.4 | REACTOME HYALURONAN METABOLISM | Genes involved in Hyaluronan metabolism |
| 0.2 | 1.4 | REACTOME DSCAM INTERACTIONS | Genes involved in DSCAM interactions |
| 0.2 | 25.4 | REACTOME MRNA SPLICING | Genes involved in mRNA Splicing |
| 0.2 | 3.6 | REACTOME ANTIGEN ACTIVATES B CELL RECEPTOR LEADING TO GENERATION OF SECOND MESSENGERS | Genes involved in Antigen Activates B Cell Receptor Leading to Generation of Second Messengers |
| 0.2 | 5.0 | REACTOME AMINE COMPOUND SLC TRANSPORTERS | Genes involved in Amine compound SLC transporters |
| 0.2 | 2.4 | REACTOME IL 7 SIGNALING | Genes involved in Interleukin-7 signaling |
| 0.2 | 3.4 | REACTOME PURINE SALVAGE | Genes involved in Purine salvage |
| 0.2 | 2.9 | REACTOME BASIGIN INTERACTIONS | Genes involved in Basigin interactions |
| 0.2 | 1.2 | REACTOME AQUAPORIN MEDIATED TRANSPORT | Genes involved in Aquaporin-mediated transport |
| 0.2 | 6.1 | REACTOME P75 NTR RECEPTOR MEDIATED SIGNALLING | Genes involved in p75 NTR receptor-mediated signalling |
| 0.2 | 4.0 | REACTOME INSULIN SYNTHESIS AND PROCESSING | Genes involved in Insulin Synthesis and Processing |
| 0.2 | 2.4 | REACTOME REGULATION OF IFNG SIGNALING | Genes involved in Regulation of IFNG signaling |
| 0.2 | 3.5 | REACTOME CLASS C 3 METABOTROPIC GLUTAMATE PHEROMONE RECEPTORS | Genes involved in Class C/3 (Metabotropic glutamate/pheromone receptors) |
| 0.2 | 7.8 | REACTOME ACTIVATION OF CHAPERONE GENES BY XBP1S | Genes involved in Activation of Chaperone Genes by XBP1(S) |
| 0.2 | 0.9 | REACTOME MICRORNA MIRNA BIOGENESIS | Genes involved in MicroRNA (miRNA) Biogenesis |
| 0.2 | 2.8 | REACTOME RNA POL I TRANSCRIPTION TERMINATION | Genes involved in RNA Polymerase I Transcription Termination |
| 0.1 | 5.5 | REACTOME ION TRANSPORT BY P TYPE ATPASES | Genes involved in Ion transport by P-type ATPases |
| 0.1 | 3.3 | REACTOME RNA POL I PROMOTER OPENING | Genes involved in RNA Polymerase I Promoter Opening |
| 0.1 | 5.4 | REACTOME GOLGI ASSOCIATED VESICLE BIOGENESIS | Genes involved in Golgi Associated Vesicle Biogenesis |
| 0.1 | 4.6 | REACTOME NGF SIGNALLING VIA TRKA FROM THE PLASMA MEMBRANE | Genes involved in NGF signalling via TRKA from the plasma membrane |
| 0.1 | 8.3 | REACTOME POTASSIUM CHANNELS | Genes involved in Potassium Channels |
| 0.1 | 1.8 | REACTOME REGULATION OF INSULIN LIKE GROWTH FACTOR IGF ACTIVITY BY INSULIN LIKE GROWTH FACTOR BINDING PROTEINS IGFBPS | Genes involved in Regulation of Insulin-like Growth Factor (IGF) Activity by Insulin-like Growth Factor Binding Proteins (IGFBPs) |
| 0.1 | 3.1 | REACTOME CYTOSOLIC TRNA AMINOACYLATION | Genes involved in Cytosolic tRNA aminoacylation |
| 0.1 | 1.5 | REACTOME FGFR1 LIGAND BINDING AND ACTIVATION | Genes involved in FGFR1 ligand binding and activation |
| 0.1 | 1.7 | REACTOME ZINC TRANSPORTERS | Genes involved in Zinc transporters |
| 0.1 | 4.4 | REACTOME METABOLISM OF NON CODING RNA | Genes involved in Metabolism of non-coding RNA |
| 0.1 | 3.5 | REACTOME REGULATION OF INSULIN SECRETION | Genes involved in Regulation of Insulin Secretion |
| 0.1 | 0.7 | REACTOME ROLE OF DCC IN REGULATING APOPTOSIS | Genes involved in Role of DCC in regulating apoptosis |
| 0.1 | 3.4 | REACTOME MEIOTIC SYNAPSIS | Genes involved in Meiotic Synapsis |
| 0.1 | 1.3 | REACTOME MRNA DECAY BY 5 TO 3 EXORIBONUCLEASE | Genes involved in mRNA Decay by 5' to 3' Exoribonuclease |
| 0.1 | 2.1 | REACTOME NOD1 2 SIGNALING PATHWAY | Genes involved in NOD1/2 Signaling Pathway |
| 0.1 | 1.5 | REACTOME SYNTHESIS OF GLYCOSYLPHOSPHATIDYLINOSITOL GPI | Genes involved in Synthesis of glycosylphosphatidylinositol (GPI) |
| 0.1 | 1.9 | REACTOME INSULIN RECEPTOR RECYCLING | Genes involved in Insulin receptor recycling |
| 0.1 | 1.5 | REACTOME HOMOLOGOUS RECOMBINATION REPAIR OF REPLICATION INDEPENDENT DOUBLE STRAND BREAKS | Genes involved in Homologous recombination repair of replication-independent double-strand breaks |
| 0.1 | 0.5 | REACTOME G PROTEIN ACTIVATION | Genes involved in G-protein activation |
| 0.1 | 1.6 | REACTOME SIGNALING BY BMP | Genes involved in Signaling by BMP |
| 0.1 | 0.8 | REACTOME PURINE RIBONUCLEOSIDE MONOPHOSPHATE BIOSYNTHESIS | Genes involved in Purine ribonucleoside monophosphate biosynthesis |
| 0.1 | 1.1 | REACTOME CONVERSION FROM APC C CDC20 TO APC C CDH1 IN LATE ANAPHASE | Genes involved in Conversion from APC/C:Cdc20 to APC/C:Cdh1 in late anaphase |
| 0.1 | 0.8 | REACTOME EICOSANOID LIGAND BINDING RECEPTORS | Genes involved in Eicosanoid ligand-binding receptors |
| 0.1 | 0.3 | REACTOME CROSS PRESENTATION OF SOLUBLE EXOGENOUS ANTIGENS ENDOSOMES | Genes involved in Cross-presentation of soluble exogenous antigens (endosomes) |
| 0.1 | 2.6 | REACTOME CHEMOKINE RECEPTORS BIND CHEMOKINES | Genes involved in Chemokine receptors bind chemokines |
| 0.1 | 0.9 | REACTOME INFLAMMASOMES | Genes involved in Inflammasomes |
| 0.0 | 1.9 | REACTOME NOTCH1 INTRACELLULAR DOMAIN REGULATES TRANSCRIPTION | Genes involved in NOTCH1 Intracellular Domain Regulates Transcription |
| 0.0 | 0.3 | REACTOME DOWNREGULATION OF SMAD2 3 SMAD4 TRANSCRIPTIONAL ACTIVITY | Genes involved in Downregulation of SMAD2/3:SMAD4 transcriptional activity |
| 0.0 | 1.2 | REACTOME MHC CLASS II ANTIGEN PRESENTATION | Genes involved in MHC class II antigen presentation |
| 0.0 | 1.4 | REACTOME TRANSLATION | Genes involved in Translation |
| 0.0 | 0.2 | REACTOME RNA POL III TRANSCRIPTION INITIATION FROM TYPE 2 PROMOTER | Genes involved in RNA Polymerase III Transcription Initiation From Type 2 Promoter |
| 0.0 | 0.4 | REACTOME MEIOSIS | Genes involved in Meiosis |