Project
GSE53960: rat RNA-Seq transcriptomic Bodymap
Navigation
Downloads
Results for Sox15
Z-value: 0.32
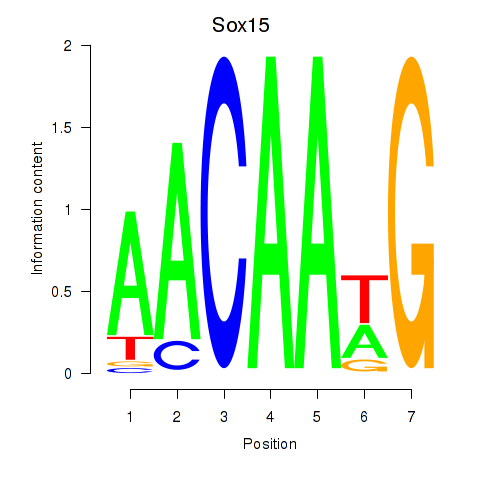
Motif logo
Transcription factors associated with Sox15
| Gene Symbol | Gene ID | Gene Info |
|---|---|---|
|
Sox15
|
ENSRNOG00000012155 | SRY box 15 |
Activity profile of Sox15 motif
Sorted Z-values of Sox15 motif
| Promoter | Log-likelihood | Transcript | Gene | Gene Info |
|---|---|---|---|---|
| chr18_+_79406381 | 29.86 |
ENSRNOT00000022303
ENSRNOT00000058295 ENSRNOT00000058296 ENSRNOT00000022280 |
Mbp
|
myelin basic protein |
| chr5_+_49311030 | 17.89 |
ENSRNOT00000010850
|
Cnr1
|
cannabinoid receptor 1 |
| chr3_+_35014538 | 15.53 |
ENSRNOT00000006341
|
Kif5c
|
kinesin family member 5C |
| chr16_-_39476025 | 14.99 |
ENSRNOT00000014312
|
Gpm6a
|
glycoprotein m6a |
| chr3_-_51643140 | 12.53 |
ENSRNOT00000006646
|
Scn3a
|
sodium voltage-gated channel alpha subunit 3 |
| chr13_-_91872954 | 11.57 |
ENSRNOT00000004613
ENSRNOT00000079263 |
Cadm3
|
cell adhesion molecule 3 |
| chr8_+_128824508 | 11.54 |
ENSRNOT00000025343
|
Mobp
|
myelin-associated oligodendrocyte basic protein |
| chr1_+_264059374 | 5.65 |
ENSRNOT00000075397
|
Scd2
|
stearoyl-Coenzyme A desaturase 2 |
| chr12_-_8156151 | 5.29 |
ENSRNOT00000064721
|
Mtus2
|
microtubule associated tumor suppressor candidate 2 |
| chr15_+_12827707 | 4.85 |
ENSRNOT00000012452
|
Fezf2
|
Fez family zinc finger 2 |
| chr7_-_98098268 | 4.30 |
ENSRNOT00000010361
|
Fbxo32
|
F-box protein 32 |
| chr8_-_87282156 | 4.12 |
ENSRNOT00000087874
|
Filip1
|
filamin A interacting protein 1 |
| chr4_+_158088505 | 1.86 |
ENSRNOT00000026643
|
Vwf
|
von Willebrand factor |
| chr6_+_73358112 | 1.18 |
ENSRNOT00000041373
|
Arhgap5
|
Rho GTPase activating protein 5 |
| chr18_-_58097316 | 1.16 |
ENSRNOT00000088527
|
AABR07032265.1
|
|
| chr6_-_147172813 | 0.84 |
ENSRNOT00000066545
|
Itgb8
|
integrin subunit beta 8 |
| chr7_-_36408588 | 0.54 |
ENSRNOT00000063946
|
Cradd
|
CASP2 and RIPK1 domain containing adaptor with death domain |
| chr13_-_95250235 | 0.48 |
ENSRNOT00000085648
|
Akt3
|
AKT serine/threonine kinase 3 |
| chr14_+_11198896 | 0.39 |
ENSRNOT00000079767
|
Hnrnpdl
|
heterogeneous nuclear ribonucleoprotein D-like |
| chr1_+_185863043 | 0.18 |
ENSRNOT00000079072
|
Sox6
|
SRY box 6 |
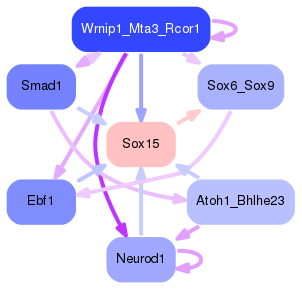
Network of associatons between targets according to the STRING database.

First level regulatory network of Sox15
Gene Ontology Analysis
Gene overrepresentation in biological process category:
| Log-likelihood per target | Total log-likelihood | Term | Description |
|---|---|---|---|
| 10.0 | 29.9 | GO:1904207 | regulation of chemokine (C-C motif) ligand 2 secretion(GO:1904207) positive regulation of chemokine (C-C motif) ligand 2 secretion(GO:1904209) positive regulation of metalloendopeptidase activity(GO:1904685) |
| 6.0 | 17.9 | GO:0099552 | trans-synaptic signaling by lipid, modulating synaptic transmission(GO:0099552) trans-synaptic signaling by endocannabinoid, modulating synaptic transmission(GO:0099553) |
| 3.9 | 15.5 | GO:0098963 | dendritic transport of ribonucleoprotein complex(GO:0098961) dendritic transport of messenger ribonucleoprotein complex(GO:0098963) anterograde dendritic transport of messenger ribonucleoprotein complex(GO:0098964) |
| 1.4 | 5.6 | GO:1903966 | monounsaturated fatty acid metabolic process(GO:1903964) monounsaturated fatty acid biosynthetic process(GO:1903966) |
| 1.3 | 12.5 | GO:0046684 | response to pyrethroid(GO:0046684) |
| 1.2 | 4.9 | GO:0021797 | forebrain anterior/posterior pattern specification(GO:0021797) |
| 0.9 | 4.3 | GO:0014878 | response to electrical stimulus involved in regulation of muscle adaptation(GO:0014878) |
| 0.3 | 15.0 | GO:0051491 | positive regulation of filopodium assembly(GO:0051491) |
| 0.2 | 1.9 | GO:0070417 | cellular response to cold(GO:0070417) |
| 0.2 | 11.6 | GO:0007157 | heterophilic cell-cell adhesion via plasma membrane cell adhesion molecules(GO:0007157) |
| 0.0 | 0.8 | GO:0001573 | ganglioside metabolic process(GO:0001573) |
| 0.0 | 0.5 | GO:0006977 | DNA damage response, signal transduction by p53 class mediator resulting in cell cycle arrest(GO:0006977) |
| 0.0 | 0.2 | GO:2000741 | positive regulation of mesenchymal stem cell differentiation(GO:2000741) |
| 0.0 | 1.2 | GO:0002053 | positive regulation of mesenchymal cell proliferation(GO:0002053) |
| 0.0 | 0.5 | GO:0045793 | positive regulation of cell size(GO:0045793) |
Gene overrepresentation in cellular component category:
| Log-likelihood per target | Total log-likelihood | Term | Description |
|---|---|---|---|
| 5.0 | 29.9 | GO:0033269 | internode region of axon(GO:0033269) |
| 1.0 | 15.5 | GO:0035253 | ciliary rootlet(GO:0035253) |
| 0.6 | 12.5 | GO:0001518 | voltage-gated sodium channel complex(GO:0001518) |
| 0.3 | 15.0 | GO:0044295 | axonal growth cone(GO:0044295) |
| 0.3 | 1.9 | GO:0033093 | Weibel-Palade body(GO:0033093) |
| 0.3 | 0.8 | GO:0034686 | integrin alphav-beta8 complex(GO:0034686) |
| 0.2 | 17.9 | GO:0042734 | presynaptic membrane(GO:0042734) |
| 0.1 | 5.3 | GO:0045171 | intercellular bridge(GO:0045171) |
| 0.1 | 11.6 | GO:0005913 | cell-cell adherens junction(GO:0005913) |
| 0.1 | 4.3 | GO:0019005 | SCF ubiquitin ligase complex(GO:0019005) |
| 0.0 | 11.5 | GO:0043209 | myelin sheath(GO:0043209) |
Gene overrepresentation in molecular function category:
| Log-likelihood per target | Total log-likelihood | Term | Description |
|---|---|---|---|
| 4.5 | 17.9 | GO:0004949 | cannabinoid receptor activity(GO:0004949) |
| 3.5 | 41.4 | GO:0019911 | structural constituent of myelin sheath(GO:0019911) |
| 1.6 | 15.5 | GO:0034190 | apolipoprotein receptor binding(GO:0034190) |
| 1.4 | 5.6 | GO:0032896 | stearoyl-CoA 9-desaturase activity(GO:0004768) palmitoyl-CoA 9-desaturase activity(GO:0032896) |
| 0.4 | 12.5 | GO:0031402 | sodium ion binding(GO:0031402) |
| 0.1 | 0.8 | GO:1990430 | extracellular matrix protein binding(GO:1990430) |
| 0.1 | 15.0 | GO:0005262 | calcium channel activity(GO:0005262) |
| 0.1 | 1.9 | GO:0019865 | immunoglobulin binding(GO:0019865) |
| 0.0 | 0.5 | GO:0070513 | death domain binding(GO:0070513) |
| 0.0 | 0.4 | GO:0034046 | poly(G) binding(GO:0034046) |
| 0.0 | 1.2 | GO:0042169 | SH2 domain binding(GO:0042169) |
| 0.0 | 5.0 | GO:0001227 | transcriptional repressor activity, RNA polymerase II transcription regulatory region sequence-specific binding(GO:0001227) |
| 0.0 | 5.3 | GO:0008017 | microtubule binding(GO:0008017) |
Gene overrepresentation in curated gene sets: canonical pathways category:
| Log-likelihood per target | Total log-likelihood | Term | Description |
|---|---|---|---|
| 0.4 | 17.9 | PID NCADHERIN PATHWAY | N-cadherin signaling events |
| 0.1 | 4.3 | PID FOXO PATHWAY | FoxO family signaling |
| 0.0 | 0.8 | PID INTEGRIN5 PATHWAY | Beta5 beta6 beta7 and beta8 integrin cell surface interactions |
| 0.0 | 0.5 | SA PTEN PATHWAY | PTEN is a tumor suppressor that dephosphorylates the lipid messenger phosphatidylinositol triphosphate. |
| 0.0 | 1.2 | PID RAC1 PATHWAY | RAC1 signaling pathway |
| 0.0 | 0.5 | PID HIV NEF PATHWAY | HIV-1 Nef: Negative effector of Fas and TNF-alpha |
Gene overrepresentation in curated gene sets: REACTOME pathways category:
| Log-likelihood per target | Total log-likelihood | Term | Description |
|---|---|---|---|
| 0.1 | 1.9 | REACTOME PLATELET ADHESION TO EXPOSED COLLAGEN | Genes involved in Platelet Adhesion to exposed collagen |
| 0.1 | 17.9 | REACTOME G ALPHA I SIGNALLING EVENTS | Genes involved in G alpha (i) signalling events |
| 0.1 | 0.5 | REACTOME NEGATIVE REGULATION OF THE PI3K AKT NETWORK | Genes involved in Negative regulation of the PI3K/AKT network |
| 0.0 | 0.8 | REACTOME INTEGRIN CELL SURFACE INTERACTIONS | Genes involved in Integrin cell surface interactions |