Project
GSE53960: rat RNA-Seq transcriptomic Bodymap
Navigation
Downloads
Results for Rfx2_Rfx7
Z-value: 3.61
Motif logo
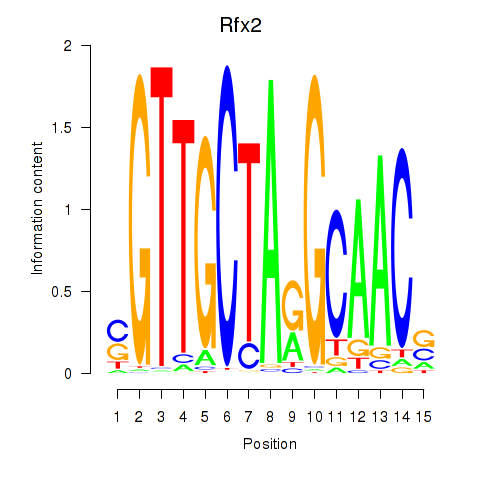
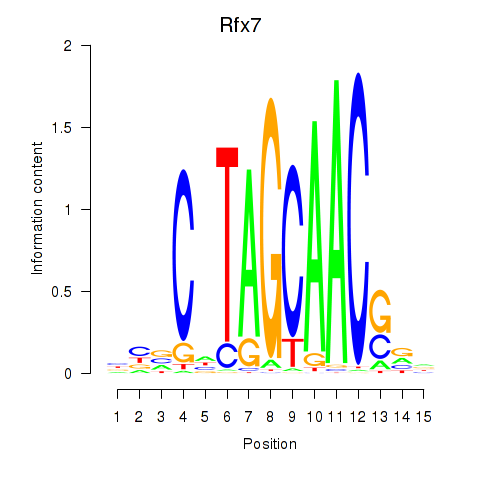
Transcription factors associated with Rfx2_Rfx7
| Gene Symbol | Gene ID | Gene Info |
|---|---|---|
|
Rfx2
|
ENSRNOG00000045846 | regulatory factor X2 |
|
Rfx7
|
ENSRNOG00000060367 | regulatory factor X, 7 |
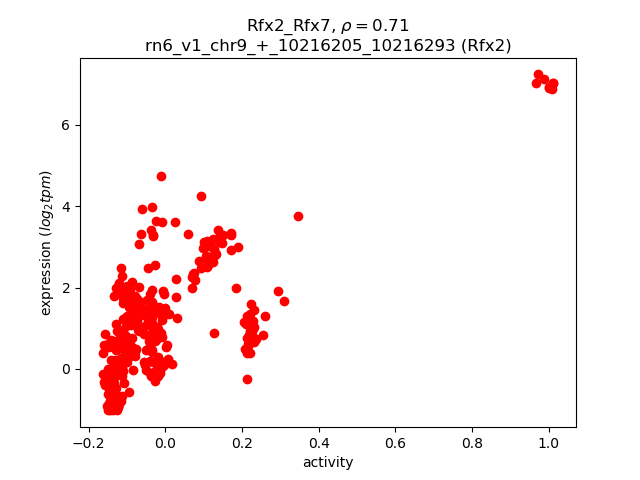
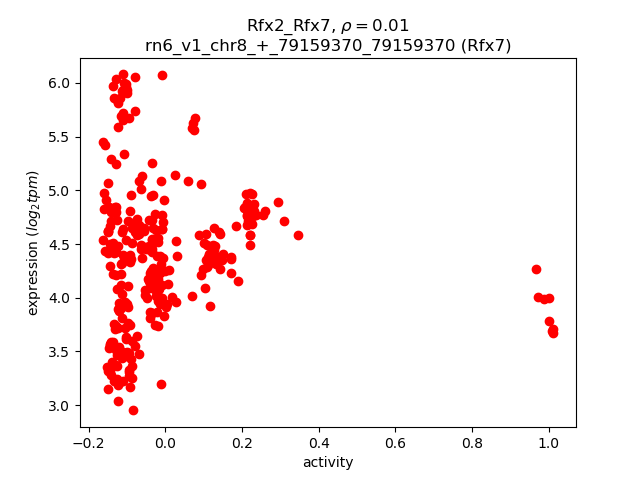
Activity-expression correlation:
| Gene | Promoter | Pearson corr. coef. | P-value | Plot |
|---|---|---|---|---|
| Rfx2 | rn6_v1_chr9_+_10216205_10216293 | 0.71 | 3.3e-51 | Click! |
| Rfx7 | rn6_v1_chr8_+_79159370_79159370 | 0.01 | 8.5e-01 | Click! |
Activity profile of Rfx2_Rfx7 motif
Sorted Z-values of Rfx2_Rfx7 motif
| Promoter | Log-likelihood | Transcript | Gene | Gene Info |
|---|---|---|---|---|
| chr10_-_84976170 | 237.93 |
ENSRNOT00000013542
|
Lrrc46
|
leucine rich repeat containing 46 |
| chr6_-_27460038 | 204.70 |
ENSRNOT00000036815
|
Drc1
|
dynein regulatory complex subunit 1 |
| chr6_+_52702544 | 200.83 |
ENSRNOT00000014252
|
Efcab10
|
EF-hand calcium binding domain 10 |
| chr16_+_56248331 | 196.79 |
ENSRNOT00000085300
|
Tusc3
|
tumor suppressor candidate 3 |
| chr10_+_14828597 | 186.42 |
ENSRNOT00000025434
|
Tekt4
|
tektin 4 |
| chr1_-_226526959 | 177.68 |
ENSRNOT00000028003
|
Ppp1r32
|
protein phosphatase 1, regulatory subunit 32 |
| chr7_+_126028350 | 170.86 |
ENSRNOT00000042412
|
Ribc2
|
RIB43A domain with coiled-coils 2 |
| chr3_+_56802714 | 168.74 |
ENSRNOT00000077551
|
Erich2
|
glutamate-rich 2 |
| chr1_-_72632185 | 151.51 |
ENSRNOT00000066383
|
Tmem190
|
transmembrane protein 190 |
| chr4_+_10020349 | 151.04 |
ENSRNOT00000065039
|
Fbxl13
|
F-box and leucine-rich repeat protein 13 |
| chr14_-_114868328 | 149.77 |
ENSRNOT00000034584
|
RGD1562229
|
similar to hypothetical protein FLJ40298 |
| chr12_+_46042413 | 145.80 |
ENSRNOT00000046882
|
Ccdc60
|
coiled-coil domain containing 60 |
| chr17_+_78817529 | 145.11 |
ENSRNOT00000021918
|
Meig1
|
meiosis/spermiogenesis associated 1 |
| chr7_-_33916338 | 142.42 |
ENSRNOT00000005492
|
Cfap54
|
cilia and flagella associated protein 54 |
| chr10_+_49472460 | 131.95 |
ENSRNOT00000038276
|
Tekt3
|
tektin 3 |
| chr17_-_88095729 | 129.77 |
ENSRNOT00000025140
|
Enkur
|
enkurin, TRPC channel interacting protein |
| chr1_-_154111725 | 128.78 |
ENSRNOT00000055488
|
Ccdc81
|
coiled-coil domain containing 81 |
| chr3_-_7051953 | 128.01 |
ENSRNOT00000013473
|
RGD1306233
|
similar to hypothetical protein MGC29761 |
| chr10_+_1834518 | 126.70 |
ENSRNOT00000061709
|
Gm1758
|
predicted gene 1758 |
| chr8_-_23014499 | 126.07 |
ENSRNOT00000017820
|
Ccdc151
|
coiled-coil domain containing 151 |
| chr1_+_267689328 | 122.85 |
ENSRNOT00000077738
|
Cfap58
|
cilia and flagella associated protein 58 |
| chr6_+_137386422 | 119.83 |
ENSRNOT00000018568
|
RGD1307315
|
LOC362793 |
| chr4_+_114854458 | 119.22 |
ENSRNOT00000013312
|
LOC500227
|
hypothetical gene supported by BC079424 |
| chr19_-_53754602 | 118.58 |
ENSRNOT00000035651
|
Fam92b
|
family with sequence similarity 92, member B |
| chr15_-_47338976 | 118.20 |
ENSRNOT00000016562
|
RGD1565212
|
similar to 4930578I06Rik protein |
| chr20_+_14577166 | 117.56 |
ENSRNOT00000085583
|
Rtdr1
|
rhabdoid tumor deletion region gene 1 |
| chr17_+_85914410 | 117.02 |
ENSRNOT00000075188
|
Armc3
|
armadillo repeat containing 3 |
| chr7_-_126028279 | 116.69 |
ENSRNOT00000044883
|
Smc1b
|
structural maintenance of chromosomes 1B |
| chr10_+_88459490 | 115.89 |
ENSRNOT00000080231
ENSRNOT00000067559 |
Ttc25
|
tetratricopeptide repeat domain 25 |
| chr5_-_78324278 | 115.42 |
ENSRNOT00000082642
ENSRNOT00000048904 |
Wdr31
|
WD repeat domain 31 |
| chr6_+_78567970 | 114.68 |
ENSRNOT00000032743
|
Ttc6
|
tetratricopeptide repeat domain 6 |
| chr3_+_171597241 | 113.85 |
ENSRNOT00000029558
|
LOC689618
|
similar to Protein C20orf85 homolog |
| chr10_-_44746549 | 113.27 |
ENSRNOT00000003841
|
Fam183b
|
family with sequence similarity 183, member B |
| chr5_+_118574801 | 112.85 |
ENSRNOT00000035949
|
Ube2u
|
ubiquitin-conjugating enzyme E2U (putative) |
| chr2_-_243475639 | 112.74 |
ENSRNOT00000089222
|
RGD1309170
|
similar to hypothetical protein DKFZp434G072 |
| chr4_+_25538497 | 109.02 |
ENSRNOT00000009264
|
Cfap69
|
cilia and flagella associated protein 69 |
| chr10_+_55169282 | 106.00 |
ENSRNOT00000005423
|
Ccdc42
|
coiled-coil domain containing 42 |
| chr3_-_56030744 | 105.13 |
ENSRNOT00000089637
|
Ccdc173
|
coiled-coil domain containing 173 |
| chr2_-_29248174 | 104.65 |
ENSRNOT00000071167
|
LOC684444
|
similar to HIStone family member (his-41) |
| chr10_+_103266296 | 99.00 |
ENSRNOT00000038852
|
Dnai2
|
dynein, axonemal, intermediate chain 2 |
| chr14_+_107785029 | 98.63 |
ENSRNOT00000013097
ENSRNOT00000087091 |
Fam161a
|
family with sequence similarity 161, member A |
| chr4_-_4473307 | 98.06 |
ENSRNOT00000045773
|
Dpp6
|
dipeptidyl peptidase like 6 |
| chr10_+_90984227 | 96.92 |
ENSRNOT00000003890
ENSRNOT00000093707 |
Ccdc103
|
coiled-coil domain containing 103 |
| chr5_-_136112344 | 96.53 |
ENSRNOT00000050195
|
RGD1563714
|
RGD1563714 |
| chr7_-_130350570 | 95.07 |
ENSRNOT00000055805
|
Odf3b
|
outer dense fiber of sperm tails 3B |
| chr1_-_37726151 | 93.60 |
ENSRNOT00000071842
|
RGD1308544
|
LOC361192 |
| chr7_-_74901997 | 93.25 |
ENSRNOT00000039378
|
Rgs22
|
regulator of G-protein signaling 22 |
| chr6_-_27323992 | 89.05 |
ENSRNOT00000013198
|
RGD1559683
|
similar to RIKEN cDNA 1700001C02 |
| chr3_+_92640752 | 88.49 |
ENSRNOT00000007604
|
Slc1a2
|
solute carrier family 1 member 2 |
| chr2_-_251970768 | 87.77 |
ENSRNOT00000020141
|
Wdr63
|
WD repeat domain 63 |
| chr4_-_145555748 | 86.99 |
ENSRNOT00000013503
|
Fancd2os
|
FANCD2 opposite strand |
| chr11_+_60073383 | 85.90 |
ENSRNOT00000087508
|
Tagln3
|
transgelin 3 |
| chr6_-_135259603 | 84.31 |
ENSRNOT00000010529
|
Mok
|
MOK protein kinase |
| chrX_+_20351486 | 83.45 |
ENSRNOT00000093675
ENSRNOT00000047444 |
Wnk3
|
WNK lysine deficient protein kinase 3 |
| chr6_+_111223026 | 82.39 |
ENSRNOT00000074634
|
Samd15
|
sterile alpha motif domain containing 15 |
| chr3_-_11820549 | 82.28 |
ENSRNOT00000020660
|
Cfap157
|
cilia and flagella associated protein 157 |
| chr1_-_156327352 | 82.13 |
ENSRNOT00000074282
|
LOC100911776
|
coiled-coil domain-containing protein 89-like |
| chr13_-_47916877 | 81.96 |
ENSRNOT00000006502
|
Dyrk3
|
dual specificity tyrosine phosphorylation regulated kinase 3 |
| chr6_+_34094306 | 81.62 |
ENSRNOT00000051970
|
Wdr35
|
WD repeat domain 35 |
| chr5_+_57947716 | 81.08 |
ENSRNOT00000067657
|
Dnai1
|
dynein, axonemal, intermediate chain 1 |
| chr3_-_102430151 | 81.00 |
ENSRNOT00000006507
|
Ankrd30a
|
ankyrin repeat domain 30A |
| chr18_+_70263359 | 80.71 |
ENSRNOT00000019573
|
Cfap53
|
cilia and flagella associated protein 53 |
| chr7_+_140383397 | 79.50 |
ENSRNOT00000090760
|
Ccdc65
|
coiled-coil domain containing 65 |
| chr1_+_154606490 | 79.46 |
ENSRNOT00000024095
|
Ccdc89
|
coiled-coil domain containing 89 |
| chr5_-_144345531 | 77.95 |
ENSRNOT00000014721
|
Tekt2
|
tektin 2 |
| chr1_-_267598639 | 77.51 |
ENSRNOT00000031925
|
Cfap43
|
cilia and flagella associated protein 43 |
| chr1_+_214182830 | 76.58 |
ENSRNOT00000022867
|
Lrrc56
|
leucine rich repeat containing 56 |
| chr20_-_7654428 | 76.56 |
ENSRNOT00000045044
|
Tcp11
|
t-complex 11 |
| chr1_-_145931583 | 75.85 |
ENSRNOT00000016433
|
Cfap161
|
cilia and flagella associated protein 161 |
| chr6_+_129538982 | 72.19 |
ENSRNOT00000083626
ENSRNOT00000082522 |
Ak7
|
adenylate kinase 7 |
| chr1_+_164849974 | 71.73 |
ENSRNOT00000031908
|
Xrra1
|
X-ray radiation resistance associated 1 |
| chr10_-_107158997 | 70.25 |
ENSRNOT00000004047
|
Dnah17
|
dynein, axonemal, heavy chain 17 |
| chr8_+_79054237 | 69.59 |
ENSRNOT00000077613
|
Mns1
|
meiosis-specific nuclear structural 1 |
| chr6_-_11063073 | 69.47 |
ENSRNOT00000086010
ENSRNOT00000061746 |
LOC681766
|
hypothetical protein LOC681766 |
| chr14_-_81725181 | 68.73 |
ENSRNOT00000078252
|
Cfap99
|
cilia and flagella associated protein 99 |
| chr16_-_68832862 | 67.01 |
ENSRNOT00000016348
|
Poteg
|
POTE ankyrin domain family, member G |
| chr5_+_140870140 | 66.13 |
ENSRNOT00000074347
|
Hpcal4
|
hippocalcin-like 4 |
| chr10_+_5352933 | 66.03 |
ENSRNOT00000003465
|
Tekt5
|
tektin 5 |
| chr8_+_79638696 | 64.75 |
ENSRNOT00000085959
|
Dyx1c1
|
dyslexia susceptibility 1 candidate 1 |
| chr5_+_113592919 | 64.50 |
ENSRNOT00000011336
|
Ift74
|
intraflagellar transport 74 |
| chr1_-_212022212 | 64.36 |
ENSRNOT00000074298
|
Cfap46
|
cilia and flagella associated protein 46 |
| chr7_+_91588458 | 64.10 |
ENSRNOT00000006257
|
Aard
|
alanine and arginine rich domain containing protein |
| chr19_-_20508711 | 63.82 |
ENSRNOT00000032408
|
LOC680913
|
hypothetical protein LOC680913 |
| chr18_-_27374603 | 63.45 |
ENSRNOT00000027244
|
Nme5
|
NME/NM23 family member 5 |
| chr7_+_54859104 | 63.31 |
ENSRNOT00000087341
|
Caps2
|
calcyphosine 2 |
| chr7_+_117420788 | 62.51 |
ENSRNOT00000049198
|
Wdr97
|
WD repeat domain 97 |
| chr19_+_49016891 | 62.47 |
ENSRNOT00000016713
|
Dynlrb2
|
dynein light chain roadblock-type 2 |
| chr8_-_58542844 | 62.35 |
ENSRNOT00000012041
|
Elmod1
|
ELMO domain containing 1 |
| chr3_+_56030915 | 61.90 |
ENSRNOT00000010489
|
Phospho2
|
phosphatase, orphan 2 |
| chr14_+_91557601 | 61.12 |
ENSRNOT00000038733
|
RGD1309870
|
hypothetical LOC289778 |
| chr14_-_66771750 | 60.00 |
ENSRNOT00000005587
|
Pacrgl
|
PARK2 co-regulated-like |
| chr3_+_7279340 | 59.61 |
ENSRNOT00000017029
|
Ak8
|
adenylate kinase 8 |
| chr5_+_78384444 | 59.14 |
ENSRNOT00000034978
|
LOC500475
|
similar to hypothetical protein 4933430I17 |
| chr1_+_280103695 | 58.33 |
ENSRNOT00000065289
|
Eno4
|
enolase family member 4 |
| chr1_-_72464492 | 58.05 |
ENSRNOT00000068550
|
Nat14
|
N-acetyltransferase 14 |
| chr9_-_44456554 | 58.03 |
ENSRNOT00000080011
|
Tsga10
|
testis specific 10 |
| chr10_+_90622992 | 57.52 |
ENSRNOT00000032856
|
Meioc
|
meiosis specific with coiled-coil domain |
| chr10_-_40201992 | 56.88 |
ENSRNOT00000075311
|
Lyrm7
|
LYR motif containing 7 |
| chr5_-_172769421 | 56.79 |
ENSRNOT00000021285
|
Prkcz
|
protein kinase C, zeta |
| chr16_-_39970532 | 56.53 |
ENSRNOT00000071331
|
Spata4
|
spermatogenesis associated 4 |
| chr6_+_122603269 | 56.52 |
ENSRNOT00000005297
|
Spata7
|
spermatogenesis associated 7 |
| chr3_-_177205836 | 56.40 |
ENSRNOT00000034209
|
Lkaaear1
|
LKAAEAR motif containing 1 |
| chr1_+_78893271 | 55.84 |
ENSRNOT00000029825
|
Pnmal1
|
paraneoplastic Ma antigen family-like 1 |
| chr17_+_6701315 | 55.30 |
ENSRNOT00000026054
ENSRNOT00000080683 |
Kif27
|
kinesin family member 27 |
| chr16_+_18648866 | 55.06 |
ENSRNOT00000014862
|
Dydc1
|
DPY30 domain containing 1 |
| chr2_-_208633945 | 54.52 |
ENSRNOT00000049155
|
Pifo
|
primary cilia formation |
| chr9_+_27068443 | 54.27 |
ENSRNOT00000017393
|
Efhc1
|
EF-hand domain containing 1 |
| chr4_-_113988246 | 52.96 |
ENSRNOT00000013128
|
LOC103692166
|
WD repeat-containing protein 54 |
| chr6_+_122920317 | 52.83 |
ENSRNOT00000068595
ENSRNOT00000082856 |
Ttc8
|
tetratricopeptide repeat domain 8 |
| chr6_+_109110534 | 51.99 |
ENSRNOT00000009156
|
Zc2hc1c
|
zinc finger, C2HC-type containing 1C |
| chr10_+_91710495 | 51.22 |
ENSRNOT00000033276
|
Rprml
|
reprimo-like |
| chr19_+_32344078 | 51.15 |
ENSRNOT00000015541
|
LOC498933
|
LOC498933 |
| chr4_-_184096806 | 50.67 |
ENSRNOT00000055433
|
LOC100362344
|
mKIAA1238 protein-like |
| chr16_+_51748970 | 49.83 |
ENSRNOT00000059182
|
Adam26a
|
a disintegrin and metallopeptidase domain 26A |
| chr1_+_267618248 | 49.70 |
ENSRNOT00000017186
|
Gsto2
|
glutathione S-transferase omega 2 |
| chr4_+_21317695 | 49.62 |
ENSRNOT00000007572
|
Grm3
|
glutamate metabotropic receptor 3 |
| chr1_+_78876205 | 49.59 |
ENSRNOT00000022610
|
Pnmal2
|
paraneoplastic Ma antigen family-like 2 |
| chr7_+_54859326 | 49.34 |
ENSRNOT00000039141
|
Caps2
|
calcyphosine 2 |
| chr8_-_132790778 | 49.19 |
ENSRNOT00000008255
ENSRNOT00000091431 |
Lztfl1
|
leucine zipper transcription factor-like 1 |
| chr3_-_147487170 | 48.68 |
ENSRNOT00000077580
|
Fam110a
|
family with sequence similarity 110, member A |
| chr19_+_56010085 | 48.32 |
ENSRNOT00000058216
|
Spata33
|
spermatogenesis associated 33 |
| chr17_+_27452638 | 48.24 |
ENSRNOT00000038349
|
Cage1
|
cancer antigen 1 |
| chr1_-_107373807 | 48.05 |
ENSRNOT00000056024
|
Svip
|
small VCP interacting protein |
| chr4_+_120156659 | 47.90 |
ENSRNOT00000050584
|
Dnajb8
|
DnaJ heat shock protein family (Hsp40) member B8 |
| chr5_-_138462864 | 47.85 |
ENSRNOT00000011325
|
Ccdc30
|
coiled-coil domain containing 30 |
| chr1_-_212317244 | 47.24 |
ENSRNOT00000068604
|
LOC103691261
|
sperm flagellar protein 1-like |
| chr7_+_12247498 | 46.80 |
ENSRNOT00000022358
|
Pcsk4
|
proprotein convertase subtilisin/kexin type 4 |
| chr5_+_172488708 | 46.52 |
ENSRNOT00000019930
|
Morn1
|
MORN repeat containing 1 |
| chr11_-_90234286 | 46.39 |
ENSRNOT00000071986
|
Efcab1
|
EF hand calcium binding domain 1 |
| chrX_+_45965301 | 46.17 |
ENSRNOT00000005141
|
Fam47a
|
family with sequence similarity 47, member A |
| chr1_-_199037267 | 46.06 |
ENSRNOT00000078779
|
Ccdc189
|
coiled-coil domain containing 189 |
| chrX_+_148421627 | 45.33 |
ENSRNOT00000016754
|
Ctag2
|
cancer/testis antigen 2 |
| chr5_-_77294735 | 45.16 |
ENSRNOT00000018209
ENSRNOT00000056900 |
Zfp37
|
zinc finger protein 37 |
| chrX_+_5825711 | 44.90 |
ENSRNOT00000037360
|
Efhc2
|
EF-hand domain containing 2 |
| chr3_-_2434257 | 44.86 |
ENSRNOT00000013278
|
Stpg3
|
sperm-tail PG-rich repeat containing 3 |
| chr6_-_59950586 | 44.24 |
ENSRNOT00000005800
|
Arl4a
|
ADP-ribosylation factor like GTPase 4A |
| chr18_-_37132223 | 44.24 |
ENSRNOT00000091634
|
Ppp2r2b
|
protein phosphatase 2, regulatory subunit B, beta |
| chr1_+_190462327 | 43.98 |
ENSRNOT00000030732
|
LOC691519
|
similar to ankyrin repeat domain 26 |
| chr8_-_47094352 | 43.80 |
ENSRNOT00000048347
|
Grik4
|
glutamate ionotropic receptor kainate type subunit 4 |
| chr3_+_8450612 | 43.77 |
ENSRNOT00000040457
|
Odf2
|
outer dense fiber of sperm tails 2 |
| chr6_-_144123596 | 43.38 |
ENSRNOT00000006144
ENSRNOT00000087845 |
Wdr60
|
WD repeat domain 60 |
| chr9_-_13311924 | 43.37 |
ENSRNOT00000015584
|
Kif6
|
kinesin family member 6 |
| chr3_-_9326993 | 43.08 |
ENSRNOT00000090137
|
Lamc3
|
laminin subunit gamma 3 |
| chr5_-_25721072 | 42.87 |
ENSRNOT00000021839
|
Tmem67
|
transmembrane protein 67 |
| chr14_-_43584343 | 42.84 |
ENSRNOT00000039835
|
Nsun7
|
NOP2/Sun RNA methyltransferase family member 7 |
| chr9_+_66335492 | 42.69 |
ENSRNOT00000037555
|
RGD1562029
|
similar to KIAA2012 protein |
| chr15_+_18920373 | 41.20 |
ENSRNOT00000036754
|
LOC100363368
|
mCG11429-like |
| chr1_+_23977688 | 41.17 |
ENSRNOT00000014805
|
Tbpl1
|
TATA-box binding protein like 1 |
| chr20_+_3351303 | 41.15 |
ENSRNOT00000080419
ENSRNOT00000001065 ENSRNOT00000086503 |
Atat1
|
alpha tubulin acetyltransferase 1 |
| chr3_-_52212412 | 40.92 |
ENSRNOT00000007615
|
Galnt3
|
polypeptide N-acetylgalactosaminyltransferase 3 |
| chr12_+_17614632 | 40.92 |
ENSRNOT00000031896
|
Prkar1b
|
protein kinase cAMP-dependent type 1 regulatory subunit beta |
| chr1_-_189666440 | 40.55 |
ENSRNOT00000019167
|
Dcun1d3
|
defective in cullin neddylation 1 domain containing 3 |
| chr9_+_81880177 | 40.47 |
ENSRNOT00000022839
|
Stk36
|
serine/threonine kinase 36 |
| chr9_-_82410904 | 40.30 |
ENSRNOT00000026081
|
Glb1l
|
galactosidase, beta 1-like |
| chr20_+_20236151 | 40.28 |
ENSRNOT00000079630
|
Ank3
|
ankyrin 3 |
| chr14_-_114484127 | 40.08 |
ENSRNOT00000056706
|
Eml6
|
echinoderm microtubule associated protein like 6 |
| chr12_-_48286352 | 39.99 |
ENSRNOT00000030891
|
Usp30
|
ubiquitin specific peptidase 30 |
| chr1_-_88516129 | 39.67 |
ENSRNOT00000087232
|
AABR07002893.1
|
|
| chr3_+_8450275 | 39.38 |
ENSRNOT00000020073
|
Odf2
|
outer dense fiber of sperm tails 2 |
| chr13_+_82574966 | 39.28 |
ENSRNOT00000003844
|
Ccdc181
|
coiled-coil domain containing 181 |
| chr1_+_188278469 | 38.86 |
ENSRNOT00000065601
|
Tmc5
|
transmembrane channel-like 5 |
| chr6_+_7900972 | 38.84 |
ENSRNOT00000006953
ENSRNOT00000068030 |
Dync2li1
|
dynein cytoplasmic 2 light intermediate chain 1 |
| chr6_-_99274269 | 38.63 |
ENSRNOT00000058675
|
Tex21
|
testis expressed 21 |
| chr6_-_94932806 | 38.52 |
ENSRNOT00000006346
|
Ccdc175
|
coiled-coil domain containing 175 |
| chr8_-_68525911 | 38.36 |
ENSRNOT00000080588
ENSRNOT00000011109 |
Iqch
|
IQ motif containing H |
| chrX_-_61029298 | 38.34 |
ENSRNOT00000043817
|
MGC114483
|
similar to MAGEB3 |
| chr7_-_130564719 | 38.23 |
ENSRNOT00000044262
|
Rabl2a
|
RAB, member of RAS oncogene family-like 2A |
| chr8_+_117221367 | 38.22 |
ENSRNOT00000073445
|
LOC680045
|
hypothetical protein LOC680045 |
| chr3_+_177310753 | 37.85 |
ENSRNOT00000031448
|
Myt1
|
myelin transcription factor 1 |
| chr16_-_7406951 | 37.78 |
ENSRNOT00000066508
|
Dnah1
|
dynein, axonemal, heavy chain 1 |
| chr10_+_37458452 | 37.39 |
ENSRNOT00000079411
|
Cdkl3
|
cyclin-dependent kinase-like 3 |
| chr20_-_14573519 | 37.13 |
ENSRNOT00000001772
|
Rab36
|
RAB36, member RAS oncogene family |
| chr1_-_47477524 | 37.13 |
ENSRNOT00000067916
|
Rsph3
|
radial spoke 3 homolog |
| chr16_-_49453394 | 36.68 |
ENSRNOT00000041617
|
Lrp2bp
|
Lrp2 binding protein |
| chr2_-_60538088 | 36.65 |
ENSRNOT00000086809
|
Ttc23l
|
tetratricopeptide repeat domain 23-like |
| chr18_-_15167311 | 35.93 |
ENSRNOT00000021061
|
Rnf138
|
ring finger protein 138 |
| chr1_-_247088012 | 35.91 |
ENSRNOT00000020464
|
Spata6l
|
spermatogenesis associated 6-like |
| chr17_+_15194262 | 35.75 |
ENSRNOT00000073070
|
AABR07072539.1
|
|
| chr14_+_85814824 | 35.65 |
ENSRNOT00000090046
ENSRNOT00000083756 |
Ankrd36
|
ankyrin repeat domain 36 |
| chr3_-_134406576 | 35.58 |
ENSRNOT00000081589
|
Sel1l2
|
SEL1L2 ERAD E3 ligase adaptor subunit |
| chr1_-_206417143 | 35.41 |
ENSRNOT00000091863
ENSRNOT00000073836 |
LOC100302465
|
hypothetical LOC100302465 |
| chr1_-_259106948 | 35.27 |
ENSRNOT00000074429
|
LOC100912537
|
tectonic-3-like |
| chr1_+_220096422 | 34.74 |
ENSRNOT00000034771
|
Ccdc87
|
coiled-coil domain containing 87 |
| chr12_+_16030788 | 34.50 |
ENSRNOT00000051565
|
Iqce
|
IQ motif containing E |
| chr7_-_72328128 | 34.32 |
ENSRNOT00000008227
|
Tspyl5
|
TSPY-like 5 |
| chr1_-_81534140 | 33.99 |
ENSRNOT00000027202
|
Tex101
|
testis expressed 101 |
| chr4_+_57823411 | 33.97 |
ENSRNOT00000030462
ENSRNOT00000088235 |
Ssmem1
|
serine-rich single-pass membrane protein 1 |
| chr1_-_205669760 | 33.65 |
ENSRNOT00000086703
|
Tex36
|
testis expressed 36 |
| chr4_+_147756553 | 32.77 |
ENSRNOT00000086549
ENSRNOT00000014733 |
Ift122
|
intraflagellar transport 122 |
| chr10_-_82252720 | 32.58 |
ENSRNOT00000066132
ENSRNOT00000075795 |
Mycbpap
|
Mycbp associated protein |
| chr6_+_107596782 | 32.55 |
ENSRNOT00000076882
|
Dnal1
|
dynein, axonemal, light chain 1 |
| chr5_-_50221095 | 32.36 |
ENSRNOT00000012164
|
RGD1563056
|
similar to hypothetical protein |
| chrX_+_32495809 | 32.03 |
ENSRNOT00000020999
|
RGD1565844
|
similar to RIKEN cDNA 1700045I19 |
| chr12_+_23954574 | 31.87 |
ENSRNOT00000046343
|
Styxl1
|
serine/threonine/tyrosine interacting-like 1 |
| chr2_-_246737997 | 31.73 |
ENSRNOT00000021719
|
Pdha2
|
pyruvate dehydrogenase (lipoamide) alpha 2 |
| chr11_+_64488194 | 31.70 |
ENSRNOT00000030268
|
RGD1306995
|
similar to hypothetical protein FLJ32859 |
| chr10_-_82252963 | 31.56 |
ENSRNOT00000086261
|
Mycbpap
|
Mycbp associated protein |
| chr4_+_55720010 | 31.01 |
ENSRNOT00000063987
|
Fscn3
|
fascin actin-bundling protein 3 |
| chr14_+_106393959 | 30.99 |
ENSRNOT00000092168
|
Wdpcp
|
WD repeat containing planar cell polarity effector |
| chr13_-_100189778 | 30.97 |
ENSRNOT00000071062
|
LOC100912759
|
uncharacterized LOC100912759 |
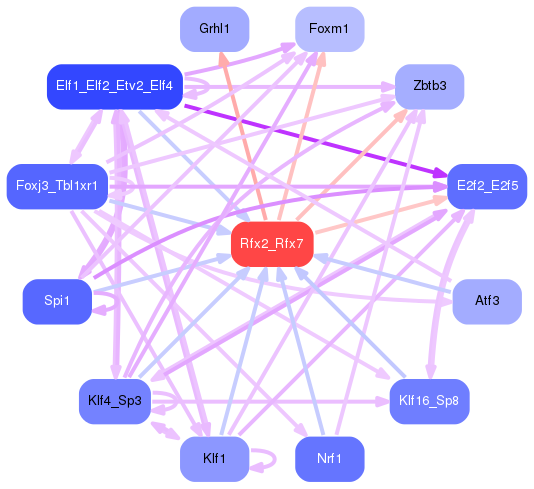
Network of associatons between targets according to the STRING database.

First level regulatory network of Rfx2_Rfx7
Gene Ontology Analysis
Gene overrepresentation in biological process category:
| Log-likelihood per target | Total log-likelihood | Term | Description |
|---|---|---|---|
| 63.7 | 318.4 | GO:0080154 | regulation of fertilization(GO:0080154) |
| 27.8 | 83.4 | GO:2000688 | positive regulation of rubidium ion transport(GO:2000682) positive regulation of rubidium ion transmembrane transporter activity(GO:2000688) |
| 26.0 | 571.3 | GO:0060285 | cilium or flagellum-dependent cell motility(GO:0001539) cilium-dependent cell motility(GO:0060285) |
| 23.1 | 415.2 | GO:0036158 | outer dynein arm assembly(GO:0036158) |
| 18.5 | 277.1 | GO:0003351 | epithelial cilium movement(GO:0003351) |
| 17.7 | 88.5 | GO:0070779 | D-aspartate transport(GO:0070777) D-aspartate import(GO:0070779) |
| 17.6 | 52.8 | GO:0048560 | establishment of anatomical structure orientation(GO:0048560) |
| 16.4 | 82.0 | GO:0035617 | stress granule disassembly(GO:0035617) |
| 16.0 | 48.1 | GO:1903070 | negative regulation of ER-associated ubiquitin-dependent protein catabolic process(GO:1903070) |
| 15.0 | 105.3 | GO:0035735 | intraciliary transport involved in cilium morphogenesis(GO:0035735) |
| 14.1 | 196.8 | GO:0015693 | magnesium ion transport(GO:0015693) magnesium ion transmembrane transport(GO:1903830) |
| 13.7 | 41.2 | GO:0071929 | alpha-tubulin acetylation(GO:0071929) |
| 12.3 | 49.2 | GO:1903564 | regulation of protein localization to cilium(GO:1903564) |
| 11.6 | 69.5 | GO:0090116 | C-5 methylation of cytosine(GO:0090116) |
| 11.4 | 114.4 | GO:0035721 | intraciliary retrograde transport(GO:0035721) |
| 11.4 | 56.8 | GO:2001181 | positive regulation of interleukin-10 secretion(GO:2001181) |
| 10.7 | 32.0 | GO:1900195 | positive regulation of oocyte maturation(GO:1900195) positive regulation of proteasomal ubiquitin-dependent protein catabolic process involved in cellular response to hypoxia(GO:2000777) |
| 10.3 | 31.0 | GO:0016476 | regulation of embryonic cell shape(GO:0016476) |
| 10.3 | 41.2 | GO:0006235 | dTTP biosynthetic process(GO:0006235) pyrimidine deoxyribonucleoside triphosphate biosynthetic process(GO:0009212) |
| 10.1 | 40.3 | GO:0010650 | positive regulation of cell communication by electrical coupling(GO:0010650) positive regulation of membrane depolarization during cardiac muscle cell action potential(GO:1900827) |
| 10.0 | 40.0 | GO:0044313 | protein K6-linked deubiquitination(GO:0044313) |
| 9.6 | 57.5 | GO:0007144 | female meiosis I(GO:0007144) |
| 9.1 | 18.1 | GO:2000313 | fibroblast growth factor receptor signaling pathway involved in neural plate anterior/posterior pattern formation(GO:0060825) regulation of fibroblast growth factor receptor signaling pathway involved in neural plate anterior/posterior pattern formation(GO:2000313) |
| 8.9 | 26.6 | GO:0036334 | epidermal stem cell homeostasis(GO:0036334) |
| 8.6 | 42.8 | GO:0030382 | sperm mitochondrion organization(GO:0030382) |
| 8.2 | 40.9 | GO:0018242 | protein O-linked glycosylation via serine(GO:0018242) protein O-linked glycosylation via threonine(GO:0018243) |
| 8.1 | 56.5 | GO:1903546 | protein localization to photoreceptor outer segment(GO:1903546) |
| 7.5 | 22.5 | GO:0070286 | axonemal dynein complex assembly(GO:0070286) |
| 7.3 | 29.0 | GO:1902775 | mitochondrial large ribosomal subunit assembly(GO:1902775) |
| 6.4 | 83.7 | GO:0003341 | cilium movement(GO:0003341) |
| 6.4 | 133.5 | GO:0045724 | positive regulation of cilium assembly(GO:0045724) |
| 6.3 | 19.0 | GO:1905218 | cellular response to astaxanthin(GO:1905218) |
| 6.1 | 24.2 | GO:1901621 | negative regulation of smoothened signaling pathway involved in dorsal/ventral neural tube patterning(GO:1901621) |
| 5.9 | 29.5 | GO:2000327 | positive regulation of ligand-dependent nuclear receptor transcription coactivator activity(GO:2000327) |
| 5.6 | 16.9 | GO:1903445 | protein transport from ciliary membrane to plasma membrane(GO:1903445) |
| 5.6 | 39.2 | GO:0071500 | cellular response to nitrosative stress(GO:0071500) |
| 5.5 | 49.7 | GO:0019852 | L-ascorbic acid metabolic process(GO:0019852) |
| 5.4 | 123.4 | GO:0048240 | sperm capacitation(GO:0048240) |
| 5.3 | 16.0 | GO:0042822 | pyridoxal phosphate metabolic process(GO:0042822) |
| 4.7 | 46.9 | GO:0006348 | chromatin silencing at telomere(GO:0006348) |
| 4.5 | 49.6 | GO:0007196 | adenylate cyclase-inhibiting G-protein coupled glutamate receptor signaling pathway(GO:0007196) |
| 4.4 | 47.9 | GO:0090084 | negative regulation of inclusion body assembly(GO:0090084) |
| 4.1 | 58.0 | GO:0006654 | phosphatidic acid biosynthetic process(GO:0006654) |
| 3.9 | 7.8 | GO:0071898 | regulation of estrogen receptor binding(GO:0071898) negative regulation of estrogen receptor binding(GO:0071899) |
| 3.9 | 23.4 | GO:0021943 | formation of radial glial scaffolds(GO:0021943) |
| 3.7 | 18.6 | GO:0061741 | vacuolar transmembrane transport(GO:0034486) chaperone-mediated protein transport involved in chaperone-mediated autophagy(GO:0061741) |
| 3.7 | 18.3 | GO:0034316 | negative regulation of Arp2/3 complex-mediated actin nucleation(GO:0034316) |
| 3.6 | 21.8 | GO:0032914 | positive regulation of transforming growth factor beta1 production(GO:0032914) |
| 3.6 | 82.4 | GO:0000027 | ribosomal large subunit assembly(GO:0000027) |
| 3.6 | 67.5 | GO:0045116 | protein neddylation(GO:0045116) |
| 3.3 | 35.9 | GO:0010792 | DNA double-strand break processing involved in repair via single-strand annealing(GO:0010792) |
| 3.3 | 26.1 | GO:0090273 | regulation of somatostatin secretion(GO:0090273) |
| 3.2 | 12.8 | GO:0033183 | negative regulation of histone ubiquitination(GO:0033183) regulation of histone H2A K63-linked ubiquitination(GO:1901314) negative regulation of histone H2A K63-linked ubiquitination(GO:1901315) |
| 3.0 | 312.5 | GO:1903955 | positive regulation of protein targeting to mitochondrion(GO:1903955) |
| 2.9 | 44.2 | GO:0043653 | mitochondrial fragmentation involved in apoptotic process(GO:0043653) |
| 2.8 | 17.0 | GO:1905232 | cellular response to L-glutamate(GO:1905232) |
| 2.8 | 16.9 | GO:0006681 | galactosylceramide metabolic process(GO:0006681) |
| 2.8 | 5.6 | GO:0030997 | regulation of centriole-centriole cohesion(GO:0030997) |
| 2.7 | 16.3 | GO:1904117 | cellular response to vasopressin(GO:1904117) |
| 2.6 | 26.2 | GO:0046548 | retinal rod cell development(GO:0046548) |
| 2.6 | 59.6 | GO:0021591 | ventricular system development(GO:0021591) |
| 2.6 | 7.7 | GO:0032875 | regulation of DNA endoreduplication(GO:0032875) |
| 2.6 | 28.3 | GO:0002934 | desmosome organization(GO:0002934) |
| 2.6 | 274.8 | GO:0044782 | cilium organization(GO:0044782) |
| 2.3 | 28.0 | GO:2000480 | negative regulation of cAMP-dependent protein kinase activity(GO:2000480) |
| 2.3 | 13.7 | GO:0033564 | anterior/posterior axon guidance(GO:0033564) |
| 2.2 | 15.3 | GO:0002318 | myeloid progenitor cell differentiation(GO:0002318) |
| 2.1 | 84.0 | GO:0016574 | histone ubiquitination(GO:0016574) |
| 2.0 | 116.7 | GO:0007062 | sister chromatid cohesion(GO:0007062) |
| 2.0 | 13.8 | GO:1900019 | regulation of protein kinase C activity(GO:1900019) positive regulation of protein kinase C activity(GO:1900020) |
| 2.0 | 68.9 | GO:0035235 | ionotropic glutamate receptor signaling pathway(GO:0035235) |
| 1.9 | 46.2 | GO:0031572 | mitotic G2 DNA damage checkpoint(GO:0007095) G2 DNA damage checkpoint(GO:0031572) |
| 1.9 | 19.0 | GO:0009134 | nucleoside diphosphate catabolic process(GO:0009134) |
| 1.8 | 72.9 | GO:1901381 | positive regulation of potassium ion transmembrane transport(GO:1901381) |
| 1.8 | 27.2 | GO:2001275 | positive regulation of glucose import in response to insulin stimulus(GO:2001275) |
| 1.7 | 20.1 | GO:0060539 | diaphragm development(GO:0060539) |
| 1.7 | 43.0 | GO:0014002 | astrocyte development(GO:0014002) |
| 1.6 | 11.5 | GO:0045048 | protein insertion into ER membrane(GO:0045048) |
| 1.5 | 6.0 | GO:0097681 | double-strand break repair via alternative nonhomologous end joining(GO:0097681) |
| 1.4 | 16.6 | GO:0051013 | microtubule severing(GO:0051013) |
| 1.4 | 70.0 | GO:0010165 | response to X-ray(GO:0010165) |
| 1.4 | 4.1 | GO:0034080 | CENP-A containing nucleosome assembly(GO:0034080) CENP-A containing chromatin organization(GO:0061641) |
| 1.3 | 14.6 | GO:0031914 | negative regulation of synaptic plasticity(GO:0031914) |
| 1.3 | 19.8 | GO:0045955 | negative regulation of calcium ion-dependent exocytosis(GO:0045955) |
| 1.3 | 7.7 | GO:1990928 | response to amino acid starvation(GO:1990928) |
| 1.3 | 1.3 | GO:1902953 | positive regulation of ER to Golgi vesicle-mediated transport(GO:1902953) |
| 1.2 | 25.7 | GO:0043084 | penile erection(GO:0043084) |
| 1.2 | 6.1 | GO:1901525 | negative regulation of macromitophagy(GO:1901525) |
| 1.2 | 6.0 | GO:1903817 | negative regulation of delayed rectifier potassium channel activity(GO:1902260) negative regulation of voltage-gated potassium channel activity(GO:1903817) |
| 1.2 | 3.5 | GO:1902037 | negative regulation of hematopoietic stem cell differentiation(GO:1902037) |
| 1.1 | 37.4 | GO:0030517 | negative regulation of axon extension(GO:0030517) |
| 1.1 | 133.4 | GO:0060271 | cilium morphogenesis(GO:0060271) |
| 1.1 | 161.9 | GO:0007018 | microtubule-based movement(GO:0007018) |
| 1.1 | 4.3 | GO:1902534 | single-organism membrane invagination(GO:1902534) |
| 1.0 | 8.3 | GO:0097461 | ferric iron import into cell(GO:0097461) ferric iron import across plasma membrane(GO:0098706) |
| 1.0 | 54.3 | GO:0021795 | cerebral cortex cell migration(GO:0021795) |
| 1.0 | 34.0 | GO:0051281 | positive regulation of release of sequestered calcium ion into cytosol(GO:0051281) |
| 1.0 | 9.9 | GO:2000781 | positive regulation of double-strand break repair(GO:2000781) |
| 1.0 | 6.8 | GO:0006659 | phosphatidylserine biosynthetic process(GO:0006659) |
| 1.0 | 17.3 | GO:0001573 | ganglioside metabolic process(GO:0001573) |
| 0.9 | 91.3 | GO:0006334 | nucleosome assembly(GO:0006334) |
| 0.9 | 9.2 | GO:0070995 | NADPH oxidation(GO:0070995) |
| 0.9 | 12.8 | GO:0001921 | positive regulation of receptor recycling(GO:0001921) |
| 0.8 | 4.9 | GO:2000622 | regulation of nuclear-transcribed mRNA catabolic process, nonsense-mediated decay(GO:2000622) negative regulation of nuclear-transcribed mRNA catabolic process, nonsense-mediated decay(GO:2000623) |
| 0.8 | 1.6 | GO:0032423 | regulation of mismatch repair(GO:0032423) |
| 0.8 | 122.7 | GO:0002244 | hematopoietic progenitor cell differentiation(GO:0002244) |
| 0.8 | 16.6 | GO:0071732 | cellular response to nitric oxide(GO:0071732) |
| 0.7 | 7.4 | GO:0006266 | DNA ligation(GO:0006266) |
| 0.7 | 101.7 | GO:0035725 | sodium ion transmembrane transport(GO:0035725) |
| 0.7 | 9.3 | GO:0097577 | intracellular sequestering of iron ion(GO:0006880) sequestering of iron ion(GO:0097577) |
| 0.7 | 9.8 | GO:1901642 | nucleoside transmembrane transport(GO:1901642) |
| 0.7 | 28.3 | GO:1901998 | toxin transport(GO:1901998) |
| 0.6 | 1.3 | GO:0046066 | purine deoxyribonucleoside diphosphate metabolic process(GO:0009182) deoxyribonucleoside diphosphate biosynthetic process(GO:0009189) glycoprotein transport(GO:0034436) dGDP metabolic process(GO:0046066) |
| 0.6 | 3.2 | GO:0071630 | nucleus-associated proteasomal ubiquitin-dependent protein catabolic process(GO:0071630) |
| 0.6 | 6.3 | GO:0048251 | elastic fiber assembly(GO:0048251) |
| 0.5 | 17.3 | GO:0061001 | regulation of dendritic spine morphogenesis(GO:0061001) |
| 0.5 | 12.4 | GO:0030252 | growth hormone secretion(GO:0030252) |
| 0.5 | 15.3 | GO:0071625 | vocalization behavior(GO:0071625) |
| 0.5 | 55.3 | GO:0007286 | spermatid development(GO:0007286) |
| 0.5 | 9.5 | GO:0035590 | purinergic nucleotide receptor signaling pathway(GO:0035590) |
| 0.5 | 5.1 | GO:0035970 | peptidyl-threonine dephosphorylation(GO:0035970) |
| 0.5 | 7.3 | GO:0038063 | collagen-activated tyrosine kinase receptor signaling pathway(GO:0038063) |
| 0.4 | 22.3 | GO:2001238 | positive regulation of extrinsic apoptotic signaling pathway(GO:2001238) |
| 0.4 | 44.6 | GO:0035335 | peptidyl-tyrosine dephosphorylation(GO:0035335) |
| 0.4 | 9.1 | GO:2000171 | negative regulation of dendrite development(GO:2000171) |
| 0.4 | 124.2 | GO:0007283 | spermatogenesis(GO:0007283) |
| 0.4 | 11.8 | GO:0051290 | protein heterotetramerization(GO:0051290) |
| 0.4 | 4.1 | GO:0021796 | cerebral cortex regionalization(GO:0021796) |
| 0.4 | 13.7 | GO:0007032 | endosome organization(GO:0007032) |
| 0.3 | 13.4 | GO:0007520 | myoblast fusion(GO:0007520) |
| 0.3 | 14.0 | GO:0050873 | brown fat cell differentiation(GO:0050873) |
| 0.3 | 9.3 | GO:1903959 | regulation of anion transmembrane transport(GO:1903959) |
| 0.3 | 2.2 | GO:0007253 | cytoplasmic sequestering of NF-kappaB(GO:0007253) |
| 0.3 | 6.9 | GO:0006301 | postreplication repair(GO:0006301) |
| 0.3 | 12.1 | GO:2000279 | negative regulation of DNA biosynthetic process(GO:2000279) |
| 0.3 | 5.9 | GO:0000301 | retrograde transport, vesicle recycling within Golgi(GO:0000301) |
| 0.2 | 16.8 | GO:0002437 | inflammatory response to antigenic stimulus(GO:0002437) |
| 0.2 | 22.1 | GO:0018210 | peptidyl-threonine modification(GO:0018210) |
| 0.2 | 5.1 | GO:0051703 | social behavior(GO:0035176) intraspecies interaction between organisms(GO:0051703) |
| 0.2 | 23.5 | GO:0007631 | feeding behavior(GO:0007631) |
| 0.2 | 18.0 | GO:0051092 | positive regulation of NF-kappaB transcription factor activity(GO:0051092) |
| 0.2 | 8.0 | GO:0016126 | sterol biosynthetic process(GO:0016126) |
| 0.1 | 0.3 | GO:0010968 | regulation of microtubule nucleation(GO:0010968) |
| 0.1 | 46.1 | GO:0016311 | dephosphorylation(GO:0016311) |
| 0.1 | 3.4 | GO:0045839 | negative regulation of mitotic nuclear division(GO:0045839) |
| 0.1 | 3.4 | GO:0045071 | negative regulation of viral genome replication(GO:0045071) |
| 0.1 | 9.2 | GO:0007416 | synapse assembly(GO:0007416) |
| 0.1 | 1.8 | GO:0010761 | fibroblast migration(GO:0010761) |
| 0.1 | 4.7 | GO:0001824 | blastocyst development(GO:0001824) |
| 0.1 | 3.9 | GO:0090502 | RNA phosphodiester bond hydrolysis, endonucleolytic(GO:0090502) |
| 0.0 | 15.8 | GO:0031344 | regulation of cell projection organization(GO:0031344) |
| 0.0 | 8.8 | GO:0198738 | Wnt signaling pathway(GO:0016055) cell-cell signaling by wnt(GO:0198738) |
| 0.0 | 0.8 | GO:0043001 | Golgi to plasma membrane protein transport(GO:0043001) |
| 0.0 | 3.2 | GO:0006898 | receptor-mediated endocytosis(GO:0006898) |
| 0.0 | 1.1 | GO:0007156 | homophilic cell adhesion via plasma membrane adhesion molecules(GO:0007156) |
Gene overrepresentation in cellular component category:
| Log-likelihood per target | Total log-likelihood | Term | Description |
|---|---|---|---|
| 37.9 | 151.5 | GO:0002079 | inner acrosomal membrane(GO:0002079) |
| 30.0 | 180.1 | GO:0036157 | outer dynein arm(GO:0036157) |
| 28.2 | 112.8 | GO:0033503 | HULC complex(GO:0033503) |
| 17.4 | 69.5 | GO:0042585 | germinal vesicle(GO:0042585) |
| 16.7 | 116.7 | GO:0034991 | nuclear meiotic cohesin complex(GO:0034991) |
| 16.3 | 114.4 | GO:0030991 | intraciliary transport particle A(GO:0030991) |
| 14.9 | 59.5 | GO:0036156 | inner dynein arm(GO:0036156) |
| 13.2 | 26.4 | GO:0016939 | kinesin II complex(GO:0016939) |
| 12.1 | 374.5 | GO:0097228 | sperm principal piece(GO:0097228) |
| 11.6 | 196.8 | GO:0008250 | oligosaccharyltransferase complex(GO:0008250) |
| 10.8 | 43.4 | GO:0031021 | interphase microtubule organizing center(GO:0031021) |
| 10.3 | 41.2 | GO:0097427 | microtubule bundle(GO:0097427) |
| 10.0 | 239.3 | GO:0002080 | acrosomal membrane(GO:0002080) |
| 9.8 | 68.7 | GO:0034464 | BBSome(GO:0034464) |
| 9.6 | 48.1 | GO:0097425 | smooth endoplasmic reticulum membrane(GO:0030868) smooth endoplasmic reticulum part(GO:0097425) |
| 8.1 | 56.8 | GO:0043203 | axon hillock(GO:0043203) |
| 7.7 | 727.2 | GO:0097014 | axoneme(GO:0005930) ciliary plasm(GO:0097014) |
| 7.3 | 43.8 | GO:0032983 | kainate selective glutamate receptor complex(GO:0032983) |
| 7.0 | 28.0 | GO:0005952 | cAMP-dependent protein kinase complex(GO:0005952) |
| 6.9 | 83.1 | GO:0097539 | ciliary transition fiber(GO:0097539) |
| 6.9 | 41.2 | GO:0005672 | transcription factor TFIIA complex(GO:0005672) |
| 6.6 | 106.1 | GO:0030990 | intraciliary transport particle(GO:0030990) |
| 5.8 | 17.3 | GO:0034686 | integrin alphav-beta8 complex(GO:0034686) |
| 5.4 | 16.3 | GO:1990723 | cytoplasmic periphery of the nuclear pore complex(GO:1990723) |
| 4.5 | 76.6 | GO:0097225 | sperm midpiece(GO:0097225) |
| 4.5 | 103.6 | GO:0032391 | photoreceptor connecting cilium(GO:0032391) |
| 4.4 | 84.3 | GO:0097546 | ciliary base(GO:0097546) |
| 4.1 | 196.0 | GO:0036126 | sperm flagellum(GO:0036126) |
| 4.1 | 142.8 | GO:0030286 | dynein complex(GO:0030286) |
| 4.0 | 40.3 | GO:0014731 | spectrin-associated cytoskeleton(GO:0014731) |
| 3.8 | 19.0 | GO:0097136 | Bcl-2 family protein complex(GO:0097136) |
| 3.4 | 50.7 | GO:0036038 | MKS complex(GO:0036038) |
| 3.2 | 32.0 | GO:0035748 | myelin sheath abaxonal region(GO:0035748) |
| 3.2 | 31.7 | GO:0045254 | pyruvate dehydrogenase complex(GO:0045254) |
| 3.1 | 55.1 | GO:0048188 | Set1C/COMPASS complex(GO:0048188) |
| 3.0 | 8.9 | GO:0033165 | interphotoreceptor matrix(GO:0033165) |
| 2.9 | 88.5 | GO:0030673 | axolemma(GO:0030673) |
| 2.7 | 13.7 | GO:0070695 | FHF complex(GO:0070695) |
| 2.4 | 11.8 | GO:0017071 | intracellular cyclic nucleotide activated cation channel complex(GO:0017071) |
| 2.3 | 27.9 | GO:0098839 | postsynaptic density membrane(GO:0098839) |
| 2.2 | 47.1 | GO:0097449 | astrocyte projection(GO:0097449) |
| 2.2 | 43.4 | GO:0001673 | male germ cell nucleus(GO:0001673) |
| 2.2 | 62.5 | GO:0030687 | preribosome, large subunit precursor(GO:0030687) |
| 2.1 | 25.0 | GO:0002199 | zona pellucida receptor complex(GO:0002199) |
| 2.0 | 16.2 | GO:0035869 | ciliary transition zone(GO:0035869) |
| 1.6 | 4.9 | GO:0070939 | Dsl1p complex(GO:0070939) |
| 1.5 | 9.2 | GO:0044224 | juxtaparanode region of axon(GO:0044224) |
| 1.5 | 53.8 | GO:0031514 | motile cilium(GO:0031514) |
| 1.5 | 4.4 | GO:1990415 | Pex17p-Pex14p docking complex(GO:1990415) peroxisomal importomer complex(GO:1990429) |
| 1.4 | 27.1 | GO:0005942 | phosphatidylinositol 3-kinase complex(GO:0005942) |
| 1.4 | 7.1 | GO:0008622 | epsilon DNA polymerase complex(GO:0008622) |
| 1.3 | 6.3 | GO:0030485 | smooth muscle contractile fiber(GO:0030485) |
| 1.1 | 7.7 | GO:0005850 | eukaryotic translation initiation factor 2 complex(GO:0005850) |
| 1.1 | 66.8 | GO:0036064 | ciliary basal body(GO:0036064) |
| 1.0 | 24.8 | GO:0033176 | proton-transporting V-type ATPase complex(GO:0033176) |
| 0.9 | 16.0 | GO:0070938 | lamellipodium membrane(GO:0031258) contractile ring(GO:0070938) |
| 0.9 | 7.3 | GO:0098645 | collagen type IV trimer(GO:0005587) network-forming collagen trimer(GO:0098642) collagen network(GO:0098645) |
| 0.9 | 86.1 | GO:0000786 | nucleosome(GO:0000786) |
| 0.9 | 6.9 | GO:0030915 | Smc5-Smc6 complex(GO:0030915) |
| 0.8 | 28.7 | GO:0035861 | site of double-strand break(GO:0035861) |
| 0.8 | 75.6 | GO:0008076 | voltage-gated potassium channel complex(GO:0008076) |
| 0.8 | 16.6 | GO:0008074 | guanylate cyclase complex, soluble(GO:0008074) |
| 0.7 | 3.6 | GO:0000235 | astral microtubule(GO:0000235) aster(GO:0005818) |
| 0.7 | 32.1 | GO:0010494 | cytoplasmic stress granule(GO:0010494) |
| 0.7 | 125.2 | GO:0005929 | cilium(GO:0005929) |
| 0.6 | 28.3 | GO:0031594 | neuromuscular junction(GO:0031594) |
| 0.6 | 9.5 | GO:0031229 | integral component of nuclear inner membrane(GO:0005639) intrinsic component of nuclear inner membrane(GO:0031229) |
| 0.6 | 29.0 | GO:0009295 | nucleoid(GO:0009295) mitochondrial nucleoid(GO:0042645) |
| 0.4 | 18.3 | GO:0016235 | aggresome(GO:0016235) |
| 0.4 | 13.8 | GO:0045334 | clathrin-coated endocytic vesicle(GO:0045334) |
| 0.4 | 10.2 | GO:0097440 | apical dendrite(GO:0097440) |
| 0.4 | 5.9 | GO:0017119 | Golgi transport complex(GO:0017119) |
| 0.4 | 43.1 | GO:0005604 | basement membrane(GO:0005604) |
| 0.4 | 6.4 | GO:0033202 | Ino80 complex(GO:0031011) DNA helicase complex(GO:0033202) |
| 0.4 | 5.1 | GO:0031045 | dense core granule(GO:0031045) |
| 0.4 | 143.7 | GO:0005813 | centrosome(GO:0005813) |
| 0.3 | 31.6 | GO:0030175 | filopodium(GO:0030175) |
| 0.3 | 49.5 | GO:0019897 | extrinsic component of plasma membrane(GO:0019897) |
| 0.3 | 3.2 | GO:0098799 | outer mitochondrial membrane protein complex(GO:0098799) |
| 0.3 | 9.2 | GO:0005891 | voltage-gated calcium channel complex(GO:0005891) |
| 0.3 | 2.2 | GO:0033256 | I-kappaB/NF-kappaB complex(GO:0033256) |
| 0.3 | 17.6 | GO:0009898 | cytoplasmic side of plasma membrane(GO:0009898) |
| 0.3 | 23.5 | GO:0031225 | anchored component of membrane(GO:0031225) |
| 0.3 | 6.1 | GO:0071782 | endoplasmic reticulum tubular network(GO:0071782) |
| 0.2 | 22.1 | GO:0017053 | transcriptional repressor complex(GO:0017053) |
| 0.2 | 3.8 | GO:0030285 | integral component of synaptic vesicle membrane(GO:0030285) intrinsic component of synaptic vesicle membrane(GO:0098563) |
| 0.2 | 16.1 | GO:0031463 | Cul3-RING ubiquitin ligase complex(GO:0031463) |
| 0.2 | 12.6 | GO:0031901 | early endosome membrane(GO:0031901) |
| 0.2 | 8.0 | GO:0030667 | secretory granule membrane(GO:0030667) |
| 0.1 | 18.9 | GO:0005923 | bicellular tight junction(GO:0005923) |
| 0.1 | 7.7 | GO:0016605 | PML body(GO:0016605) |
| 0.1 | 10.6 | GO:0030426 | growth cone(GO:0030426) |
| 0.1 | 4.1 | GO:0000777 | condensed chromosome kinetochore(GO:0000777) |
| 0.0 | 12.8 | GO:0043235 | receptor complex(GO:0043235) |
| 0.0 | 2.1 | GO:0005747 | mitochondrial respiratory chain complex I(GO:0005747) NADH dehydrogenase complex(GO:0030964) respiratory chain complex I(GO:0045271) |
| 0.0 | 5.1 | GO:0005802 | trans-Golgi network(GO:0005802) |
Gene overrepresentation in molecular function category:
| Log-likelihood per target | Total log-likelihood | Term | Description |
|---|---|---|---|
| 32.9 | 131.8 | GO:0004127 | cytidylate kinase activity(GO:0004127) |
| 17.7 | 88.5 | GO:0005314 | high-affinity glutamate transmembrane transporter activity(GO:0005314) |
| 16.9 | 50.7 | GO:0072590 | N-acetyl-L-aspartate-L-glutamate ligase activity(GO:0072590) |
| 16.5 | 49.6 | GO:0001641 | group II metabotropic glutamate receptor activity(GO:0001641) |
| 16.1 | 112.7 | GO:0005432 | calcium:sodium antiporter activity(GO:0005432) |
| 14.1 | 196.8 | GO:0004579 | oligosaccharyl transferase activity(GO:0004576) dolichyl-diphosphooligosaccharide-protein glycotransferase activity(GO:0004579) |
| 12.4 | 49.7 | GO:0045174 | oxidoreductase activity, acting on a sulfur group of donors, quinone or similar compound as acceptor(GO:0016672) oxidoreductase activity, acting on phosphorus or arsenic in donors(GO:0030613) oxidoreductase activity, acting on phosphorus or arsenic in donors, disulfide as acceptor(GO:0030614) glutathione dehydrogenase (ascorbate) activity(GO:0045174) methylarsonate reductase activity(GO:0050610) |
| 10.7 | 32.0 | GO:0042903 | tubulin deacetylase activity(GO:0042903) |
| 10.2 | 71.7 | GO:0015277 | kainate selective glutamate receptor activity(GO:0015277) |
| 9.8 | 98.1 | GO:0008239 | dipeptidyl-peptidase activity(GO:0008239) |
| 9.7 | 58.3 | GO:0004634 | phosphopyruvate hydratase activity(GO:0004634) |
| 9.7 | 38.8 | GO:0008569 | ATP-dependent microtubule motor activity, minus-end-directed(GO:0008569) |
| 7.9 | 31.7 | GO:0004739 | pyruvate dehydrogenase (acetyl-transferring) activity(GO:0004739) |
| 7.5 | 74.6 | GO:0045505 | dynein intermediate chain binding(GO:0045505) |
| 7.0 | 83.4 | GO:0019869 | chloride channel inhibitor activity(GO:0019869) |
| 6.6 | 39.4 | GO:0004128 | cytochrome-b5 reductase activity, acting on NAD(P)H(GO:0004128) |
| 6.2 | 43.4 | GO:0045503 | dynein light chain binding(GO:0045503) |
| 5.9 | 41.2 | GO:0004468 | lysine N-acetyltransferase activity, acting on acetyl phosphate as donor(GO:0004468) |
| 5.3 | 16.0 | GO:0004647 | phosphoserine phosphatase activity(GO:0004647) |
| 5.2 | 26.1 | GO:0008332 | low voltage-gated calcium channel activity(GO:0008332) |
| 5.0 | 40.3 | GO:0004565 | beta-galactosidase activity(GO:0004565) |
| 4.8 | 58.0 | GO:0003841 | 1-acylglycerol-3-phosphate O-acyltransferase activity(GO:0003841) |
| 4.5 | 27.2 | GO:0046935 | 1-phosphatidylinositol-3-kinase regulator activity(GO:0046935) |
| 4.3 | 357.8 | GO:0003777 | microtubule motor activity(GO:0003777) |
| 4.0 | 28.0 | GO:0008603 | cAMP-dependent protein kinase regulator activity(GO:0008603) |
| 3.7 | 40.9 | GO:0004653 | polypeptide N-acetylgalactosaminyltransferase activity(GO:0004653) |
| 3.6 | 10.7 | GO:0008263 | pyrimidine-specific mismatch base pair DNA N-glycosylase activity(GO:0008263) |
| 3.4 | 17.0 | GO:0008093 | cytoskeletal adaptor activity(GO:0008093) |
| 3.3 | 52.0 | GO:0004550 | nucleoside diphosphate kinase activity(GO:0004550) |
| 3.2 | 12.8 | GO:0019784 | NEDD8-specific protease activity(GO:0019784) |
| 3.2 | 19.0 | GO:0051434 | BH3 domain binding(GO:0051434) |
| 2.9 | 17.6 | GO:0004726 | non-membrane spanning protein tyrosine phosphatase activity(GO:0004726) |
| 2.9 | 14.6 | GO:0098518 | polynucleotide phosphatase activity(GO:0098518) |
| 2.9 | 58.4 | GO:0004697 | protein kinase C activity(GO:0004697) |
| 2.8 | 13.8 | GO:0046923 | ER retention sequence binding(GO:0046923) |
| 2.7 | 13.7 | GO:0005042 | netrin receptor activity(GO:0005042) |
| 2.7 | 45.3 | GO:0097602 | cullin family protein binding(GO:0097602) |
| 2.4 | 9.6 | GO:0070739 | protein-glutamic acid ligase activity(GO:0070739) |
| 2.2 | 55.1 | GO:0042800 | histone methyltransferase activity (H3-K4 specific)(GO:0042800) |
| 2.2 | 17.3 | GO:1990430 | extracellular matrix protein binding(GO:1990430) |
| 2.1 | 42.9 | GO:0031005 | filamin binding(GO:0031005) |
| 2.1 | 82.0 | GO:0004712 | protein serine/threonine/tyrosine kinase activity(GO:0004712) |
| 2.1 | 18.6 | GO:0030235 | nitric-oxide synthase regulator activity(GO:0030235) |
| 2.1 | 82.6 | GO:0048487 | beta-tubulin binding(GO:0048487) |
| 2.1 | 164.6 | GO:0043621 | protein self-association(GO:0043621) |
| 2.0 | 6.1 | GO:0005135 | erythropoietin receptor binding(GO:0005128) interleukin-3 receptor binding(GO:0005135) |
| 1.9 | 20.5 | GO:0016888 | endodeoxyribonuclease activity, producing 5'-phosphomonoesters(GO:0016888) |
| 1.7 | 49.9 | GO:0004693 | cyclin-dependent protein serine/threonine kinase activity(GO:0004693) |
| 1.7 | 47.9 | GO:0044183 | protein binding involved in protein folding(GO:0044183) |
| 1.7 | 66.1 | GO:0005246 | calcium channel regulator activity(GO:0005246) |
| 1.6 | 54.9 | GO:0001103 | RNA polymerase II repressing transcription factor binding(GO:0001103) |
| 1.5 | 7.7 | GO:0070139 | ubiquitin-like protein-specific endopeptidase activity(GO:0070137) SUMO-specific endopeptidase activity(GO:0070139) |
| 1.4 | 29.5 | GO:0032183 | SUMO binding(GO:0032183) |
| 1.4 | 35.9 | GO:0031624 | ubiquitin conjugating enzyme binding(GO:0031624) |
| 1.4 | 8.3 | GO:0052851 | cupric reductase activity(GO:0008823) ferric-chelate reductase (NADPH) activity(GO:0052851) |
| 1.3 | 14.8 | GO:0051011 | microtubule minus-end binding(GO:0051011) |
| 1.2 | 28.3 | GO:0016922 | ligand-dependent nuclear receptor binding(GO:0016922) |
| 1.2 | 18.3 | GO:0071933 | Arp2/3 complex binding(GO:0071933) |
| 1.2 | 16.6 | GO:0008568 | microtubule-severing ATPase activity(GO:0008568) |
| 1.2 | 19.0 | GO:0017110 | nucleoside-diphosphatase activity(GO:0017110) |
| 1.2 | 60.1 | GO:0008138 | protein tyrosine/serine/threonine phosphatase activity(GO:0008138) |
| 1.2 | 46.3 | GO:0051393 | alpha-actinin binding(GO:0051393) |
| 1.1 | 56.8 | GO:0003774 | motor activity(GO:0003774) |
| 1.1 | 9.8 | GO:0008504 | monoamine transmembrane transporter activity(GO:0008504) |
| 1.1 | 40.3 | GO:0030507 | spectrin binding(GO:0030507) |
| 1.1 | 9.5 | GO:0035381 | extracellular ATP-gated cation channel activity(GO:0004931) ATP-gated ion channel activity(GO:0035381) |
| 1.0 | 18.1 | GO:0003993 | acid phosphatase activity(GO:0003993) |
| 0.9 | 11.9 | GO:0030215 | semaphorin receptor binding(GO:0030215) |
| 0.9 | 49.3 | GO:0004722 | protein serine/threonine phosphatase activity(GO:0004722) |
| 0.8 | 121.6 | GO:0005516 | calmodulin binding(GO:0005516) |
| 0.7 | 16.6 | GO:0004383 | guanylate cyclase activity(GO:0004383) |
| 0.7 | 12.8 | GO:0015026 | coreceptor activity(GO:0015026) |
| 0.7 | 20.0 | GO:0030552 | cAMP binding(GO:0030552) |
| 0.7 | 66.2 | GO:0017137 | Rab GTPase binding(GO:0017137) |
| 0.7 | 87.4 | GO:0051015 | actin filament binding(GO:0051015) |
| 0.6 | 9.1 | GO:0070679 | inositol 1,4,5 trisphosphate binding(GO:0070679) |
| 0.6 | 10.8 | GO:0070628 | proteasome binding(GO:0070628) |
| 0.6 | 13.0 | GO:0003756 | protein disulfide isomerase activity(GO:0003756) intramolecular oxidoreductase activity, transposing S-S bonds(GO:0016864) |
| 0.6 | 26.6 | GO:0019894 | kinesin binding(GO:0019894) |
| 0.6 | 20.3 | GO:0051059 | NF-kappaB binding(GO:0051059) |
| 0.5 | 2.7 | GO:0004673 | phosphorelay sensor kinase activity(GO:0000155) protein histidine kinase activity(GO:0004673) |
| 0.5 | 19.3 | GO:0032266 | phosphatidylinositol-3-phosphate binding(GO:0032266) |
| 0.5 | 9.3 | GO:0008199 | ferric iron binding(GO:0008199) |
| 0.5 | 144.7 | GO:0030695 | GTPase regulator activity(GO:0030695) |
| 0.5 | 4.0 | GO:0004865 | protein serine/threonine phosphatase inhibitor activity(GO:0004865) |
| 0.5 | 45.9 | GO:0008080 | N-acetyltransferase activity(GO:0008080) |
| 0.5 | 223.5 | GO:0004842 | ubiquitin-protein transferase activity(GO:0004842) |
| 0.5 | 9.3 | GO:0005247 | voltage-gated chloride channel activity(GO:0005247) |
| 0.5 | 32.9 | GO:0004197 | cysteine-type endopeptidase activity(GO:0004197) |
| 0.5 | 6.0 | GO:0008409 | 5'-3' exonuclease activity(GO:0008409) |
| 0.4 | 76.4 | GO:0035091 | phosphatidylinositol binding(GO:0035091) |
| 0.4 | 9.2 | GO:0004033 | aldo-keto reductase (NADP) activity(GO:0004033) |
| 0.4 | 22.8 | GO:0005044 | scavenger receptor activity(GO:0005044) |
| 0.4 | 5.0 | GO:0070008 | serine-type exopeptidase activity(GO:0070008) |
| 0.4 | 3.4 | GO:0001730 | 2'-5'-oligoadenylate synthetase activity(GO:0001730) |
| 0.4 | 137.1 | GO:0005525 | GTP binding(GO:0005525) |
| 0.4 | 36.9 | GO:0001158 | enhancer sequence-specific DNA binding(GO:0001158) |
| 0.3 | 60.6 | GO:0016791 | phosphatase activity(GO:0016791) |
| 0.3 | 22.8 | GO:0003725 | double-stranded RNA binding(GO:0003725) |
| 0.3 | 16.0 | GO:0000049 | tRNA binding(GO:0000049) |
| 0.3 | 1.8 | GO:0016308 | 1-phosphatidylinositol-4-phosphate 5-kinase activity(GO:0016308) |
| 0.3 | 7.7 | GO:0005184 | neuropeptide hormone activity(GO:0005184) |
| 0.2 | 30.7 | GO:0008017 | microtubule binding(GO:0008017) |
| 0.2 | 155.0 | GO:0005509 | calcium ion binding(GO:0005509) |
| 0.2 | 4.0 | GO:0030276 | clathrin binding(GO:0030276) |
| 0.2 | 1.3 | GO:0004385 | guanylate kinase activity(GO:0004385) |
| 0.2 | 3.5 | GO:0001106 | RNA polymerase II transcription corepressor activity(GO:0001106) |
| 0.2 | 12.1 | GO:0043130 | ubiquitin binding(GO:0043130) |
| 0.1 | 5.1 | GO:0001105 | RNA polymerase II transcription coactivator activity(GO:0001105) |
| 0.1 | 6.3 | GO:0019888 | protein phosphatase regulator activity(GO:0019888) |
| 0.1 | 8.6 | GO:0030674 | protein binding, bridging(GO:0030674) |
| 0.1 | 17.8 | GO:0005125 | cytokine activity(GO:0005125) |
| 0.1 | 12.3 | GO:0042626 | ATPase activity, coupled to transmembrane movement of substances(GO:0042626) |
| 0.0 | 1.3 | GO:0005484 | SNAP receptor activity(GO:0005484) |
Gene overrepresentation in curated gene sets: canonical pathways category:
| Log-likelihood per target | Total log-likelihood | Term | Description |
|---|---|---|---|
| 1.8 | 56.8 | PID INSULIN GLUCOSE PATHWAY | Insulin-mediated glucose transport |
| 1.6 | 26.9 | PID ERB GENOMIC PATHWAY | Validated nuclear estrogen receptor beta network |
| 1.5 | 83.1 | PID PLK1 PATHWAY | PLK1 signaling events |
| 1.3 | 16.3 | PID RANBP2 PATHWAY | Sumoylation by RanBP2 regulates transcriptional repression |
| 1.2 | 19.0 | SA PROGRAMMED CELL DEATH | Programmed cell death, or apoptosis, eliminates damaged or unneeded cells. |
| 1.2 | 62.6 | PID HEDGEHOG GLI PATHWAY | Hedgehog signaling events mediated by Gli proteins |
| 1.1 | 32.0 | PID HDAC CLASSIII PATHWAY | Signaling events mediated by HDAC Class III |
| 1.0 | 50.4 | NABA BASEMENT MEMBRANES | Genes encoding structural components of basement membranes |
| 1.0 | 12.8 | PID HEDGEHOG 2PATHWAY | Signaling events mediated by the Hedgehog family |
| 0.9 | 27.2 | PID TRAIL PATHWAY | TRAIL signaling pathway |
| 0.8 | 17.3 | PID INTEGRIN5 PATHWAY | Beta5 beta6 beta7 and beta8 integrin cell surface interactions |
| 0.8 | 28.0 | PID INTEGRIN A4B1 PATHWAY | Alpha4 beta1 integrin signaling events |
| 0.7 | 13.3 | PID WNT CANONICAL PATHWAY | Canonical Wnt signaling pathway |
| 0.7 | 27.9 | PID NCADHERIN PATHWAY | N-cadherin signaling events |
| 0.5 | 10.9 | PID ARF 3PATHWAY | Arf1 pathway |
| 0.5 | 37.3 | PID BETA CATENIN NUC PATHWAY | Regulation of nuclear beta catenin signaling and target gene transcription |
| 0.5 | 10.9 | PID NETRIN PATHWAY | Netrin-mediated signaling events |
| 0.4 | 15.1 | SIG REGULATION OF THE ACTIN CYTOSKELETON BY RHO GTPASES | Genes related to regulation of the actin cytoskeleton |
| 0.4 | 7.7 | ST WNT BETA CATENIN PATHWAY | Wnt/beta-catenin Pathway |
| 0.4 | 44.0 | PID PDGFRB PATHWAY | PDGFR-beta signaling pathway |
| 0.3 | 6.1 | PID ERBB2 ERBB3 PATHWAY | ErbB2/ErbB3 signaling events |
| 0.2 | 7.7 | PID CERAMIDE PATHWAY | Ceramide signaling pathway |
| 0.2 | 4.0 | PID DNA PK PATHWAY | DNA-PK pathway in nonhomologous end joining |
| 0.2 | 5.1 | PID ERBB4 PATHWAY | ErbB4 signaling events |
| 0.2 | 21.8 | PID P53 DOWNSTREAM PATHWAY | Direct p53 effectors |
| 0.1 | 2.3 | PID EPHA FWDPATHWAY | EPHA forward signaling |
| 0.1 | 2.2 | ST GAQ PATHWAY | G alpha q Pathway |
| 0.1 | 4.7 | PID AR PATHWAY | Coregulation of Androgen receptor activity |
| 0.1 | 1.6 | PID IL8 CXCR1 PATHWAY | IL8- and CXCR1-mediated signaling events |
| 0.1 | 4.1 | ST INTEGRIN SIGNALING PATHWAY | Integrin Signaling Pathway |
| 0.1 | 2.1 | PID FOXM1 PATHWAY | FOXM1 transcription factor network |
| 0.0 | 1.7 | PID HIF1 TFPATHWAY | HIF-1-alpha transcription factor network |
| 0.0 | 0.4 | PID RAS PATHWAY | Regulation of Ras family activation |
Gene overrepresentation in curated gene sets: REACTOME pathways category:
| Log-likelihood per target | Total log-likelihood | Term | Description |
|---|---|---|---|
| 3.0 | 56.8 | REACTOME TGF BETA RECEPTOR SIGNALING IN EMT EPITHELIAL TO MESENCHYMAL TRANSITION | Genes involved in TGF-beta receptor signaling in EMT (epithelial to mesenchymal transition) |
| 2.7 | 43.8 | REACTOME IONOTROPIC ACTIVITY OF KAINATE RECEPTORS | Genes involved in Ionotropic activity of Kainate Receptors |
| 2.5 | 47.7 | REACTOME TRAFFICKING OF GLUR2 CONTAINING AMPA RECEPTORS | Genes involved in Trafficking of GluR2-containing AMPA receptors |
| 2.3 | 49.6 | REACTOME CLASS C 3 METABOTROPIC GLUTAMATE PHEROMONE RECEPTORS | Genes involved in Class C/3 (Metabotropic glutamate/pheromone receptors) |
| 2.1 | 116.7 | REACTOME MEIOTIC SYNAPSIS | Genes involved in Meiotic Synapsis |
| 1.8 | 27.2 | REACTOME IL 7 SIGNALING | Genes involved in Interleukin-7 signaling |
| 1.8 | 58.0 | REACTOME SYNTHESIS OF PA | Genes involved in Synthesis of PA |
| 1.7 | 49.7 | REACTOME GLUTATHIONE CONJUGATION | Genes involved in Glutathione conjugation |
| 1.6 | 7.8 | REACTOME CHROMOSOME MAINTENANCE | Genes involved in Chromosome Maintenance |
| 1.5 | 86.0 | REACTOME AMINO ACID AND OLIGOPEPTIDE SLC TRANSPORTERS | Genes involved in Amino acid and oligopeptide SLC transporters |
| 1.3 | 122.1 | REACTOME ASPARAGINE N LINKED GLYCOSYLATION | Genes involved in Asparagine N-linked glycosylation |
| 1.3 | 28.0 | REACTOME PKA MEDIATED PHOSPHORYLATION OF CREB | Genes involved in PKA-mediated phosphorylation of CREB |
| 1.2 | 24.9 | REACTOME MHC CLASS II ANTIGEN PRESENTATION | Genes involved in MHC class II antigen presentation |
| 1.2 | 40.3 | REACTOME INTERACTION BETWEEN L1 AND ANKYRINS | Genes involved in Interaction between L1 and Ankyrins |
| 1.0 | 17.3 | REACTOME INTEGRIN CELL SURFACE INTERACTIONS | Genes involved in Integrin cell surface interactions |
| 1.0 | 19.0 | REACTOME INFLAMMASOMES | Genes involved in Inflammasomes |
| 1.0 | 24.8 | REACTOME INSULIN RECEPTOR RECYCLING | Genes involved in Insulin receptor recycling |
| 0.9 | 40.9 | REACTOME O LINKED GLYCOSYLATION OF MUCINS | Genes involved in O-linked glycosylation of mucins |
| 0.9 | 56.3 | REACTOME LOSS OF NLP FROM MITOTIC CENTROSOMES | Genes involved in Loss of Nlp from mitotic centrosomes |
| 0.8 | 10.7 | REACTOME BASE FREE SUGAR PHOSPHATE REMOVAL VIA THE SINGLE NUCLEOTIDE REPLACEMENT PATHWAY | Genes involved in Base-free sugar-phosphate removal via the single-nucleotide replacement pathway |
| 0.5 | 8.7 | REACTOME SYNTHESIS OF PIPS AT THE GOLGI MEMBRANE | Genes involved in Synthesis of PIPs at the Golgi membrane |
| 0.4 | 16.9 | REACTOME GLYCOSPHINGOLIPID METABOLISM | Genes involved in Glycosphingolipid metabolism |
| 0.4 | 6.1 | REACTOME DOWNREGULATION OF ERBB2 ERBB3 SIGNALING | Genes involved in Downregulation of ERBB2:ERBB3 signaling |
| 0.3 | 9.8 | REACTOME TRANSPORT OF VITAMINS NUCLEOSIDES AND RELATED MOLECULES | Genes involved in Transport of vitamins, nucleosides, and related molecules |
| 0.3 | 4.1 | REACTOME NRIF SIGNALS CELL DEATH FROM THE NUCLEUS | Genes involved in NRIF signals cell death from the nucleus |
| 0.3 | 25.6 | REACTOME CLASS B 2 SECRETIN FAMILY RECEPTORS | Genes involved in Class B/2 (Secretin family receptors) |
| 0.2 | 6.3 | REACTOME SEMA4D INDUCED CELL MIGRATION AND GROWTH CONE COLLAPSE | Genes involved in Sema4D induced cell migration and growth-cone collapse |
| 0.2 | 52.8 | REACTOME ANTIGEN PROCESSING UBIQUITINATION PROTEASOME DEGRADATION | Genes involved in Antigen processing: Ubiquitination & Proteasome degradation |
| 0.2 | 6.8 | REACTOME NITRIC OXIDE STIMULATES GUANYLATE CYCLASE | Genes involved in Nitric oxide stimulates guanylate cyclase |
| 0.2 | 16.3 | REACTOME MITOTIC PROMETAPHASE | Genes involved in Mitotic Prometaphase |
| 0.2 | 2.2 | REACTOME ACTIVATION OF NF KAPPAB IN B CELLS | Genes involved in Activation of NF-kappaB in B Cells |
| 0.2 | 10.9 | REACTOME NETRIN1 SIGNALING | Genes involved in Netrin-1 signaling |
| 0.2 | 4.6 | REACTOME G0 AND EARLY G1 | Genes involved in G0 and Early G1 |
| 0.1 | 1.3 | REACTOME ABACAVIR TRANSPORT AND METABOLISM | Genes involved in Abacavir transport and metabolism |
| 0.1 | 2.3 | REACTOME KINESINS | Genes involved in Kinesins |