Project
GSE53960: rat RNA-Seq transcriptomic Bodymap
Navigation
Downloads
Results for Prdm4
Z-value: 0.28
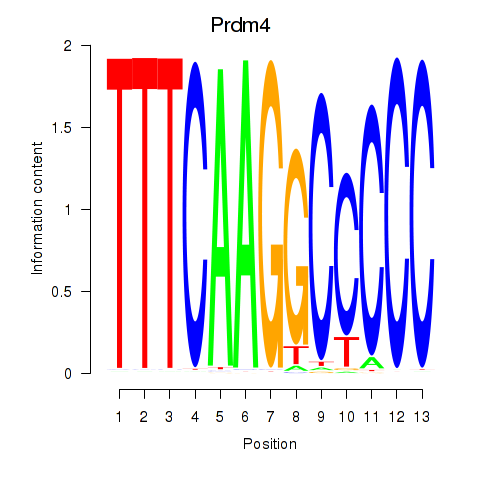
Motif logo
Transcription factors associated with Prdm4
| Gene Symbol | Gene ID | Gene Info |
|---|---|---|
|
Prdm4
|
ENSRNOG00000004962 | PR/SET domain 4 |
Activity-expression correlation:
| Gene | Promoter | Pearson corr. coef. | P-value | Plot |
|---|---|---|---|---|
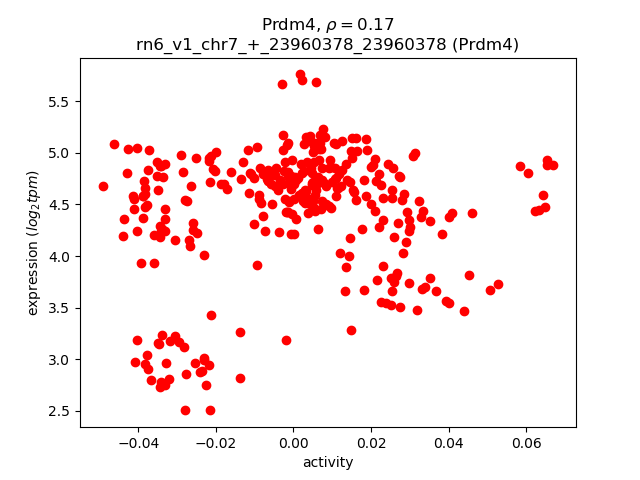
| Prdm4 | rn6_v1_chr7_+_23960378_23960378 | 0.17 | 2.0e-03 | Click! |
Activity profile of Prdm4 motif
Sorted Z-values of Prdm4 motif
| Promoter | Log-likelihood | Transcript | Gene | Gene Info |
|---|---|---|---|---|
| chr9_-_80167033 | 11.89 |
ENSRNOT00000023530
|
Igfbp5
|
insulin-like growth factor binding protein 5 |
| chr18_+_36371041 | 11.81 |
ENSRNOT00000025408
|
Sh3rf2
|
SH3 domain containing ring finger 2 |
| chr9_-_80166807 | 10.92 |
ENSRNOT00000079493
|
Igfbp5
|
insulin-like growth factor binding protein 5 |
| chr1_-_89190128 | 6.07 |
ENSRNOT00000067813
|
Gapdhs
|
glyceraldehyde-3-phosphate dehydrogenase, spermatogenic |
| chr1_-_89194602 | 5.58 |
ENSRNOT00000028518
|
Gapdhs
|
glyceraldehyde-3-phosphate dehydrogenase, spermatogenic |
| chr3_+_11424099 | 5.38 |
ENSRNOT00000019184
|
Ptges2
|
prostaglandin E synthase 2 |
| chr1_-_107373807 | 3.72 |
ENSRNOT00000056024
|
Svip
|
small VCP interacting protein |
| chr6_+_3012804 | 3.10 |
ENSRNOT00000061980
|
Arhgef33
|
Rho guanine nucleotide exchange factor 33 |
| chr4_+_26470864 | 1.11 |
ENSRNOT00000021979
|
Fzd1
|
frizzled class receptor 1 |
| chrX_+_43535737 | 0.89 |
ENSRNOT00000087073
|
LOC102557137
|
E3 ubiquitin-protein ligase RNF168-like |
| chr12_+_11407213 | 0.69 |
ENSRNOT00000082989
|
Smurf1
|
SMAD specific E3 ubiquitin protein ligase 1 |
| chr4_+_127164453 | 0.22 |
ENSRNOT00000017889
|
Kbtbd8
|
kelch repeat and BTB domain containing 8 |
| chr3_+_77072410 | 0.09 |
ENSRNOT00000078540
|
Olr649
|
olfactory receptor 649 |
| chr7_+_98432442 | 0.08 |
ENSRNOT00000038973
|
Fer1l6
|
fer-1-like family member 6 |
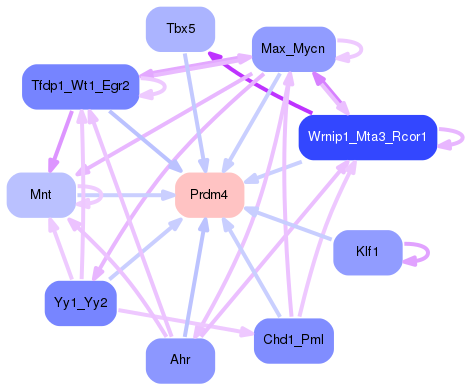
Network of associatons between targets according to the STRING database.

First level regulatory network of Prdm4
Gene Ontology Analysis
Gene overrepresentation in biological process category:
| Log-likelihood per target | Total log-likelihood | Term | Description |
|---|---|---|---|
| 5.7 | 22.8 | GO:1904204 | regulation of skeletal muscle hypertrophy(GO:1904204) |
| 1.2 | 3.7 | GO:1903070 | negative regulation of ER-associated ubiquitin-dependent protein catabolic process(GO:1903070) |
| 0.4 | 1.1 | GO:0035425 | autocrine signaling(GO:0035425) |
| 0.2 | 0.7 | GO:1902534 | single-organism membrane invagination(GO:1902534) |
| 0.1 | 11.8 | GO:0010923 | negative regulation of phosphatase activity(GO:0010923) |
| 0.1 | 11.6 | GO:0030317 | sperm motility(GO:0030317) |
| 0.1 | 5.4 | GO:0045454 | cell redox homeostasis(GO:0045454) |
| 0.0 | 3.1 | GO:0035023 | regulation of Rho protein signal transduction(GO:0035023) |
| 0.0 | 0.2 | GO:0014029 | neural crest formation(GO:0014029) |
Gene overrepresentation in cellular component category:
| Log-likelihood per target | Total log-likelihood | Term | Description |
|---|---|---|---|
| 3.8 | 22.8 | GO:0042567 | insulin-like growth factor ternary complex(GO:0042567) |
| 0.7 | 3.7 | GO:0097425 | smooth endoplasmic reticulum membrane(GO:0030868) smooth endoplasmic reticulum part(GO:0097425) |
| 0.7 | 11.6 | GO:0035686 | sperm fibrous sheath(GO:0035686) |
Gene overrepresentation in molecular function category:
| Log-likelihood per target | Total log-likelihood | Term | Description |
|---|---|---|---|
| 2.9 | 11.6 | GO:0043891 | glyceraldehyde-3-phosphate dehydrogenase (NAD+) (phosphorylating) activity(GO:0004365) glyceraldehyde-3-phosphate dehydrogenase (NAD(P)+) (phosphorylating) activity(GO:0043891) |
| 2.5 | 22.8 | GO:0031995 | insulin-like growth factor II binding(GO:0031995) |
| 1.8 | 5.4 | GO:0050220 | prostaglandin-E synthase activity(GO:0050220) |
| 0.4 | 11.8 | GO:0008157 | protein phosphatase 1 binding(GO:0008157) |
| 0.1 | 1.1 | GO:0042813 | Wnt-activated receptor activity(GO:0042813) |
| 0.0 | 0.7 | GO:0070411 | I-SMAD binding(GO:0070411) |
| 0.0 | 3.7 | GO:0043621 | protein self-association(GO:0043621) |
| 0.0 | 3.1 | GO:0005089 | Rho guanyl-nucleotide exchange factor activity(GO:0005089) |
Gene overrepresentation in curated gene sets: canonical pathways category:
| Log-likelihood per target | Total log-likelihood | Term | Description |
|---|---|---|---|
| 0.1 | 5.4 | PID IFNG PATHWAY | IFN-gamma pathway |
| 0.1 | 22.8 | NABA ECM GLYCOPROTEINS | Genes encoding structural ECM glycoproteins |
| 0.0 | 1.1 | PID WNT SIGNALING PATHWAY | Wnt signaling network |
Gene overrepresentation in curated gene sets: REACTOME pathways category:
| Log-likelihood per target | Total log-likelihood | Term | Description |
|---|---|---|---|
| 1.1 | 22.8 | REACTOME REGULATION OF INSULIN LIKE GROWTH FACTOR IGF ACTIVITY BY INSULIN LIKE GROWTH FACTOR BINDING PROTEINS IGFBPS | Genes involved in Regulation of Insulin-like Growth Factor (IGF) Activity by Insulin-like Growth Factor Binding Proteins (IGFBPs) |
| 0.3 | 11.6 | REACTOME GLYCOLYSIS | Genes involved in Glycolysis |
| 0.0 | 0.7 | REACTOME TGF BETA RECEPTOR SIGNALING IN EMT EPITHELIAL TO MESENCHYMAL TRANSITION | Genes involved in TGF-beta receptor signaling in EMT (epithelial to mesenchymal transition) |
| 0.0 | 1.1 | REACTOME CLASS B 2 SECRETIN FAMILY RECEPTORS | Genes involved in Class B/2 (Secretin family receptors) |