Project
GSE53960: rat RNA-Seq transcriptomic Bodymap
Navigation
Downloads
Results for Pbx1_Pbx3
Z-value: 1.52
Motif logo
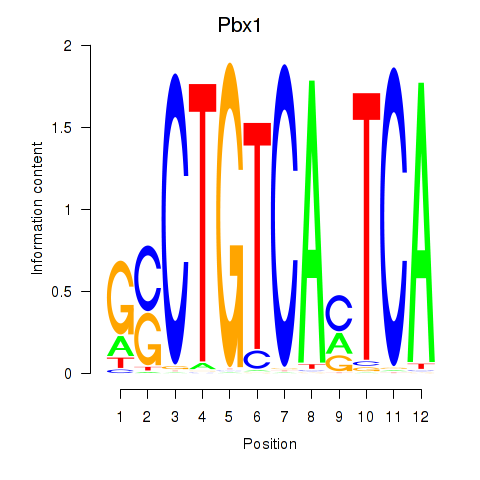
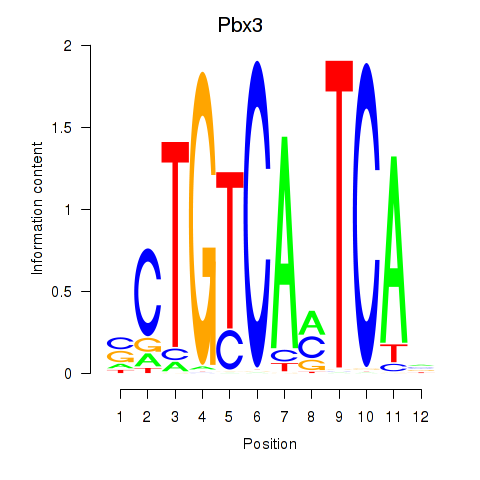
Transcription factors associated with Pbx1_Pbx3
| Gene Symbol | Gene ID | Gene Info |
|---|---|---|
|
Pbx1
|
ENSRNOG00000004693 | PBX homeobox 1 |
|
Pbx3
|
ENSRNOG00000022162 | PBX homeobox 3 |
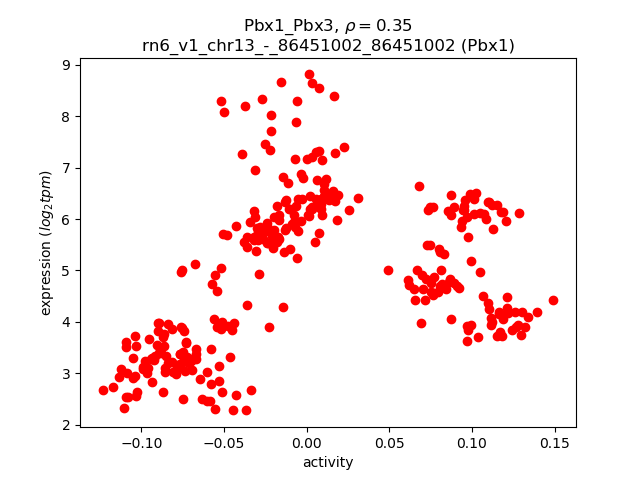
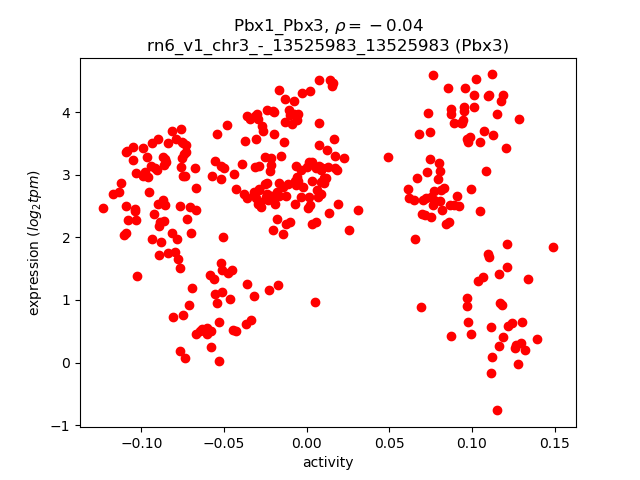
Activity-expression correlation:
| Gene | Promoter | Pearson corr. coef. | P-value | Plot |
|---|---|---|---|---|
| Pbx1 | rn6_v1_chr13_-_86451002_86451002 | 0.35 | 1.5e-10 | Click! |
| Pbx3 | rn6_v1_chr3_-_13525983_13525983 | -0.04 | 5.2e-01 | Click! |
Activity profile of Pbx1_Pbx3 motif
Sorted Z-values of Pbx1_Pbx3 motif
| Promoter | Log-likelihood | Transcript | Gene | Gene Info |
|---|---|---|---|---|
| chr19_+_55669626 | 121.20 |
ENSRNOT00000033352
|
Cdh15
|
cadherin 15 |
| chrX_+_107496072 | 72.86 |
ENSRNOT00000003283
|
Plp1
|
proteolipid protein 1 |
| chr17_+_10384511 | 55.99 |
ENSRNOT00000024357
|
Sncb
|
synuclein, beta |
| chrX_-_64726210 | 52.67 |
ENSRNOT00000076012
ENSRNOT00000086265 |
Asb12
|
ankyrin repeat and SOCS box-containing 12 |
| chr17_+_41798783 | 48.74 |
ENSRNOT00000023519
|
Nrsn1
|
neurensin 1 |
| chr6_+_58468155 | 42.37 |
ENSRNOT00000091263
|
Etv1
|
ets variant 1 |
| chr5_+_58393603 | 40.04 |
ENSRNOT00000080082
|
Dnajb5
|
DnaJ heat shock protein family (Hsp40) member B5 |
| chr5_+_43603043 | 39.58 |
ENSRNOT00000009899
|
Epha7
|
Eph receptor A7 |
| chrX_-_64715823 | 39.22 |
ENSRNOT00000076297
|
Asb12
|
ankyrin repeat and SOCS box-containing 12 |
| chr18_+_56193978 | 37.58 |
ENSRNOT00000041533
ENSRNOT00000080177 |
Camk2a
|
calcium/calmodulin-dependent protein kinase II alpha |
| chr14_-_86047162 | 37.30 |
ENSRNOT00000018227
|
Pgam2
|
phosphoglycerate mutase 2 |
| chr5_-_59025631 | 35.97 |
ENSRNOT00000049000
ENSRNOT00000022801 |
Tpm2
|
tropomyosin 2, beta |
| chr5_+_58393233 | 35.70 |
ENSRNOT00000000142
|
Dnajb5
|
DnaJ heat shock protein family (Hsp40) member B5 |
| chrX_-_64702441 | 35.68 |
ENSRNOT00000051132
|
Amer1
|
APC membrane recruitment protein 1 |
| chr19_+_17290178 | 34.53 |
ENSRNOT00000060865
|
Aktip
|
AKT interacting protein |
| chrX_+_106774980 | 34.06 |
ENSRNOT00000046091
|
Tceal7
|
transcription elongation factor A like 7 |
| chr2_+_198655437 | 33.89 |
ENSRNOT00000028781
|
Hfe2
|
hemochromatosis type 2 (juvenile) |
| chr1_+_99762253 | 33.84 |
ENSRNOT00000065876
|
Klk6
|
kallikrein related-peptidase 6 |
| chr1_+_48077033 | 33.10 |
ENSRNOT00000020100
|
Mas1
|
MAS1 proto-oncogene, G protein-coupled receptor |
| chr8_-_72842228 | 32.89 |
ENSRNOT00000090288
|
Tpm1
|
tropomyosin 1, alpha |
| chr6_+_132242328 | 32.57 |
ENSRNOT00000081088
|
Cyp46a1
|
cytochrome P450, family 46, subfamily a, polypeptide 1 |
| chr18_-_6782996 | 32.00 |
ENSRNOT00000090320
|
Aqp4
|
aquaporin 4 |
| chr18_-_6782757 | 31.73 |
ENSRNOT00000068150
|
Aqp4
|
aquaporin 4 |
| chrX_-_105622156 | 31.42 |
ENSRNOT00000029511
|
Armcx2
|
armadillo repeat containing, X-linked 2 |
| chr2_-_22744407 | 30.33 |
ENSRNOT00000073710
|
Cmya5
|
cardiomyopathy associated 5 |
| chr3_-_172566010 | 29.08 |
ENSRNOT00000071913
|
Atp5e
|
ATP synthase, H+ transporting, mitochondrial F1 complex, epsilon subunit |
| chr16_+_20432899 | 28.35 |
ENSRNOT00000026271
|
Mpv17l2
|
MPV17 mitochondrial inner membrane protein like 2 |
| chr5_-_136748980 | 28.32 |
ENSRNOT00000026844
|
Ipo13
|
importin 13 |
| chr2_-_142885604 | 27.89 |
ENSRNOT00000031487
|
Frem2
|
Fras1 related extracellular matrix protein 2 |
| chr7_-_25743537 | 24.87 |
ENSRNOT00000083450
|
LOC100910996
|
uncharacterized LOC100910996 |
| chr15_-_28313841 | 23.70 |
ENSRNOT00000085897
|
Ndrg2
|
NDRG family member 2 |
| chr7_-_124982566 | 23.51 |
ENSRNOT00000075099
|
Sult4a1
|
sulfotransferase family 4A, member 1 |
| chr5_+_26493212 | 23.50 |
ENSRNOT00000061328
|
Triqk
|
triple QxxK/R motif containing |
| chr2_+_174542667 | 22.78 |
ENSRNOT00000076793
|
Fstl5
|
follistatin-like 5 |
| chr8_-_72841496 | 22.78 |
ENSRNOT00000057641
ENSRNOT00000040808 ENSRNOT00000085894 ENSRNOT00000024575 ENSRNOT00000048044 ENSRNOT00000024493 |
Tpm1
|
tropomyosin 1, alpha |
| chr4_+_110700403 | 22.55 |
ENSRNOT00000092379
|
Lrrtm4
|
leucine rich repeat transmembrane neuronal 4 |
| chr3_+_113257688 | 22.31 |
ENSRNOT00000019320
|
Map1a
|
microtubule-associated protein 1A |
| chr3_+_171832500 | 22.17 |
ENSRNOT00000007554
|
Vapb
|
VAMP associated protein B and C |
| chr14_+_78640620 | 21.88 |
ENSRNOT00000034730
|
Wfs1
|
wolframin ER transmembrane glycoprotein |
| chr2_+_95320283 | 21.85 |
ENSRNOT00000015537
|
Hey1
|
hes-related family bHLH transcription factor with YRPW motif 1 |
| chr8_-_95387363 | 21.67 |
ENSRNOT00000014657
|
Tbx18
|
T-box18 |
| chr3_-_105512939 | 21.65 |
ENSRNOT00000011773
|
Actc1
|
actin, alpha, cardiac muscle 1 |
| chr4_+_78168117 | 21.60 |
ENSRNOT00000010853
|
Atp6v0e2
|
ATPase, H+ transporting V0 subunit e2 |
| chr5_+_33580944 | 21.46 |
ENSRNOT00000092054
ENSRNOT00000036050 |
Rmdn1
|
regulator of microtubule dynamics 1 |
| chr5_+_76812931 | 21.46 |
ENSRNOT00000059458
|
Hsdl2
|
hydroxysteroid dehydrogenase like 2 |
| chr1_+_240908483 | 21.39 |
ENSRNOT00000019367
|
Klf9
|
Kruppel-like factor 9 |
| chr15_-_28314459 | 21.18 |
ENSRNOT00000042055
ENSRNOT00000040540 |
Ndrg2
|
NDRG family member 2 |
| chr10_-_77918191 | 20.57 |
ENSRNOT00000055664
|
Hlf
|
HLF, PAR bZIP transcription factor |
| chr2_-_140618405 | 20.18 |
ENSRNOT00000017736
|
Setd7
|
SET domain containing (lysine methyltransferase) 7 |
| chr8_-_33017854 | 20.06 |
ENSRNOT00000011386
|
Barx2
|
BARX homeobox 2 |
| chr13_-_88061108 | 19.99 |
ENSRNOT00000003774
|
Rgs4
|
regulator of G-protein signaling 4 |
| chr6_-_39363367 | 19.25 |
ENSRNOT00000088687
ENSRNOT00000065531 |
Fam84a
|
family with sequence similarity 84, member A |
| chr9_-_40008680 | 18.99 |
ENSRNOT00000016578
|
Khdrbs2
|
KH RNA binding domain containing, signal transduction associated 2 |
| chr6_-_99783047 | 18.87 |
ENSRNOT00000009028
|
Sptb
|
spectrin, beta, erythrocytic |
| chr10_-_47724499 | 18.69 |
ENSRNOT00000085011
|
Rnf112
|
ring finger protein 112 |
| chr1_+_101427195 | 18.62 |
ENSRNOT00000028271
|
Gys1
|
glycogen synthase 1 |
| chr14_+_63095720 | 17.68 |
ENSRNOT00000006071
|
Ppargc1a
|
PPARG coactivator 1 alpha |
| chr19_+_25095089 | 17.52 |
ENSRNOT00000041717
|
Prkaca
|
protein kinase cAMP-activated catalytic subunit alpha |
| chr6_-_124735741 | 17.46 |
ENSRNOT00000064716
ENSRNOT00000091693 |
Rps6ka5
|
ribosomal protein S6 kinase A5 |
| chr2_+_98252925 | 17.04 |
ENSRNOT00000011579
|
Pex2
|
peroxisomal biogenesis factor 2 |
| chr2_-_220535751 | 16.96 |
ENSRNOT00000089082
|
Palmd
|
palmdelphin |
| chr10_+_86303727 | 16.75 |
ENSRNOT00000037752
|
Ppp1r1b
|
protein phosphatase 1, regulatory (inhibitor) subunit 1B |
| chr10_-_46720907 | 16.50 |
ENSRNOT00000083093
ENSRNOT00000067866 |
Tom1l2
|
target of myb1 like 2 membrane trafficking protein |
| chr4_-_150520774 | 15.98 |
ENSRNOT00000009095
|
Zfp9
|
zinc finger protein 9 |
| chr1_+_60717386 | 15.34 |
ENSRNOT00000015019
|
Ppp2r1a
|
protein phosphatase 2 scaffold subunit A alpha |
| chr4_-_108008484 | 15.28 |
ENSRNOT00000007971
|
Ctnna2
|
catenin alpha 2 |
| chr3_+_11593655 | 15.18 |
ENSRNOT00000074122
|
Pip5kl1
|
phosphatidylinositol-4-phosphate 5-kinase-like 1 |
| chr9_+_118586179 | 15.16 |
ENSRNOT00000022351
|
Dlgap1
|
DLG associated protein 1 |
| chrX_+_9436707 | 15.16 |
ENSRNOT00000004187
|
Cask
|
calcium/calmodulin dependent serine protein kinase |
| chr20_+_4369178 | 15.00 |
ENSRNOT00000088079
|
Agpat1
|
1-acylglycerol-3-phosphate O-acyltransferase 1 |
| chr10_+_63327555 | 14.44 |
ENSRNOT00000084535
|
Cpd
|
carboxypeptidase D |
| chr10_-_71383602 | 14.38 |
ENSRNOT00000083300
|
Dusp14
|
dual specificity phosphatase 14 |
| chr17_+_5281727 | 14.31 |
ENSRNOT00000024781
|
Isca1
|
iron-sulfur cluster assembly 1 |
| chr10_-_103816287 | 13.97 |
ENSRNOT00000004477
|
Grin2c
|
glutamate ionotropic receptor NMDA type subunit 2C |
| chr15_+_2526368 | 13.76 |
ENSRNOT00000048713
ENSRNOT00000074803 |
Dusp13
Dusp13
|
dual specificity phosphatase 13 dual specificity phosphatase 13 |
| chr1_-_216971183 | 13.76 |
ENSRNOT00000077911
|
Mrgpre
|
MAS related GPR family member E |
| chr4_+_9966891 | 13.67 |
ENSRNOT00000086609
|
Napepld
|
N-acyl phosphatidylethanolamine phospholipase D |
| chr8_-_8524643 | 13.54 |
ENSRNOT00000009418
|
Cntn5
|
contactin 5 |
| chr1_+_97632473 | 13.14 |
ENSRNOT00000023671
|
Vstm2b
|
V-set and transmembrane domain containing 2B |
| chr15_+_2733114 | 13.13 |
ENSRNOT00000074545
|
LOC108348179
|
dual specificity protein phosphatase 13 |
| chr8_+_1502877 | 13.01 |
ENSRNOT00000034482
|
Msantd4
|
Myb/SANT DNA binding domain containing 4 with coiled-coils |
| chr13_+_77602249 | 12.46 |
ENSRNOT00000003407
ENSRNOT00000076589 |
Tnr
|
tenascin R |
| chr11_+_64790801 | 12.44 |
ENSRNOT00000004023
|
Timmdc1
|
translocase of inner mitochondrial membrane domain containing 1 |
| chr14_-_51462721 | 12.01 |
ENSRNOT00000015044
|
Hmgb3
|
high mobility group box 3 |
| chr8_-_94563760 | 11.83 |
ENSRNOT00000032792
|
Snap91
|
synaptosomal-associated protein 91 |
| chrX_+_110016995 | 11.78 |
ENSRNOT00000093542
|
Nrk
|
Nik related kinase |
| chrX_+_105911925 | 11.74 |
ENSRNOT00000052422
|
LOC108348137
|
armadillo repeat-containing X-linked protein 1 |
| chr5_+_5866897 | 11.70 |
ENSRNOT00000011940
|
Slco5a1
|
solute carrier organic anion transporter family, member 5A1 |
| chr3_+_9822580 | 11.70 |
ENSRNOT00000010786
ENSRNOT00000093718 |
Usp20
|
ubiquitin specific peptidase 20 |
| chr2_+_198726118 | 11.62 |
ENSRNOT00000056237
|
Lix1l
|
limb and CNS expressed 1 like |
| chr4_+_61912210 | 11.60 |
ENSRNOT00000013569
|
Bpgm
|
bisphosphoglycerate mutase |
| chr8_+_22189600 | 11.58 |
ENSRNOT00000061100
|
Pde4a
|
phosphodiesterase 4A |
| chr9_+_73334618 | 11.43 |
ENSRNOT00000092717
|
Map2
|
microtubule-associated protein 2 |
| chr18_-_69944632 | 11.39 |
ENSRNOT00000047271
|
Mapk4
|
mitogen-activated protein kinase 4 |
| chr12_+_18516946 | 11.36 |
ENSRNOT00000029485
|
Dhrsx
|
dehydrogenase/reductase X-linked |
| chr6_+_55812747 | 11.29 |
ENSRNOT00000008106
|
Sostdc1
|
sclerostin domain containing 1 |
| chr2_+_46980976 | 11.26 |
ENSRNOT00000083668
ENSRNOT00000082990 |
Mocs2
|
molybdenum cofactor synthesis 2 |
| chr1_-_56683731 | 11.25 |
ENSRNOT00000014552
|
Thbs2
|
thrombospondin 2 |
| chrX_+_82143789 | 10.90 |
ENSRNOT00000003724
|
Pou3f4
|
POU class 3 homeobox 4 |
| chr8_+_131845696 | 10.76 |
ENSRNOT00000005440
|
Tcaim
|
T cell activation inhibitor, mitochondrial |
| chr9_-_82699551 | 10.61 |
ENSRNOT00000020673
|
Obsl1
|
obscurin-like 1 |
| chr10_+_91830654 | 10.61 |
ENSRNOT00000005176
|
Wnt3
|
wingless-type MMTV integration site family, member 3 |
| chrX_-_106558366 | 10.35 |
ENSRNOT00000042126
|
Bex2
|
brain expressed X-linked 2 |
| chr8_+_117820538 | 10.33 |
ENSRNOT00000028075
|
Ccdc51
|
coiled-coil domain containing 51 |
| chr18_-_14016713 | 10.27 |
ENSRNOT00000041125
|
Nol4
|
nucleolar protein 4 |
| chr3_-_121488540 | 10.27 |
ENSRNOT00000023845
|
Zc3h8
|
zinc finger CCCH type containing 8 |
| chr20_+_4369394 | 9.98 |
ENSRNOT00000088734
ENSRNOT00000091491 |
Agpat1
|
1-acylglycerol-3-phosphate O-acyltransferase 1 |
| chr1_+_101688297 | 9.97 |
ENSRNOT00000091606
|
Dbp
|
D-box binding PAR bZIP transcription factor |
| chr2_+_188528979 | 9.96 |
ENSRNOT00000087934
|
Thbs3
|
thrombospondin 3 |
| chr17_+_36690249 | 9.91 |
ENSRNOT00000089476
ENSRNOT00000082140 |
LOC688583
|
similar to High mobility group protein 4 (HMG-4) (High mobility group protein 2a) (HMG-2a) |
| chr1_+_101687855 | 9.63 |
ENSRNOT00000028546
ENSRNOT00000091597 |
Dbp
|
D-box binding PAR bZIP transcription factor |
| chr12_+_52670898 | 9.56 |
ENSRNOT00000056632
|
LOC100912590
|
putative GTP-binding protein 6-like |
| chr4_-_113954272 | 9.52 |
ENSRNOT00000039966
ENSRNOT00000082996 |
LOC103692173
|
WW domain-binding protein 1 |
| chr14_-_18704059 | 9.46 |
ENSRNOT00000081455
|
Mthfd2l
|
methylenetetrahydrofolate dehydrogenase (NADP+ dependent) 2-like |
| chr1_+_78933372 | 9.39 |
ENSRNOT00000029810
|
Ccdc8
|
coiled-coil domain containing 8 |
| chr5_+_74727494 | 9.12 |
ENSRNOT00000076683
|
Rn50_5_0791.1
|
|
| chr8_-_94564525 | 9.08 |
ENSRNOT00000084437
|
Snap91
|
synaptosomal-associated protein 91 |
| chr4_-_114819848 | 9.02 |
ENSRNOT00000084381
|
Wbp1
|
WW domain binding protein 1 |
| chr5_+_159484370 | 8.94 |
ENSRNOT00000010593
|
Sdhb
|
succinate dehydrogenase complex iron sulfur subunit B |
| chr8_+_59561721 | 8.86 |
ENSRNOT00000093107
ENSRNOT00000065771 ENSRNOT00000088304 |
Chrna5
|
cholinergic receptor nicotinic alpha 5 subunit |
| chr5_-_169017295 | 8.63 |
ENSRNOT00000067481
|
Camta1
|
calmodulin binding transcription activator 1 |
| chr5_-_168123395 | 8.54 |
ENSRNOT00000024932
|
Per3
|
period circadian clock 3 |
| chr5_+_165724027 | 8.42 |
ENSRNOT00000018000
|
Casz1
|
castor zinc finger 1 |
| chr12_-_22680630 | 8.41 |
ENSRNOT00000041808
|
Vgf
|
VGF nerve growth factor inducible |
| chr19_+_27404712 | 8.41 |
ENSRNOT00000023657
|
Mylk3
|
myosin light chain kinase 3 |
| chr3_+_160207913 | 8.26 |
ENSRNOT00000014346
|
Wisp2
|
WNT1 inducible signaling pathway protein 2 |
| chr3_-_120076788 | 7.98 |
ENSRNOT00000047158
|
Kcnip3
|
potassium voltage-gated channel interacting protein 3 |
| chr18_+_79326738 | 7.81 |
ENSRNOT00000089879
|
Mbp
|
myelin basic protein |
| chr16_+_23447366 | 7.65 |
ENSRNOT00000068629
|
Psd3
|
pleckstrin and Sec7 domain containing 3 |
| chr2_+_196334626 | 7.59 |
ENSRNOT00000050914
ENSRNOT00000028645 ENSRNOT00000090729 |
Sema6c
|
semaphorin 6C |
| chr10_+_40812858 | 7.38 |
ENSRNOT00000018149
|
G3bp1
|
G3BP stress granule assembly factor 1 |
| chr12_+_52637000 | 7.32 |
ENSRNOT00000063905
|
Gtpbp6
|
GTP binding protein 6 (putative) |
| chr7_+_80750725 | 7.29 |
ENSRNOT00000079962
|
Oxr1
|
oxidation resistance 1 |
| chr1_-_53802658 | 7.23 |
ENSRNOT00000032667
|
Afdn
|
afadin, adherens junction formation factor |
| chr3_+_148234193 | 7.16 |
ENSRNOT00000010418
|
Cox4i2
|
cytochrome c oxidase subunit 4i2 |
| chr7_+_123578878 | 7.09 |
ENSRNOT00000011316
|
Smdt1
|
single-pass membrane protein with aspartate-rich tail 1 |
| chr3_+_155297566 | 6.92 |
ENSRNOT00000021435
ENSRNOT00000084866 |
Dhx35
|
DEAH-box helicase 35 |
| chr4_+_168976859 | 6.91 |
ENSRNOT00000068663
|
Fam234b
|
family with sequence similarity 234, member B |
| chr3_-_60795951 | 6.89 |
ENSRNOT00000002174
|
Atf2
|
activating transcription factor 2 |
| chr10_-_109604899 | 6.66 |
ENSRNOT00000080188
|
Nploc4
|
NPL4 homolog, ubiquitin recognition factor |
| chr1_+_261229347 | 6.60 |
ENSRNOT00000018485
|
Ubtd1
|
ubiquitin domain containing 1 |
| chr5_+_137497363 | 6.58 |
ENSRNOT00000072522
|
LOC100910606
|
olfactory receptor 2A5-like |
| chr9_+_65933018 | 6.33 |
ENSRNOT00000047929
|
LOC685505
|
similar to coiled-coil-helix-coiled-coil-helix domain containing 4 |
| chr20_+_18493538 | 6.31 |
ENSRNOT00000000749
|
Cisd1
|
CDGSH iron sulfur domain 1 |
| chr3_-_148407778 | 6.28 |
ENSRNOT00000011262
|
Foxs1
|
forkhead box S1 |
| chr12_-_17522534 | 6.21 |
ENSRNOT00000047287
|
Sun1
|
Sad1 and UNC84 domain containing 1 |
| chr15_-_108898703 | 6.14 |
ENSRNOT00000067577
|
Zic5
|
Zic family member 5 |
| chr15_-_34400449 | 6.00 |
ENSRNOT00000048455
|
Rabggta
|
Rab geranylgeranyltransferase, alpha subunit |
| chr6_-_8956276 | 5.93 |
ENSRNOT00000079027
|
Six2
|
SIX homeobox 2 |
| chr8_+_94686938 | 5.89 |
ENSRNOT00000013285
|
Ripply2
|
ripply transcriptional repressor 2 |
| chr20_-_11626876 | 5.73 |
ENSRNOT00000001635
|
LOC100361664
|
keratin associated protein 12-1-like |
| chr3_-_9822182 | 5.69 |
ENSRNOT00000076637
ENSRNOT00000010115 |
RGD1305178
|
similar to Hypothetical protein MGC11690 |
| chr4_+_57034675 | 5.69 |
ENSRNOT00000080223
|
Smo
|
smoothened, frizzled class receptor |
| chr2_-_19808937 | 5.55 |
ENSRNOT00000044237
|
Atp6ap1l
|
ATPase H+ transporting accessory protein 1 like |
| chr20_-_29199224 | 5.34 |
ENSRNOT00000071477
|
Mcu
|
mitochondrial calcium uniporter |
| chr2_+_203301838 | 5.31 |
ENSRNOT00000043146
|
Trim45
|
tripartite motif-containing 45 |
| chr10_-_20658100 | 5.18 |
ENSRNOT00000010252
|
Rars
|
arginyl-tRNA synthetase |
| chr3_-_1116677 | 5.16 |
ENSRNOT00000050371
|
Tbpl2
|
TATA box binding protein-like 2 |
| chr19_+_37229120 | 5.13 |
ENSRNOT00000076335
|
Hsf4
|
heat shock transcription factor 4 |
| chr12_-_2603705 | 5.13 |
ENSRNOT00000001367
|
Evi5l
|
ecotropic viral integration site 5-like |
| chrX_+_156429585 | 5.09 |
ENSRNOT00000083203
ENSRNOT00000077322 |
Dnase1l1
|
deoxyribonuclease 1-like 1 |
| chr4_-_114820127 | 5.09 |
ENSRNOT00000079376
|
Wbp1
|
WW domain binding protein 1 |
| chr4_+_88694583 | 5.05 |
ENSRNOT00000009202
|
Ppm1k
|
protein phosphatase, Mg2+/Mn2+ dependent, 1K |
| chr1_-_4011353 | 5.02 |
ENSRNOT00000049699
|
Stxbp5
|
syntaxin binding protein 5 |
| chr7_-_9630611 | 5.01 |
ENSRNOT00000011176
|
Olr1072
|
olfactory receptor 1072 |
| chr19_-_43215077 | 4.99 |
ENSRNOT00000082151
|
Aars
|
alanyl-tRNA synthetase |
| chr8_-_117820413 | 4.88 |
ENSRNOT00000075819
|
Tma7
|
translation machinery associated 7 homolog |
| chr1_+_215701544 | 4.83 |
ENSRNOT00000027585
|
Mrpl23
|
mitochondrial ribosomal protein L23 |
| chr2_+_78407414 | 4.73 |
ENSRNOT00000084541
ENSRNOT00000087109 |
Zfp622
|
zinc finger protein 622 |
| chr7_+_11545024 | 4.71 |
ENSRNOT00000073221
|
Slc39a3
|
solute carrier family 39 member 3 |
| chrX_-_71127237 | 4.60 |
ENSRNOT00000076403
ENSRNOT00000076635 ENSRNOT00000068098 |
Snx12
|
sorting nexin 12 |
| chr2_+_187512164 | 4.58 |
ENSRNOT00000051394
|
Mef2d
|
myocyte enhancer factor 2D |
| chr3_-_113231790 | 4.57 |
ENSRNOT00000019025
|
Tp53bp1
|
tumor protein p53 binding protein 1 |
| chr6_+_8219385 | 4.49 |
ENSRNOT00000040509
|
Ppm1b
|
protein phosphatase, Mg2+/Mn2+ dependent, 1B |
| chr2_+_78262839 | 4.44 |
ENSRNOT00000066879
|
LOC103689968
|
protein FAM134B |
| chr6_-_109103999 | 4.43 |
ENSRNOT00000009086
ENSRNOT00000080009 |
Acyp1
|
acylphosphatase 1 |
| chr7_+_11737293 | 4.41 |
ENSRNOT00000046059
|
Lingo3
|
leucine rich repeat and Ig domain containing 3 |
| chr3_+_38367556 | 4.34 |
ENSRNOT00000049144
|
RGD1559995
|
similar to developmental pluripotency associated 5 |
| chr10_-_104179523 | 4.28 |
ENSRNOT00000005292
|
Slc25a19
|
solute carrier family 25 member 19 |
| chr12_-_18487178 | 4.24 |
ENSRNOT00000030757
|
Zfp157
|
zinc finger protein 157 |
| chr1_+_222844144 | 4.23 |
ENSRNOT00000032879
|
Pla2g16
|
phospholipase A2, group XVI |
| chr1_+_248402980 | 4.12 |
ENSRNOT00000043517
|
Chchd4
|
coiled-coil-helix-coiled-coil-helix domain containing 4 |
| chr5_+_81431600 | 4.05 |
ENSRNOT00000013675
|
Trim32
|
tripartite motif-containing 32 |
| chr1_-_4011511 | 4.04 |
ENSRNOT00000040559
|
Stxbp5
|
syntaxin binding protein 5 |
| chrX_-_139464798 | 4.02 |
ENSRNOT00000003282
|
Gpc4
|
glypican 4 |
| chr15_+_34234193 | 4.02 |
ENSRNOT00000077584
|
Dcaf11
|
DDB1 and CUL4 associated factor 11 |
| chr10_-_104358253 | 4.01 |
ENSRNOT00000005942
|
Caskin2
|
cask-interacting protein 2 |
| chr16_+_52024690 | 3.98 |
ENSRNOT00000048104
|
AABR07025825.1
|
|
| chr9_+_61720583 | 3.91 |
ENSRNOT00000020536
|
Mob4
|
MOB family member 4, phocein |
| chr17_-_84830185 | 3.91 |
ENSRNOT00000040697
|
Skida1
|
SKI/DACH domain containing 1 |
| chr4_-_56453563 | 3.87 |
ENSRNOT00000060362
|
Prrt4
|
proline-rich transmembrane protein 4 |
| chr19_+_14392423 | 3.82 |
ENSRNOT00000018880
|
Tom1
|
target of myb1 membrane trafficking protein |
| chr10_+_88245532 | 3.76 |
ENSRNOT00000019863
|
Gast
|
gastrin |
| chr12_-_13251112 | 3.63 |
ENSRNOT00000044378
|
Grid2ip
|
Grid2 interacting protein |
| chr19_-_43215281 | 3.63 |
ENSRNOT00000025052
|
Aars
|
alanyl-tRNA synthetase |
| chr9_+_72052966 | 3.58 |
ENSRNOT00000021099
|
Pth2r
|
parathyroid hormone 2 receptor |
| chr1_-_215373234 | 3.55 |
ENSRNOT00000034299
|
AABR07006055.1
|
|
| chr1_-_229804614 | 3.52 |
ENSRNOT00000049665
|
Olr343
|
olfactory receptor 343 |
| chr7_+_8210182 | 3.46 |
ENSRNOT00000075032
|
Olr1049
|
olfactory receptor 1049 |
| chrX_+_106823491 | 3.37 |
ENSRNOT00000045997
|
Bex3
|
brain expressed X-linked 3 |
Network of associatons between targets according to the STRING database.

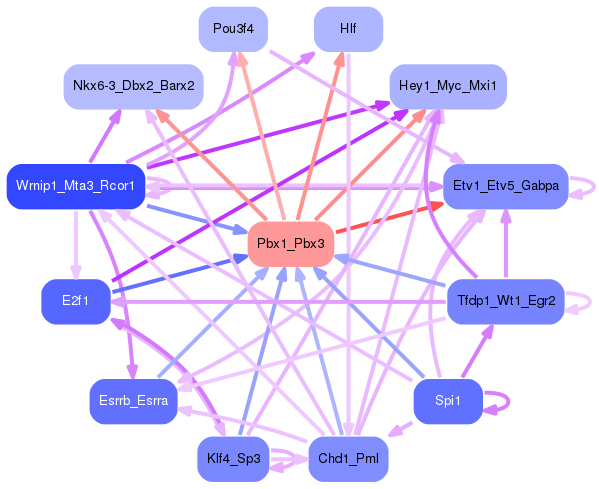
First level regulatory network of Pbx1_Pbx3
Gene Ontology Analysis
Gene overrepresentation in biological process category:
| Log-likelihood per target | Total log-likelihood | Term | Description |
|---|---|---|---|
| 18.6 | 55.7 | GO:0003065 | positive regulation of heart rate by epinephrine(GO:0003065) |
| 15.9 | 63.7 | GO:0060354 | negative regulation of cell adhesion molecule production(GO:0060354) |
| 11.2 | 44.9 | GO:0090361 | platelet-derived growth factor production(GO:0090360) regulation of platelet-derived growth factor production(GO:0090361) |
| 7.5 | 37.6 | GO:0098970 | receptor diffusion trapping(GO:0098953) postsynaptic neurotransmitter receptor diffusion trapping(GO:0098970) NMDA selective glutamate receptor signaling pathway(GO:0098989) neurotransmitter receptor diffusion trapping(GO:0099628) |
| 7.3 | 21.9 | GO:0036500 | ATF6-mediated unfolded protein response(GO:0036500) |
| 7.3 | 21.8 | GO:2000820 | negative regulation of transcription from RNA polymerase II promoter involved in smooth muscle cell differentiation(GO:2000820) |
| 7.2 | 21.7 | GO:2000729 | positive regulation of mesenchymal cell proliferation involved in ureter development(GO:2000729) |
| 7.1 | 21.4 | GO:0071387 | cellular response to cortisol stimulus(GO:0071387) |
| 7.0 | 48.9 | GO:0043456 | regulation of pentose-phosphate shunt(GO:0043456) |
| 6.6 | 39.6 | GO:0051964 | negative regulation of synapse assembly(GO:0051964) |
| 5.9 | 17.7 | GO:0080033 | cellular response to nitrite(GO:0071250) response to nitrite(GO:0080033) response to resveratrol(GO:1904638) regulation of progesterone biosynthetic process(GO:2000182) |
| 5.7 | 28.3 | GO:0061668 | mitochondrial ribosome assembly(GO:0061668) |
| 5.4 | 21.7 | GO:0030240 | skeletal muscle thin filament assembly(GO:0030240) |
| 5.2 | 41.6 | GO:2001012 | mesenchymal cell differentiation involved in kidney development(GO:0072161) mesenchymal cell differentiation involved in renal system development(GO:2001012) |
| 5.1 | 30.3 | GO:0070885 | negative regulation of calcineurin-NFAT signaling cascade(GO:0070885) |
| 4.9 | 72.9 | GO:0042759 | long-chain fatty acid biosynthetic process(GO:0042759) |
| 4.7 | 14.0 | GO:0033058 | directional locomotion(GO:0033058) |
| 4.4 | 22.2 | GO:0046725 | negative regulation by virus of viral protein levels in host cell(GO:0046725) |
| 4.4 | 17.5 | GO:0043988 | histone H3-S10 phosphorylation(GO:0043987) histone H3-S28 phosphorylation(GO:0043988) histone H2A phosphorylation(GO:1990164) |
| 3.8 | 11.3 | GO:0060648 | mammary gland bud morphogenesis(GO:0060648) |
| 3.7 | 43.9 | GO:0048935 | peripheral nervous system neuron differentiation(GO:0048934) peripheral nervous system neuron development(GO:0048935) |
| 3.5 | 10.6 | GO:0048696 | regulation of collateral sprouting in absence of injury(GO:0048696) Spemann organizer formation(GO:0060061) |
| 3.4 | 13.7 | GO:1903999 | negative regulation of eating behavior(GO:1903999) |
| 3.2 | 9.5 | GO:0000105 | histidine biosynthetic process(GO:0000105) |
| 3.1 | 15.3 | GO:0051754 | meiotic sister chromatid cohesion, centromeric(GO:0051754) |
| 3.0 | 20.9 | GO:0016185 | synaptic vesicle budding from presynaptic endocytic zone membrane(GO:0016185) |
| 2.9 | 17.5 | GO:1901621 | negative regulation of smoothened signaling pathway involved in dorsal/ventral neural tube patterning(GO:1901621) |
| 2.8 | 8.4 | GO:0042706 | eye photoreceptor cell fate commitment(GO:0042706) photoreceptor cell fate commitment(GO:0046552) |
| 2.6 | 7.8 | GO:1904685 | regulation of chemokine (C-C motif) ligand 2 secretion(GO:1904207) positive regulation of chemokine (C-C motif) ligand 2 secretion(GO:1904209) positive regulation of metalloendopeptidase activity(GO:1904685) |
| 2.5 | 22.5 | GO:0097113 | AMPA glutamate receptor clustering(GO:0097113) |
| 2.4 | 16.8 | GO:0007621 | negative regulation of female receptivity(GO:0007621) |
| 2.4 | 33.1 | GO:0060732 | positive regulation of inositol phosphate biosynthetic process(GO:0060732) |
| 2.3 | 32.6 | GO:0016127 | cholesterol catabolic process(GO:0006707) sterol catabolic process(GO:0016127) |
| 2.3 | 6.9 | GO:0032915 | positive regulation of transforming growth factor beta2 production(GO:0032915) |
| 2.2 | 8.6 | GO:0006419 | alanyl-tRNA aminoacylation(GO:0006419) |
| 2.1 | 33.9 | GO:0016540 | protein autoprocessing(GO:0016540) |
| 2.1 | 8.4 | GO:0060298 | positive regulation of sarcomere organization(GO:0060298) |
| 2.1 | 12.5 | GO:0048686 | regulation of sprouting of injured axon(GO:0048686) regulation of axon extension involved in regeneration(GO:0048690) |
| 2.0 | 14.3 | GO:0097428 | protein maturation by iron-sulfur cluster transfer(GO:0097428) |
| 2.0 | 20.2 | GO:0018026 | peptidyl-lysine monomethylation(GO:0018026) |
| 2.0 | 11.8 | GO:0060721 | regulation of spongiotrophoblast cell proliferation(GO:0060721) regulation of cell proliferation involved in embryonic placenta development(GO:0060723) |
| 1.9 | 25.0 | GO:0006654 | phosphatidic acid biosynthetic process(GO:0006654) |
| 1.9 | 5.7 | GO:0007228 | positive regulation of hh target transcription factor activity(GO:0007228) |
| 1.9 | 15.2 | GO:0070842 | aggresome assembly(GO:0070842) |
| 1.8 | 14.4 | GO:0071352 | cellular response to interleukin-2(GO:0071352) |
| 1.7 | 10.3 | GO:2000399 | negative regulation of T cell differentiation in thymus(GO:0033085) snRNA transcription from RNA polymerase III promoter(GO:0042796) positive regulation of thymocyte apoptotic process(GO:0070245) negative regulation of thymocyte aggregation(GO:2000399) |
| 1.7 | 15.3 | GO:0021942 | radial glia guided migration of Purkinje cell(GO:0021942) |
| 1.4 | 7.2 | GO:0034334 | adherens junction maintenance(GO:0034334) |
| 1.4 | 4.3 | GO:0071934 | thiamine transmembrane transport(GO:0071934) |
| 1.4 | 4.1 | GO:0045041 | protein import into mitochondrial intermembrane space(GO:0045041) |
| 1.3 | 5.2 | GO:0006420 | arginyl-tRNA aminoacylation(GO:0006420) |
| 1.3 | 11.3 | GO:0006777 | Mo-molybdopterin cofactor biosynthetic process(GO:0006777) Mo-molybdopterin cofactor metabolic process(GO:0019720) |
| 1.2 | 12.4 | GO:0036444 | calcium ion transmembrane import into mitochondrion(GO:0036444) |
| 1.2 | 28.3 | GO:0042921 | glucocorticoid receptor signaling pathway(GO:0042921) |
| 1.2 | 33.8 | GO:0045745 | positive regulation of G-protein coupled receptor protein signaling pathway(GO:0045745) |
| 1.2 | 10.6 | GO:0071688 | striated muscle myosin thick filament assembly(GO:0071688) |
| 1.2 | 15.2 | GO:0010839 | negative regulation of keratinocyte proliferation(GO:0010839) |
| 1.2 | 4.6 | GO:1903336 | negative regulation of vacuolar transport(GO:1903336) |
| 1.1 | 8.9 | GO:0035095 | behavioral response to nicotine(GO:0035095) |
| 1.1 | 27.2 | GO:0015991 | ATP hydrolysis coupled proton transport(GO:0015991) |
| 1.0 | 54.0 | GO:0042417 | dopamine metabolic process(GO:0042417) |
| 1.0 | 29.5 | GO:0015985 | energy coupled proton transport, down electrochemical gradient(GO:0015985) ATP synthesis coupled proton transport(GO:0015986) |
| 1.0 | 10.9 | GO:2001054 | negative regulation of mesenchymal cell apoptotic process(GO:2001054) |
| 1.0 | 6.7 | GO:0039536 | negative regulation of RIG-I signaling pathway(GO:0039536) |
| 0.9 | 34.5 | GO:0045022 | early endosome to late endosome transport(GO:0045022) |
| 0.9 | 17.0 | GO:0006699 | bile acid biosynthetic process(GO:0006699) |
| 0.9 | 4.4 | GO:0061709 | reticulophagy(GO:0061709) |
| 0.9 | 33.7 | GO:0007026 | negative regulation of microtubule depolymerization(GO:0007026) |
| 0.8 | 3.3 | GO:0044778 | meiotic DNA integrity checkpoint(GO:0044778) |
| 0.8 | 3.1 | GO:1902534 | single-organism membrane invagination(GO:1902534) |
| 0.7 | 2.2 | GO:0003363 | lamellipodium assembly involved in ameboidal cell migration(GO:0003363) extension of a leading process involved in cell motility in cerebral cortex radial glia guided migration(GO:0021816) |
| 0.7 | 7.3 | GO:1902083 | negative regulation of peptidyl-cysteine S-nitrosylation(GO:1902083) |
| 0.7 | 16.6 | GO:0001502 | cartilage condensation(GO:0001502) |
| 0.7 | 2.0 | GO:0035408 | histone H3-T6 phosphorylation(GO:0035408) regulation of dense core granule biogenesis(GO:2000705) |
| 0.7 | 4.0 | GO:1903265 | positive regulation of tumor necrosis factor-mediated signaling pathway(GO:1903265) |
| 0.7 | 6.0 | GO:0018344 | protein geranylgeranylation(GO:0018344) |
| 0.7 | 7.2 | GO:0006123 | mitochondrial electron transport, cytochrome c to oxygen(GO:0006123) |
| 0.6 | 57.8 | GO:0006986 | response to unfolded protein(GO:0006986) |
| 0.6 | 2.4 | GO:0000965 | mitochondrial RNA 3'-end processing(GO:0000965) |
| 0.6 | 91.4 | GO:0007156 | homophilic cell adhesion via plasma membrane adhesion molecules(GO:0007156) |
| 0.6 | 10.0 | GO:0043931 | ossification involved in bone maturation(GO:0043931) |
| 0.6 | 1.7 | GO:0046340 | diacylglycerol catabolic process(GO:0046340) |
| 0.6 | 6.2 | GO:0070197 | meiotic telomere tethering at nuclear periphery(GO:0044821) meiotic attachment of telomere to nuclear envelope(GO:0070197) chromosome attachment to the nuclear envelope(GO:0097240) |
| 0.6 | 8.9 | GO:0006105 | succinate metabolic process(GO:0006105) |
| 0.6 | 11.7 | GO:0070536 | protein K63-linked deubiquitination(GO:0070536) |
| 0.6 | 14.4 | GO:0000188 | inactivation of MAPK activity(GO:0000188) |
| 0.5 | 4.2 | GO:1904177 | regulation of adipose tissue development(GO:1904177) |
| 0.5 | 8.4 | GO:0043084 | penile erection(GO:0043084) |
| 0.5 | 11.6 | GO:0006198 | cAMP catabolic process(GO:0006198) |
| 0.5 | 18.7 | GO:0071158 | positive regulation of cell cycle arrest(GO:0071158) |
| 0.5 | 20.0 | GO:0045744 | negative regulation of G-protein coupled receptor protein signaling pathway(GO:0045744) |
| 0.5 | 2.3 | GO:0045578 | negative regulation of B cell differentiation(GO:0045578) |
| 0.5 | 5.9 | GO:0032525 | somite rostral/caudal axis specification(GO:0032525) |
| 0.4 | 18.9 | GO:0051693 | actin filament capping(GO:0051693) |
| 0.4 | 5.1 | GO:1902018 | negative regulation of cilium assembly(GO:1902018) |
| 0.4 | 4.6 | GO:0007512 | adult heart development(GO:0007512) |
| 0.4 | 27.5 | GO:0032088 | negative regulation of NF-kappaB transcription factor activity(GO:0032088) |
| 0.4 | 18.6 | GO:0009250 | glycogen biosynthetic process(GO:0005978) glucan biosynthetic process(GO:0009250) |
| 0.4 | 6.3 | GO:0043457 | regulation of cellular respiration(GO:0043457) |
| 0.3 | 4.6 | GO:0071481 | cellular response to X-ray(GO:0071481) |
| 0.3 | 20.6 | GO:0043462 | regulation of ATPase activity(GO:0043462) |
| 0.3 | 1.3 | GO:0008628 | hormone-mediated apoptotic signaling pathway(GO:0008628) cellular response to magnetism(GO:0071259) |
| 0.3 | 1.8 | GO:0006499 | N-terminal protein myristoylation(GO:0006499) |
| 0.3 | 8.0 | GO:0048266 | behavioral response to pain(GO:0048266) |
| 0.3 | 9.0 | GO:0097352 | autophagosome maturation(GO:0097352) |
| 0.3 | 8.5 | GO:0045187 | regulation of circadian sleep/wake cycle, sleep(GO:0045187) |
| 0.3 | 20.6 | GO:0035914 | skeletal muscle cell differentiation(GO:0035914) |
| 0.2 | 1.0 | GO:1903593 | regulation of histamine secretion by mast cell(GO:1903593) |
| 0.2 | 0.2 | GO:0046671 | negative regulation of retinal cell programmed cell death(GO:0046671) |
| 0.2 | 14.9 | GO:0050885 | neuromuscular process controlling balance(GO:0050885) |
| 0.2 | 1.2 | GO:0008295 | spermidine biosynthetic process(GO:0008295) |
| 0.2 | 5.1 | GO:0033169 | histone H3-K9 demethylation(GO:0033169) |
| 0.2 | 1.3 | GO:0006983 | ER overload response(GO:0006983) |
| 0.2 | 1.7 | GO:0051001 | negative regulation of nitric-oxide synthase activity(GO:0051001) |
| 0.2 | 2.5 | GO:0035357 | peroxisome proliferator activated receptor signaling pathway(GO:0035357) |
| 0.2 | 1.4 | GO:0071712 | ER-associated misfolded protein catabolic process(GO:0071712) |
| 0.2 | 4.2 | GO:0010453 | regulation of cell fate commitment(GO:0010453) |
| 0.2 | 4.7 | GO:0071577 | zinc II ion transmembrane transport(GO:0071577) |
| 0.2 | 1.7 | GO:0045793 | positive regulation of cell size(GO:0045793) |
| 0.2 | 8.1 | GO:0032392 | DNA geometric change(GO:0032392) |
| 0.1 | 0.4 | GO:0006574 | valine catabolic process(GO:0006574) |
| 0.1 | 0.4 | GO:0006567 | threonine catabolic process(GO:0006567) |
| 0.1 | 9.9 | GO:0010923 | negative regulation of phosphatase activity(GO:0010923) |
| 0.1 | 0.5 | GO:1990564 | protein ufmylation(GO:0071569) protein polyufmylation(GO:1990564) protein K69-linked ufmylation(GO:1990592) |
| 0.1 | 7.5 | GO:0051965 | positive regulation of synapse assembly(GO:0051965) |
| 0.1 | 2.9 | GO:0016180 | snRNA processing(GO:0016180) |
| 0.1 | 2.4 | GO:0032967 | positive regulation of collagen biosynthetic process(GO:0032967) |
| 0.1 | 1.5 | GO:0007250 | activation of NF-kappaB-inducing kinase activity(GO:0007250) |
| 0.1 | 10.1 | GO:0050818 | regulation of coagulation(GO:0050818) |
| 0.1 | 4.1 | GO:0045839 | negative regulation of mitotic nuclear division(GO:0045839) |
| 0.1 | 2.5 | GO:0008333 | endosome to lysosome transport(GO:0008333) |
| 0.1 | 8.4 | GO:0048024 | regulation of mRNA splicing, via spliceosome(GO:0048024) |
| 0.1 | 4.8 | GO:0032543 | mitochondrial translation(GO:0032543) |
| 0.1 | 3.6 | GO:0060292 | long term synaptic depression(GO:0060292) |
| 0.1 | 7.4 | GO:0090090 | negative regulation of canonical Wnt signaling pathway(GO:0090090) |
| 0.1 | 66.2 | GO:0016567 | protein ubiquitination(GO:0016567) |
| 0.1 | 3.8 | GO:0032094 | response to food(GO:0032094) |
| 0.1 | 7.9 | GO:0048839 | inner ear development(GO:0048839) |
| 0.1 | 2.6 | GO:0006284 | base-excision repair(GO:0006284) |
| 0.1 | 3.4 | GO:0008625 | extrinsic apoptotic signaling pathway via death domain receptors(GO:0008625) |
| 0.1 | 1.7 | GO:0097502 | mannosylation(GO:0097502) |
| 0.0 | 13.6 | GO:0006790 | sulfur compound metabolic process(GO:0006790) |
| 0.0 | 7.6 | GO:0007411 | axon guidance(GO:0007411) |
| 0.0 | 4.1 | GO:0007605 | sensory perception of sound(GO:0007605) |
| 0.0 | 1.5 | GO:0032467 | positive regulation of cytokinesis(GO:0032467) |
| 0.0 | 3.7 | GO:0006352 | DNA-templated transcription, initiation(GO:0006352) |
| 0.0 | 2.2 | GO:0001942 | hair follicle development(GO:0001942) skin epidermis development(GO:0098773) |
| 0.0 | 2.4 | GO:0030838 | positive regulation of actin filament polymerization(GO:0030838) |
| 0.0 | 0.5 | GO:0007194 | negative regulation of adenylate cyclase activity(GO:0007194) |
| 0.0 | 0.4 | GO:0001522 | pseudouridine synthesis(GO:0001522) |
| 0.0 | 19.3 | GO:0050911 | detection of chemical stimulus involved in sensory perception of smell(GO:0050911) |
Gene overrepresentation in cellular component category:
| Log-likelihood per target | Total log-likelihood | Term | Description |
|---|---|---|---|
| 13.1 | 91.6 | GO:0005862 | muscle thin filament tropomyosin(GO:0005862) |
| 9.4 | 37.6 | GO:0099522 | region of cytosol(GO:0099522) postsynaptic cytosol(GO:0099524) |
| 7.1 | 28.3 | GO:0031074 | nucleocytoplasmic shuttling complex(GO:0031074) |
| 7.0 | 20.9 | GO:0098833 | presynaptic endosome(GO:0098830) presynaptic endocytic zone(GO:0098833) presynaptic endocytic zone membrane(GO:0098835) |
| 6.9 | 34.5 | GO:0070695 | FHF complex(GO:0070695) |
| 5.5 | 33.3 | GO:1990712 | HFE-transferrin receptor complex(GO:1990712) |
| 3.7 | 29.5 | GO:0045261 | mitochondrial proton-transporting ATP synthase complex, catalytic core F(1)(GO:0000275) proton-transporting ATP synthase complex, catalytic core F(1)(GO:0045261) |
| 3.3 | 20.0 | GO:1990393 | 3M complex(GO:1990393) |
| 3.1 | 18.9 | GO:0014731 | spectrin-associated cytoskeleton(GO:0014731) |
| 3.1 | 21.7 | GO:0090571 | RNA polymerase II transcription repressor complex(GO:0090571) |
| 3.0 | 8.9 | GO:0045257 | mitochondrial respiratory chain complex II, succinate dehydrogenase complex (ubiquinone)(GO:0005749) succinate dehydrogenase complex (ubiquinone)(GO:0045257) fumarate reductase complex(GO:0045283) |
| 2.6 | 10.3 | GO:0035363 | histone locus body(GO:0035363) |
| 2.5 | 12.5 | GO:0072534 | perineuronal net(GO:0072534) |
| 2.4 | 17.0 | GO:0016593 | Cdc73/Paf1 complex(GO:0016593) |
| 2.1 | 12.4 | GO:1990246 | uniplex complex(GO:1990246) |
| 2.0 | 176.1 | GO:0031594 | neuromuscular junction(GO:0031594) |
| 1.8 | 63.7 | GO:0046930 | pore complex(GO:0046930) |
| 1.7 | 21.6 | GO:0033179 | proton-transporting V-type ATPase, V0 domain(GO:0033179) |
| 1.5 | 6.0 | GO:0005968 | Rab-protein geranylgeranyltransferase complex(GO:0005968) |
| 1.3 | 7.8 | GO:0033269 | internode region of axon(GO:0033269) |
| 1.3 | 11.4 | GO:0097442 | CA3 pyramidal cell dendrite(GO:0097442) |
| 1.2 | 15.2 | GO:0005652 | nuclear lamina(GO:0005652) |
| 1.1 | 22.2 | GO:0070971 | endoplasmic reticulum exit site(GO:0070971) |
| 1.0 | 17.7 | GO:0097440 | apical dendrite(GO:0097440) |
| 0.9 | 17.9 | GO:0005892 | acetylcholine-gated channel complex(GO:0005892) |
| 0.8 | 14.0 | GO:0017146 | NMDA selective glutamate receptor complex(GO:0017146) |
| 0.8 | 30.3 | GO:0043034 | costamere(GO:0043034) |
| 0.7 | 6.7 | GO:0034098 | VCP-NPL4-UFD1 AAA ATPase complex(GO:0034098) |
| 0.7 | 22.5 | GO:0032281 | AMPA glutamate receptor complex(GO:0032281) |
| 0.7 | 155.3 | GO:0030426 | growth cone(GO:0030426) |
| 0.7 | 2.0 | GO:0036488 | CHOP-C/EBP complex(GO:0036488) CHOP-ATF3 complex(GO:1990622) |
| 0.6 | 15.3 | GO:0000159 | protein phosphatase type 2A complex(GO:0000159) |
| 0.6 | 32.6 | GO:0000315 | organellar large ribosomal subunit(GO:0000315) mitochondrial large ribosomal subunit(GO:0005762) |
| 0.5 | 3.3 | GO:0030896 | checkpoint clamp complex(GO:0030896) |
| 0.5 | 11.3 | GO:0031091 | platelet alpha granule(GO:0031091) |
| 0.5 | 5.6 | GO:0033180 | proton-transporting V-type ATPase, V1 domain(GO:0033180) |
| 0.4 | 7.2 | GO:0005751 | mitochondrial respiratory chain complex IV(GO:0005751) |
| 0.4 | 2.6 | GO:0097512 | cardiac myofibril(GO:0097512) |
| 0.4 | 4.0 | GO:0005859 | muscle myosin complex(GO:0005859) myosin filament(GO:0032982) |
| 0.3 | 71.8 | GO:0043209 | myelin sheath(GO:0043209) |
| 0.3 | 24.3 | GO:0001750 | photoreceptor outer segment(GO:0001750) |
| 0.2 | 2.2 | GO:0044327 | dendritic spine head(GO:0044327) |
| 0.2 | 6.2 | GO:0002080 | acrosomal membrane(GO:0002080) |
| 0.2 | 2.4 | GO:0035102 | PRC1 complex(GO:0035102) |
| 0.2 | 19.6 | GO:0000502 | proteasome complex(GO:0000502) |
| 0.2 | 21.7 | GO:0005884 | actin filament(GO:0005884) |
| 0.2 | 11.6 | GO:0005840 | ribosome(GO:0005840) |
| 0.2 | 23.9 | GO:0042579 | peroxisome(GO:0005777) microbody(GO:0042579) |
| 0.2 | 1.4 | GO:0036513 | Derlin-1 retrotranslocation complex(GO:0036513) |
| 0.2 | 6.9 | GO:0035861 | site of double-strand break(GO:0035861) |
| 0.2 | 18.1 | GO:0005604 | basement membrane(GO:0005604) |
| 0.2 | 17.6 | GO:0031225 | anchored component of membrane(GO:0031225) |
| 0.2 | 2.9 | GO:0032039 | integrator complex(GO:0032039) |
| 0.2 | 23.0 | GO:0000922 | spindle pole(GO:0000922) |
| 0.2 | 24.5 | GO:0043197 | dendritic spine(GO:0043197) |
| 0.2 | 4.7 | GO:0030687 | preribosome, large subunit precursor(GO:0030687) |
| 0.2 | 4.3 | GO:0031304 | intrinsic component of mitochondrial inner membrane(GO:0031304) integral component of mitochondrial inner membrane(GO:0031305) |
| 0.2 | 2.4 | GO:0043198 | dendritic shaft(GO:0043198) |
| 0.1 | 22.7 | GO:0014069 | postsynaptic density(GO:0014069) |
| 0.1 | 3.2 | GO:0034451 | centriolar satellite(GO:0034451) |
| 0.1 | 5.3 | GO:0045171 | intercellular bridge(GO:0045171) |
| 0.1 | 6.4 | GO:0030667 | secretory granule membrane(GO:0030667) |
| 0.1 | 8.1 | GO:0045095 | keratin filament(GO:0045095) |
| 0.1 | 4.6 | GO:1990391 | DNA repair complex(GO:1990391) |
| 0.1 | 3.1 | GO:0000407 | pre-autophagosomal structure(GO:0000407) |
| 0.1 | 5.1 | GO:0010494 | cytoplasmic stress granule(GO:0010494) |
| 0.1 | 7.5 | GO:0008076 | voltage-gated potassium channel complex(GO:0008076) |
| 0.1 | 6.9 | GO:0071013 | catalytic step 2 spliceosome(GO:0071013) |
| 0.1 | 2.4 | GO:0009295 | nucleoid(GO:0009295) mitochondrial nucleoid(GO:0042645) |
| 0.1 | 4.1 | GO:0005758 | mitochondrial intermembrane space(GO:0005758) |
| 0.0 | 0.2 | GO:0033503 | HULC complex(GO:0033503) |
| 0.0 | 0.2 | GO:0097361 | MMXD complex(GO:0071817) CIA complex(GO:0097361) |
| 0.0 | 8.4 | GO:0005759 | mitochondrial matrix(GO:0005759) |
| 0.0 | 1.0 | GO:0035869 | ciliary transition zone(GO:0035869) |
| 0.0 | 4.4 | GO:0030176 | integral component of endoplasmic reticulum membrane(GO:0030176) |
| 0.0 | 4.6 | GO:0019898 | extrinsic component of membrane(GO:0019898) |
| 0.0 | 1.0 | GO:0030665 | clathrin-coated vesicle membrane(GO:0030665) |
| 0.0 | 13.0 | GO:0043025 | neuronal cell body(GO:0043025) |
| 0.0 | 42.4 | GO:0005829 | cytosol(GO:0005829) |
Gene overrepresentation in molecular function category:
| Log-likelihood per target | Total log-likelihood | Term | Description |
|---|---|---|---|
| 12.2 | 48.9 | GO:0004082 | bisphosphoglycerate mutase activity(GO:0004082) phosphoglycerate mutase activity(GO:0004619) 2,3-bisphosphoglycerate-dependent phosphoglycerate mutase activity(GO:0046538) |
| 7.3 | 21.8 | GO:0035939 | microsatellite binding(GO:0035939) |
| 6.7 | 80.7 | GO:0019911 | structural constituent of myelin sheath(GO:0019911) |
| 5.6 | 33.9 | GO:0098821 | BMP receptor activity(GO:0098821) |
| 5.6 | 56.0 | GO:1903136 | cuprous ion binding(GO:1903136) |
| 5.6 | 16.8 | GO:0031752 | D5 dopamine receptor binding(GO:0031752) |
| 5.5 | 22.2 | GO:0033149 | FFAT motif binding(GO:0033149) |
| 4.7 | 33.1 | GO:0001595 | angiotensin receptor activity(GO:0001595) |
| 4.6 | 63.7 | GO:0015250 | water channel activity(GO:0015250) |
| 4.4 | 17.5 | GO:0004691 | cAMP-dependent protein kinase activity(GO:0004691) |
| 4.0 | 39.6 | GO:0005004 | GPI-linked ephrin receptor activity(GO:0005004) |
| 3.3 | 39.6 | GO:0009931 | calcium-dependent protein serine/threonine kinase activity(GO:0009931) |
| 3.0 | 8.9 | GO:0008177 | succinate dehydrogenase (ubiquinone) activity(GO:0008177) 3 iron, 4 sulfur cluster binding(GO:0051538) |
| 2.7 | 18.6 | GO:0035251 | UDP-glucosyltransferase activity(GO:0035251) |
| 2.4 | 9.5 | GO:0004487 | methylenetetrahydrofolate dehydrogenase (NAD+) activity(GO:0004487) |
| 2.3 | 20.9 | GO:0032050 | clathrin heavy chain binding(GO:0032050) |
| 2.3 | 13.7 | GO:0070290 | N-acylphosphatidylethanolamine-specific phospholipase D activity(GO:0070290) |
| 2.2 | 102.2 | GO:0008307 | structural constituent of muscle(GO:0008307) |
| 2.2 | 8.6 | GO:0004813 | alanine-tRNA ligase activity(GO:0004813) |
| 2.1 | 8.4 | GO:0004687 | myosin light chain kinase activity(GO:0004687) |
| 2.1 | 25.0 | GO:0003841 | 1-acylglycerol-3-phosphate O-acyltransferase activity(GO:0003841) |
| 2.0 | 6.0 | GO:0004663 | Rab geranylgeranyltransferase activity(GO:0004663) |
| 1.9 | 15.2 | GO:0016308 | 1-phosphatidylinositol-4-phosphate 5-kinase activity(GO:0016308) |
| 1.8 | 5.3 | GO:0015292 | uniporter activity(GO:0015292) |
| 1.8 | 35.0 | GO:0046933 | proton-transporting ATP synthase activity, rotational mechanism(GO:0046933) |
| 1.4 | 4.3 | GO:0015234 | thiamine transmembrane transporter activity(GO:0015234) |
| 1.4 | 14.0 | GO:0004972 | NMDA glutamate receptor activity(GO:0004972) |
| 1.3 | 6.7 | GO:0036435 | K48-linked polyubiquitin binding(GO:0036435) |
| 1.3 | 5.2 | GO:0004814 | arginine-tRNA ligase activity(GO:0004814) arginine binding(GO:0034618) |
| 1.3 | 10.3 | GO:0001162 | RNA polymerase II intronic transcription regulatory region sequence-specific DNA binding(GO:0001162) |
| 1.2 | 21.9 | GO:0000400 | four-way junction DNA binding(GO:0000400) |
| 1.2 | 21.6 | GO:0046961 | ATPase activity, coupled to transmembrane movement of ions, rotational mechanism(GO:0044769) proton-transporting ATPase activity, rotational mechanism(GO:0046961) |
| 1.2 | 19.0 | GO:0008143 | poly(A) binding(GO:0008143) |
| 1.2 | 15.2 | GO:0098919 | structural constituent of postsynaptic specialization(GO:0098879) structural constituent of postsynaptic density(GO:0098919) |
| 1.1 | 26.6 | GO:0043395 | heparan sulfate proteoglycan binding(GO:0043395) |
| 1.1 | 10.9 | GO:0003680 | AT DNA binding(GO:0003680) |
| 1.1 | 15.2 | GO:0042043 | neurexin family protein binding(GO:0042043) |
| 1.0 | 11.3 | GO:0016783 | sulfurtransferase activity(GO:0016783) |
| 0.9 | 5.7 | GO:0005113 | patched binding(GO:0005113) |
| 0.9 | 7.2 | GO:0030274 | LIM domain binding(GO:0030274) |
| 0.9 | 14.4 | GO:0017017 | MAP kinase tyrosine/serine/threonine phosphatase activity(GO:0017017) |
| 0.9 | 8.9 | GO:0008140 | cAMP response element binding protein binding(GO:0008140) |
| 0.9 | 28.3 | GO:0008139 | nuclear localization sequence binding(GO:0008139) |
| 0.9 | 2.6 | GO:0000703 | oxidized pyrimidine nucleobase lesion DNA N-glycosylase activity(GO:0000703) |
| 0.9 | 20.6 | GO:0051537 | 2 iron, 2 sulfur cluster binding(GO:0051537) |
| 0.9 | 32.6 | GO:0016709 | oxidoreductase activity, acting on paired donors, with incorporation or reduction of molecular oxygen, NAD(P)H as one donor, and incorporation of one atom of oxygen(GO:0016709) |
| 0.8 | 4.2 | GO:0008970 | phosphatidylcholine 1-acylhydrolase activity(GO:0008970) |
| 0.8 | 3.4 | GO:0005163 | nerve growth factor receptor binding(GO:0005163) |
| 0.8 | 18.9 | GO:0042975 | peroxisome proliferator activated receptor binding(GO:0042975) |
| 0.8 | 74.7 | GO:0051082 | unfolded protein binding(GO:0051082) |
| 0.7 | 21.7 | GO:0001106 | RNA polymerase II transcription corepressor activity(GO:0001106) |
| 0.7 | 26.9 | GO:0008138 | protein tyrosine/serine/threonine phosphatase activity(GO:0008138) |
| 0.7 | 11.4 | GO:0002162 | dystroglycan binding(GO:0002162) |
| 0.7 | 18.9 | GO:0030506 | ankyrin binding(GO:0030506) |
| 0.6 | 11.6 | GO:0004115 | 3',5'-cyclic-AMP phosphodiesterase activity(GO:0004115) |
| 0.6 | 7.6 | GO:0030215 | semaphorin receptor binding(GO:0030215) |
| 0.6 | 1.7 | GO:0000026 | alpha-1,2-mannosyltransferase activity(GO:0000026) |
| 0.6 | 14.4 | GO:0004181 | metallocarboxypeptidase activity(GO:0004181) |
| 0.5 | 8.9 | GO:0022848 | acetylcholine-gated cation channel activity(GO:0022848) |
| 0.5 | 35.7 | GO:0005546 | phosphatidylinositol-4,5-bisphosphate binding(GO:0005546) |
| 0.5 | 20.0 | GO:0001965 | G-protein alpha-subunit binding(GO:0001965) |
| 0.5 | 15.8 | GO:0050699 | WW domain binding(GO:0050699) |
| 0.4 | 1.7 | GO:0042134 | rRNA primary transcript binding(GO:0042134) |
| 0.4 | 31.0 | GO:0033613 | activating transcription factor binding(GO:0033613) |
| 0.4 | 11.4 | GO:0004707 | MAP kinase activity(GO:0004707) |
| 0.4 | 28.1 | GO:0017022 | myosin binding(GO:0017022) |
| 0.4 | 20.3 | GO:0030276 | clathrin binding(GO:0030276) |
| 0.4 | 10.0 | GO:0017075 | syntaxin-1 binding(GO:0017075) |
| 0.4 | 22.2 | GO:0004722 | protein serine/threonine phosphatase activity(GO:0004722) |
| 0.4 | 23.5 | GO:0008146 | sulfotransferase activity(GO:0008146) |
| 0.3 | 8.3 | GO:0005520 | insulin-like growth factor binding(GO:0005520) |
| 0.3 | 20.2 | GO:0002039 | p53 binding(GO:0002039) |
| 0.3 | 22.3 | GO:0005518 | collagen binding(GO:0005518) |
| 0.3 | 8.4 | GO:0005184 | neuropeptide hormone activity(GO:0005184) |
| 0.2 | 7.2 | GO:0016676 | cytochrome-c oxidase activity(GO:0004129) heme-copper terminal oxidase activity(GO:0015002) oxidoreductase activity, acting on a heme group of donors, oxygen as acceptor(GO:0016676) |
| 0.2 | 4.1 | GO:0015035 | protein disulfide oxidoreductase activity(GO:0015035) |
| 0.2 | 33.8 | GO:0004252 | serine-type endopeptidase activity(GO:0004252) |
| 0.2 | 5.2 | GO:0099589 | G-protein coupled serotonin receptor activity(GO:0004993) serotonin receptor activity(GO:0099589) |
| 0.2 | 1.4 | GO:1904264 | ubiquitin protein ligase activity involved in ERAD pathway(GO:1904264) |
| 0.2 | 1.2 | GO:0019808 | polyamine binding(GO:0019808) |
| 0.2 | 105.1 | GO:0005509 | calcium ion binding(GO:0005509) |
| 0.1 | 59.6 | GO:0001228 | transcriptional activator activity, RNA polymerase II transcription regulatory region sequence-specific binding(GO:0001228) |
| 0.1 | 28.8 | GO:0061630 | ubiquitin protein ligase activity(GO:0061630) |
| 0.1 | 2.1 | GO:0048018 | receptor agonist activity(GO:0048018) |
| 0.1 | 6.9 | GO:0004004 | RNA helicase activity(GO:0003724) ATP-dependent RNA helicase activity(GO:0004004) |
| 0.1 | 2.4 | GO:0016891 | endoribonuclease activity, producing 5'-phosphomonoesters(GO:0016891) |
| 0.1 | 0.4 | GO:0004616 | phosphogluconate dehydrogenase (decarboxylating) activity(GO:0004616) |
| 0.1 | 0.5 | GO:0004966 | galanin receptor activity(GO:0004966) |
| 0.1 | 4.1 | GO:0043022 | ribosome binding(GO:0043022) |
| 0.0 | 2.2 | GO:0048365 | Rac GTPase binding(GO:0048365) |
| 0.0 | 2.5 | GO:0019003 | GDP binding(GO:0019003) |
| 0.0 | 1.1 | GO:0004190 | aspartic-type endopeptidase activity(GO:0004190) |
| 0.0 | 0.2 | GO:0008321 | Ral guanyl-nucleotide exchange factor activity(GO:0008321) |
| 0.0 | 2.4 | GO:0003727 | single-stranded RNA binding(GO:0003727) |
| 0.0 | 12.4 | GO:0005549 | odorant binding(GO:0005549) |
| 0.0 | 3.8 | GO:0005179 | hormone activity(GO:0005179) |
| 0.0 | 0.4 | GO:0009982 | pseudouridine synthase activity(GO:0009982) |
| 0.0 | 1.7 | GO:0004197 | cysteine-type endopeptidase activity(GO:0004197) |
| 0.0 | 1.4 | GO:0004984 | olfactory receptor activity(GO:0004984) |
| 0.0 | 1.2 | GO:0004869 | cysteine-type endopeptidase inhibitor activity(GO:0004869) |
| 0.0 | 17.3 | GO:0004930 | G-protein coupled receptor activity(GO:0004930) |
Gene overrepresentation in curated gene sets: canonical pathways category:
| Log-likelihood per target | Total log-likelihood | Term | Description |
|---|---|---|---|
| 1.6 | 42.4 | PID P38 MK2 PATHWAY | p38 signaling mediated by MAPKAP kinases |
| 1.4 | 37.6 | ST WNT CA2 CYCLIC GMP PATHWAY | Wnt/Ca2+/cyclic GMP signaling. |
| 1.4 | 25.8 | PID LPA4 PATHWAY | LPA4-mediated signaling events |
| 1.1 | 31.6 | PID EPHA FWDPATHWAY | EPHA forward signaling |
| 0.9 | 3.8 | ST PAC1 RECEPTOR PATHWAY | PAC1 Receptor Pathway |
| 0.9 | 18.6 | PID INSULIN GLUCOSE PATHWAY | Insulin-mediated glucose transport |
| 0.8 | 15.2 | PID SYNDECAN 3 PATHWAY | Syndecan-3-mediated signaling events |
| 0.8 | 45.2 | PID BMP PATHWAY | BMP receptor signaling |
| 0.8 | 33.8 | PID ALPHA SYNUCLEIN PATHWAY | Alpha-synuclein signaling |
| 0.7 | 22.3 | PID HDAC CLASSIII PATHWAY | Signaling events mediated by HDAC Class III |
| 0.6 | 17.4 | PID IL8 CXCR2 PATHWAY | IL8- and CXCR2-mediated signaling events |
| 0.4 | 6.0 | PID PRL SIGNALING EVENTS PATHWAY | Signaling events mediated by PRL |
| 0.3 | 19.5 | PID P53 REGULATION PATHWAY | p53 pathway |
| 0.3 | 20.0 | PID MYC REPRESS PATHWAY | Validated targets of C-MYC transcriptional repression |
| 0.3 | 12.5 | PID LKB1 PATHWAY | LKB1 signaling events |
| 0.2 | 4.2 | SA B CELL RECEPTOR COMPLEXES | Antigen binding to B cell receptors activates protein tyrosine kinases, such as the Src family, which ultimate activate MAP kinases. |
| 0.2 | 28.0 | NABA ECM AFFILIATED | Genes encoding proteins affiliated structurally or functionally to extracellular matrix proteins |
| 0.2 | 2.4 | PID NEPHRIN NEPH1 PATHWAY | Nephrin/Neph1 signaling in the kidney podocyte |
| 0.1 | 5.7 | PID HEDGEHOG GLI PATHWAY | Hedgehog signaling events mediated by Gli proteins |
| 0.1 | 19.3 | NABA ECM GLYCOPROTEINS | Genes encoding structural ECM glycoproteins |
| 0.1 | 2.1 | PID WNT SIGNALING PATHWAY | Wnt signaling network |
| 0.1 | 1.3 | PID ERB GENOMIC PATHWAY | Validated nuclear estrogen receptor beta network |
| 0.1 | 2.5 | PID RXR VDR PATHWAY | RXR and RAR heterodimerization with other nuclear receptor |
| 0.1 | 3.0 | PID HES HEY PATHWAY | Notch-mediated HES/HEY network |
| 0.0 | 2.5 | PID P75 NTR PATHWAY | p75(NTR)-mediated signaling |
| 0.0 | 1.0 | PID ARF6 TRAFFICKING PATHWAY | Arf6 trafficking events |
Gene overrepresentation in curated gene sets: REACTOME pathways category:
| Log-likelihood per target | Total log-likelihood | Term | Description |
|---|---|---|---|
| 5.3 | 63.7 | REACTOME PASSIVE TRANSPORT BY AQUAPORINS | Genes involved in Passive Transport by Aquaporins |
| 4.3 | 121.2 | REACTOME ADHERENS JUNCTIONS INTERACTIONS | Genes involved in Adherens junctions interactions |
| 3.4 | 51.5 | REACTOME CREB PHOSPHORYLATION THROUGH THE ACTIVATION OF CAMKII | Genes involved in CREB phosphorylation through the activation of CaMKII |
| 3.4 | 91.6 | REACTOME SMOOTH MUSCLE CONTRACTION | Genes involved in Smooth Muscle Contraction |
| 2.7 | 32.6 | REACTOME SYNTHESIS OF BILE ACIDS AND BILE SALTS VIA 24 HYDROXYCHOLESTEROL | Genes involved in Synthesis of bile acids and bile salts via 24-hydroxycholesterol |
| 1.8 | 29.5 | REACTOME FORMATION OF ATP BY CHEMIOSMOTIC COUPLING | Genes involved in Formation of ATP by chemiosmotic coupling |
| 1.8 | 23.5 | REACTOME CYTOSOLIC SULFONATION OF SMALL MOLECULES | Genes involved in Cytosolic sulfonation of small molecules |
| 1.8 | 49.6 | REACTOME DARPP 32 EVENTS | Genes involved in DARPP-32 events |
| 1.0 | 34.0 | REACTOME GLYCOLYSIS | Genes involved in Glycolysis |
| 0.9 | 37.3 | REACTOME BMAL1 CLOCK NPAS2 ACTIVATES CIRCADIAN EXPRESSION | Genes involved in BMAL1:CLOCK/NPAS2 Activates Circadian Expression |
| 0.9 | 17.5 | REACTOME ERK MAPK TARGETS | Genes involved in ERK/MAPK targets |
| 0.8 | 4.2 | REACTOME ACYL CHAIN REMODELLING OF PS | Genes involved in Acyl chain remodelling of PS |
| 0.8 | 25.0 | REACTOME SYNTHESIS OF PA | Genes involved in Synthesis of PA |
| 0.7 | 8.9 | REACTOME PRESYNAPTIC NICOTINIC ACETYLCHOLINE RECEPTORS | Genes involved in Presynaptic nicotinic acetylcholine receptors |
| 0.6 | 6.9 | REACTOME ACTIVATION OF THE AP1 FAMILY OF TRANSCRIPTION FACTORS | Genes involved in Activation of the AP-1 family of transcription factors |
| 0.6 | 22.2 | REACTOME SPHINGOLIPID DE NOVO BIOSYNTHESIS | Genes involved in Sphingolipid de novo biosynthesis |
| 0.5 | 18.9 | REACTOME INTERACTION BETWEEN L1 AND ANKYRINS | Genes involved in Interaction between L1 and Ankyrins |
| 0.5 | 8.9 | REACTOME CITRIC ACID CYCLE TCA CYCLE | Genes involved in Citric acid cycle (TCA cycle) |
| 0.5 | 18.6 | REACTOME GLUCOSE METABOLISM | Genes involved in Glucose metabolism |
| 0.4 | 19.2 | REACTOME ACTIVATION OF CHAPERONE GENES BY XBP1S | Genes involved in Activation of Chaperone Genes by XBP1(S) |
| 0.4 | 97.0 | REACTOME ANTIGEN PROCESSING UBIQUITINATION PROTEASOME DEGRADATION | Genes involved in Antigen processing: Ubiquitination & Proteasome degradation |
| 0.4 | 4.6 | REACTOME CIRCADIAN CLOCK | Genes involved in Circadian Clock |
| 0.4 | 20.1 | REACTOME NETRIN1 SIGNALING | Genes involved in Netrin-1 signaling |
| 0.2 | 4.7 | REACTOME ZINC TRANSPORTERS | Genes involved in Zinc transporters |
| 0.2 | 13.8 | REACTOME GOLGI ASSOCIATED VESICLE BIOGENESIS | Genes involved in Golgi Associated Vesicle Biogenesis |
| 0.2 | 12.8 | REACTOME G ALPHA Z SIGNALLING EVENTS | Genes involved in G alpha (z) signalling events |
| 0.2 | 7.7 | REACTOME NOTCH1 INTRACELLULAR DOMAIN REGULATES TRANSCRIPTION | Genes involved in NOTCH1 Intracellular Domain Regulates Transcription |
| 0.2 | 4.0 | REACTOME HS GAG DEGRADATION | Genes involved in HS-GAG degradation |
| 0.2 | 2.6 | REACTOME BASE FREE SUGAR PHOSPHATE REMOVAL VIA THE SINGLE NUCLEOTIDE REPLACEMENT PATHWAY | Genes involved in Base-free sugar-phosphate removal via the single-nucleotide replacement pathway |
| 0.2 | 4.6 | REACTOME HOMOLOGOUS RECOMBINATION REPAIR OF REPLICATION INDEPENDENT DOUBLE STRAND BREAKS | Genes involved in Homologous recombination repair of replication-independent double-strand breaks |
| 0.2 | 11.3 | REACTOME METABOLISM OF VITAMINS AND COFACTORS | Genes involved in Metabolism of vitamins and cofactors |
| 0.2 | 1.7 | REACTOME HORMONE SENSITIVE LIPASE HSL MEDIATED TRIACYLGLYCEROL HYDROLYSIS | Genes involved in Hormone-sensitive lipase (HSL)-mediated triacylglycerol hydrolysis |
| 0.1 | 15.6 | REACTOME SIGNALING BY PDGF | Genes involved in Signaling by PDGF |
| 0.1 | 1.7 | REACTOME ENOS ACTIVATION AND REGULATION | Genes involved in eNOS activation and regulation |
| 0.1 | 2.5 | REACTOME GPVI MEDIATED ACTIVATION CASCADE | Genes involved in GPVI-mediated activation cascade |
| 0.1 | 1.1 | REACTOME REGULATED PROTEOLYSIS OF P75NTR | Genes involved in Regulated proteolysis of p75NTR |
| 0.1 | 4.1 | REACTOME MITOCHONDRIAL PROTEIN IMPORT | Genes involved in Mitochondrial Protein Import |
| 0.1 | 0.9 | REACTOME ACTIVATION OF CHAPERONE GENES BY ATF6 ALPHA | Genes involved in Activation of Chaperone Genes by ATF6-alpha |
| 0.1 | 5.9 | REACTOME CLASS B 2 SECRETIN FAMILY RECEPTORS | Genes involved in Class B/2 (Secretin family receptors) |
| 0.1 | 1.2 | REACTOME METABOLISM OF POLYAMINES | Genes involved in Metabolism of polyamines |
| 0.1 | 2.2 | REACTOME SIGNALING BY ROBO RECEPTOR | Genes involved in Signaling by Robo receptor |
| 0.0 | 0.4 | REACTOME BRANCHED CHAIN AMINO ACID CATABOLISM | Genes involved in Branched-chain amino acid catabolism |
| 0.0 | 4.1 | REACTOME PEPTIDE LIGAND BINDING RECEPTORS | Genes involved in Peptide ligand-binding receptors |
| 0.0 | 1.3 | REACTOME NUCLEAR RECEPTOR TRANSCRIPTION PATHWAY | Genes involved in Nuclear Receptor transcription pathway |