Project
GSE53960: rat RNA-Seq transcriptomic Bodymap
Navigation
Downloads
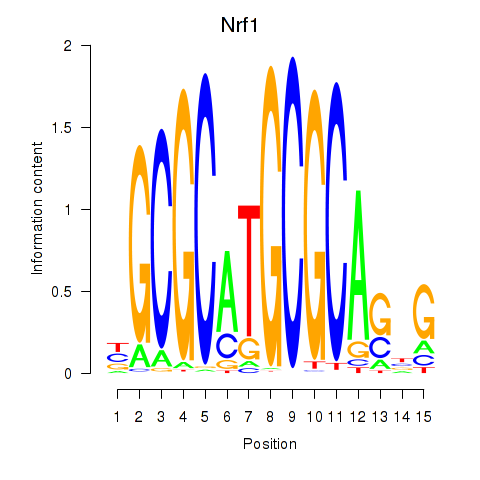
Results for Nrf1
Z-value: 2.78
Motif logo
Transcription factors associated with Nrf1
| Gene Symbol | Gene ID | Gene Info |
|---|---|---|
|
Nrf1
|
ENSRNOG00000008752 | nuclear respiratory factor 1 |
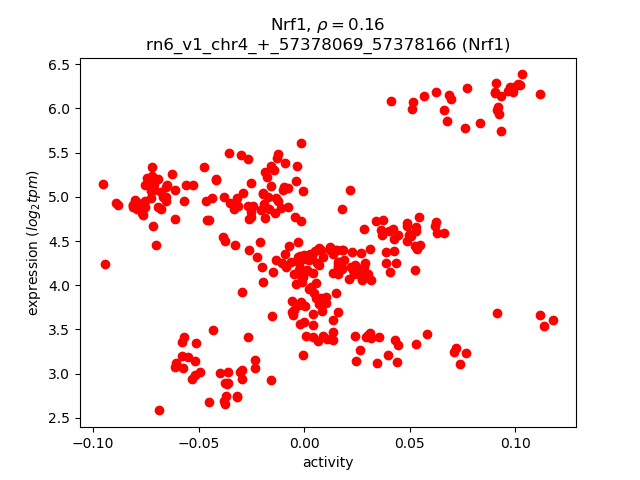
Activity-expression correlation:
| Gene | Promoter | Pearson corr. coef. | P-value | Plot |
|---|---|---|---|---|
| Nrf1 | rn6_v1_chr4_+_57378069_57378166 | 0.16 | 3.9e-03 | Click! |
Activity profile of Nrf1 motif
Sorted Z-values of Nrf1 motif
| Promoter | Log-likelihood | Transcript | Gene | Gene Info |
|---|---|---|---|---|
| chr5_+_148193710 | 38.24 |
ENSRNOT00000088568
|
Adgrb2
|
adhesion G protein-coupled receptor B2 |
| chr20_+_3364814 | 37.33 |
ENSRNOT00000001077
|
RGD1302996
|
hypothetical protein MGC:15854 |
| chr16_-_20939545 | 36.83 |
ENSRNOT00000027457
|
Sugp2
|
SURP and G patch domain containing 2 |
| chr1_+_81372650 | 36.27 |
ENSRNOT00000088829
|
Zfp428
|
zinc finger protein 428 |
| chr8_+_22648323 | 33.03 |
ENSRNOT00000013165
|
Smarca4
|
SWI/SNF related, matrix associated, actin dependent regulator of chromatin, subfamily a, member 4 |
| chr10_+_89069256 | 32.70 |
ENSRNOT00000008576
|
Tubg2
|
tubulin, gamma 2 |
| chr16_-_62373253 | 29.86 |
ENSRNOT00000034325
|
Tex15
|
testis expressed 15, meiosis and synapsis associated |
| chr8_+_64440214 | 27.97 |
ENSRNOT00000058339
|
Parp6
|
poly (ADP-ribose) polymerase family, member 6 |
| chr14_+_33108024 | 27.10 |
ENSRNOT00000090350
ENSRNOT00000067650 ENSRNOT00000077242 |
Noa1
|
nitric oxide associated 1 |
| chr14_-_3846891 | 26.48 |
ENSRNOT00000068520
|
Cdc7
|
cell division cycle 7 |
| chr1_+_81260548 | 26.26 |
ENSRNOT00000026669
|
Smg9
|
SMG9 nonsense mediated mRNA decay factor |
| chr20_-_5723902 | 24.53 |
ENSRNOT00000036871
|
Uqcc2
|
ubiquinol-cytochrome c reductase complex assembly factor 2 |
| chr1_-_101883744 | 23.70 |
ENSRNOT00000028635
|
Syngr4
|
synaptogyrin 4 |
| chr14_-_91904433 | 23.35 |
ENSRNOT00000005857
|
Fignl1
|
fidgetin-like 1 |
| chr13_-_73921969 | 23.19 |
ENSRNOT00000090848
|
Tdrd5
|
tudor domain containing 5 |
| chr7_-_113937941 | 22.49 |
ENSRNOT00000012408
|
Kcnk9
|
potassium two pore domain channel subfamily K member 9 |
| chr1_+_81373340 | 21.95 |
ENSRNOT00000026814
|
Zfp428
|
zinc finger protein 428 |
| chr10_+_89030865 | 21.91 |
ENSRNOT00000027370
|
Tubg1
|
tubulin, gamma 1 |
| chr10_-_88355678 | 21.85 |
ENSRNOT00000076625
|
Nt5c3b
|
5'-nucleotidase, cytosolic IIIB |
| chr18_+_27632786 | 21.26 |
ENSRNOT00000073564
ENSRNOT00000078969 |
Reep2
|
receptor accessory protein 2 |
| chr4_-_159482869 | 20.54 |
ENSRNOT00000088333
|
Rad51ap1
|
RAD51 associated protein 1 |
| chr9_-_10427746 | 20.53 |
ENSRNOT00000071207
|
Catsperd
|
cation channel sperm associated auxiliary subunit delta |
| chr10_-_25890639 | 20.04 |
ENSRNOT00000085499
|
Hmmr
|
hyaluronan-mediated motility receptor |
| chrX_+_17171605 | 19.76 |
ENSRNOT00000048236
|
Nudt10
|
nudix (nucleoside diphosphate linked moiety X)-type motif 10 |
| chr2_+_252263386 | 19.66 |
ENSRNOT00000092913
ENSRNOT00000084034 ENSRNOT00000041186 ENSRNOT00000092931 |
Ssx2ip
|
SSX family member 2 interacting protein |
| chr4_-_118534266 | 19.62 |
ENSRNOT00000081201
ENSRNOT00000024414 |
Gmcl1
|
germ cell-less, spermatogenesis associated 1 |
| chr3_+_5481522 | 19.49 |
ENSRNOT00000031316
|
Stkld1
|
serine/threonine kinase-like domain containing 1 |
| chr8_-_111850393 | 19.31 |
ENSRNOT00000044956
|
Cdv3
|
CDV3 homolog |
| chr1_+_100501676 | 19.13 |
ENSRNOT00000043724
|
Fam71e1
|
family with sequence similarity 71, member E1 |
| chr16_+_20939655 | 19.13 |
ENSRNOT00000027550
|
Armc6
|
armadillo repeat containing 6 |
| chr8_-_116965396 | 18.81 |
ENSRNOT00000042528
|
Bsn
|
bassoon (presynaptic cytomatrix protein) |
| chr10_+_74436208 | 18.79 |
ENSRNOT00000090921
ENSRNOT00000091163 |
Trim37
|
tripartite motif-containing 37 |
| chr2_-_187668677 | 18.55 |
ENSRNOT00000056898
ENSRNOT00000092563 |
Tsacc
|
TSSK6 activating co-chaperone |
| chr16_+_20740826 | 18.52 |
ENSRNOT00000038057
|
Crtc1
|
CREB regulated transcription coactivator 1 |
| chr10_+_74436534 | 18.18 |
ENSRNOT00000008298
|
Trim37
|
tripartite motif-containing 37 |
| chr6_+_102048372 | 17.99 |
ENSRNOT00000013375
|
Eif2s1
|
eukaryotic translation initiation factor 2 subunit 1 alpha |
| chr3_-_153114520 | 17.95 |
ENSRNOT00000008254
|
Dsn1
|
DSN1 homolog, MIS12 kinetochore complex component |
| chr3_+_125428260 | 17.80 |
ENSRNOT00000028892
|
Chgb
|
chromogranin B |
| chr1_+_31835000 | 17.73 |
ENSRNOT00000020780
|
Cep72
|
centrosomal protein 72 |
| chr3_-_176144531 | 17.30 |
ENSRNOT00000082266
|
Tcfl5
|
transcription factor like 5 |
| chr19_+_57650163 | 17.27 |
ENSRNOT00000038257
ENSRNOT00000083572 |
Sprtn
|
SprT-like N-terminal domain |
| chr4_+_146106386 | 17.10 |
ENSRNOT00000008342
|
Slc6a11
|
solute carrier family 6 member 11 |
| chr1_+_40982862 | 16.87 |
ENSRNOT00000026367
ENSRNOT00000092953 |
Armt1
|
acidic residue methyltransferase 1 |
| chr20_+_4967194 | 16.83 |
ENSRNOT00000070846
|
Lsm2
|
LSM2 homolog, U6 small nuclear RNA and mRNA degradation associated |
| chr2_+_30346069 | 16.67 |
ENSRNOT00000076577
|
Serf1
|
small EDRK-rich factor 1 |
| chr4_+_114776797 | 16.67 |
ENSRNOT00000089635
|
LOC103692167
|
polycomb group RING finger protein 1 |
| chr1_+_100811755 | 16.46 |
ENSRNOT00000074847
|
Nup62
|
nucleoporin 62 |
| chr16_+_54765325 | 16.05 |
ENSRNOT00000065327
ENSRNOT00000086899 |
Mtmr7
|
myotubularin related protein 7 |
| chr3_+_110574417 | 15.69 |
ENSRNOT00000031231
|
Disp2
|
dispatched RND transporter family member 2 |
| chr3_+_176087700 | 15.57 |
ENSRNOT00000073679
|
Mrgbp
|
MRG domain binding protein |
| chr11_-_84037938 | 15.52 |
ENSRNOT00000002327
|
Abcf3
|
ATP binding cassette subfamily F member 3 |
| chr20_+_4966817 | 15.47 |
ENSRNOT00000081527
ENSRNOT00000081265 |
Lsm2
|
LSM2 homolog, U6 small nuclear RNA and mRNA degradation associated |
| chrX_+_39711201 | 15.46 |
ENSRNOT00000080512
ENSRNOT00000009802 |
Cnksr2
|
connector enhancer of kinase suppressor of Ras 2 |
| chr4_-_157798868 | 15.46 |
ENSRNOT00000044425
|
Tuba3b
|
tubulin, alpha 3B |
| chr19_+_25262076 | 15.35 |
ENSRNOT00000030658
|
RGD1306072
|
hypothetical LOC304654 |
| chr16_-_24951612 | 15.30 |
ENSRNOT00000018987
|
Tktl2
|
transketolase-like 2 |
| chr12_-_24710019 | 15.24 |
ENSRNOT00000049601
|
Stx1a
|
syntaxin 1A |
| chr20_-_46666830 | 15.14 |
ENSRNOT00000000331
|
Cep57l1
|
centrosomal protein 57-like 1 |
| chr6_+_126766967 | 15.09 |
ENSRNOT00000052296
|
Cox8c
|
cytochrome c oxidase subunit 8C |
| chr1_+_198360627 | 15.08 |
ENSRNOT00000027129
|
Kctd13
|
potassium channel tetramerization domain containing 13 |
| chr11_-_86655482 | 15.08 |
ENSRNOT00000002596
ENSRNOT00000073377 |
Gnb1l
|
G protein subunit beta 1 like |
| chr16_+_85331866 | 14.89 |
ENSRNOT00000019615
|
Lig4
|
DNA ligase 4 |
| chr5_-_154332940 | 14.80 |
ENSRNOT00000014458
|
Pithd1
|
PITH domain containing 1 |
| chr4_+_2053712 | 14.78 |
ENSRNOT00000045086
|
Rnf32
|
ring finger protein 32 |
| chr14_-_83062302 | 14.75 |
ENSRNOT00000086769
ENSRNOT00000085735 |
Ywhah
|
tyrosine 3-monooxygenase/tryptophan 5-monooxygenase activation protein, eta |
| chr1_-_213534641 | 14.64 |
ENSRNOT00000033074
|
Syce1
|
synaptonemal complex central element protein 1 |
| chr17_+_42064376 | 14.62 |
ENSRNOT00000023787
|
Mrs2
|
MRS2 magnesium transporter |
| chr13_-_110257367 | 14.60 |
ENSRNOT00000005576
|
Dtl
|
denticleless E3 ubiquitin protein ligase homolog |
| chr2_-_144007636 | 14.53 |
ENSRNOT00000092028
|
Rfxap
|
regulatory factor X-associated protein |
| chr1_-_222495382 | 14.49 |
ENSRNOT00000028759
|
Naa40
|
N(alpha)-acetyltransferase 40, NatD catalytic subunit |
| chr10_-_74376270 | 14.39 |
ENSRNOT00000079311
|
Gdpd1
|
glycerophosphodiester phosphodiesterase domain containing 1 |
| chr2_-_144217600 | 14.34 |
ENSRNOT00000000101
|
Rfxapl1
|
regulatory factor X-associated protein-like 1 |
| chr7_+_104501014 | 14.32 |
ENSRNOT00000090226
|
RGD1359449
|
gasdermin domain containing protein RGD1359449 |
| chr7_-_60294796 | 14.24 |
ENSRNOT00000007580
|
Yeats4
|
YEATS domain containing 4 |
| chr16_-_21089508 | 14.20 |
ENSRNOT00000072565
|
Hapln4
|
hyaluronan and proteoglycan link protein 4 |
| chr4_+_179905116 | 14.18 |
ENSRNOT00000052352
|
Tuba3a
|
tubulin, alpha 3A |
| chr16_+_61795432 | 14.18 |
ENSRNOT00000017756
|
Dctn6
|
dynactin subunit 6 |
| chr9_-_30251388 | 14.17 |
ENSRNOT00000035033
|
Sdhaf4
|
succinate dehydrogenase complex assembly factor 4 |
| chr1_-_85517360 | 14.08 |
ENSRNOT00000026114
|
Eid2
|
EP300 interacting inhibitor of differentiation 2 |
| chr6_+_137824213 | 14.00 |
ENSRNOT00000056880
|
Pacs2
|
phosphofurin acidic cluster sorting protein 2 |
| chr8_-_36760742 | 13.93 |
ENSRNOT00000017307
|
Ddx25
|
DEAD-box helicase 25 |
| chr3_+_112531703 | 13.84 |
ENSRNOT00000041727
|
LOC100911204
|
protein CASC5-like |
| chr3_-_172574333 | 13.75 |
ENSRNOT00000075573
|
Prelid3b
|
PRELI domain containing 3B |
| chr2_+_127686925 | 13.75 |
ENSRNOT00000086653
ENSRNOT00000016946 |
Plk4
|
polo-like kinase 4 |
| chr4_-_45414177 | 13.66 |
ENSRNOT00000091311
|
Asz1
|
ankyrin repeat, SAM and basic leucine zipper domain containing 1 |
| chr3_-_3434027 | 13.63 |
ENSRNOT00000024163
|
Camsap1
|
calmodulin regulated spectrin-associated protein 1 |
| chr11_+_31428358 | 13.59 |
ENSRNOT00000002827
|
Olig1
|
oligodendrocyte transcription factor 1 |
| chr20_+_13156241 | 13.55 |
ENSRNOT00000050531
|
Prmt2
|
protein arginine methyltransferase 2 |
| chr2_-_30791221 | 13.54 |
ENSRNOT00000082846
|
Ccnb1
|
cyclin B1 |
| chr9_-_10170428 | 13.52 |
ENSRNOT00000073048
|
LOC316124
|
similar to gonadotropin-regulated long chain acyl-CoA synthetase |
| chr6_+_64297888 | 13.37 |
ENSRNOT00000050222
ENSRNOT00000083088 ENSRNOT00000093147 |
Nrcam
|
neuronal cell adhesion molecule |
| chr1_-_195096460 | 13.35 |
ENSRNOT00000077253
|
Snrpn
|
small nuclear ribonucleoprotein polypeptide N |
| chr8_+_28075551 | 13.30 |
ENSRNOT00000012078
|
Ncapd3
|
non-SMC condensin II complex, subunit D3 |
| chr17_+_81922329 | 13.27 |
ENSRNOT00000031542
|
Cacnb2
|
calcium voltage-gated channel auxiliary subunit beta 2 |
| chr10_-_49196177 | 13.22 |
ENSRNOT00000084418
|
Zfp286a
|
zinc finger protein 286A |
| chr14_+_13751231 | 13.06 |
ENSRNOT00000044244
|
Gk2
|
glycerol kinase 2 |
| chr19_+_24545318 | 13.03 |
ENSRNOT00000005071
|
Clgn
|
calmegin |
| chr4_+_5841998 | 13.00 |
ENSRNOT00000010025
|
Xrcc2
|
X-ray repair cross complementing 2 |
| chr11_+_65960277 | 12.97 |
ENSRNOT00000003674
|
Ndufb4
|
NADH:ubiquinone oxidoreductase subunit B4 |
| chr2_+_127538659 | 12.94 |
ENSRNOT00000093483
ENSRNOT00000058476 |
Slc25a31
|
solute carrier family 25 member 31 |
| chr1_+_16819170 | 12.93 |
ENSRNOT00000019734
ENSRNOT00000086756 |
Hbs1l
|
HBS1-like translational GTPase |
| chr7_-_11513415 | 12.91 |
ENSRNOT00000082486
|
Thop1
|
thimet oligopeptidase 1 |
| chr7_-_11513581 | 12.90 |
ENSRNOT00000027045
|
Thop1
|
thimet oligopeptidase 1 |
| chr7_-_124491004 | 12.84 |
ENSRNOT00000037710
|
Ttll12
|
tubulin tyrosine ligase like 12 |
| chr10_+_64375924 | 12.76 |
ENSRNOT00000010227
|
Dbil5
|
diazepam binding inhibitor-like 5 |
| chr7_+_129973480 | 12.76 |
ENSRNOT00000050620
ENSRNOT00000042686 |
Mov10l1
|
Mov10 RISC complex RNA helicase like 1 |
| chr2_+_210685197 | 12.69 |
ENSRNOT00000072342
|
NEWGENE_620381
|
glutathione S-transferase mu 3 |
| chr15_+_86153628 | 12.65 |
ENSRNOT00000012842
|
Uchl3
|
ubiquitin C-terminal hydrolase L3 |
| chr3_-_159802952 | 12.62 |
ENSRNOT00000011610
|
Oser1
|
oxidative stress responsive serine-rich 1 |
| chr4_+_97531083 | 12.44 |
ENSRNOT00000007285
|
Mad2l1
|
MAD2 mitotic arrest deficient-like 1 (yeast) |
| chrX_-_124464963 | 12.28 |
ENSRNOT00000036472
ENSRNOT00000077697 |
Tmem255a
|
transmembrane protein 255A |
| chr20_-_17091766 | 12.22 |
ENSRNOT00000074404
|
Zwint
|
ZW10 interacting kinetochore protein |
| chr9_+_17163354 | 12.20 |
ENSRNOT00000026049
|
Polh
|
DNA polymerase eta |
| chr12_-_40417654 | 12.12 |
ENSRNOT00000072481
|
Brap
|
BRCA1 associated protein |
| chr17_+_78915604 | 12.11 |
ENSRNOT00000057855
|
Rpp38
|
ribonuclease P/MRP 38 subunit |
| chr1_+_277641512 | 12.08 |
ENSRNOT00000084861
ENSRNOT00000023024 |
Tdrd1
|
tudor domain containing 1 |
| chr9_+_16612433 | 12.07 |
ENSRNOT00000023979
|
Klhdc3
|
kelch domain containing 3 |
| chr17_+_78762991 | 12.06 |
ENSRNOT00000020924
|
Suv39h2
|
suppressor of variegation 3-9 homolog 2 |
| chr10_+_88490798 | 11.98 |
ENSRNOT00000023872
|
Cnp
|
2',3'-cyclic nucleotide 3' phosphodiesterase |
| chr1_-_195096694 | 11.98 |
ENSRNOT00000088874
|
Snurf
|
SNRPN upstream reading frame |
| chr6_+_127400585 | 11.84 |
ENSRNOT00000087429
|
Ppp4r4
|
protein phosphatase 4, regulatory subunit 4 |
| chr2_-_189096785 | 11.82 |
ENSRNOT00000028200
|
Chrnb2
|
cholinergic receptor nicotinic beta 2 subunit |
| chr11_+_57486365 | 11.82 |
ENSRNOT00000048533
|
LOC103693563
|
mycophenolic acid acyl-glucuronide esterase, mitochondrial |
| chr1_-_87937516 | 11.82 |
ENSRNOT00000087522
|
Eif3k
|
eukaryotic translation initiation factor 3, subunit K |
| chr5_-_122642202 | 11.76 |
ENSRNOT00000046691
|
Wdr78
|
WD repeat domain 78 |
| chr15_+_46008613 | 11.75 |
ENSRNOT00000066864
ENSRNOT00000080537 |
Wdfy2
|
WD repeat and FYVE domain containing 2 |
| chr1_+_261158261 | 11.71 |
ENSRNOT00000071965
|
Pgam1
|
phosphoglycerate mutase 1 |
| chr5_+_138245639 | 11.69 |
ENSRNOT00000066169
|
Svbp
|
small vasohibin binding protein |
| chr2_-_229718659 | 11.66 |
ENSRNOT00000012676
|
Ugt8
|
UDP glycosyltransferase 8 |
| chrX_+_17540458 | 11.61 |
ENSRNOT00000045710
|
Nudt11
|
nudix hydrolase 11 |
| chr10_+_38918748 | 11.60 |
ENSRNOT00000009999
|
Kif3a
|
kinesin family member 3a |
| chr9_-_119871382 | 11.51 |
ENSRNOT00000018644
|
Ndc80
|
NDC80 kinetochore complex component |
| chr5_+_138245822 | 11.47 |
ENSRNOT00000009879
|
Svbp
|
small vasohibin binding protein |
| chr7_-_140919234 | 11.43 |
ENSRNOT00000082470
|
Mcrs1
|
microspherule protein 1 |
| chr20_-_46871946 | 11.29 |
ENSRNOT00000031047
|
Armc2
|
armadillo repeat containing 2 |
| chr13_+_82574966 | 11.28 |
ENSRNOT00000003844
|
Ccdc181
|
coiled-coil domain containing 181 |
| chr2_-_252359798 | 11.27 |
ENSRNOT00000021063
|
Spata1
|
spermatogenesis associated 1 |
| chr1_+_79959591 | 11.19 |
ENSRNOT00000090515
|
Rsph6a
|
radial spoke head 6 homolog A |
| chr9_-_65879521 | 11.17 |
ENSRNOT00000017517
|
Als2cr11
|
amyotrophic lateral sclerosis 2 chromosome region, candidate 11 |
| chr5_-_167999853 | 11.17 |
ENSRNOT00000087402
|
Park7
|
Parkinsonism associated deglycase |
| chr9_-_17163170 | 11.13 |
ENSRNOT00000025921
|
Xpo5
|
exportin 5 |
| chr6_+_21051327 | 11.12 |
ENSRNOT00000052131
|
Fam98a
|
family with sequence similarity 98, member A |
| chr7_+_120140460 | 11.12 |
ENSRNOT00000040513
ENSRNOT00000073905 |
Pdxp
|
pyridoxal phosphatase |
| chr1_+_15180328 | 11.08 |
ENSRNOT00000050656
|
Il20ra
|
interleukin 20 receptor subunit alpha |
| chr14_-_82055290 | 11.04 |
ENSRNOT00000058062
|
RGD1560394
|
RGD1560394 |
| chr18_+_68983545 | 11.00 |
ENSRNOT00000085317
|
Stard6
|
StAR-related lipid transfer domain containing 6 |
| chr10_-_48599208 | 10.98 |
ENSRNOT00000003974
|
Zswim7
|
zinc finger, SWIM-type containing 7 |
| chrX_-_156155014 | 10.98 |
ENSRNOT00000088637
|
LOC102552182
|
L antigen family member 3-like |
| chr3_-_119611136 | 10.96 |
ENSRNOT00000016157
|
Ncaph
|
non-SMC condensin I complex, subunit H |
| chr19_+_11386024 | 10.96 |
ENSRNOT00000026076
|
Bbs2
|
Bardet-Biedl syndrome 2 |
| chr7_+_35125424 | 10.94 |
ENSRNOT00000085978
ENSRNOT00000010117 |
Ndufa12
|
NADH:ubiquinone oxidoreductase subunit A12 |
| chr12_+_19599834 | 10.94 |
ENSRNOT00000092039
ENSRNOT00000042006 |
Stag3
|
stromal antigen 3 |
| chr18_+_73564247 | 10.92 |
ENSRNOT00000077679
ENSRNOT00000035317 |
St8sia5
|
ST8 alpha-N-acetyl-neuraminide alpha-2,8-sialyltransferase 5 |
| chr1_-_94494980 | 10.89 |
ENSRNOT00000020014
|
Ccne1
|
cyclin E1 |
| chr6_-_37122023 | 10.86 |
ENSRNOT00000007609
|
Vsnl1
|
visinin-like 1 |
| chr1_-_222734184 | 10.82 |
ENSRNOT00000049812
ENSRNOT00000028785 |
Rtn3
|
reticulon 3 |
| chr19_-_27464805 | 10.82 |
ENSRNOT00000039467
|
Orc6
|
origin recognition complex, subunit 6 |
| chr18_-_16009710 | 10.82 |
ENSRNOT00000022169
|
Ino80c
|
INO80 complex subunit C |
| chr10_-_58834538 | 10.74 |
ENSRNOT00000020043
|
Slc13a5
|
solute carrier family 13 member 5 |
| chr7_-_12569110 | 10.73 |
ENSRNOT00000093446
ENSRNOT00000016733 |
Wdr18
|
WD repeat domain 18 |
| chr15_+_34167945 | 10.73 |
ENSRNOT00000032252
|
Carmil3
|
capping protein regulator and myosin 1 linker 3 |
| chr3_-_112789282 | 10.72 |
ENSRNOT00000090680
ENSRNOT00000066181 |
Ttbk2
|
tau tubulin kinase 2 |
| chr10_-_68926264 | 10.61 |
ENSRNOT00000008661
|
Phb-ps1
|
prohibitin, pseudogene 1 |
| chr1_-_65551043 | 10.57 |
ENSRNOT00000029996
|
Trim28
|
tripartite motif-containing 28 |
| chr4_-_123118186 | 10.57 |
ENSRNOT00000038096
|
LOC100361898
|
coiled-coil-helix-coiled-coil-helix domain containing 4 |
| chr3_+_175924522 | 10.56 |
ENSRNOT00000086626
|
NEWGENE_1308612
|
MRG/MORF4L binding protein |
| chr18_-_70184337 | 10.56 |
ENSRNOT00000020637
|
Ska1
|
spindle and kinetochore associated complex subunit 1 |
| chr11_+_84396033 | 10.52 |
ENSRNOT00000002316
|
Abcc5
|
ATP binding cassette subfamily C member 5 |
| chr2_-_142235066 | 10.51 |
ENSRNOT00000018385
|
Cog6
|
component of oligomeric golgi complex 6 |
| chr1_+_78876205 | 10.50 |
ENSRNOT00000022610
|
Pnmal2
|
paraneoplastic Ma antigen family-like 2 |
| chr8_-_68312909 | 10.39 |
ENSRNOT00000066106
|
RGD1309779
|
similar to ENSANGP00000021391 |
| chr14_-_36208278 | 10.35 |
ENSRNOT00000045050
ENSRNOT00000088448 |
Fip1l1
|
factor interacting with PAPOLA and CPSF1 |
| chr17_+_42302540 | 10.35 |
ENSRNOT00000025389
|
Gmnn
|
geminin, DNA replication inhibitor |
| chr1_-_81733957 | 10.29 |
ENSRNOT00000027226
|
Lypd4
|
Ly6/Plaur domain containing 4 |
| chr2_+_261402980 | 10.28 |
ENSRNOT00000012841
|
Lrriq3
|
leucine-rich repeats and IQ motif containing 3 |
| chr9_+_27333956 | 10.27 |
ENSRNOT00000037489
|
Tmem14a
|
transmembrane protein 14A |
| chr7_+_123308041 | 10.26 |
ENSRNOT00000009428
|
Mei1
|
meiotic double-stranded break formation protein 1 |
| chr16_+_74292438 | 10.25 |
ENSRNOT00000026197
|
Vdac3
|
voltage-dependent anion channel 3 |
| chr8_-_111850075 | 10.24 |
ENSRNOT00000082097
|
Cdv3
|
CDV3 homolog |
| chr3_-_120404910 | 10.22 |
ENSRNOT00000051783
|
Bub1
|
BUB1 mitotic checkpoint serine/threonine kinase |
| chr10_-_73865364 | 10.22 |
ENSRNOT00000005226
|
Rps6kb1
|
ribosomal protein S6 kinase B1 |
| chr4_+_117371659 | 10.17 |
ENSRNOT00000045735
|
Alms1
|
ALMS1, centrosome and basal body associated protein |
| chr1_+_197659187 | 10.14 |
ENSRNOT00000082228
|
LOC103690016
|
serine/threonine-protein kinase SBK1 |
| chr1_+_211544157 | 10.09 |
ENSRNOT00000023610
|
Lrrc27
|
leucine rich repeat containing 27 |
| chr19_-_37725623 | 10.08 |
ENSRNOT00000024197
|
Gfod2
|
glucose-fructose oxidoreductase domain containing 2 |
| chr7_-_23843505 | 10.07 |
ENSRNOT00000006366
ENSRNOT00000077577 |
Fbxo7
|
F-box protein 7 |
| chr1_-_82918444 | 10.04 |
ENSRNOT00000072555
|
LOC102553892
|
CD177 antigen-like |
| chr2_+_197682000 | 10.01 |
ENSRNOT00000066821
|
Hormad1
|
HORMA domain containing 1 |
| chr8_-_13909061 | 9.98 |
ENSRNOT00000078372
ENSRNOT00000083011 |
Cep295
|
centrosomal protein 295 |
| chr6_-_22281886 | 9.96 |
ENSRNOT00000039375
|
Spast
|
spastin |
| chr8_+_114897011 | 9.93 |
ENSRNOT00000074683
|
Twf2
|
twinfilin actin-binding protein 2 |
| chr16_+_9907598 | 9.93 |
ENSRNOT00000027352
|
Ptpn20
|
protein tyrosine phosphatase, non-receptor type 20 |
| chr15_+_4658246 | 9.92 |
ENSRNOT00000008391
|
Saysd1
|
SAYSVFN motif domain containing 1 |
| chr10_-_43760930 | 9.92 |
ENSRNOT00000003639
|
Zfp672
|
zinc finger protein 672 |
| chr7_-_12905339 | 9.90 |
ENSRNOT00000088330
|
Cdc34
|
cell division cycle 34 |
| chr7_+_70364813 | 9.89 |
ENSRNOT00000084012
ENSRNOT00000031230 |
Agap2
|
ArfGAP with GTPase domain, ankyrin repeat and PH domain 2 |
| chrX_+_135550834 | 9.86 |
ENSRNOT00000048922
|
Rbmx2
|
RNA binding motif protein, X-linked 2 |
| chr16_+_8734035 | 9.79 |
ENSRNOT00000088529
|
Ercc6
|
ERCC excision repair 6, chromatin remodeling factor |
| chr20_-_29558321 | 9.76 |
ENSRNOT00000000702
|
Anapc16
|
anaphase promoting complex subunit 16 |
| chr13_+_82072497 | 9.76 |
ENSRNOT00000063810
ENSRNOT00000085135 |
Kifap3
|
kinesin-associated protein 3 |
Network of associatons between targets according to the STRING database.

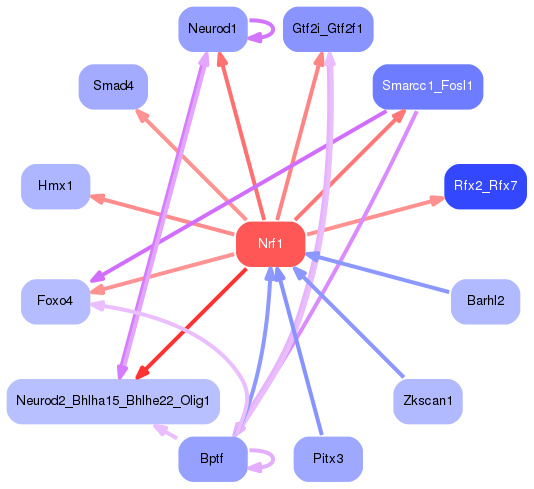
First level regulatory network of Nrf1
Gene Ontology Analysis
Gene overrepresentation in biological process category:
| Log-likelihood per target | Total log-likelihood | Term | Description |
|---|---|---|---|
| 11.0 | 33.0 | GO:1902659 | regulation of glucose mediated signaling pathway(GO:1902659) |
| 10.1 | 30.2 | GO:0046601 | positive regulation of centriole replication(GO:0046601) |
| 9.2 | 37.0 | GO:0036353 | histone H2A-K119 monoubiquitination(GO:0036353) |
| 8.6 | 25.8 | GO:2000771 | regulation of establishment or maintenance of cell polarity regulating cell shape(GO:2000769) positive regulation of establishment or maintenance of cell polarity regulating cell shape(GO:2000771) |
| 8.3 | 33.2 | GO:1901906 | diadenosine polyphosphate catabolic process(GO:0015961) diphosphoinositol polyphosphate metabolic process(GO:0071543) diadenosine pentaphosphate metabolic process(GO:1901906) diadenosine pentaphosphate catabolic process(GO:1901907) diadenosine hexaphosphate metabolic process(GO:1901908) diadenosine hexaphosphate catabolic process(GO:1901909) adenosine 5'-(hexahydrogen pentaphosphate) metabolic process(GO:1901910) adenosine 5'-(hexahydrogen pentaphosphate) catabolic process(GO:1901911) |
| 7.7 | 23.2 | GO:0007314 | oocyte construction(GO:0007308) oocyte axis specification(GO:0007309) oocyte anterior/posterior axis specification(GO:0007314) pole plasm assembly(GO:0007315) maternal determination of anterior/posterior axis, embryo(GO:0008358) P granule organization(GO:0030719) |
| 7.5 | 22.4 | GO:1903197 | enzyme active site formation via L-cysteine sulfinic acid(GO:0018323) primary alcohol biosynthetic process(GO:0034309) cellular response to glyoxal(GO:0036471) TRAIL receptor biosynthetic process(GO:0045557) regulation of TRAIL receptor biosynthetic process(GO:0045560) glycolate biosynthetic process(GO:0046295) negative regulation of TRAIL-activated apoptotic signaling pathway(GO:1903122) regulation of pyrroline-5-carboxylate reductase activity(GO:1903167) positive regulation of pyrroline-5-carboxylate reductase activity(GO:1903168) regulation of tyrosine 3-monooxygenase activity(GO:1903176) positive regulation of tyrosine 3-monooxygenase activity(GO:1903178) L-dopa metabolic process(GO:1903184) L-dopa biosynthetic process(GO:1903185) glyoxal metabolic process(GO:1903189) regulation of L-dopa biosynthetic process(GO:1903195) positive regulation of L-dopa biosynthetic process(GO:1903197) regulation of L-dopa decarboxylase activity(GO:1903198) positive regulation of L-dopa decarboxylase activity(GO:1903200) positive regulation of cellular amino acid biosynthetic process(GO:2000284) |
| 6.6 | 26.5 | GO:0000727 | double-strand break repair via break-induced replication(GO:0000727) |
| 6.0 | 18.0 | GO:0032057 | negative regulation of translational initiation in response to stress(GO:0032057) response to manganese-induced endoplasmic reticulum stress(GO:1990737) |
| 5.9 | 17.7 | GO:0033566 | gamma-tubulin complex localization(GO:0033566) |
| 5.5 | 16.4 | GO:0071163 | DNA replication preinitiation complex assembly(GO:0071163) |
| 5.2 | 15.7 | GO:0045041 | protein import into mitochondrial intermembrane space(GO:0045041) |
| 4.9 | 14.7 | GO:0006713 | glucocorticoid catabolic process(GO:0006713) |
| 4.7 | 14.1 | GO:0007181 | transforming growth factor beta receptor complex assembly(GO:0007181) |
| 4.7 | 14.0 | GO:0019375 | galactosylceramide biosynthetic process(GO:0006682) galactolipid biosynthetic process(GO:0019375) |
| 4.6 | 18.5 | GO:1902630 | regulation of membrane hyperpolarization(GO:1902630) |
| 4.5 | 17.8 | GO:0043987 | histone H3-S10 phosphorylation(GO:0043987) |
| 4.4 | 13.3 | GO:1904879 | positive regulation of calcium ion transmembrane transport via high voltage-gated calcium channel(GO:1904879) |
| 4.4 | 13.1 | GO:0046167 | glycerol-3-phosphate biosynthetic process(GO:0046167) |
| 4.2 | 33.7 | GO:0090267 | positive regulation of spindle checkpoint(GO:0090232) positive regulation of mitotic cell cycle spindle assembly checkpoint(GO:0090267) |
| 4.1 | 20.4 | GO:0010032 | meiotic chromosome condensation(GO:0010032) |
| 3.9 | 11.8 | GO:0060084 | synaptic transmission involved in micturition(GO:0060084) |
| 3.8 | 11.3 | GO:1904404 | traversing start control point of mitotic cell cycle(GO:0007089) response to formaldehyde(GO:1904404) |
| 3.7 | 14.9 | GO:0097680 | double-strand break repair via classical nonhomologous end joining(GO:0097680) |
| 3.7 | 29.8 | GO:0017062 | respiratory chain complex III assembly(GO:0017062) mitochondrial respiratory chain complex III assembly(GO:0034551) |
| 3.7 | 11.1 | GO:1900368 | regulation of RNA interference(GO:1900368) |
| 3.7 | 11.1 | GO:0042822 | pyridoxal phosphate metabolic process(GO:0042822) |
| 3.5 | 17.5 | GO:0000707 | meiotic DNA recombinase assembly(GO:0000707) |
| 3.3 | 13.1 | GO:0051792 | medium-chain fatty acid biosynthetic process(GO:0051792) |
| 3.3 | 16.4 | GO:1904751 | positive regulation of protein localization to nucleolus(GO:1904751) |
| 3.2 | 12.7 | GO:0038108 | negative regulation of appetite by leptin-mediated signaling pathway(GO:0038108) |
| 3.1 | 9.4 | GO:2000688 | positive regulation of rubidium ion transport(GO:2000682) positive regulation of rubidium ion transmembrane transporter activity(GO:2000688) |
| 3.1 | 43.6 | GO:0019985 | translesion synthesis(GO:0019985) |
| 3.1 | 9.3 | GO:0048003 | antigen processing and presentation of lipid antigen via MHC class Ib(GO:0048003) antigen processing and presentation, exogenous lipid antigen via MHC class Ib(GO:0048007) |
| 3.1 | 18.5 | GO:0098928 | presynaptic signal transduction(GO:0098928) presynapse to nucleus signaling pathway(GO:0099526) |
| 3.1 | 9.2 | GO:2000041 | Wnt signaling pathway involved in digestive tract morphogenesis(GO:0044333) regulation of planar cell polarity pathway involved in axis elongation(GO:2000040) negative regulation of planar cell polarity pathway involved in axis elongation(GO:2000041) |
| 3.1 | 9.2 | GO:0006344 | maintenance of chromatin silencing(GO:0006344) |
| 2.9 | 14.7 | GO:0006362 | transcription elongation from RNA polymerase I promoter(GO:0006362) |
| 2.8 | 45.2 | GO:0034587 | piRNA metabolic process(GO:0034587) |
| 2.8 | 14.1 | GO:0071816 | tail-anchored membrane protein insertion into ER membrane(GO:0071816) |
| 2.8 | 19.7 | GO:0035735 | intraciliary transport involved in cilium morphogenesis(GO:0035735) |
| 2.8 | 16.7 | GO:0045040 | protein import into mitochondrial outer membrane(GO:0045040) |
| 2.7 | 5.4 | GO:0000715 | nucleotide-excision repair, DNA damage recognition(GO:0000715) |
| 2.7 | 8.1 | GO:0070084 | protein initiator methionine removal(GO:0070084) |
| 2.7 | 8.1 | GO:1990167 | protein K27-linked deubiquitination(GO:1990167) |
| 2.7 | 10.7 | GO:0015746 | citrate transport(GO:0015746) |
| 2.6 | 7.9 | GO:0019389 | glucuronoside metabolic process(GO:0019389) |
| 2.5 | 15.2 | GO:0010701 | positive regulation of norepinephrine secretion(GO:0010701) |
| 2.5 | 20.2 | GO:0051177 | meiotic sister chromatid segregation(GO:0045144) meiotic sister chromatid cohesion(GO:0051177) |
| 2.5 | 7.5 | GO:0045575 | basophil activation(GO:0045575) |
| 2.4 | 9.7 | GO:0030581 | intracellular transport of viral protein in host cell(GO:0019060) symbiont intracellular protein transport in host(GO:0030581) intracellular protein transport in other organism involved in symbiotic interaction(GO:0051708) |
| 2.4 | 62.8 | GO:0007020 | microtubule nucleation(GO:0007020) |
| 2.4 | 12.0 | GO:0043570 | maintenance of DNA repeat elements(GO:0043570) |
| 2.4 | 7.2 | GO:0090172 | microtubule cytoskeleton organization involved in homologous chromosome segregation(GO:0090172) |
| 2.4 | 4.8 | GO:0042998 | positive regulation of Golgi to plasma membrane protein transport(GO:0042998) |
| 2.4 | 9.6 | GO:0090309 | positive regulation of methylation-dependent chromatin silencing(GO:0090309) |
| 2.4 | 7.1 | GO:0019287 | isopentenyl diphosphate biosynthetic process, mevalonate pathway(GO:0019287) |
| 2.4 | 21.3 | GO:0032596 | protein transport into membrane raft(GO:0032596) sensory perception of sweet taste(GO:0050916) |
| 2.3 | 11.7 | GO:0043456 | regulation of pentose-phosphate shunt(GO:0043456) |
| 2.3 | 7.0 | GO:1904098 | regulation of protein O-linked glycosylation(GO:1904098) positive regulation of protein O-linked glycosylation(GO:1904100) |
| 2.3 | 9.2 | GO:0061741 | vacuolar transmembrane transport(GO:0034486) chaperone-mediated protein transport involved in chaperone-mediated autophagy(GO:0061741) |
| 2.3 | 4.5 | GO:1902958 | neuron intrinsic apoptotic signaling pathway in response to hydrogen peroxide(GO:0036482) positive regulation of mitochondrial electron transport, NADH to ubiquinone(GO:1902958) regulation of hydrogen peroxide-induced neuron intrinsic apoptotic signaling pathway(GO:1903383) negative regulation of hydrogen peroxide-induced neuron intrinsic apoptotic signaling pathway(GO:1903384) |
| 2.3 | 4.5 | GO:0018171 | peptidyl-cysteine oxidation(GO:0018171) |
| 2.3 | 9.0 | GO:1904781 | positive regulation of protein localization to centrosome(GO:1904781) |
| 2.2 | 4.5 | GO:0000448 | cleavage in ITS2 between 5.8S rRNA and LSU-rRNA of tricistronic rRNA transcript (SSU-rRNA, 5.8S rRNA, LSU-rRNA)(GO:0000448) |
| 2.2 | 6.7 | GO:0006288 | base-excision repair, DNA ligation(GO:0006288) |
| 2.2 | 8.8 | GO:1901624 | negative regulation of lymphocyte chemotaxis(GO:1901624) |
| 2.2 | 13.2 | GO:0017196 | N-terminal peptidyl-methionine acetylation(GO:0017196) |
| 2.1 | 4.3 | GO:0000973 | posttranscriptional tethering of RNA polymerase II gene DNA at nuclear periphery(GO:0000973) |
| 2.1 | 6.4 | GO:0006438 | valyl-tRNA aminoacylation(GO:0006438) |
| 2.1 | 21.4 | GO:0007076 | mitotic chromosome condensation(GO:0007076) |
| 2.1 | 10.6 | GO:2000790 | platelet-derived growth factor receptor-alpha signaling pathway(GO:0035790) regulation of platelet-derived growth factor receptor-alpha signaling pathway(GO:2000583) negative regulation of platelet-derived growth factor receptor-alpha signaling pathway(GO:2000584) regulation of mesenchymal cell proliferation involved in lung development(GO:2000790) negative regulation of mesenchymal cell proliferation involved in lung development(GO:2000791) |
| 2.1 | 12.7 | GO:0098789 | pre-mRNA cleavage required for polyadenylation(GO:0098789) |
| 2.1 | 4.2 | GO:0019230 | proprioception(GO:0019230) |
| 2.1 | 8.3 | GO:0098728 | germ-line stem cell division(GO:0042078) male germ-line stem cell asymmetric division(GO:0048133) germline stem cell asymmetric division(GO:0098728) |
| 2.0 | 10.2 | GO:0014878 | response to electrical stimulus involved in regulation of muscle adaptation(GO:0014878) |
| 2.0 | 6.1 | GO:0006431 | methionyl-tRNA aminoacylation(GO:0006431) |
| 2.0 | 24.4 | GO:0036297 | interstrand cross-link repair(GO:0036297) |
| 2.0 | 14.2 | GO:0034497 | protein localization to pre-autophagosomal structure(GO:0034497) |
| 2.0 | 12.2 | GO:0006290 | pyrimidine dimer repair(GO:0006290) cellular response to UV-C(GO:0071494) |
| 2.0 | 6.1 | GO:0000920 | cell separation after cytokinesis(GO:0000920) |
| 2.0 | 111.5 | GO:0007129 | synapsis(GO:0007129) |
| 2.0 | 10.1 | GO:1903208 | neuron death in response to hydrogen peroxide(GO:0036476) regulation of hydrogen peroxide-induced neuron death(GO:1903207) negative regulation of hydrogen peroxide-induced neuron death(GO:1903208) |
| 2.0 | 10.1 | GO:0042780 | tRNA 3'-end processing(GO:0042780) |
| 2.0 | 35.8 | GO:0043968 | histone H2A acetylation(GO:0043968) |
| 2.0 | 7.8 | GO:0071314 | cellular response to cocaine(GO:0071314) |
| 1.9 | 7.6 | GO:0070537 | histone H2A K63-linked deubiquitination(GO:0070537) |
| 1.9 | 26.6 | GO:0090148 | membrane fission(GO:0090148) |
| 1.9 | 3.8 | GO:0032510 | endosome to lysosome transport via multivesicular body sorting pathway(GO:0032510) |
| 1.9 | 5.6 | GO:0071874 | cellular response to norepinephrine stimulus(GO:0071874) |
| 1.9 | 9.4 | GO:0034626 | fatty acid elongation, polyunsaturated fatty acid(GO:0034626) |
| 1.9 | 5.6 | GO:0097198 | histone H3-K36 trimethylation(GO:0097198) |
| 1.8 | 5.5 | GO:0070601 | centromeric sister chromatid cohesion(GO:0070601) |
| 1.8 | 14.7 | GO:0090261 | positive regulation of inclusion body assembly(GO:0090261) |
| 1.8 | 5.5 | GO:0046833 | positive regulation of RNA export from nucleus(GO:0046833) |
| 1.8 | 5.4 | GO:0032430 | positive regulation of phospholipase A2 activity(GO:0032430) |
| 1.8 | 7.2 | GO:0006269 | DNA replication, synthesis of RNA primer(GO:0006269) |
| 1.8 | 14.2 | GO:0000722 | telomere maintenance via recombination(GO:0000722) |
| 1.8 | 5.3 | GO:0002071 | glandular epithelial cell maturation(GO:0002071) |
| 1.8 | 3.5 | GO:0000019 | regulation of mitotic recombination(GO:0000019) negative regulation of mitotic recombination(GO:0045950) |
| 1.8 | 7.0 | GO:0006104 | succinyl-CoA metabolic process(GO:0006104) |
| 1.7 | 5.1 | GO:0003250 | left ventricular cardiac muscle tissue morphogenesis(GO:0003220) cell proliferation involved in heart valve morphogenesis(GO:0003249) regulation of cell proliferation involved in heart valve morphogenesis(GO:0003250) gonad morphogenesis(GO:0035262) nephrogenic mesenchyme morphogenesis(GO:0072134) |
| 1.7 | 8.5 | GO:0046725 | negative regulation by virus of viral protein levels in host cell(GO:0046725) |
| 1.7 | 3.4 | GO:0021508 | floor plate formation(GO:0021508) floor plate morphogenesis(GO:0033505) |
| 1.7 | 6.7 | GO:0035494 | SNARE complex disassembly(GO:0035494) |
| 1.7 | 10.0 | GO:2000622 | regulation of nuclear-transcribed mRNA catabolic process, nonsense-mediated decay(GO:2000622) negative regulation of nuclear-transcribed mRNA catabolic process, nonsense-mediated decay(GO:2000623) |
| 1.7 | 6.6 | GO:0000320 | re-entry into mitotic cell cycle(GO:0000320) |
| 1.7 | 9.9 | GO:0042989 | sequestering of actin monomers(GO:0042989) |
| 1.7 | 6.6 | GO:0003219 | cardiac right ventricle formation(GO:0003219) |
| 1.6 | 8.2 | GO:0060729 | intestinal epithelial structure maintenance(GO:0060729) |
| 1.6 | 6.5 | GO:1903976 | negative regulation of glial cell migration(GO:1903976) |
| 1.6 | 8.1 | GO:2000051 | negative regulation of non-canonical Wnt signaling pathway(GO:2000051) |
| 1.6 | 16.1 | GO:0018095 | protein polyglutamylation(GO:0018095) |
| 1.6 | 11.3 | GO:0036123 | histone H3-K9 dimethylation(GO:0036123) |
| 1.6 | 6.4 | GO:0098886 | modification of dendritic spine(GO:0098886) |
| 1.6 | 6.4 | GO:0060051 | negative regulation of protein glycosylation(GO:0060051) |
| 1.6 | 17.5 | GO:0042699 | follicle-stimulating hormone signaling pathway(GO:0042699) |
| 1.6 | 11.0 | GO:0071787 | endoplasmic reticulum tubular network assembly(GO:0071787) |
| 1.6 | 23.5 | GO:0046855 | inositol phosphate dephosphorylation(GO:0046855) |
| 1.6 | 14.0 | GO:0015791 | polyol transport(GO:0015791) |
| 1.5 | 6.1 | GO:2000825 | positive regulation of androgen receptor activity(GO:2000825) |
| 1.5 | 4.6 | GO:0071934 | thiamine transmembrane transport(GO:0071934) |
| 1.5 | 7.6 | GO:2000327 | positive regulation of ligand-dependent nuclear receptor transcription coactivator activity(GO:2000327) |
| 1.5 | 6.0 | GO:0035470 | positive regulation of vascular wound healing(GO:0035470) response to ultrasound(GO:1990478) |
| 1.5 | 6.0 | GO:0061641 | CENP-A containing nucleosome assembly(GO:0034080) CENP-A containing chromatin organization(GO:0061641) |
| 1.5 | 9.0 | GO:0006268 | DNA unwinding involved in DNA replication(GO:0006268) |
| 1.5 | 7.5 | GO:0070125 | mitochondrial translational elongation(GO:0070125) |
| 1.5 | 6.0 | GO:1902775 | mitochondrial large ribosomal subunit assembly(GO:1902775) |
| 1.5 | 13.4 | GO:0045162 | clustering of voltage-gated sodium channels(GO:0045162) |
| 1.5 | 5.9 | GO:1902174 | positive regulation of keratinocyte apoptotic process(GO:1902174) |
| 1.5 | 5.9 | GO:1902101 | trophectodermal cellular morphogenesis(GO:0001831) positive regulation of mitotic metaphase/anaphase transition(GO:0045842) positive regulation of mitotic sister chromatid separation(GO:1901970) positive regulation of metaphase/anaphase transition of cell cycle(GO:1902101) |
| 1.5 | 7.4 | GO:0071169 | establishment of protein localization to chromatin(GO:0071169) |
| 1.5 | 7.3 | GO:0051596 | methylglyoxal catabolic process to D-lactate via S-lactoyl-glutathione(GO:0019243) methylglyoxal catabolic process(GO:0051596) methylglyoxal catabolic process to lactate(GO:0061727) |
| 1.5 | 8.8 | GO:0034475 | U4 snRNA 3'-end processing(GO:0034475) polyadenylation-dependent snoRNA 3'-end processing(GO:0071051) |
| 1.5 | 7.3 | GO:2000850 | negative regulation of corticosteroid hormone secretion(GO:2000847) negative regulation of glucocorticoid secretion(GO:2000850) |
| 1.4 | 8.6 | GO:0090367 | negative regulation of mRNA modification(GO:0090367) |
| 1.4 | 26.8 | GO:0043457 | regulation of cellular respiration(GO:0043457) |
| 1.4 | 2.8 | GO:0060399 | positive regulation of growth hormone receptor signaling pathway(GO:0060399) |
| 1.4 | 9.7 | GO:0000160 | phosphorelay signal transduction system(GO:0000160) |
| 1.4 | 8.3 | GO:0090598 | male genitalia morphogenesis(GO:0048808) male anatomical structure morphogenesis(GO:0090598) |
| 1.4 | 40.1 | GO:0000184 | nuclear-transcribed mRNA catabolic process, nonsense-mediated decay(GO:0000184) |
| 1.4 | 8.3 | GO:0000056 | ribosomal small subunit export from nucleus(GO:0000056) |
| 1.4 | 1.4 | GO:0044340 | canonical Wnt signaling pathway involved in regulation of cell proliferation(GO:0044340) |
| 1.4 | 23.2 | GO:0016180 | snRNA processing(GO:0016180) |
| 1.4 | 34.1 | GO:0048240 | sperm capacitation(GO:0048240) |
| 1.4 | 4.1 | GO:1900673 | olefin metabolic process(GO:1900673) |
| 1.3 | 8.1 | GO:2000671 | regulation of motor neuron apoptotic process(GO:2000671) |
| 1.3 | 3.9 | GO:0021997 | neural plate axis specification(GO:0021997) |
| 1.3 | 7.8 | GO:0070827 | chromatin maintenance(GO:0070827) |
| 1.3 | 3.9 | GO:0036451 | cap mRNA methylation(GO:0036451) |
| 1.3 | 5.2 | GO:0021775 | smoothened signaling pathway involved in ventral spinal cord interneuron specification(GO:0021775) smoothened signaling pathway involved in spinal cord motor neuron cell fate specification(GO:0021776) |
| 1.3 | 7.6 | GO:0046836 | glycolipid transport(GO:0046836) |
| 1.3 | 10.2 | GO:0007141 | male meiosis I(GO:0007141) |
| 1.3 | 3.8 | GO:0035600 | tRNA methylthiolation(GO:0035600) |
| 1.2 | 6.1 | GO:0071557 | histone H3-K27 demethylation(GO:0071557) |
| 1.2 | 23.0 | GO:0032981 | NADH dehydrogenase complex assembly(GO:0010257) mitochondrial respiratory chain complex I assembly(GO:0032981) mitochondrial respiratory chain complex I biogenesis(GO:0097031) |
| 1.2 | 6.0 | GO:2000015 | regulation of determination of dorsal identity(GO:2000015) |
| 1.2 | 16.9 | GO:1903830 | magnesium ion transmembrane transport(GO:1903830) |
| 1.2 | 6.0 | GO:0006102 | isocitrate metabolic process(GO:0006102) |
| 1.2 | 6.0 | GO:0061743 | motor learning(GO:0061743) |
| 1.2 | 4.7 | GO:0000389 | mRNA 3'-splice site recognition(GO:0000389) |
| 1.2 | 3.5 | GO:0030043 | actin filament fragmentation(GO:0030043) |
| 1.2 | 3.5 | GO:0010725 | regulation of primitive erythrocyte differentiation(GO:0010725) |
| 1.2 | 5.8 | GO:0034553 | respiratory chain complex II assembly(GO:0034552) mitochondrial respiratory chain complex II assembly(GO:0034553) mitochondrial respiratory chain complex II biogenesis(GO:0097032) |
| 1.2 | 5.8 | GO:0006432 | phenylalanyl-tRNA aminoacylation(GO:0006432) |
| 1.2 | 4.6 | GO:0098501 | polynucleotide dephosphorylation(GO:0098501) |
| 1.2 | 17.3 | GO:0031167 | rRNA methylation(GO:0031167) |
| 1.2 | 39.2 | GO:0007339 | binding of sperm to zona pellucida(GO:0007339) |
| 1.1 | 13.8 | GO:1990403 | embryonic brain development(GO:1990403) |
| 1.1 | 3.4 | GO:2000298 | regulation of Rho-dependent protein serine/threonine kinase activity(GO:2000298) |
| 1.1 | 11.3 | GO:0006337 | nucleosome disassembly(GO:0006337) |
| 1.1 | 4.4 | GO:0044211 | CTP salvage(GO:0044211) |
| 1.1 | 7.8 | GO:0035469 | determination of pancreatic left/right asymmetry(GO:0035469) |
| 1.1 | 4.4 | GO:1901079 | positive regulation of relaxation of muscle(GO:1901079) |
| 1.1 | 4.4 | GO:0034441 | plasma lipoprotein particle oxidation(GO:0034441) |
| 1.1 | 9.9 | GO:0033601 | positive regulation of mammary gland epithelial cell proliferation(GO:0033601) |
| 1.1 | 6.6 | GO:0006398 | mRNA 3'-end processing by stem-loop binding and cleavage(GO:0006398) |
| 1.1 | 8.6 | GO:2000676 | positive regulation of type B pancreatic cell apoptotic process(GO:2000676) |
| 1.1 | 7.5 | GO:0000012 | single strand break repair(GO:0000012) |
| 1.1 | 3.2 | GO:1903630 | regulation of aminoacyl-tRNA ligase activity(GO:1903630) |
| 1.1 | 14.9 | GO:0001833 | inner cell mass cell proliferation(GO:0001833) |
| 1.1 | 3.2 | GO:1901143 | insulin catabolic process(GO:1901143) |
| 1.0 | 10.3 | GO:0034244 | negative regulation of transcription elongation from RNA polymerase II promoter(GO:0034244) |
| 1.0 | 10.2 | GO:0070317 | negative regulation of G0 to G1 transition(GO:0070317) |
| 1.0 | 3.1 | GO:1902037 | negative regulation of hematopoietic stem cell differentiation(GO:1902037) |
| 1.0 | 4.1 | GO:0043928 | exonucleolytic nuclear-transcribed mRNA catabolic process involved in deadenylation-dependent decay(GO:0043928) |
| 1.0 | 3.1 | GO:1990869 | apoptotic process involved in outflow tract morphogenesis(GO:0003275) regulation of apoptotic process involved in outflow tract morphogenesis(GO:1902256) response to chemokine(GO:1990868) cellular response to chemokine(GO:1990869) |
| 1.0 | 3.1 | GO:2000845 | positive regulation of testosterone secretion(GO:2000845) |
| 1.0 | 2.0 | GO:0036446 | myofibroblast differentiation(GO:0036446) cardiac fibroblast cell differentiation(GO:0060935) cardiac fibroblast cell development(GO:0060936) epicardium-derived cardiac fibroblast cell differentiation(GO:0060938) epicardium-derived cardiac fibroblast cell development(GO:0060939) regulation of myofibroblast differentiation(GO:1904760) |
| 1.0 | 1.0 | GO:0072131 | kidney mesenchyme morphogenesis(GO:0072131) metanephric mesenchyme morphogenesis(GO:0072133) |
| 1.0 | 9.1 | GO:0006348 | chromatin silencing at telomere(GO:0006348) |
| 1.0 | 3.0 | GO:0090625 | mRNA cleavage involved in gene silencing by siRNA(GO:0090625) |
| 1.0 | 8.0 | GO:0050861 | positive regulation of B cell receptor signaling pathway(GO:0050861) |
| 1.0 | 8.8 | GO:0071318 | cellular response to ATP(GO:0071318) |
| 1.0 | 2.9 | GO:0061101 | neuroendocrine cell differentiation(GO:0061101) |
| 1.0 | 9.6 | GO:0030497 | fatty acid elongation(GO:0030497) |
| 1.0 | 4.8 | GO:0002457 | T cell antigen processing and presentation(GO:0002457) |
| 1.0 | 2.9 | GO:0006433 | prolyl-tRNA aminoacylation(GO:0006433) |
| 1.0 | 8.6 | GO:0090435 | protein localization to nuclear envelope(GO:0090435) |
| 1.0 | 2.9 | GO:0034418 | urate biosynthetic process(GO:0034418) |
| 0.9 | 2.8 | GO:2000111 | positive regulation of macrophage apoptotic process(GO:2000111) |
| 0.9 | 2.8 | GO:0048696 | regulation of collateral sprouting in absence of injury(GO:0048696) |
| 0.9 | 1.9 | GO:0007008 | outer mitochondrial membrane organization(GO:0007008) |
| 0.9 | 2.8 | GO:0071929 | alpha-tubulin acetylation(GO:0071929) |
| 0.9 | 2.8 | GO:1902544 | regulation of DNA N-glycosylase activity(GO:1902544) |
| 0.9 | 2.8 | GO:1903265 | positive regulation of tumor necrosis factor-mediated signaling pathway(GO:1903265) |
| 0.9 | 8.2 | GO:0010603 | regulation of cytoplasmic mRNA processing body assembly(GO:0010603) |
| 0.9 | 2.7 | GO:0006045 | N-acetylglucosamine biosynthetic process(GO:0006045) N-acetylneuraminate biosynthetic process(GO:0046380) |
| 0.9 | 4.6 | GO:0061428 | embryonic process involved in female pregnancy(GO:0060136) embryonic heart tube left/right pattern formation(GO:0060971) negative regulation of transcription from RNA polymerase II promoter in response to hypoxia(GO:0061428) |
| 0.9 | 2.7 | GO:0045448 | regulation of mitotic cell cycle, embryonic(GO:0009794) mitotic cell cycle, embryonic(GO:0045448) |
| 0.9 | 9.0 | GO:0016926 | protein desumoylation(GO:0016926) |
| 0.9 | 2.6 | GO:0017198 | N-terminal peptidyl-serine acetylation(GO:0017198) N-terminal peptidyl-glutamic acid acetylation(GO:0018002) peptidyl-serine acetylation(GO:0030920) |
| 0.9 | 2.6 | GO:1902268 | negative regulation of polyamine transmembrane transport(GO:1902268) |
| 0.9 | 5.3 | GO:0030579 | ubiquitin-dependent SMAD protein catabolic process(GO:0030579) |
| 0.9 | 3.5 | GO:0035616 | histone H2B conserved C-terminal lysine deubiquitination(GO:0035616) |
| 0.9 | 6.1 | GO:0098967 | exocytic insertion of neurotransmitter receptor to plasma membrane(GO:0098881) exocytic insertion of neurotransmitter receptor to postsynaptic membrane(GO:0098967) |
| 0.9 | 5.2 | GO:0033387 | putrescine biosynthetic process from ornithine(GO:0033387) |
| 0.9 | 15.5 | GO:0001731 | formation of translation preinitiation complex(GO:0001731) |
| 0.9 | 18.0 | GO:0006270 | DNA replication initiation(GO:0006270) |
| 0.9 | 3.4 | GO:2000124 | regulation of endocannabinoid signaling pathway(GO:2000124) |
| 0.8 | 2.5 | GO:1903373 | positive regulation of endoplasmic reticulum tubular network organization(GO:1903373) |
| 0.8 | 3.4 | GO:0051204 | protein insertion into mitochondrial membrane(GO:0051204) |
| 0.8 | 5.9 | GO:0097428 | protein maturation by iron-sulfur cluster transfer(GO:0097428) |
| 0.8 | 2.5 | GO:0010825 | positive regulation of centrosome duplication(GO:0010825) |
| 0.8 | 10.9 | GO:0034501 | protein localization to kinetochore(GO:0034501) |
| 0.8 | 1.7 | GO:0032289 | central nervous system myelin formation(GO:0032289) |
| 0.8 | 16.6 | GO:0032515 | negative regulation of phosphoprotein phosphatase activity(GO:0032515) |
| 0.8 | 9.1 | GO:0000083 | regulation of transcription involved in G1/S transition of mitotic cell cycle(GO:0000083) |
| 0.8 | 9.1 | GO:0006013 | mannose metabolic process(GO:0006013) |
| 0.8 | 2.5 | GO:0045065 | cytotoxic T cell differentiation(GO:0045065) |
| 0.8 | 9.9 | GO:0040015 | negative regulation of multicellular organism growth(GO:0040015) |
| 0.8 | 4.1 | GO:0042796 | snRNA transcription from RNA polymerase III promoter(GO:0042796) |
| 0.8 | 4.0 | GO:0035617 | stress granule disassembly(GO:0035617) |
| 0.8 | 10.4 | GO:0010566 | regulation of ketone biosynthetic process(GO:0010566) |
| 0.8 | 5.6 | GO:0035879 | plasma membrane lactate transport(GO:0035879) |
| 0.8 | 7.9 | GO:0001554 | luteolysis(GO:0001554) |
| 0.8 | 2.4 | GO:0016240 | autophagosome docking(GO:0016240) |
| 0.8 | 3.2 | GO:0006498 | N-terminal protein lipidation(GO:0006498) |
| 0.8 | 1.6 | GO:0051081 | membrane disassembly(GO:0030397) nuclear envelope disassembly(GO:0051081) |
| 0.8 | 3.2 | GO:0061484 | hematopoietic stem cell homeostasis(GO:0061484) |
| 0.8 | 2.4 | GO:0032377 | regulation of intracellular lipid transport(GO:0032377) regulation of intracellular sterol transport(GO:0032380) regulation of intracellular cholesterol transport(GO:0032383) |
| 0.8 | 5.5 | GO:0048227 | plasma membrane to endosome transport(GO:0048227) |
| 0.8 | 14.1 | GO:0099517 | anterograde synaptic vesicle transport(GO:0048490) synaptic vesicle cytoskeletal transport(GO:0099514) synaptic vesicle transport along microtubule(GO:0099517) |
| 0.8 | 13.9 | GO:0032968 | positive regulation of transcription elongation from RNA polymerase II promoter(GO:0032968) |
| 0.8 | 3.8 | GO:0032364 | oxygen homeostasis(GO:0032364) |
| 0.8 | 5.3 | GO:0006384 | transcription initiation from RNA polymerase III promoter(GO:0006384) |
| 0.8 | 9.9 | GO:0070986 | left/right axis specification(GO:0070986) |
| 0.8 | 9.1 | GO:0034975 | protein folding in endoplasmic reticulum(GO:0034975) |
| 0.8 | 5.3 | GO:0051388 | positive regulation of neurotrophin TRK receptor signaling pathway(GO:0051388) |
| 0.8 | 6.1 | GO:0006122 | mitochondrial electron transport, ubiquinol to cytochrome c(GO:0006122) |
| 0.8 | 23.3 | GO:0033687 | osteoblast proliferation(GO:0033687) |
| 0.7 | 3.7 | GO:0090168 | Golgi reassembly(GO:0090168) |
| 0.7 | 3.0 | GO:0043951 | negative regulation of cAMP-mediated signaling(GO:0043951) |
| 0.7 | 3.7 | GO:0021960 | anterior commissure morphogenesis(GO:0021960) |
| 0.7 | 3.0 | GO:0000459 | exonucleolytic trimming involved in rRNA processing(GO:0000459) exonucleolytic trimming to generate mature 3'-end of 5.8S rRNA from tricistronic rRNA transcript (SSU-rRNA, 5.8S rRNA, LSU-rRNA)(GO:0000467) |
| 0.7 | 1.5 | GO:0045653 | negative regulation of megakaryocyte differentiation(GO:0045653) |
| 0.7 | 4.4 | GO:0021999 | neural plate anterior/posterior regionalization(GO:0021999) midbrain-hindbrain boundary development(GO:0030917) |
| 0.7 | 3.0 | GO:1903608 | protein localization to cytoplasmic stress granule(GO:1903608) |
| 0.7 | 4.4 | GO:0046125 | pyrimidine deoxyribonucleoside metabolic process(GO:0046125) |
| 0.7 | 6.6 | GO:2000303 | regulation of ceramide biosynthetic process(GO:2000303) |
| 0.7 | 2.2 | GO:0045900 | negative regulation of translational elongation(GO:0045900) |
| 0.7 | 2.9 | GO:1902031 | regulation of NADP metabolic process(GO:1902031) |
| 0.7 | 1.4 | GO:0071459 | protein localization to chromosome, centromeric region(GO:0071459) |
| 0.7 | 5.7 | GO:0006105 | succinate metabolic process(GO:0006105) |
| 0.7 | 8.9 | GO:0032780 | negative regulation of ATPase activity(GO:0032780) |
| 0.7 | 9.6 | GO:0071420 | cellular response to histamine(GO:0071420) |
| 0.7 | 2.0 | GO:0051684 | maintenance of Golgi location(GO:0051684) |
| 0.7 | 10.0 | GO:0035970 | peptidyl-threonine dephosphorylation(GO:0035970) |
| 0.7 | 6.7 | GO:0034201 | response to oleic acid(GO:0034201) |
| 0.7 | 2.0 | GO:0019417 | sulfur oxidation(GO:0019417) |
| 0.7 | 4.6 | GO:2000210 | positive regulation of anoikis(GO:2000210) |
| 0.7 | 2.0 | GO:0009301 | snRNA transcription(GO:0009301) |
| 0.6 | 1.9 | GO:0006421 | asparaginyl-tRNA aminoacylation(GO:0006421) |
| 0.6 | 1.9 | GO:1901994 | negative regulation of meiotic cell cycle phase transition(GO:1901994) |
| 0.6 | 3.2 | GO:0097112 | gamma-aminobutyric acid receptor clustering(GO:0097112) |
| 0.6 | 3.9 | GO:0072321 | chaperone-mediated protein transport(GO:0072321) |
| 0.6 | 3.2 | GO:0002175 | protein localization to paranode region of axon(GO:0002175) |
| 0.6 | 3.8 | GO:0046602 | regulation of mitotic centrosome separation(GO:0046602) |
| 0.6 | 1.9 | GO:0040031 | snRNA modification(GO:0040031) |
| 0.6 | 3.1 | GO:0016557 | peroxisome membrane biogenesis(GO:0016557) |
| 0.6 | 1.9 | GO:0038163 | thrombopoietin-mediated signaling pathway(GO:0038163) |
| 0.6 | 2.5 | GO:1904668 | positive regulation of ubiquitin protein ligase activity(GO:1904668) |
| 0.6 | 1.8 | GO:1900113 | negative regulation of histone H3-K9 trimethylation(GO:1900113) |
| 0.6 | 6.8 | GO:0006123 | mitochondrial electron transport, cytochrome c to oxygen(GO:0006123) |
| 0.6 | 22.6 | GO:0010501 | RNA secondary structure unwinding(GO:0010501) |
| 0.6 | 9.8 | GO:0016339 | calcium-dependent cell-cell adhesion via plasma membrane cell adhesion molecules(GO:0016339) |
| 0.6 | 2.4 | GO:1901843 | positive regulation of high voltage-gated calcium channel activity(GO:1901843) |
| 0.6 | 12.1 | GO:0033260 | nuclear DNA replication(GO:0033260) |
| 0.6 | 36.5 | GO:0016525 | negative regulation of angiogenesis(GO:0016525) |
| 0.6 | 19.3 | GO:0000387 | spliceosomal snRNP assembly(GO:0000387) |
| 0.6 | 17.5 | GO:0015812 | gamma-aminobutyric acid transport(GO:0015812) |
| 0.6 | 3.5 | GO:0000480 | endonucleolytic cleavage in 5'-ETS of tricistronic rRNA transcript (SSU-rRNA, 5.8S rRNA, LSU-rRNA)(GO:0000480) |
| 0.6 | 6.9 | GO:0046784 | viral mRNA export from host cell nucleus(GO:0046784) |
| 0.6 | 1.7 | GO:1903070 | negative regulation of ER-associated ubiquitin-dependent protein catabolic process(GO:1903070) |
| 0.6 | 3.4 | GO:1901030 | positive regulation of mitochondrial outer membrane permeabilization involved in apoptotic signaling pathway(GO:1901030) |
| 0.6 | 24.8 | GO:0010596 | negative regulation of endothelial cell migration(GO:0010596) |
| 0.6 | 3.3 | GO:0080009 | mRNA methylation(GO:0080009) |
| 0.5 | 3.8 | GO:0070933 | histone H4 deacetylation(GO:0070933) |
| 0.5 | 5.4 | GO:0008089 | anterograde axonal transport(GO:0008089) |
| 0.5 | 7.5 | GO:0033235 | positive regulation of protein sumoylation(GO:0033235) |
| 0.5 | 7.5 | GO:0045086 | positive regulation of interleukin-2 biosynthetic process(GO:0045086) |
| 0.5 | 3.2 | GO:0015074 | DNA integration(GO:0015074) |
| 0.5 | 2.7 | GO:0048096 | chromatin-mediated maintenance of transcription(GO:0048096) |
| 0.5 | 2.1 | GO:2000259 | positive regulation of complement activation(GO:0045917) positive regulation of protein activation cascade(GO:2000259) |
| 0.5 | 4.2 | GO:0051151 | negative regulation of smooth muscle cell differentiation(GO:0051151) |
| 0.5 | 10.4 | GO:0045116 | protein neddylation(GO:0045116) |
| 0.5 | 7.7 | GO:0002710 | negative regulation of T cell mediated immunity(GO:0002710) |
| 0.5 | 2.0 | GO:0090649 | response to oxygen-glucose deprivation(GO:0090649) cellular response to oxygen-glucose deprivation(GO:0090650) |
| 0.5 | 3.5 | GO:0070544 | histone H3-K36 demethylation(GO:0070544) |
| 0.5 | 6.5 | GO:0061157 | mRNA destabilization(GO:0061157) |
| 0.5 | 10.9 | GO:0097503 | sialylation(GO:0097503) |
| 0.5 | 1.5 | GO:1990108 | protein linear deubiquitination(GO:1990108) |
| 0.5 | 17.5 | GO:0000462 | maturation of SSU-rRNA from tricistronic rRNA transcript (SSU-rRNA, 5.8S rRNA, LSU-rRNA)(GO:0000462) |
| 0.5 | 89.7 | GO:0007059 | chromosome segregation(GO:0007059) |
| 0.5 | 7.3 | GO:0051823 | regulation of synapse structural plasticity(GO:0051823) |
| 0.5 | 5.7 | GO:0006614 | SRP-dependent cotranslational protein targeting to membrane(GO:0006614) |
| 0.5 | 0.9 | GO:0000350 | generation of catalytic spliceosome for second transesterification step(GO:0000350) spliceosomal conformational changes to generate catalytic conformation(GO:0000393) |
| 0.5 | 20.4 | GO:0006342 | chromatin silencing(GO:0006342) |
| 0.5 | 1.8 | GO:0048936 | peripheral nervous system neuron axonogenesis(GO:0048936) |
| 0.5 | 5.0 | GO:0071514 | genetic imprinting(GO:0071514) |
| 0.5 | 3.6 | GO:0036376 | sodium ion export from cell(GO:0036376) |
| 0.4 | 1.8 | GO:0032049 | cardiolipin biosynthetic process(GO:0032049) |
| 0.4 | 1.3 | GO:0023041 | neuronal signal transduction(GO:0023041) |
| 0.4 | 2.6 | GO:0071763 | nuclear membrane organization(GO:0071763) |
| 0.4 | 5.3 | GO:0006241 | CTP biosynthetic process(GO:0006241) CTP metabolic process(GO:0046036) |
| 0.4 | 3.9 | GO:1990416 | cellular response to brain-derived neurotrophic factor stimulus(GO:1990416) |
| 0.4 | 6.0 | GO:0051967 | negative regulation of synaptic transmission, glutamatergic(GO:0051967) |
| 0.4 | 3.0 | GO:0016446 | somatic diversification of immune receptors via somatic mutation(GO:0002566) somatic hypermutation of immunoglobulin genes(GO:0016446) |
| 0.4 | 2.1 | GO:0000469 | cleavage involved in rRNA processing(GO:0000469) |
| 0.4 | 6.3 | GO:0043982 | histone H4-K5 acetylation(GO:0043981) histone H4-K8 acetylation(GO:0043982) |
| 0.4 | 2.5 | GO:0001514 | selenocysteine incorporation(GO:0001514) translational readthrough(GO:0006451) |
| 0.4 | 2.1 | GO:0043562 | cellular response to nitrogen starvation(GO:0006995) cellular response to nitrogen levels(GO:0043562) |
| 0.4 | 2.5 | GO:0090070 | positive regulation of ribosome biogenesis(GO:0090070) positive regulation of rRNA processing(GO:2000234) |
| 0.4 | 17.6 | GO:0001662 | behavioral fear response(GO:0001662) |
| 0.4 | 2.9 | GO:0007097 | nuclear migration(GO:0007097) |
| 0.4 | 4.5 | GO:0007196 | adenylate cyclase-inhibiting G-protein coupled glutamate receptor signaling pathway(GO:0007196) |
| 0.4 | 2.0 | GO:0031497 | chromatin assembly(GO:0031497) |
| 0.4 | 7.6 | GO:0007398 | ectoderm development(GO:0007398) |
| 0.4 | 14.4 | GO:0019730 | antimicrobial humoral response(GO:0019730) |
| 0.4 | 6.3 | GO:0044030 | regulation of DNA methylation(GO:0044030) |
| 0.4 | 2.0 | GO:0009137 | purine nucleoside diphosphate catabolic process(GO:0009137) purine ribonucleoside diphosphate catabolic process(GO:0009181) |
| 0.4 | 0.8 | GO:0010994 | regulation of ubiquitin homeostasis(GO:0010993) free ubiquitin chain polymerization(GO:0010994) |
| 0.4 | 5.1 | GO:0006303 | double-strand break repair via nonhomologous end joining(GO:0006303) |
| 0.4 | 14.8 | GO:0046854 | phosphatidylinositol phosphorylation(GO:0046854) |
| 0.4 | 9.2 | GO:0031146 | SCF-dependent proteasomal ubiquitin-dependent protein catabolic process(GO:0031146) |
| 0.4 | 5.7 | GO:0034453 | microtubule anchoring(GO:0034453) |
| 0.4 | 12.1 | GO:0061640 | cytoskeleton-dependent cytokinesis(GO:0061640) |
| 0.4 | 9.0 | GO:0031062 | positive regulation of histone methylation(GO:0031062) |
| 0.4 | 7.1 | GO:0046597 | negative regulation of viral entry into host cell(GO:0046597) |
| 0.4 | 6.0 | GO:0007127 | meiosis I(GO:0007127) |
| 0.4 | 30.8 | GO:0006334 | nucleosome assembly(GO:0006334) |
| 0.4 | 4.0 | GO:0046827 | positive regulation of protein export from nucleus(GO:0046827) |
| 0.4 | 5.5 | GO:0032793 | positive regulation of CREB transcription factor activity(GO:0032793) |
| 0.4 | 1.1 | GO:0006574 | valine catabolic process(GO:0006574) |
| 0.4 | 2.6 | GO:0097084 | vascular smooth muscle cell development(GO:0097084) |
| 0.4 | 0.7 | GO:0042776 | mitochondrial ATP synthesis coupled proton transport(GO:0042776) |
| 0.4 | 0.4 | GO:0045632 | negative regulation of mechanoreceptor differentiation(GO:0045632) negative regulation of pro-B cell differentiation(GO:2000974) negative regulation of inner ear receptor cell differentiation(GO:2000981) |
| 0.4 | 15.2 | GO:0006119 | oxidative phosphorylation(GO:0006119) |
| 0.3 | 2.1 | GO:0000154 | rRNA modification(GO:0000154) |
| 0.3 | 6.2 | GO:0046856 | phosphatidylinositol dephosphorylation(GO:0046856) |
| 0.3 | 61.2 | GO:0000398 | RNA splicing, via transesterification reactions(GO:0000375) RNA splicing, via transesterification reactions with bulged adenosine as nucleophile(GO:0000377) mRNA splicing, via spliceosome(GO:0000398) |
| 0.3 | 1.4 | GO:0071712 | ER-associated misfolded protein catabolic process(GO:0071712) |
| 0.3 | 5.5 | GO:0044381 | glucose import in response to insulin stimulus(GO:0044381) |
| 0.3 | 4.1 | GO:0030490 | maturation of SSU-rRNA(GO:0030490) |
| 0.3 | 0.7 | GO:1904976 | cellular response to bleomycin(GO:1904976) |
| 0.3 | 33.4 | GO:0006479 | protein methylation(GO:0006479) protein alkylation(GO:0008213) |
| 0.3 | 4.4 | GO:0072643 | interferon-gamma secretion(GO:0072643) |
| 0.3 | 4.0 | GO:0021785 | branchiomotor neuron axon guidance(GO:0021785) |
| 0.3 | 30.4 | GO:0016573 | histone acetylation(GO:0016573) |
| 0.3 | 0.7 | GO:1903969 | regulation of interleukin-6-mediated signaling pathway(GO:0070103) regulation of macrophage colony-stimulating factor signaling pathway(GO:1902226) regulation of response to macrophage colony-stimulating factor(GO:1903969) regulation of cellular response to macrophage colony-stimulating factor stimulus(GO:1903972) |
| 0.3 | 4.2 | GO:0000460 | maturation of 5.8S rRNA(GO:0000460) |
| 0.3 | 8.7 | GO:0070306 | lens fiber cell differentiation(GO:0070306) |
| 0.3 | 1.6 | GO:0010961 | cellular magnesium ion homeostasis(GO:0010961) |
| 0.3 | 3.5 | GO:0032211 | negative regulation of telomere maintenance via telomerase(GO:0032211) |
| 0.3 | 1.3 | GO:0019516 | lactate oxidation(GO:0019516) |
| 0.3 | 0.6 | GO:0033615 | mitochondrial proton-transporting ATP synthase complex assembly(GO:0033615) |
| 0.3 | 5.6 | GO:2000772 | regulation of cellular senescence(GO:2000772) |
| 0.3 | 4.2 | GO:1900078 | positive regulation of cellular response to insulin stimulus(GO:1900078) |
| 0.3 | 3.3 | GO:0060137 | maternal process involved in parturition(GO:0060137) |
| 0.3 | 1.2 | GO:1990928 | response to amino acid starvation(GO:1990928) |
| 0.3 | 1.2 | GO:0006428 | isoleucyl-tRNA aminoacylation(GO:0006428) |
| 0.3 | 1.2 | GO:0034063 | stress granule assembly(GO:0034063) |
| 0.3 | 4.3 | GO:0009226 | nucleotide-sugar biosynthetic process(GO:0009226) |
| 0.3 | 2.3 | GO:0043587 | tongue morphogenesis(GO:0043587) |
| 0.3 | 0.6 | GO:1901798 | positive regulation of signal transduction by p53 class mediator(GO:1901798) |
| 0.3 | 1.7 | GO:0016255 | attachment of GPI anchor to protein(GO:0016255) |
| 0.3 | 6.7 | GO:0009214 | cyclic nucleotide catabolic process(GO:0009214) |
| 0.3 | 3.0 | GO:0016973 | poly(A)+ mRNA export from nucleus(GO:0016973) |
| 0.3 | 2.8 | GO:2000010 | positive regulation of protein localization to cell surface(GO:2000010) |
| 0.3 | 4.3 | GO:0060216 | definitive hemopoiesis(GO:0060216) |
| 0.3 | 1.4 | GO:0097338 | response to clozapine(GO:0097338) |
| 0.3 | 4.0 | GO:2001256 | regulation of store-operated calcium entry(GO:2001256) |
| 0.3 | 6.4 | GO:0038202 | TORC1 signaling(GO:0038202) |
| 0.3 | 9.5 | GO:2001244 | positive regulation of intrinsic apoptotic signaling pathway(GO:2001244) |
| 0.3 | 27.4 | GO:1902600 | hydrogen ion transmembrane transport(GO:1902600) |
| 0.3 | 1.8 | GO:0051013 | microtubule severing(GO:0051013) |
| 0.3 | 3.4 | GO:0070979 | protein K11-linked ubiquitination(GO:0070979) |
| 0.3 | 2.6 | GO:0097264 | self proteolysis(GO:0097264) |
| 0.3 | 2.8 | GO:0006020 | inositol metabolic process(GO:0006020) |
| 0.3 | 12.9 | GO:0006367 | transcription initiation from RNA polymerase II promoter(GO:0006367) |
| 0.2 | 2.0 | GO:0032957 | inositol trisphosphate metabolic process(GO:0032957) |
| 0.2 | 0.2 | GO:1903595 | positive regulation of histamine secretion by mast cell(GO:1903595) |
| 0.2 | 6.4 | GO:0018345 | protein palmitoylation(GO:0018345) |
| 0.2 | 2.7 | GO:0035090 | maintenance of apical/basal cell polarity(GO:0035090) |
| 0.2 | 1.9 | GO:0032740 | positive regulation of interleukin-17 production(GO:0032740) |
| 0.2 | 9.6 | GO:0035176 | social behavior(GO:0035176) intraspecies interaction between organisms(GO:0051703) |
| 0.2 | 7.2 | GO:0097502 | mannosylation(GO:0097502) |
| 0.2 | 3.5 | GO:0048172 | regulation of short-term neuronal synaptic plasticity(GO:0048172) |
| 0.2 | 8.5 | GO:0016575 | histone deacetylation(GO:0016575) |
| 0.2 | 1.4 | GO:2000819 | regulation of nucleotide-excision repair(GO:2000819) |
| 0.2 | 2.4 | GO:0046839 | phospholipid dephosphorylation(GO:0046839) |
| 0.2 | 2.4 | GO:2000060 | positive regulation of protein ubiquitination involved in ubiquitin-dependent protein catabolic process(GO:2000060) |
| 0.2 | 15.9 | GO:0001578 | microtubule bundle formation(GO:0001578) |
| 0.2 | 0.4 | GO:0060268 | negative regulation of respiratory burst involved in inflammatory response(GO:0060266) negative regulation of respiratory burst(GO:0060268) |
| 0.2 | 0.6 | GO:0090312 | positive regulation of protein deacetylation(GO:0090312) |
| 0.2 | 2.9 | GO:0016925 | protein sumoylation(GO:0016925) |
| 0.2 | 1.4 | GO:0042118 | endothelial cell activation(GO:0042118) |
| 0.2 | 0.6 | GO:0006474 | N-terminal protein amino acid acetylation(GO:0006474) |
| 0.2 | 6.9 | GO:0051321 | meiotic cell cycle(GO:0051321) |
| 0.2 | 5.9 | GO:0046676 | negative regulation of insulin secretion(GO:0046676) |
| 0.2 | 2.5 | GO:0010592 | positive regulation of lamellipodium assembly(GO:0010592) |
| 0.2 | 2.5 | GO:0089711 | L-glutamate transmembrane transport(GO:0089711) |
| 0.2 | 5.7 | GO:0070534 | protein K63-linked ubiquitination(GO:0070534) |
| 0.2 | 7.4 | GO:0090102 | cochlea development(GO:0090102) |
| 0.2 | 1.7 | GO:0022615 | protein to membrane docking(GO:0022615) negative regulation of calcium ion-dependent exocytosis(GO:0045955) |
| 0.2 | 10.5 | GO:0032092 | positive regulation of protein binding(GO:0032092) |
| 0.2 | 2.4 | GO:0046834 | lipid phosphorylation(GO:0046834) |
| 0.2 | 0.9 | GO:1903336 | negative regulation of vacuolar transport(GO:1903336) |
| 0.2 | 0.4 | GO:0008078 | mesodermal cell migration(GO:0008078) |
| 0.2 | 0.9 | GO:0009048 | dosage compensation(GO:0007549) dosage compensation by inactivation of X chromosome(GO:0009048) |
| 0.2 | 9.4 | GO:0048663 | neuron fate commitment(GO:0048663) |
| 0.2 | 1.1 | GO:0006528 | asparagine metabolic process(GO:0006528) |
| 0.2 | 3.0 | GO:1903779 | regulation of cardiac conduction(GO:1903779) |
| 0.2 | 6.0 | GO:0008333 | endosome to lysosome transport(GO:0008333) |
| 0.2 | 0.7 | GO:0070127 | tRNA aminoacylation for mitochondrial protein translation(GO:0070127) |
| 0.2 | 0.9 | GO:0006388 | tRNA splicing, via endonucleolytic cleavage and ligation(GO:0006388) |
| 0.2 | 1.0 | GO:0008090 | retrograde axonal transport(GO:0008090) |
| 0.2 | 2.7 | GO:0010867 | positive regulation of triglyceride biosynthetic process(GO:0010867) |
| 0.2 | 2.8 | GO:0046457 | prostaglandin biosynthetic process(GO:0001516) prostanoid biosynthetic process(GO:0046457) |
| 0.2 | 0.6 | GO:0001842 | neural fold formation(GO:0001842) |
| 0.2 | 2.4 | GO:0070936 | protein K48-linked ubiquitination(GO:0070936) |
| 0.1 | 1.0 | GO:0060294 | cilium movement involved in cell motility(GO:0060294) |
| 0.1 | 0.4 | GO:0045084 | positive regulation of interleukin-12 biosynthetic process(GO:0045084) |
| 0.1 | 1.5 | GO:0007220 | Notch receptor processing(GO:0007220) |
| 0.1 | 4.9 | GO:0090502 | RNA phosphodiester bond hydrolysis, endonucleolytic(GO:0090502) |
| 0.1 | 0.1 | GO:0019673 | GDP-mannose metabolic process(GO:0019673) |
| 0.1 | 6.1 | GO:2001022 | positive regulation of response to DNA damage stimulus(GO:2001022) |
| 0.1 | 2.0 | GO:1904406 | negative regulation of nitric oxide biosynthetic process(GO:0045019) negative regulation of nitric oxide metabolic process(GO:1904406) |
| 0.1 | 1.1 | GO:0006108 | malate metabolic process(GO:0006108) |
| 0.1 | 6.9 | GO:0071300 | cellular response to retinoic acid(GO:0071300) |
| 0.1 | 4.2 | GO:0015992 | proton transport(GO:0015992) |
| 0.1 | 2.6 | GO:0051560 | mitochondrial calcium ion homeostasis(GO:0051560) |
| 0.1 | 0.4 | GO:0021812 | neuronal-glial interaction involved in cerebral cortex radial glia guided migration(GO:0021812) |
| 0.1 | 0.7 | GO:0030638 | polyketide metabolic process(GO:0030638) daunorubicin metabolic process(GO:0044597) doxorubicin metabolic process(GO:0044598) |
| 0.1 | 2.7 | GO:2000171 | negative regulation of dendrite development(GO:2000171) |
| 0.1 | 0.3 | GO:0051088 | PMA-inducible membrane protein ectodomain proteolysis(GO:0051088) |
| 0.1 | 3.0 | GO:0042149 | cellular response to glucose starvation(GO:0042149) |
| 0.1 | 3.5 | GO:0051290 | protein heterotetramerization(GO:0051290) |
| 0.1 | 0.2 | GO:1990785 | response to water-immersion restraint stress(GO:1990785) |
| 0.1 | 10.1 | GO:0016579 | protein deubiquitination(GO:0016579) |
| 0.1 | 0.3 | GO:0036092 | phosphatidylinositol-3-phosphate biosynthetic process(GO:0036092) |
| 0.1 | 7.5 | GO:0007051 | spindle organization(GO:0007051) |
| 0.1 | 0.8 | GO:0090385 | phagosome-lysosome fusion(GO:0090385) |
| 0.1 | 0.8 | GO:0008616 | queuosine biosynthetic process(GO:0008616) queuosine metabolic process(GO:0046116) |
| 0.1 | 9.3 | GO:0007188 | adenylate cyclase-modulating G-protein coupled receptor signaling pathway(GO:0007188) |
| 0.1 | 0.2 | GO:0097091 | synaptic vesicle clustering(GO:0097091) |
| 0.1 | 2.5 | GO:0009651 | response to salt stress(GO:0009651) |
| 0.1 | 8.9 | GO:0042787 | protein ubiquitination involved in ubiquitin-dependent protein catabolic process(GO:0042787) |
| 0.1 | 1.8 | GO:0006471 | protein ADP-ribosylation(GO:0006471) |
| 0.1 | 0.3 | GO:0070634 | mammary duct terminal end bud growth(GO:0060763) transepithelial ammonium transport(GO:0070634) |
| 0.1 | 1.0 | GO:0033617 | mitochondrial respiratory chain complex IV assembly(GO:0033617) mitochondrial respiratory chain complex IV biogenesis(GO:0097034) |
| 0.1 | 3.0 | GO:1903959 | regulation of anion transmembrane transport(GO:1903959) |
| 0.1 | 8.0 | GO:0007218 | neuropeptide signaling pathway(GO:0007218) |
| 0.1 | 0.8 | GO:0007289 | spermatid nucleus differentiation(GO:0007289) |
| 0.1 | 14.3 | GO:0071804 | cellular potassium ion transport(GO:0071804) potassium ion transmembrane transport(GO:0071805) |
| 0.1 | 0.6 | GO:0034982 | mitochondrial protein processing(GO:0034982) |
| 0.1 | 2.1 | GO:0030318 | melanocyte differentiation(GO:0030318) |
| 0.1 | 4.0 | GO:0035914 | skeletal muscle cell differentiation(GO:0035914) |
| 0.1 | 0.4 | GO:0006556 | S-adenosylmethionine biosynthetic process(GO:0006556) |
| 0.1 | 1.3 | GO:0002755 | MyD88-dependent toll-like receptor signaling pathway(GO:0002755) |
| 0.1 | 0.2 | GO:0033578 | protein glycosylation in Golgi(GO:0033578) |
| 0.1 | 1.8 | GO:0048013 | ephrin receptor signaling pathway(GO:0048013) |
| 0.1 | 2.1 | GO:0061512 | protein localization to cilium(GO:0061512) |
| 0.1 | 0.2 | GO:0000105 | histidine biosynthetic process(GO:0000105) |
| 0.1 | 0.6 | GO:0009263 | deoxyribonucleotide biosynthetic process(GO:0009263) |
| 0.1 | 3.2 | GO:0051965 | positive regulation of synapse assembly(GO:0051965) |
| 0.1 | 0.4 | GO:0007021 | tubulin complex assembly(GO:0007021) |
| 0.1 | 0.8 | GO:0042987 | amyloid precursor protein catabolic process(GO:0042987) |
| 0.1 | 0.4 | GO:1902043 | positive regulation of extrinsic apoptotic signaling pathway via death domain receptors(GO:1902043) |
| 0.1 | 2.1 | GO:0006749 | glutathione metabolic process(GO:0006749) |
| 0.0 | 0.1 | GO:0006543 | glutamine catabolic process(GO:0006543) |
| 0.0 | 2.6 | GO:0002028 | regulation of sodium ion transport(GO:0002028) |
| 0.0 | 3.1 | GO:0051291 | protein heterooligomerization(GO:0051291) |
| 0.0 | 1.8 | GO:0007093 | mitotic cell cycle checkpoint(GO:0007093) |
| 0.0 | 0.1 | GO:0035372 | protein localization to microtubule(GO:0035372) |
| 0.0 | 0.6 | GO:0007520 | myoblast fusion(GO:0007520) |
| 0.0 | 2.8 | GO:0030308 | negative regulation of cell growth(GO:0030308) |
| 0.0 | 0.6 | GO:2000369 | regulation of clathrin-mediated endocytosis(GO:2000369) |
| 0.0 | 2.6 | GO:0035304 | regulation of protein dephosphorylation(GO:0035304) |
| 0.0 | 0.1 | GO:0016094 | polyprenol biosynthetic process(GO:0016094) |
| 0.0 | 1.8 | GO:0032259 | methylation(GO:0032259) |
| 0.0 | 0.4 | GO:0010831 | positive regulation of myotube differentiation(GO:0010831) |
| 0.0 | 0.3 | GO:1903963 | arachidonic acid secretion(GO:0050482) arachidonate transport(GO:1903963) |
| 0.0 | 1.3 | GO:0010950 | positive regulation of endopeptidase activity(GO:0010950) |
| 0.0 | 0.2 | GO:0033147 | negative regulation of intracellular estrogen receptor signaling pathway(GO:0033147) |
| 0.0 | 0.1 | GO:0048280 | vesicle fusion with Golgi apparatus(GO:0048280) |
| 0.0 | 0.2 | GO:0001702 | gastrulation with mouth forming second(GO:0001702) |
| 0.0 | 0.7 | GO:0045576 | mast cell activation(GO:0045576) |
| 0.0 | 0.1 | GO:0051533 | positive regulation of NFAT protein import into nucleus(GO:0051533) |
| 0.0 | 0.1 | GO:0006515 | misfolded or incompletely synthesized protein catabolic process(GO:0006515) |
Gene overrepresentation in cellular component category:
| Log-likelihood per target | Total log-likelihood | Term | Description |
|---|---|---|---|
| 7.1 | 35.3 | GO:0000942 | condensed nuclear chromosome outer kinetochore(GO:0000942) |
| 6.9 | 61.7 | GO:0071546 | pi-body(GO:0071546) |
| 6.3 | 18.8 | GO:1990257 | piccolo-bassoon transport vesicle(GO:1990257) |
| 6.0 | 18.1 | GO:0032807 | DNA ligase IV complex(GO:0032807) |
| 5.9 | 47.3 | GO:0000796 | condensin complex(GO:0000796) |
| 5.8 | 46.3 | GO:0031314 | extrinsic component of mitochondrial inner membrane(GO:0031314) |
| 5.5 | 33.0 | GO:0005726 | perichromatin fibrils(GO:0005726) |
| 5.4 | 27.1 | GO:1990726 | Lsm1-7-Pat1 complex(GO:1990726) |
| 5.4 | 26.9 | GO:0016939 | kinesin II complex(GO:0016939) |
| 5.1 | 15.2 | GO:0032301 | MutSalpha complex(GO:0032301) |
| 5.0 | 20.0 | GO:0031074 | nucleocytoplasmic shuttling complex(GO:0031074) |
| 4.5 | 18.0 | GO:0097451 | glial limiting end-foot(GO:0097451) |
| 4.5 | 17.9 | GO:0000444 | MIS12/MIND type complex(GO:0000444) |
| 4.4 | 30.8 | GO:0005827 | polar microtubule(GO:0005827) |
| 3.7 | 18.4 | GO:0031465 | Cul4B-RING E3 ubiquitin ligase complex(GO:0031465) |
| 3.6 | 10.9 | GO:0000802 | transverse filament(GO:0000802) |
| 3.4 | 23.8 | GO:0036128 | CatSper complex(GO:0036128) |
| 3.4 | 6.7 | GO:1990923 | PET complex(GO:1990923) |
| 3.4 | 10.1 | GO:1990037 | Lewy body core(GO:1990037) |
| 3.1 | 25.1 | GO:0005869 | dynactin complex(GO:0005869) |
| 3.1 | 12.5 | GO:0035061 | interchromatin granule(GO:0035061) |
| 3.1 | 12.2 | GO:0070522 | ERCC4-ERCC1 complex(GO:0070522) |
| 3.1 | 27.5 | GO:0000940 | condensed chromosome outer kinetochore(GO:0000940) |
| 3.0 | 15.2 | GO:0070032 | synaptobrevin 2-SNAP-25-syntaxin-1a-complexin I complex(GO:0070032) |
| 3.0 | 39.4 | GO:0033391 | chromatoid body(GO:0033391) |
| 3.0 | 11.9 | GO:0034657 | GID complex(GO:0034657) |
| 2.7 | 13.7 | GO:0098536 | deuterosome(GO:0098536) |
| 2.7 | 19.2 | GO:0001652 | granular component(GO:0001652) |
| 2.7 | 11.0 | GO:0097196 | Shu complex(GO:0097196) |
| 2.7 | 16.5 | GO:0090543 | Flemming body(GO:0090543) |
| 2.6 | 7.9 | GO:0005745 | m-AAA complex(GO:0005745) |
| 2.6 | 7.8 | GO:0097124 | cyclin A2-CDK2 complex(GO:0097124) |
| 2.6 | 13.0 | GO:0033063 | Rad51B-Rad51C-Rad51D-XRCC2 complex(GO:0033063) |
| 2.5 | 22.3 | GO:0005664 | origin recognition complex(GO:0000808) nuclear origin of replication recognition complex(GO:0005664) |
| 2.3 | 34.4 | GO:0016580 | Sin3 complex(GO:0016580) |
| 2.3 | 2.3 | GO:0031021 | interphase microtubule organizing center(GO:0031021) |
| 2.3 | 40.7 | GO:0000930 | gamma-tubulin complex(GO:0000930) |
| 2.2 | 6.7 | GO:0070421 | DNA ligase III-XRCC1 complex(GO:0070421) |
| 2.2 | 8.9 | GO:0071818 | BAT3 complex(GO:0071818) ER membrane insertion complex(GO:0072379) |
| 2.2 | 10.8 | GO:0030015 | CCR4-NOT core complex(GO:0030015) |
| 2.1 | 8.6 | GO:0005688 | U6 snRNP(GO:0005688) |
| 2.1 | 14.4 | GO:0033290 | eukaryotic 48S preinitiation complex(GO:0033290) |
| 2.0 | 8.2 | GO:0070876 | SOSS complex(GO:0070876) |
| 2.0 | 16.2 | GO:0016272 | prefoldin complex(GO:0016272) |
| 2.0 | 12.1 | GO:0030677 | nucleolar ribonuclease P complex(GO:0005655) ribonuclease P complex(GO:0030677) multimeric ribonuclease P complex(GO:0030681) |
| 2.0 | 6.0 | GO:0005962 | mitochondrial isocitrate dehydrogenase complex (NAD+)(GO:0005962) isocitrate dehydrogenase complex (NAD+)(GO:0045242) |
| 2.0 | 6.0 | GO:0031262 | Ndc80 complex(GO:0031262) |
| 1.9 | 5.8 | GO:0009328 | phenylalanine-tRNA ligase complex(GO:0009328) |
| 1.9 | 35.5 | GO:0035098 | ESC/E(Z) complex(GO:0035098) |
| 1.9 | 57.6 | GO:0034451 | centriolar satellite(GO:0034451) |
| 1.9 | 13.0 | GO:0031415 | NatA complex(GO:0031415) |
| 1.8 | 14.7 | GO:0000235 | astral microtubule(GO:0000235) aster(GO:0005818) |
| 1.8 | 23.8 | GO:0031011 | Ino80 complex(GO:0031011) DNA helicase complex(GO:0033202) |
| 1.8 | 11.0 | GO:0034464 | BBSome(GO:0034464) |
| 1.8 | 5.4 | GO:0005712 | chiasma(GO:0005712) |
| 1.8 | 5.4 | GO:0071942 | XPC complex(GO:0071942) |
| 1.8 | 17.8 | GO:0005687 | U4 snRNP(GO:0005687) |
| 1.8 | 8.8 | GO:0005927 | muscle tendon junction(GO:0005927) |
| 1.7 | 5.1 | GO:0097346 | INO80-type complex(GO:0097346) |
| 1.7 | 8.5 | GO:0097165 | nuclear stress granule(GO:0097165) |
| 1.7 | 5.0 | GO:1990622 | CHOP-ATF3 complex(GO:1990622) |
| 1.7 | 36.8 | GO:0035267 | NuA4 histone acetyltransferase complex(GO:0035267) H4/H2A histone acetyltransferase complex(GO:0043189) H4 histone acetyltransferase complex(GO:1902562) |
| 1.6 | 9.8 | GO:0031414 | N-terminal protein acetyltransferase complex(GO:0031414) |
| 1.6 | 18.0 | GO:0000176 | nuclear exosome (RNase complex)(GO:0000176) |
| 1.6 | 8.1 | GO:1990462 | omegasome membrane(GO:1903349) omegasome(GO:1990462) |
| 1.6 | 9.7 | GO:0089701 | U2AF(GO:0089701) |
| 1.6 | 25.2 | GO:0070938 | contractile ring(GO:0070938) |
| 1.6 | 12.5 | GO:0071204 | histone pre-mRNA 3'end processing complex(GO:0071204) |
| 1.5 | 9.1 | GO:0034388 | Pwp2p-containing subcomplex of 90S preribosome(GO:0034388) |
| 1.5 | 12.0 | GO:0072669 | tRNA-splicing ligase complex(GO:0072669) |
| 1.5 | 6.0 | GO:0044301 | climbing fiber(GO:0044301) |
| 1.5 | 2.9 | GO:0031510 | SUMO activating enzyme complex(GO:0031510) |
| 1.5 | 74.4 | GO:0030964 | mitochondrial respiratory chain complex I(GO:0005747) NADH dehydrogenase complex(GO:0030964) respiratory chain complex I(GO:0045271) |
| 1.4 | 4.3 | GO:0016935 | glycine-gated chloride channel complex(GO:0016935) GABA-ergic synapse(GO:0098982) |
| 1.4 | 14.1 | GO:0071564 | npBAF complex(GO:0071564) |
| 1.4 | 27.9 | GO:0005665 | DNA-directed RNA polymerase II, core complex(GO:0005665) |
| 1.4 | 8.4 | GO:0005850 | eukaryotic translation initiation factor 2 complex(GO:0005850) |
| 1.4 | 6.9 | GO:0005851 | eukaryotic translation initiation factor 2B complex(GO:0005851) |
| 1.4 | 10.9 | GO:0005658 | alpha DNA polymerase:primase complex(GO:0005658) |
| 1.4 | 17.6 | GO:0002199 | zona pellucida receptor complex(GO:0002199) |
| 1.4 | 4.1 | GO:0044307 | dendritic branch(GO:0044307) |
| 1.3 | 14.7 | GO:0035748 | myelin sheath abaxonal region(GO:0035748) |
| 1.3 | 6.6 | GO:0034719 | SMN-Sm protein complex(GO:0034719) |
| 1.3 | 15.7 | GO:1990454 | L-type voltage-gated calcium channel complex(GO:1990454) |
| 1.3 | 35.2 | GO:0030992 | intraciliary transport particle B(GO:0030992) |
| 1.3 | 11.6 | GO:0005742 | mitochondrial outer membrane translocase complex(GO:0005742) |
| 1.3 | 6.3 | GO:0097361 | CIA complex(GO:0097361) |
| 1.2 | 5.0 | GO:0070695 | FHF complex(GO:0070695) |
| 1.2 | 3.7 | GO:0000811 | GINS complex(GO:0000811) |
| 1.2 | 3.7 | GO:0097255 | R2TP complex(GO:0097255) |
| 1.2 | 9.9 | GO:0005964 | phosphorylase kinase complex(GO:0005964) |
| 1.2 | 82.0 | GO:0005758 | mitochondrial intermembrane space(GO:0005758) |
| 1.2 | 14.6 | GO:0000801 | central element(GO:0000801) |
| 1.2 | 4.8 | GO:0033648 | host intracellular organelle(GO:0033647) host intracellular membrane-bounded organelle(GO:0033648) |
| 1.2 | 7.2 | GO:0000778 | condensed nuclear chromosome kinetochore(GO:0000778) |
| 1.2 | 4.8 | GO:0032300 | mismatch repair complex(GO:0032300) |
| 1.2 | 9.6 | GO:0070531 | BRCA1-A complex(GO:0070531) |
| 1.2 | 6.0 | GO:0097550 | transcriptional preinitiation complex(GO:0097550) |
| 1.2 | 8.3 | GO:0097504 | Gemini of coiled bodies(GO:0097504) |
| 1.2 | 5.8 | GO:0044326 | dendritic spine neck(GO:0044326) |
| 1.1 | 4.6 | GO:0005846 | nuclear cap binding complex(GO:0005846) |
| 1.1 | 14.8 | GO:0044666 | MLL3/4 complex(GO:0044666) |
| 1.1 | 30.6 | GO:0000795 | synaptonemal complex(GO:0000795) |
| 1.1 | 4.5 | GO:0070545 | PeBoW complex(GO:0070545) |
| 1.1 | 10.7 | GO:0031597 | cytosolic proteasome complex(GO:0031597) |
| 1.1 | 4.2 | GO:0031592 | centrosomal corona(GO:0031592) |
| 1.0 | 5.1 | GO:0046696 | lipopolysaccharide receptor complex(GO:0046696) |
| 1.0 | 5.0 | GO:1990130 | Iml1 complex(GO:1990130) |
| 1.0 | 9.9 | GO:0031080 | nuclear pore outer ring(GO:0031080) |
| 1.0 | 7.9 | GO:0031464 | Cul4A-RING E3 ubiquitin ligase complex(GO:0031464) |
| 0.9 | 15.1 | GO:0032039 | integrator complex(GO:0032039) |
| 0.9 | 20.7 | GO:0033178 | proton-transporting two-sector ATPase complex, catalytic domain(GO:0033178) |
| 0.9 | 2.8 | GO:0033276 | transcription factor TFTC complex(GO:0033276) |
| 0.9 | 11.1 | GO:0018995 | host(GO:0018995) host cell(GO:0043657) |
| 0.9 | 9.1 | GO:0000445 | THO complex(GO:0000347) THO complex part of transcription export complex(GO:0000445) |
| 0.9 | 2.7 | GO:1990879 | CST complex(GO:1990879) |
| 0.9 | 3.6 | GO:0032044 | DSIF complex(GO:0032044) |
| 0.9 | 37.7 | GO:0070469 | respiratory chain(GO:0070469) |
| 0.9 | 9.0 | GO:0042555 | MCM complex(GO:0042555) |
| 0.9 | 6.3 | GO:1990316 | ATG1/ULK1 kinase complex(GO:1990316) |
| 0.9 | 9.7 | GO:0001673 | male germ cell nucleus(GO:0001673) |
| 0.9 | 6.2 | GO:0031428 | box C/D snoRNP complex(GO:0031428) |
| 0.9 | 2.6 | GO:0070939 | Dsl1p complex(GO:0070939) RZZ complex(GO:1990423) |
| 0.9 | 40.7 | GO:0045171 | intercellular bridge(GO:0045171) |
| 0.9 | 14.5 | GO:0033176 | proton-transporting V-type ATPase complex(GO:0033176) |
| 0.9 | 5.1 | GO:0032444 | activin responsive factor complex(GO:0032444) |
| 0.8 | 1.7 | GO:0071817 | MMXD complex(GO:0071817) |
| 0.8 | 35.3 | GO:1904115 | axon cytoplasm(GO:1904115) |
| 0.8 | 16.3 | GO:0005680 | anaphase-promoting complex(GO:0005680) |
| 0.8 | 3.1 | GO:0032021 | NELF complex(GO:0032021) |
| 0.8 | 1.5 | GO:0033588 | Elongator holoenzyme complex(GO:0033588) |
| 0.8 | 11.4 | GO:0035102 | PRC1 complex(GO:0035102) |
| 0.8 | 11.3 | GO:0005847 | mRNA cleavage and polyadenylation specificity factor complex(GO:0005847) |
| 0.7 | 8.2 | GO:0030688 | preribosome, small subunit precursor(GO:0030688) |
| 0.7 | 30.6 | GO:0005881 | cytoplasmic microtubule(GO:0005881) |
| 0.7 | 22.1 | GO:0000777 | condensed chromosome kinetochore(GO:0000777) |
| 0.7 | 9.2 | GO:0035327 | transcriptionally active chromatin(GO:0035327) |
| 0.7 | 62.8 | GO:0044815 | DNA packaging complex(GO:0044815) |
| 0.7 | 21.2 | GO:0005669 | transcription factor TFIID complex(GO:0005669) |
| 0.7 | 10.5 | GO:0031258 | lamellipodium membrane(GO:0031258) |
| 0.7 | 2.1 | GO:0031315 | extrinsic component of mitochondrial outer membrane(GO:0031315) |
| 0.7 | 6.9 | GO:0036038 | MKS complex(GO:0036038) |
| 0.7 | 61.2 | GO:0005814 | centriole(GO:0005814) |
| 0.7 | 27.6 | GO:0005720 | nuclear heterochromatin(GO:0005720) |
| 0.7 | 26.9 | GO:0000776 | kinetochore(GO:0000776) |
| 0.6 | 3.9 | GO:0005672 | transcription factor TFIIA complex(GO:0005672) |
| 0.6 | 8.3 | GO:0017101 | aminoacyl-tRNA synthetase multienzyme complex(GO:0017101) |
| 0.6 | 7.5 | GO:0043083 | synaptic cleft(GO:0043083) |
| 0.6 | 4.3 | GO:0042382 | paraspeckles(GO:0042382) |
| 0.6 | 1.8 | GO:0005956 | protein kinase CK2 complex(GO:0005956) |
| 0.6 | 7.9 | GO:0005686 | U2 snRNP(GO:0005686) |
| 0.6 | 8.5 | GO:0071339 | MLL1/2 complex(GO:0044665) MLL1 complex(GO:0071339) |
| 0.6 | 4.2 | GO:1990635 | proximal dendrite(GO:1990635) |
| 0.6 | 2.4 | GO:0071008 | U2-type post-mRNA release spliceosomal complex(GO:0071008) |
| 0.6 | 4.0 | GO:0000127 | transcription factor TFIIIC complex(GO:0000127) |
| 0.6 | 3.4 | GO:0016012 | dystroglycan complex(GO:0016011) sarcoglycan complex(GO:0016012) |
| 0.6 | 13.4 | GO:0043194 | axon initial segment(GO:0043194) |
| 0.6 | 8.9 | GO:0005671 | Ada2/Gcn5/Ada3 transcription activator complex(GO:0005671) |
| 0.6 | 3.3 | GO:0045293 | MIS complex(GO:0036396) mRNA editing complex(GO:0045293) |
| 0.5 | 4.4 | GO:0005786 | signal recognition particle, endoplasmic reticulum targeting(GO:0005786) |
| 0.5 | 16.4 | GO:0046930 | pore complex(GO:0046930) |
| 0.5 | 4.4 | GO:0044194 | cytolytic granule(GO:0044194) |
| 0.5 | 36.9 | GO:0031594 | neuromuscular junction(GO:0031594) |
| 0.5 | 5.3 | GO:0090544 | BAF-type complex(GO:0090544) |
| 0.5 | 6.6 | GO:0032593 | insulin-responsive compartment(GO:0032593) |
| 0.5 | 3.5 | GO:0035859 | Seh1-associated complex(GO:0035859) GATOR2 complex(GO:0061700) |
| 0.5 | 8.4 | GO:0031229 | integral component of nuclear inner membrane(GO:0005639) intrinsic component of nuclear inner membrane(GO:0031229) |
| 0.5 | 18.3 | GO:0016235 | aggresome(GO:0016235) |
| 0.5 | 2.4 | GO:0031501 | mannosyltransferase complex(GO:0031501) |
| 0.5 | 28.3 | GO:0005762 | organellar large ribosomal subunit(GO:0000315) mitochondrial large ribosomal subunit(GO:0005762) |
| 0.5 | 5.7 | GO:0000242 | pericentriolar material(GO:0000242) |
| 0.5 | 4.7 | GO:0070652 | HAUS complex(GO:0070652) |
| 0.5 | 8.6 | GO:0005892 | acetylcholine-gated channel complex(GO:0005892) |
| 0.4 | 30.4 | GO:0019005 | SCF ubiquitin ligase complex(GO:0019005) |
| 0.4 | 1.8 | GO:0060091 | kinocilium(GO:0060091) |
| 0.4 | 8.0 | GO:0032040 | small-subunit processome(GO:0032040) |
| 0.4 | 1.7 | GO:0043159 | acrosomal matrix(GO:0043159) |
| 0.4 | 3.0 | GO:0035068 | micro-ribonucleoprotein complex(GO:0035068) |
| 0.4 | 3.8 | GO:0090665 | dystrophin-associated glycoprotein complex(GO:0016010) glycoprotein complex(GO:0090665) |
| 0.4 | 5.1 | GO:0030008 | TRAPP complex(GO:0030008) |
| 0.4 | 9.6 | GO:1902711 | GABA-A receptor complex(GO:1902711) |
| 0.4 | 4.5 | GO:0005689 | U12-type spliceosomal complex(GO:0005689) |
| 0.4 | 2.0 | GO:0031616 | spindle pole centrosome(GO:0031616) |
| 0.4 | 1.2 | GO:0031680 | G-protein beta/gamma-subunit complex(GO:0031680) |
| 0.4 | 4.4 | GO:0034362 | low-density lipoprotein particle(GO:0034362) |
| 0.4 | 9.5 | GO:0005876 | spindle microtubule(GO:0005876) |
| 0.4 | 3.1 | GO:0031209 | SCAR complex(GO:0031209) |
| 0.4 | 5.4 | GO:0032433 | filopodium tip(GO:0032433) |
| 0.4 | 3.4 | GO:0019773 | proteasome core complex, alpha-subunit complex(GO:0019773) |
| 0.4 | 14.6 | GO:0000307 | cyclin-dependent protein kinase holoenzyme complex(GO:0000307) |
| 0.4 | 4.0 | GO:0032541 | cortical endoplasmic reticulum(GO:0032541) |
| 0.4 | 4.3 | GO:0036513 | Derlin-1 retrotranslocation complex(GO:0036513) |
| 0.4 | 2.9 | GO:0000346 | transcription export complex(GO:0000346) nuclear inclusion body(GO:0042405) |
| 0.4 | 2.5 | GO:0048787 | presynaptic active zone membrane(GO:0048787) |
| 0.3 | 4.5 | GO:0032045 | guanyl-nucleotide exchange factor complex(GO:0032045) |
| 0.3 | 6.9 | GO:0051233 | spindle midzone(GO:0051233) |
| 0.3 | 11.3 | GO:0005761 | organellar ribosome(GO:0000313) mitochondrial ribosome(GO:0005761) |
| 0.3 | 3.7 | GO:0017119 | Golgi transport complex(GO:0017119) |
| 0.3 | 1.5 | GO:0070765 | gamma-secretase complex(GO:0070765) |
| 0.3 | 1.5 | GO:0071797 | LUBAC complex(GO:0071797) |
| 0.3 | 4.7 | GO:1990124 | messenger ribonucleoprotein complex(GO:1990124) |
| 0.3 | 1.7 | GO:0000015 | phosphopyruvate hydratase complex(GO:0000015) |
| 0.3 | 11.9 | GO:0010494 | cytoplasmic stress granule(GO:0010494) |
| 0.3 | 1.7 | GO:0042765 | GPI-anchor transamidase complex(GO:0042765) |
| 0.3 | 6.2 | GO:0035861 | site of double-strand break(GO:0035861) |
| 0.3 | 14.8 | GO:0000118 | histone deacetylase complex(GO:0000118) |
| 0.3 | 2.8 | GO:0005852 | eukaryotic translation initiation factor 3 complex(GO:0005852) |
| 0.3 | 3.4 | GO:0031254 | uropod(GO:0001931) cell trailing edge(GO:0031254) |
| 0.3 | 1.0 | GO:0098799 | outer mitochondrial membrane protein complex(GO:0098799) |
| 0.3 | 9.5 | GO:0005844 | polysome(GO:0005844) |
| 0.2 | 42.6 | GO:0000151 | ubiquitin ligase complex(GO:0000151) |
| 0.2 | 6.6 | GO:0008023 | transcription elongation factor complex(GO:0008023) |
| 0.2 | 9.9 | GO:0032420 | stereocilium(GO:0032420) |
| 0.2 | 1.7 | GO:0030991 | intraciliary transport particle A(GO:0030991) |
| 0.2 | 1.4 | GO:0005952 | cAMP-dependent protein kinase complex(GO:0005952) |
| 0.2 | 11.4 | GO:0071013 | catalytic step 2 spliceosome(GO:0071013) |
| 0.2 | 1.9 | GO:0000178 | exosome (RNase complex)(GO:0000178) |
| 0.2 | 2.3 | GO:0035253 | ciliary rootlet(GO:0035253) |
| 0.2 | 1.3 | GO:0000815 | ESCRT III complex(GO:0000815) |
| 0.2 | 9.1 | GO:0000502 | proteasome complex(GO:0000502) |
| 0.2 | 6.4 | GO:0048786 | presynaptic active zone(GO:0048786) |
| 0.2 | 1.5 | GO:0030014 | CCR4-NOT complex(GO:0030014) |
| 0.2 | 10.0 | GO:0000932 | cytoplasmic mRNA processing body(GO:0000932) |
| 0.2 | 2.4 | GO:0031045 | dense core granule(GO:0031045) |
| 0.2 | 1.1 | GO:0000124 | SAGA complex(GO:0000124) |
| 0.1 | 2.1 | GO:0005666 | DNA-directed RNA polymerase III complex(GO:0005666) |
| 0.1 | 5.5 | GO:0005834 | heterotrimeric G-protein complex(GO:0005834) |
| 0.1 | 4.4 | GO:0032281 | AMPA glutamate receptor complex(GO:0032281) |
| 0.1 | 0.8 | GO:0032585 | multivesicular body membrane(GO:0032585) |
| 0.1 | 0.4 | GO:0048269 | methionine adenosyltransferase complex(GO:0048269) |
| 0.1 | 0.4 | GO:0043259 | laminin-10 complex(GO:0043259) |
| 0.1 | 2.0 | GO:0042581 | specific granule(GO:0042581) |
| 0.1 | 28.7 | GO:0005874 | microtubule(GO:0005874) |
| 0.1 | 3.6 | GO:0016592 | mediator complex(GO:0016592) |
| 0.1 | 0.8 | GO:0031931 | TORC1 complex(GO:0031931) |
| 0.1 | 32.3 | GO:0016607 | nuclear speck(GO:0016607) |
| 0.1 | 6.2 | GO:0043198 | dendritic shaft(GO:0043198) |
| 0.1 | 2.6 | GO:0030904 | retromer complex(GO:0030904) |
| 0.1 | 3.9 | GO:0034704 | calcium channel complex(GO:0034704) |
| 0.1 | 0.8 | GO:0061617 | MICOS complex(GO:0061617) |
| 0.1 | 13.7 | GO:0005741 | mitochondrial outer membrane(GO:0005741) |
| 0.1 | 1.8 | GO:0043240 | Fanconi anaemia nuclear complex(GO:0043240) |
| 0.1 | 0.9 | GO:0005721 | pericentric heterochromatin(GO:0005721) |
| 0.1 | 2.7 | GO:0030131 | clathrin adaptor complex(GO:0030131) |
| 0.1 | 7.7 | GO:0008076 | voltage-gated potassium channel complex(GO:0008076) |
| 0.1 | 1.9 | GO:0000123 | histone acetyltransferase complex(GO:0000123) |
| 0.1 | 6.1 | GO:0031225 | anchored component of membrane(GO:0031225) |
| 0.1 | 7.8 | GO:0008021 | synaptic vesicle(GO:0008021) |
| 0.1 | 1.0 | GO:0032839 | dendrite cytoplasm(GO:0032839) |
| 0.1 | 0.3 | GO:0002189 | ribose phosphate diphosphokinase complex(GO:0002189) |
| 0.0 | 0.6 | GO:0043196 | varicosity(GO:0043196) |
| 0.0 | 0.3 | GO:0097197 | tetraspanin-enriched microdomain(GO:0097197) |
| 0.0 | 1.2 | GO:0030684 | preribosome(GO:0030684) |
| 0.0 | 0.5 | GO:0016591 | DNA-directed RNA polymerase II, holoenzyme(GO:0016591) |
| 0.0 | 0.2 | GO:0032584 | growth cone membrane(GO:0032584) |
| 0.0 | 0.4 | GO:0031235 | intrinsic component of the cytoplasmic side of the plasma membrane(GO:0031235) |
| 0.0 | 0.1 | GO:0071203 | WASH complex(GO:0071203) |
| 0.0 | 0.4 | GO:0032588 | trans-Golgi network membrane(GO:0032588) |
| 0.0 | 0.5 | GO:0030315 | T-tubule(GO:0030315) |
Gene overrepresentation in molecular function category:
| Log-likelihood per target | Total log-likelihood | Term | Description |
|---|---|---|---|
| 8.4 | 25.3 | GO:0102390 | mycophenolic acid acyl-glucuronide esterase activity(GO:0102390) |
| 8.3 | 33.2 | GO:0008486 | endopolyphosphatase activity(GO:0000298) diphosphoinositol-polyphosphate diphosphatase activity(GO:0008486) bis(5'-adenosyl)-hexaphosphatase activity(GO:0034431) bis(5'-adenosyl)-pentaphosphatase activity(GO:0034432) |
| 7.5 | 22.4 | GO:0036478 | tyrosine 3-monooxygenase activator activity(GO:0036470) L-dopa decarboxylase activator activity(GO:0036478) |
| 6.6 | 19.7 | GO:0035851 | Krueppel-associated box domain binding(GO:0035851) |
| 5.7 | 22.9 | GO:0019237 | centromeric DNA binding(GO:0019237) |
| 4.4 | 13.1 | GO:0004370 | glycerol kinase activity(GO:0004370) |
| 4.3 | 17.1 | GO:1990189 | peptide-serine-N-acetyltransferase activity(GO:1990189) |
| 4.2 | 16.7 | GO:0061575 | cyclin-dependent protein serine/threonine kinase activator activity(GO:0061575) |
| 4.1 | 33.0 | GO:0001163 | RNA polymerase I regulatory region sequence-specific DNA binding(GO:0001163) RNA polymerase I CORE element sequence-specific DNA binding(GO:0001164) |
| 4.1 | 16.5 | GO:0051425 | PTB domain binding(GO:0051425) |
| 3.8 | 15.4 | GO:0070883 | pre-miRNA binding(GO:0070883) |
| 3.7 | 11.1 | GO:0004647 | phosphoserine phosphatase activity(GO:0004647) |
| 3.7 | 11.1 | GO:0042015 | interleukin-20 binding(GO:0042015) |
| 3.6 | 10.9 | GO:0003828 | alpha-N-acetylneuraminate alpha-2,8-sialyltransferase activity(GO:0003828) |
| 3.6 | 21.4 | GO:0019788 | NEDD8 transferase activity(GO:0019788) |
| 3.3 | 9.8 | GO:0000033 | alpha-1,3-mannosyltransferase activity(GO:0000033) |
| 3.2 | 22.6 | GO:0010340 | carboxyl-O-methyltransferase activity(GO:0010340) protein carboxyl O-methyltransferase activity(GO:0051998) |
| 3.2 | 12.8 | GO:0034584 | piRNA binding(GO:0034584) |
| 3.2 | 6.3 | GO:0019211 | phosphatase activator activity(GO:0019211) |
| 2.9 | 11.7 | GO:0004619 | bisphosphoglycerate mutase activity(GO:0004082) phosphoglycerate mutase activity(GO:0004619) 2,3-bisphosphoglycerate-dependent phosphoglycerate mutase activity(GO:0046538) |
| 2.8 | 17.1 | GO:0005332 | gamma-aminobutyric acid:sodium symporter activity(GO:0005332) |
| 2.7 | 8.2 | GO:0008169 | C-methyltransferase activity(GO:0008169) |
| 2.7 | 10.7 | GO:0015137 | citrate transmembrane transporter activity(GO:0015137) |
| 2.7 | 10.7 | GO:0055105 | ubiquitin-protein transferase inhibitor activity(GO:0055105) |
| 2.6 | 2.6 | GO:0016312 | inositol bisphosphate phosphatase activity(GO:0016312) |
| 2.6 | 23.4 | GO:0008140 | cAMP response element binding protein binding(GO:0008140) |
| 2.6 | 10.2 | GO:0004711 | ribosomal protein S6 kinase activity(GO:0004711) |
| 2.5 | 7.5 | GO:0032296 | ribonuclease III activity(GO:0004525) double-stranded RNA-specific ribonuclease activity(GO:0032296) |
| 2.5 | 19.7 | GO:0001055 | RNA polymerase II activity(GO:0001055) |
| 2.4 | 9.6 | GO:0033149 | FFAT motif binding(GO:0033149) |
| 2.3 | 7.0 | GO:0004775 | succinate-CoA ligase activity(GO:0004774) succinate-CoA ligase (ADP-forming) activity(GO:0004775) |
| 2.3 | 9.4 | GO:0061665 | SUMO ligase activity(GO:0061665) |
| 2.3 | 9.3 | GO:0008379 | thioredoxin peroxidase activity(GO:0008379) |
| 2.3 | 6.9 | GO:0000179 | rRNA (adenine-N6,N6-)-dimethyltransferase activity(GO:0000179) |
| 2.3 | 13.5 | GO:0033142 | progesterone receptor binding(GO:0033142) |
| 2.2 | 13.3 | GO:0086056 | voltage-gated calcium channel activity involved in AV node cell action potential(GO:0086056) |
| 2.2 | 13.0 | GO:0000150 | recombinase activity(GO:0000150) |
| 2.1 | 6.4 | GO:0004832 | valine-tRNA ligase activity(GO:0004832) |
| 2.1 | 8.3 | GO:0036042 | long-chain fatty acyl-CoA binding(GO:0036042) |
| 2.1 | 12.4 | GO:0010521 | telomerase inhibitor activity(GO:0010521) |
| 2.0 | 6.1 | GO:0004825 | methionine-tRNA ligase activity(GO:0004825) |
| 2.0 | 8.1 | GO:0008489 | UDP-galactose:glucosylceramide beta-1,4-galactosyltransferase activity(GO:0008489) |
| 2.0 | 18.3 | GO:0003910 | DNA ligase activity(GO:0003909) DNA ligase (ATP) activity(GO:0003910) |
| 2.0 | 2.0 | GO:0016433 | rRNA (adenine) methyltransferase activity(GO:0016433) |
| 2.0 | 6.0 | GO:0000991 | transcription factor activity, core RNA polymerase II binding(GO:0000991) |
| 2.0 | 5.9 | GO:0031208 | POZ domain binding(GO:0031208) |
| 1.9 | 19.3 | GO:0004596 | peptide alpha-N-acetyltransferase activity(GO:0004596) |
| 1.9 | 23.1 | GO:0019869 | chloride channel inhibitor activity(GO:0019869) |
| 1.9 | 7.5 | GO:1990599 | 3' overhang single-stranded DNA endodeoxyribonuclease activity(GO:1990599) |
| 1.9 | 5.6 | GO:0035613 | RNA stem-loop binding(GO:0035613) |
| 1.8 | 9.1 | GO:0032795 | heterotrimeric G-protein binding(GO:0032795) |
| 1.8 | 5.3 | GO:0097677 | STAT family protein binding(GO:0097677) |
| 1.8 | 8.8 | GO:0004668 | protein-arginine deiminase activity(GO:0004668) |
| 1.7 | 31.3 | GO:0017160 | Ral GTPase binding(GO:0017160) |
| 1.7 | 48.5 | GO:0005540 | hyaluronic acid binding(GO:0005540) |
| 1.7 | 12.0 | GO:1904047 | S-adenosyl-L-methionine binding(GO:1904047) |
| 1.7 | 5.0 | GO:0046404 | ATP-dependent polydeoxyribonucleotide 5'-hydroxyl-kinase activity(GO:0046404) polydeoxyribonucleotide kinase activity(GO:0051733) ATP-dependent polynucleotide kinase activity(GO:0051734) |
| 1.6 | 8.2 | GO:0004427 | inorganic diphosphatase activity(GO:0004427) |
| 1.6 | 4.9 | GO:0004315 | 3-oxoacyl-[acyl-carrier-protein] synthase activity(GO:0004315) |
| 1.5 | 4.6 | GO:0000386 | second spliceosomal transesterification activity(GO:0000386) |
| 1.5 | 4.6 | GO:0015234 | thiamine transmembrane transporter activity(GO:0015234) |
| 1.5 | 7.6 | GO:0005005 | transmembrane-ephrin receptor activity(GO:0005005) |
| 1.5 | 30.2 | GO:0003950 | NAD+ ADP-ribosyltransferase activity(GO:0003950) |
| 1.5 | 6.0 | GO:0004449 | isocitrate dehydrogenase (NAD+) activity(GO:0004449) |
| 1.5 | 7.5 | GO:0031802 | type 1 metabotropic glutamate receptor binding(GO:0031798) type 5 metabotropic glutamate receptor binding(GO:0031802) |
| 1.5 | 3.0 | GO:0032138 | single base insertion or deletion binding(GO:0032138) |
| 1.5 | 4.5 | GO:0001641 | group II metabotropic glutamate receptor activity(GO:0001641) |
| 1.5 | 13.4 | GO:0086080 | protein binding involved in heterotypic cell-cell adhesion(GO:0086080) |
| 1.5 | 4.4 | GO:0008281 | sulfonylurea receptor activity(GO:0008281) |
| 1.5 | 7.3 | GO:0004416 | hydroxyacylglutathione hydrolase activity(GO:0004416) |
| 1.5 | 4.4 | GO:0001884 | pyrimidine nucleoside binding(GO:0001884) |
| 1.5 | 13.1 | GO:0008821 | crossover junction endodeoxyribonuclease activity(GO:0008821) |
| 1.4 | 4.3 | GO:0031531 | thyrotropin-releasing hormone receptor binding(GO:0031531) |
| 1.4 | 4.3 | GO:0031762 | follicle-stimulating hormone receptor binding(GO:0031762) |
| 1.4 | 11.4 | GO:0030983 | mismatched DNA binding(GO:0030983) |
| 1.4 | 5.6 | GO:0031694 | alpha-2A adrenergic receptor binding(GO:0031694) |
| 1.4 | 7.0 | GO:0042731 | PH domain binding(GO:0042731) |
| 1.4 | 7.0 | GO:0004169 | dolichyl-phosphate-mannose-protein mannosyltransferase activity(GO:0004169) |
| 1.4 | 9.7 | GO:0000155 | phosphorelay sensor kinase activity(GO:0000155) |
| 1.4 | 12.5 | GO:0043515 | kinetochore binding(GO:0043515) |
| 1.4 | 37.4 | GO:0050136 | NADH dehydrogenase (ubiquinone) activity(GO:0008137) NADH dehydrogenase (quinone) activity(GO:0050136) |
| 1.4 | 8.2 | GO:0016728 | ribonucleoside-diphosphate reductase activity, thioredoxin disulfide as acceptor(GO:0004748) oxidoreductase activity, acting on CH or CH2 groups, disulfide as acceptor(GO:0016728) ribonucleoside-diphosphate reductase activity(GO:0061731) |
| 1.4 | 8.1 | GO:0031852 | mu-type opioid receptor binding(GO:0031852) corticotropin-releasing hormone receptor 1 binding(GO:0051430) |
| 1.3 | 5.4 | GO:0017089 | glycolipid transporter activity(GO:0017089) |
| 1.3 | 5.3 | GO:0000995 | transcription factor activity, core RNA polymerase III binding(GO:0000995) |
| 1.3 | 4.0 | GO:0050733 | RS domain binding(GO:0050733) |
| 1.3 | 6.6 | GO:0016922 | ligand-dependent nuclear receptor binding(GO:0016922) |
| 1.3 | 6.6 | GO:0047493 | sphingomyelin synthase activity(GO:0033188) ceramide cholinephosphotransferase activity(GO:0047493) |
| 1.3 | 3.9 | GO:0004483 | mRNA (nucleoside-2'-O-)-methyltransferase activity(GO:0004483) |
| 1.3 | 9.0 | GO:0016308 | 1-phosphatidylinositol-4-phosphate 5-kinase activity(GO:0016308) |
| 1.3 | 21.9 | GO:0008253 | 5'-nucleotidase activity(GO:0008253) |
| 1.3 | 6.4 | GO:0004563 | beta-N-acetylhexosaminidase activity(GO:0004563) |
| 1.3 | 3.8 | GO:0034739 | histone deacetylase activity (H4-K16 specific)(GO:0034739) |
| 1.3 | 3.8 | GO:0050497 | methylthiotransferase activity(GO:0035596) transferase activity, transferring alkylthio groups(GO:0050497) |
| 1.2 | 9.9 | GO:0004689 | phosphorylase kinase activity(GO:0004689) |
| 1.2 | 4.8 | GO:1990269 | RNA polymerase II C-terminal domain phosphoserine binding(GO:1990269) |
| 1.2 | 9.7 | GO:0030628 | pre-mRNA 3'-splice site binding(GO:0030628) |
| 1.2 | 9.6 | GO:0022851 | GABA-gated chloride ion channel activity(GO:0022851) |
| 1.2 | 8.4 | GO:0045503 | dynein light chain binding(GO:0045503) |
| 1.2 | 8.4 | GO:0008649 | rRNA methyltransferase activity(GO:0008649) |
| 1.2 | 10.6 | GO:0008553 | hydrogen-exporting ATPase activity, phosphorylative mechanism(GO:0008553) |
| 1.2 | 18.6 | GO:0008568 | microtubule-severing ATPase activity(GO:0008568) |
| 1.1 | 9.2 | GO:0030911 | TPR domain binding(GO:0030911) |
| 1.1 | 34.0 | GO:0044183 | protein binding involved in protein folding(GO:0044183) |
| 1.1 | 4.4 | GO:0030942 | endoplasmic reticulum signal peptide binding(GO:0030942) |
| 1.1 | 2.2 | GO:0035614 | snRNA stem-loop binding(GO:0035614) |
| 1.1 | 15.0 | GO:0003688 | DNA replication origin binding(GO:0003688) |
| 1.1 | 4.2 | GO:0008158 | hedgehog receptor activity(GO:0008158) |
| 1.1 | 2.1 | GO:0016886 | ligase activity, forming phosphoric ester bonds(GO:0016886) |
| 1.0 | 5.2 | GO:0004586 | ornithine decarboxylase activity(GO:0004586) |
| 1.0 | 6.1 | GO:0001162 | RNA polymerase II intronic transcription regulatory region sequence-specific DNA binding(GO:0001162) |
| 1.0 | 43.9 | GO:0005164 | tumor necrosis factor receptor binding(GO:0005164) |
| 1.0 | 4.1 | GO:1904315 | transmitter-gated ion channel activity involved in regulation of postsynaptic membrane potential(GO:1904315) |
| 1.0 | 6.0 | GO:0032027 | myosin light chain binding(GO:0032027) |
| 1.0 | 24.9 | GO:0070530 | K63-linked polyubiquitin binding(GO:0070530) |
| 1.0 | 26.3 | GO:0052866 | phosphatidylinositol phosphate phosphatase activity(GO:0052866) |
| 1.0 | 12.7 | GO:1990381 | ubiquitin-specific protease binding(GO:1990381) |
| 1.0 | 5.8 | GO:0004826 | phenylalanine-tRNA ligase activity(GO:0004826) |
| 1.0 | 2.9 | GO:0004827 | proline-tRNA ligase activity(GO:0004827) |
| 0.9 | 9.4 | GO:0102337 | fatty acid elongase activity(GO:0009922) 3-oxo-arachidoyl-CoA synthase activity(GO:0102336) 3-oxo-cerotoyl-CoA synthase activity(GO:0102337) 3-oxo-lignoceronyl-CoA synthase activity(GO:0102338) |
| 0.9 | 30.8 | GO:0043015 | gamma-tubulin binding(GO:0043015) |
| 0.9 | 2.8 | GO:0010484 | H3 histone acetyltransferase activity(GO:0010484) |
| 0.9 | 7.5 | GO:0001223 | transcription coactivator binding(GO:0001223) |
| 0.9 | 7.3 | GO:0047134 | protein-disulfide reductase activity(GO:0047134) |
| 0.9 | 21.0 | GO:0015288 | porin activity(GO:0015288) |
| 0.9 | 4.5 | GO:0004430 | 1-phosphatidylinositol 4-kinase activity(GO:0004430) |
| 0.9 | 9.0 | GO:0016929 | SUMO-specific protease activity(GO:0016929) |
| 0.9 | 57.3 | GO:0003743 | translation initiation factor activity(GO:0003743) |
| 0.9 | 4.4 | GO:0004849 | uridine kinase activity(GO:0004849) |
| 0.9 | 26.7 | GO:0003887 | DNA-directed DNA polymerase activity(GO:0003887) |
| 0.9 | 5.3 | GO:0004366 | glycerol-3-phosphate O-acyltransferase activity(GO:0004366) |
| 0.9 | 2.6 | GO:0008073 | ornithine decarboxylase inhibitor activity(GO:0008073) |
| 0.9 | 7.0 | GO:0015266 | protein channel activity(GO:0015266) |
| 0.9 | 5.3 | GO:0032184 | SUMO polymer binding(GO:0032184) |
| 0.9 | 1.7 | GO:1904288 | BAT3 complex binding(GO:1904288) |
| 0.9 | 13.6 | GO:0008143 | poly(A) binding(GO:0008143) |
| 0.8 | 5.8 | GO:0019003 | GDP binding(GO:0019003) |
| 0.8 | 20.6 | GO:0070840 | dynein complex binding(GO:0070840) |
| 0.8 | 7.3 | GO:0009881 | photoreceptor activity(GO:0009881) |
| 0.8 | 2.4 | GO:0086057 | voltage-gated calcium channel activity involved in bundle of His cell action potential(GO:0086057) |
| 0.8 | 10.4 | GO:0031748 | D1 dopamine receptor binding(GO:0031748) |
| 0.8 | 2.4 | GO:0030626 | U12 snRNA binding(GO:0030626) |
| 0.8 | 4.8 | GO:0003956 | NAD(P)+-protein-arginine ADP-ribosyltransferase activity(GO:0003956) |
| 0.8 | 48.6 | GO:0035064 | methylated histone binding(GO:0035064) |
| 0.8 | 3.9 | GO:0098519 | nucleotide phosphatase activity, acting on free nucleotides(GO:0098519) |
| 0.8 | 2.3 | GO:0004809 | tRNA (guanine-N2-)-methyltransferase activity(GO:0004809) |
| 0.8 | 3.9 | GO:0051864 | histone demethylase activity (H3-K36 specific)(GO:0051864) |
| 0.8 | 6.1 | GO:0004300 | enoyl-CoA hydratase activity(GO:0004300) |
| 0.8 | 15.1 | GO:0017049 | GTP-Rho binding(GO:0017049) |
| 0.7 | 6.0 | GO:0008121 | ubiquinol-cytochrome-c reductase activity(GO:0008121) oxidoreductase activity, acting on diphenols and related substances as donors, cytochrome as acceptor(GO:0016681) |
| 0.7 | 16.3 | GO:0051537 | 2 iron, 2 sulfur cluster binding(GO:0051537) |
| 0.7 | 6.7 | GO:0047760 | butyrate-CoA ligase activity(GO:0047760) |
| 0.7 | 4.4 | GO:0003847 | 1-alkyl-2-acetylglycerophosphocholine esterase activity(GO:0003847) |
| 0.7 | 2.9 | GO:0044388 | small protein activating enzyme binding(GO:0044388) |
| 0.7 | 2.9 | GO:0016416 | carnitine O-palmitoyltransferase activity(GO:0004095) O-palmitoyltransferase activity(GO:0016416) |
| 0.7 | 2.9 | GO:0008597 | calcium-dependent protein serine/threonine phosphatase regulator activity(GO:0008597) |
| 0.7 | 5.7 | GO:0017056 | structural constituent of nuclear pore(GO:0017056) |
| 0.7 | 7.1 | GO:0000339 | RNA cap binding(GO:0000339) |
| 0.7 | 2.8 | GO:0000829 | inositol heptakisphosphate kinase activity(GO:0000829) |
| 0.7 | 3.5 | GO:0070728 | leucine binding(GO:0070728) |
| 0.7 | 2.8 | GO:0005143 | interleukin-12 receptor binding(GO:0005143) |
| 0.7 | 5.6 | GO:0015129 | lactate transmembrane transporter activity(GO:0015129) |
| 0.7 | 5.6 | GO:0015250 | water channel activity(GO:0015250) |
| 0.7 | 11.8 | GO:0022848 | acetylcholine-gated cation channel activity(GO:0022848) |
| 0.7 | 3.3 | GO:0022841 | potassium ion leak channel activity(GO:0022841) |
| 0.7 | 2.0 | GO:0031127 | galactoside 2-alpha-L-fucosyltransferase activity(GO:0008107) alpha-(1,2)-fucosyltransferase activity(GO:0031127) |
| 0.7 | 19.5 | GO:0004129 | cytochrome-c oxidase activity(GO:0004129) heme-copper terminal oxidase activity(GO:0015002) oxidoreductase activity, acting on a heme group of donors, oxygen as acceptor(GO:0016676) |
| 0.6 | 6.5 | GO:0034511 | U3 snoRNA binding(GO:0034511) |
| 0.6 | 3.2 | GO:0061133 | endopeptidase activator activity(GO:0061133) |
| 0.6 | 5.1 | GO:0043199 | sulfate binding(GO:0043199) |
| 0.6 | 4.5 | GO:1990446 | U1 snRNP binding(GO:1990446) |
| 0.6 | 36.8 | GO:0019894 | kinesin binding(GO:0019894) |
| 0.6 | 6.3 | GO:0035612 | AP-2 adaptor complex binding(GO:0035612) |
| 0.6 | 2.5 | GO:0010997 | anaphase-promoting complex binding(GO:0010997) |
| 0.6 | 5.0 | GO:0001075 | transcription factor activity, RNA polymerase II core promoter sequence-specific binding involved in preinitiation complex assembly(GO:0001075) |
| 0.6 | 3.1 | GO:0031749 | D2 dopamine receptor binding(GO:0031749) |
| 0.6 | 4.9 | GO:0000182 | rDNA binding(GO:0000182) |
| 0.6 | 4.3 | GO:0016934 | extracellular-glycine-gated ion channel activity(GO:0016933) extracellular-glycine-gated chloride channel activity(GO:0016934) |
| 0.6 | 13.4 | GO:0046332 | SMAD binding(GO:0046332) |
| 0.6 | 4.9 | GO:0043996 | histone acetyltransferase activity (H4-K5 specific)(GO:0043995) histone acetyltransferase activity (H4-K8 specific)(GO:0043996) histone acetyltransferase activity (H4-K16 specific)(GO:0046972) |
| 0.6 | 6.1 | GO:0016290 | palmitoyl-CoA hydrolase activity(GO:0016290) |
| 0.6 | 5.5 | GO:0055056 | D-glucose transmembrane transporter activity(GO:0055056) |
| 0.6 | 4.2 | GO:0043024 | ribosomal small subunit binding(GO:0043024) |
| 0.6 | 2.4 | GO:0001733 | galactosylceramide sulfotransferase activity(GO:0001733) |
| 0.6 | 3.5 | GO:0043426 | MRF binding(GO:0043426) |
| 0.6 | 5.2 | GO:0005487 | nucleocytoplasmic transporter activity(GO:0005487) |
| 0.6 | 43.4 | GO:0043130 | ubiquitin binding(GO:0043130) |
| 0.6 | 2.2 | GO:0004045 | aminoacyl-tRNA hydrolase activity(GO:0004045) |
| 0.6 | 3.4 | GO:0004128 | cytochrome-b5 reductase activity, acting on NAD(P)H(GO:0004128) |
| 0.6 | 17.3 | GO:0030742 | GTP-dependent protein binding(GO:0030742) |
| 0.6 | 10.6 | GO:0015035 | protein disulfide oxidoreductase activity(GO:0015035) |
| 0.6 | 13.3 | GO:0017091 | AU-rich element binding(GO:0017091) |
| 0.6 | 47.3 | GO:0003697 | single-stranded DNA binding(GO:0003697) |
| 0.5 | 23.0 | GO:0070063 | RNA polymerase binding(GO:0070063) |
| 0.5 | 10.9 | GO:0004622 | lysophospholipase activity(GO:0004622) |
| 0.5 | 2.2 | GO:0044547 | DNA topoisomerase binding(GO:0044547) |
| 0.5 | 3.8 | GO:0052833 | inositol monophosphate 1-phosphatase activity(GO:0008934) inositol monophosphate 3-phosphatase activity(GO:0052832) inositol monophosphate 4-phosphatase activity(GO:0052833) inositol monophosphate phosphatase activity(GO:0052834) |
| 0.5 | 15.6 | GO:0008139 | nuclear localization sequence binding(GO:0008139) |
| 0.5 | 4.8 | GO:0019789 | SUMO transferase activity(GO:0019789) |
| 0.5 | 3.0 | GO:0010385 | double-stranded methylated DNA binding(GO:0010385) |
| 0.5 | 5.0 | GO:0004526 | ribonuclease P activity(GO:0004526) |
| 0.5 | 3.0 | GO:0034235 | GPI anchor binding(GO:0034235) |
| 0.5 | 7.4 | GO:0015095 | magnesium ion transmembrane transporter activity(GO:0015095) |
| 0.5 | 29.4 | GO:0004004 | RNA helicase activity(GO:0003724) ATP-dependent RNA helicase activity(GO:0004004) RNA-dependent ATPase activity(GO:0008186) |
| 0.5 | 10.1 | GO:0016799 | hydrolase activity, hydrolyzing N-glycosyl compounds(GO:0016799) |
| 0.5 | 2.9 | GO:0004473 | malic enzyme activity(GO:0004470) malate dehydrogenase (decarboxylating) (NAD+) activity(GO:0004471) malate dehydrogenase (decarboxylating) (NADP+) activity(GO:0004473) |
| 0.5 | 57.1 | GO:0004222 | metalloendopeptidase activity(GO:0004222) |
| 0.5 | 1.9 | GO:0010858 | calcium-dependent protein kinase inhibitor activity(GO:0008427) calcium-dependent protein kinase regulator activity(GO:0010858) |
| 0.4 | 11.5 | GO:0016538 | cyclin-dependent protein serine/threonine kinase regulator activity(GO:0016538) |
| 0.4 | 12.6 | GO:0097472 | cyclin-dependent protein kinase activity(GO:0097472) |
| 0.4 | 13.0 | GO:0001106 | RNA polymerase II transcription corepressor activity(GO:0001106) |
| 0.4 | 3.4 | GO:0047372 | acylglycerol lipase activity(GO:0047372) |
| 0.4 | 13.5 | GO:0061631 | ubiquitin conjugating enzyme activity(GO:0061631) ubiquitin-like protein conjugating enzyme activity(GO:0061650) |
| 0.4 | 1.3 | GO:0051990 | (R)-2-hydroxyglutarate dehydrogenase activity(GO:0051990) |
| 0.4 | 2.1 | GO:0097001 | ceramide binding(GO:0097001) |
| 0.4 | 2.1 | GO:1990226 | histone methyltransferase binding(GO:1990226) |
| 0.4 | 10.8 | GO:0031492 | nucleosomal DNA binding(GO:0031492) |
| 0.4 | 6.5 | GO:0008536 | Ran GTPase binding(GO:0008536) |
| 0.4 | 13.8 | GO:0004532 | exoribonuclease activity(GO:0004532) |
| 0.4 | 20.6 | GO:0000049 | tRNA binding(GO:0000049) |
| 0.4 | 2.0 | GO:0047631 | ADP-ribose diphosphatase activity(GO:0047631) |
| 0.4 | 1.9 | GO:0070181 | small ribosomal subunit rRNA binding(GO:0070181) |
| 0.4 | 3.8 | GO:0047617 | acyl-CoA hydrolase activity(GO:0047617) |
| 0.4 | 7.7 | GO:0035259 | glucocorticoid receptor binding(GO:0035259) |
| 0.4 | 2.2 | GO:0070403 | NAD+ binding(GO:0070403) |
| 0.4 | 1.1 | GO:0010485 | H4 histone acetyltransferase activity(GO:0010485) |
| 0.3 | 1.7 | GO:0004558 | alpha-1,4-glucosidase activity(GO:0004558) alpha-glucosidase activity(GO:0090599) |
| 0.3 | 6.2 | GO:0031491 | nucleosome binding(GO:0031491) |
| 0.3 | 6.7 | GO:0000062 | fatty-acyl-CoA binding(GO:0000062) |
| 0.3 | 2.7 | GO:0016004 | phospholipase activator activity(GO:0016004) |
| 0.3 | 3.3 | GO:0016861 | intramolecular oxidoreductase activity, interconverting aldoses and ketoses(GO:0016861) |
| 0.3 | 1.3 | GO:0048408 | epidermal growth factor binding(GO:0048408) |
| 0.3 | 1.0 | GO:0102345 | 3-hydroxy-behenoyl-CoA dehydratase activity(GO:0102344) 3-hydroxy-lignoceroyl-CoA dehydratase activity(GO:0102345) |
| 0.3 | 4.2 | GO:0010857 | calcium-dependent protein kinase activity(GO:0010857) |
| 0.3 | 5.0 | GO:0016881 | acid-amino acid ligase activity(GO:0016881) |
| 0.3 | 8.3 | GO:0008376 | acetylgalactosaminyltransferase activity(GO:0008376) |
| 0.3 | 1.8 | GO:0070180 | large ribosomal subunit rRNA binding(GO:0070180) |
| 0.3 | 6.4 | GO:0042800 | histone methyltransferase activity (H3-K4 specific)(GO:0042800) |
| 0.3 | 8.7 | GO:0003785 | actin monomer binding(GO:0003785) |
| 0.3 | 6.9 | GO:1990841 | promoter-specific chromatin binding(GO:1990841) |
| 0.3 | 1.7 | GO:0004634 | phosphopyruvate hydratase activity(GO:0004634) |
| 0.3 | 2.3 | GO:0004565 | beta-galactosidase activity(GO:0004565) |
| 0.3 | 1.1 | GO:0030060 | L-malate dehydrogenase activity(GO:0030060) |
| 0.3 | 1.7 | GO:0043139 | 5'-3' DNA helicase activity(GO:0043139) |
| 0.3 | 0.8 | GO:0005483 | soluble NSF attachment protein activity(GO:0005483) |
| 0.3 | 1.4 | GO:1904264 | ubiquitin protein ligase activity involved in ERAD pathway(GO:1904264) |
| 0.3 | 70.9 | GO:0003924 | GTPase activity(GO:0003924) |
| 0.3 | 4.0 | GO:0051010 | microtubule plus-end binding(GO:0051010) |
| 0.3 | 2.4 | GO:0051959 | dynein light intermediate chain binding(GO:0051959) |
| 0.3 | 1.8 | GO:0004865 | protein serine/threonine phosphatase inhibitor activity(GO:0004865) |
| 0.3 | 13.3 | GO:0030551 | cyclic nucleotide binding(GO:0030551) |
| 0.3 | 20.9 | GO:0005249 | voltage-gated potassium channel activity(GO:0005249) |
| 0.3 | 2.1 | GO:0008430 | selenium binding(GO:0008430) |
| 0.3 | 10.2 | GO:0051393 | alpha-actinin binding(GO:0051393) |
| 0.2 | 5.5 | GO:0050681 | androgen receptor binding(GO:0050681) |
| 0.2 | 1.7 | GO:0030375 | thyroid hormone receptor coactivator activity(GO:0030375) |
| 0.2 | 7.9 | GO:0030331 | estrogen receptor binding(GO:0030331) |
| 0.2 | 4.0 | GO:0004683 | calmodulin-dependent protein kinase activity(GO:0004683) |
| 0.2 | 2.5 | GO:0005528 | macrolide binding(GO:0005527) FK506 binding(GO:0005528) |
| 0.2 | 3.6 | GO:0046961 | proton-transporting ATPase activity, rotational mechanism(GO:0046961) |
| 0.2 | 1.6 | GO:0000774 | adenyl-nucleotide exchange factor activity(GO:0000774) |
| 0.2 | 1.1 | GO:0004616 | phosphogluconate dehydrogenase (decarboxylating) activity(GO:0004616) |
| 0.2 | 1.7 | GO:0004738 | pyruvate dehydrogenase activity(GO:0004738) pyruvate dehydrogenase [NAD(P)+] activity(GO:0034603) pyruvate dehydrogenase (NAD+) activity(GO:0034604) |
| 0.2 | 8.1 | GO:0001105 | RNA polymerase II transcription coactivator activity(GO:0001105) |
| 0.2 | 2.4 | GO:0042577 | lipid phosphatase activity(GO:0042577) |
| 0.2 | 1.3 | GO:0008420 | CTD phosphatase activity(GO:0008420) |
| 0.2 | 8.0 | GO:0030507 | spectrin binding(GO:0030507) |
| 0.2 | 2.1 | GO:0001846 | opsonin binding(GO:0001846) |
| 0.2 | 11.8 | GO:0003713 | transcription coactivator activity(GO:0003713) |
| 0.2 | 0.8 | GO:0004594 | pantothenate kinase activity(GO:0004594) |
| 0.2 | 1.8 | GO:0043138 | 3'-5' DNA helicase activity(GO:0043138) |
| 0.2 | 1.4 | GO:0034450 | ubiquitin-ubiquitin ligase activity(GO:0034450) |
| 0.2 | 8.5 | GO:0017112 | Rab guanyl-nucleotide exchange factor activity(GO:0017112) |
| 0.2 | 2.1 | GO:0001056 | RNA polymerase III activity(GO:0001056) |
| 0.2 | 11.6 | GO:0044325 | ion channel binding(GO:0044325) |
| 0.2 | 4.4 | GO:0070064 | proline-rich region binding(GO:0070064) |
| 0.2 | 8.1 | GO:0008138 | protein tyrosine/serine/threonine phosphatase activity(GO:0008138) |
| 0.2 | 5.3 | GO:0003684 | damaged DNA binding(GO:0003684) |
| 0.2 | 5.8 | GO:0051019 | mitogen-activated protein kinase binding(GO:0051019) |
| 0.2 | 11.3 | GO:0004843 | thiol-dependent ubiquitin-specific protease activity(GO:0004843) |
| 0.2 | 9.1 | GO:0051117 | ATPase binding(GO:0051117) |
| 0.2 | 0.3 | GO:0008177 | succinate dehydrogenase (ubiquinone) activity(GO:0008177) |
| 0.2 | 2.4 | GO:0004143 | diacylglycerol kinase activity(GO:0004143) |
| 0.2 | 19.1 | GO:0003714 | transcription corepressor activity(GO:0003714) |
| 0.2 | 1.7 | GO:0030306 | ADP-ribosylation factor binding(GO:0030306) |
| 0.2 | 0.7 | GO:0004301 | epoxide hydrolase activity(GO:0004301) |
| 0.2 | 1.7 | GO:0008408 | 3'-5' exonuclease activity(GO:0008408) |
| 0.2 | 4.6 | GO:0048487 | beta-tubulin binding(GO:0048487) |
| 0.2 | 5.5 | GO:0016831 | carboxy-lyase activity(GO:0016831) |
| 0.2 | 8.6 | GO:0004869 | cysteine-type endopeptidase inhibitor activity(GO:0004869) |
| 0.2 | 17.3 | GO:0005525 | GTP binding(GO:0005525) guanyl ribonucleotide binding(GO:0032561) |
| 0.2 | 2.0 | GO:0036312 | phosphatidylinositol 3-kinase regulatory subunit binding(GO:0036312) |
| 0.2 | 2.5 | GO:0015172 | L-glutamate transmembrane transporter activity(GO:0005313) acidic amino acid transmembrane transporter activity(GO:0015172) |
| 0.2 | 0.9 | GO:0008409 | 5'-3' exonuclease activity(GO:0008409) |
| 0.2 | 2.7 | GO:0042162 | telomeric DNA binding(GO:0042162) |
| 0.2 | 4.1 | GO:0017134 | fibroblast growth factor binding(GO:0017134) |
| 0.2 | 4.7 | GO:0019707 | protein-cysteine S-palmitoyltransferase activity(GO:0019706) protein-cysteine S-acyltransferase activity(GO:0019707) |
| 0.2 | 1.5 | GO:0097200 | cysteine-type endopeptidase activity involved in execution phase of apoptosis(GO:0097200) |
| 0.1 | 14.4 | GO:0003735 | structural constituent of ribosome(GO:0003735) |
| 0.1 | 5.5 | GO:0015485 | cholesterol binding(GO:0015485) |
| 0.1 | 0.4 | GO:0044020 | histone methyltransferase activity (H4-R3 specific)(GO:0044020) |
| 0.1 | 3.3 | GO:0005248 | voltage-gated sodium channel activity(GO:0005248) voltage-gated ion channel activity involved in regulation of postsynaptic membrane potential(GO:1905030) |
| 0.1 | 0.6 | GO:0033192 | calcium-dependent protein serine/threonine phosphatase activity(GO:0004723) calmodulin-dependent protein phosphatase activity(GO:0033192) |
| 0.1 | 3.4 | GO:0004298 | threonine-type endopeptidase activity(GO:0004298) threonine-type peptidase activity(GO:0070003) |
| 0.1 | 2.4 | GO:0070006 | metalloaminopeptidase activity(GO:0070006) |
| 0.1 | 5.8 | GO:0008237 | metallopeptidase activity(GO:0008237) |
| 0.1 | 3.0 | GO:0019825 | oxygen binding(GO:0019825) |
| 0.1 | 0.8 | GO:0008479 | queuine tRNA-ribosyltransferase activity(GO:0008479) |
| 0.1 | 3.7 | GO:0004712 | protein serine/threonine/tyrosine kinase activity(GO:0004712) |
| 0.1 | 0.3 | GO:0008511 | sodium:potassium:chloride symporter activity(GO:0008511) |
| 0.1 | 0.2 | GO:0015925 | galactosidase activity(GO:0015925) |
| 0.1 | 8.0 | GO:0004518 | nuclease activity(GO:0004518) |
| 0.1 | 36.7 | GO:0004842 | ubiquitin-protein transferase activity(GO:0004842) |
| 0.1 | 7.0 | GO:0042393 | histone binding(GO:0042393) |
| 0.1 | 1.4 | GO:0070300 | phosphatidic acid binding(GO:0070300) |
| 0.1 | 0.2 | GO:1990460 | leptin receptor binding(GO:1990460) |
| 0.1 | 0.4 | GO:0043208 | glycosphingolipid binding(GO:0043208) |
| 0.1 | 0.5 | GO:0047429 | nucleoside-triphosphate diphosphatase activity(GO:0047429) |
| 0.1 | 3.4 | GO:0015296 | anion:cation symporter activity(GO:0015296) |
| 0.1 | 0.8 | GO:0032794 | GTPase activating protein binding(GO:0032794) |
| 0.1 | 1.8 | GO:0043021 | ribonucleoprotein complex binding(GO:0043021) |
| 0.1 | 8.1 | GO:0016741 | transferase activity, transferring one-carbon groups(GO:0016741) |
| 0.1 | 1.9 | GO:0030145 | manganese ion binding(GO:0030145) |
| 0.1 | 8.5 | GO:0003729 | mRNA binding(GO:0003729) poly(A) RNA binding(GO:0044822) |
| 0.1 | 8.0 | GO:0004866 | endopeptidase inhibitor activity(GO:0004866) endopeptidase regulator activity(GO:0061135) |
| 0.1 | 3.8 | GO:0051087 | chaperone binding(GO:0051087) |
| 0.1 | 2.0 | GO:0016709 | oxidoreductase activity, acting on paired donors, with incorporation or reduction of molecular oxygen, NAD(P)H as one donor, and incorporation of one atom of oxygen(GO:0016709) |
| 0.1 | 4.4 | GO:0001085 | RNA polymerase II transcription factor binding(GO:0001085) |
| 0.1 | 0.2 | GO:0004487 | methylenetetrahydrofolate dehydrogenase (NAD+) activity(GO:0004487) |
| 0.1 | 1.2 | GO:0004198 | calcium-dependent cysteine-type endopeptidase activity(GO:0004198) |
| 0.0 | 1.1 | GO:0050699 | WW domain binding(GO:0050699) |
| 0.0 | 0.6 | GO:0016493 | C-C chemokine receptor activity(GO:0016493) |
| 0.0 | 2.6 | GO:0019888 | protein phosphatase regulator activity(GO:0019888) |
| 0.0 | 0.4 | GO:0008429 | phosphatidylethanolamine binding(GO:0008429) |
| 0.0 | 5.8 | GO:0008017 | microtubule binding(GO:0008017) |
| 0.0 | 0.5 | GO:0042826 | histone deacetylase binding(GO:0042826) |
| 0.0 | 1.1 | GO:0043531 | ADP binding(GO:0043531) |
| 0.0 | 2.5 | GO:0030276 | clathrin binding(GO:0030276) |
| 0.0 | 1.3 | GO:0008080 | N-acetyltransferase activity(GO:0008080) |
| 0.0 | 20.4 | GO:0008270 | zinc ion binding(GO:0008270) |
| 0.0 | 0.9 | GO:0003727 | single-stranded RNA binding(GO:0003727) |
| 0.0 | 1.0 | GO:0042169 | SH2 domain binding(GO:0042169) |
| 0.0 | 65.7 | GO:0003676 | nucleic acid binding(GO:0003676) |
| 0.0 | 0.7 | GO:0001965 | G-protein alpha-subunit binding(GO:0001965) |
| 0.0 | 0.1 | GO:0004385 | guanylate kinase activity(GO:0004385) |
| 0.0 | 0.8 | GO:0042605 | peptide antigen binding(GO:0042605) |
| 0.0 | 0.2 | GO:0070008 | serine-type exopeptidase activity(GO:0070008) |
| 0.0 | 0.1 | GO:0016453 | C-acetyltransferase activity(GO:0016453) |
| 0.0 | 0.3 | GO:0036459 | thiol-dependent ubiquitinyl hydrolase activity(GO:0036459) |
| 0.0 | 1.5 | GO:0044389 | ubiquitin-like protein ligase binding(GO:0044389) |
| 0.0 | 0.3 | GO:0004623 | phospholipase A2 activity(GO:0004623) |
Gene overrepresentation in curated gene sets: canonical pathways category:
| Log-likelihood per target | Total log-likelihood | Term | Description |
|---|---|---|---|
| 2.5 | 42.3 | PID ERB GENOMIC PATHWAY | Validated nuclear estrogen receptor beta network |
| 1.5 | 19.0 | PID RANBP2 PATHWAY | Sumoylation by RanBP2 regulates transcriptional repression |
| 1.3 | 61.7 | PID AURORA B PATHWAY | Aurora B signaling |
| 1.3 | 21.5 | SA REG CASCADE OF CYCLIN EXPR | Expression of cyclins regulates progression through the cell cycle by activating cyclin-dependent kinases. |
| 1.1 | 63.0 | PID HEDGEHOG GLI PATHWAY | Hedgehog signaling events mediated by Gli proteins |
| 1.0 | 19.2 | PID DNA PK PATHWAY | DNA-PK pathway in nonhomologous end joining |
| 0.9 | 7.1 | SA G1 AND S PHASES | Cdk2, 4, and 6 bind cyclin D in G1, while cdk2/cyclin E promotes the G1/S transition. |
| 0.9 | 31.9 | PID PI3KCI AKT PATHWAY | Class I PI3K signaling events mediated by Akt |
| 0.8 | 73.4 | PID MYC ACTIV PATHWAY | Validated targets of C-MYC transcriptional activation |
| 0.7 | 7.8 | PID AVB3 INTEGRIN PATHWAY | Integrins in angiogenesis |
| 0.6 | 7.6 | PID MYC PATHWAY | C-MYC pathway |
| 0.5 | 8.9 | PID AURORA A PATHWAY | Aurora A signaling |
| 0.5 | 22.7 | PID PLK1 PATHWAY | PLK1 signaling events |
| 0.5 | 16.3 | PID ATM PATHWAY | ATM pathway |
| 0.5 | 17.1 | PID LIS1 PATHWAY | Lissencephaly gene (LIS1) in neuronal migration and development |
| 0.5 | 6.8 | PID HIF1A PATHWAY | Hypoxic and oxygen homeostasis regulation of HIF-1-alpha |
| 0.4 | 19.3 | NABA PROTEOGLYCANS | Genes encoding proteoglycans |
| 0.4 | 5.6 | PID ARF6 DOWNSTREAM PATHWAY | Arf6 downstream pathway |
| 0.4 | 11.6 | ST PHOSPHOINOSITIDE 3 KINASE PATHWAY | PI3K Pathway |
| 0.4 | 5.9 | PID SMAD2 3PATHWAY | Regulation of cytoplasmic and nuclear SMAD2/3 signaling |
| 0.4 | 2.4 | PID TCPTP PATHWAY | Signaling events mediated by TCPTP |
| 0.4 | 2.6 | SA PTEN PATHWAY | PTEN is a tumor suppressor that dephosphorylates the lipid messenger phosphatidylinositol triphosphate. |
| 0.4 | 5.9 | PID HDAC CLASSIII PATHWAY | Signaling events mediated by HDAC Class III |
| 0.4 | 9.9 | PID PI3K PLC TRK PATHWAY | Trk receptor signaling mediated by PI3K and PLC-gamma |
| 0.4 | 8.8 | PID HIF2PATHWAY | HIF-2-alpha transcription factor network |
| 0.4 | 10.8 | PID P53 REGULATION PATHWAY | p53 pathway |
| 0.3 | 2.8 | ST IL 13 PATHWAY | Interleukin 13 (IL-13) Pathway |
| 0.3 | 10.4 | PID ALPHA SYNUCLEIN PATHWAY | Alpha-synuclein signaling |
| 0.3 | 4.8 | PID AJDISS 2PATHWAY | Posttranslational regulation of adherens junction stability and dissassembly |
| 0.3 | 11.6 | PID INSULIN PATHWAY | Insulin Pathway |
| 0.3 | 3.8 | PID WNT CANONICAL PATHWAY | Canonical Wnt signaling pathway |
| 0.2 | 14.1 | PID P73PATHWAY | p73 transcription factor network |
| 0.2 | 6.0 | PID EPHA FWDPATHWAY | EPHA forward signaling |
| 0.2 | 3.4 | PID S1P S1P3 PATHWAY | S1P3 pathway |
| 0.2 | 13.5 | PID AP1 PATHWAY | AP-1 transcription factor network |
| 0.2 | 5.1 | ST WNT CA2 CYCLIC GMP PATHWAY | Wnt/Ca2+/cyclic GMP signaling. |
| 0.2 | 6.9 | PID FANCONI PATHWAY | Fanconi anemia pathway |
| 0.2 | 5.5 | PID ERBB1 INTERNALIZATION PATHWAY | Internalization of ErbB1 |
| 0.1 | 4.8 | PID REG GR PATHWAY | Glucocorticoid receptor regulatory network |
| 0.1 | 5.7 | PID HDAC CLASSI PATHWAY | Signaling events mediated by HDAC Class I |
| 0.1 | 1.5 | PID SYNDECAN 3 PATHWAY | Syndecan-3-mediated signaling events |
| 0.1 | 1.5 | ST P38 MAPK PATHWAY | p38 MAPK Pathway |
| 0.1 | 1.8 | ST GRANULE CELL SURVIVAL PATHWAY | Granule Cell Survival Pathway is a specific case of more general PAC1 Receptor Pathway. |
| 0.1 | 0.5 | PID HDAC CLASSII PATHWAY | Signaling events mediated by HDAC Class II |
| 0.1 | 1.8 | PID ATF2 PATHWAY | ATF-2 transcription factor network |
| 0.1 | 3.9 | PID BETA CATENIN NUC PATHWAY | Regulation of nuclear beta catenin signaling and target gene transcription |
| 0.1 | 0.7 | PID ATR PATHWAY | ATR signaling pathway |
| 0.0 | 0.8 | PID LPA4 PATHWAY | LPA4-mediated signaling events |
| 0.0 | 1.3 | PID HNF3B PATHWAY | FOXA2 and FOXA3 transcription factor networks |
| 0.0 | 0.2 | PID BARD1 PATHWAY | BARD1 signaling events |
| 0.0 | 0.9 | PID IL1 PATHWAY | IL1-mediated signaling events |
| 0.0 | 0.3 | PID INSULIN GLUCOSE PATHWAY | Insulin-mediated glucose transport |
| 0.0 | 0.4 | PID INTEGRIN4 PATHWAY | Alpha6 beta4 integrin-ligand interactions |
| 0.0 | 0.4 | PID ARF 3PATHWAY | Arf1 pathway |
| 0.0 | 0.9 | PID TRKR PATHWAY | Neurotrophic factor-mediated Trk receptor signaling |
| 0.0 | 0.4 | PID E2F PATHWAY | E2F transcription factor network |
| 0.0 | 0.4 | PID HIF1 TFPATHWAY | HIF-1-alpha transcription factor network |
Gene overrepresentation in curated gene sets: REACTOME pathways category:
| Log-likelihood per target | Total log-likelihood | Term | Description |
|---|---|---|---|
| 5.7 | 68.2 | REACTOME RECRUITMENT OF NUMA TO MITOTIC CENTROSOMES | Genes involved in Recruitment of NuMA to mitotic centrosomes |
| 2.7 | 5.4 | REACTOME NEF MEDIATED DOWNREGULATION OF MHC CLASS I COMPLEX CELL SURFACE EXPRESSION | Genes involved in Nef mediated downregulation of MHC class I complex cell surface expression |
| 2.6 | 15.4 | REACTOME MICRORNA MIRNA BIOGENESIS | Genes involved in MicroRNA (miRNA) Biogenesis |
| 2.4 | 35.5 | REACTOME MRNA DECAY BY 5 TO 3 EXORIBONUCLEASE | Genes involved in mRNA Decay by 5' to 3' Exoribonuclease |
| 2.3 | 35.0 | REACTOME VIRAL MESSENGER RNA SYNTHESIS | Genes involved in Viral Messenger RNA Synthesis |
| 1.9 | 67.4 | REACTOME ACTIVATION OF THE PRE REPLICATIVE COMPLEX | Genes involved in Activation of the pre-replicative complex |
| 1.8 | 19.5 | REACTOME SYNTHESIS OF PIPS AT THE LATE ENDOSOME MEMBRANE | Genes involved in Synthesis of PIPs at the late endosome membrane |
| 1.7 | 22.5 | REACTOME TANDEM PORE DOMAIN POTASSIUM CHANNELS | Genes involved in Tandem pore domain potassium channels |
| 1.6 | 30.6 | REACTOME HYALURONAN METABOLISM | Genes involved in Hyaluronan metabolism |
| 1.6 | 58.5 | REACTOME TRANSPORT OF MATURE MRNA DERIVED FROM AN INTRONLESS TRANSCRIPT | Genes involved in Transport of Mature mRNA Derived from an Intronless Transcript |
| 1.5 | 62.3 | REACTOME DEPOSITION OF NEW CENPA CONTAINING NUCLEOSOMES AT THE CENTROMERE | Genes involved in Deposition of New CENPA-containing Nucleosomes at the Centromere |
| 1.3 | 4.0 | REACTOME SLBP DEPENDENT PROCESSING OF REPLICATION DEPENDENT HISTONE PRE MRNAS | Genes involved in SLBP Dependent Processing of Replication-Dependent Histone Pre-mRNAs |
| 1.3 | 34.2 | REACTOME GABA SYNTHESIS RELEASE REUPTAKE AND DEGRADATION | Genes involved in GABA synthesis, release, reuptake and degradation |
| 1.3 | 16.6 | REACTOME MRNA DECAY BY 3 TO 5 EXORIBONUCLEASE | Genes involved in mRNA Decay by 3' to 5' Exoribonuclease |
| 1.2 | 3.7 | REACTOME UNWINDING OF DNA | Genes involved in Unwinding of DNA |
| 1.2 | 9.8 | REACTOME ASSOCIATION OF LICENSING FACTORS WITH THE PRE REPLICATIVE COMPLEX | Genes involved in Association of licensing factors with the pre-replicative complex |
| 1.2 | 16.3 | REACTOME BILE SALT AND ORGANIC ANION SLC TRANSPORTERS | Genes involved in Bile salt and organic anion SLC transporters |
| 1.1 | 7.8 | REACTOME REGULATION OF ORNITHINE DECARBOXYLASE ODC | Genes involved in Regulation of ornithine decarboxylase (ODC) |
| 1.1 | 29.0 | REACTOME CYTOSOLIC TRNA AMINOACYLATION | Genes involved in Cytosolic tRNA aminoacylation |
| 1.1 | 33.1 | REACTOME MEIOTIC RECOMBINATION | Genes involved in Meiotic Recombination |
| 1.1 | 23.4 | REACTOME G0 AND EARLY G1 | Genes involved in G0 and Early G1 |
| 1.1 | 18.0 | REACTOME RESOLUTION OF AP SITES VIA THE SINGLE NUCLEOTIDE REPLACEMENT PATHWAY | Genes involved in Resolution of AP sites via the single-nucleotide replacement pathway |
| 1.0 | 27.3 | REACTOME INSULIN RECEPTOR RECYCLING | Genes involved in Insulin receptor recycling |
| 1.0 | 75.4 | REACTOME MITOTIC PROMETAPHASE | Genes involved in Mitotic Prometaphase |
| 1.0 | 18.0 | REACTOME SYNTHESIS OF VERY LONG CHAIN FATTY ACYL COAS | Genes involved in Synthesis of very long-chain fatty acyl-CoAs |
| 1.0 | 64.6 | REACTOME RECRUITMENT OF MITOTIC CENTROSOME PROTEINS AND COMPLEXES | Genes involved in Recruitment of mitotic centrosome proteins and complexes |
| 1.0 | 11.8 | REACTOME PRESYNAPTIC NICOTINIC ACETYLCHOLINE RECEPTORS | Genes involved in Presynaptic nicotinic acetylcholine receptors |
| 0.9 | 14.6 | REACTOME EARLY PHASE OF HIV LIFE CYCLE | Genes involved in Early Phase of HIV Life Cycle |
| 0.9 | 16.2 | REACTOME CITRIC ACID CYCLE TCA CYCLE | Genes involved in Citric acid cycle (TCA cycle) |
| 0.9 | 4.4 | REACTOME SYNTHESIS SECRETION AND DEACYLATION OF GHRELIN | Genes involved in Synthesis, Secretion, and Deacylation of Ghrelin |
| 0.9 | 28.2 | REACTOME PIP3 ACTIVATES AKT SIGNALING | Genes involved in PIP3 activates AKT signaling |
| 0.9 | 10.2 | REACTOME MTORC1 MEDIATED SIGNALLING | Genes involved in mTORC1-mediated signalling |
| 0.8 | 5.8 | REACTOME MITOTIC G2 G2 M PHASES | Genes involved in Mitotic G2-G2/M phases |
| 0.8 | 12.4 | REACTOME FORMATION OF ATP BY CHEMIOSMOTIC COUPLING | Genes involved in Formation of ATP by chemiosmotic coupling |
| 0.7 | 23.5 | REACTOME ASSOCIATION OF TRIC CCT WITH TARGET PROTEINS DURING BIOSYNTHESIS | Genes involved in Association of TriC/CCT with target proteins during biosynthesis |
| 0.7 | 3.6 | REACTOME ABORTIVE ELONGATION OF HIV1 TRANSCRIPT IN THE ABSENCE OF TAT | Genes involved in Abortive elongation of HIV-1 transcript in the absence of Tat |
| 0.7 | 7.9 | REACTOME CS DS DEGRADATION | Genes involved in CS/DS degradation |
| 0.7 | 21.4 | REACTOME INHIBITION OF INSULIN SECRETION BY ADRENALINE NORADRENALINE | Genes involved in Inhibition of Insulin Secretion by Adrenaline/Noradrenaline |
| 0.7 | 12.3 | REACTOME MITOCHONDRIAL TRNA AMINOACYLATION | Genes involved in Mitochondrial tRNA aminoacylation |
| 0.7 | 3.3 | REACTOME FORMATION OF INCISION COMPLEX IN GG NER | Genes involved in Formation of incision complex in GG-NER |
| 0.6 | 10.1 | REACTOME FORMATION OF TRANSCRIPTION COUPLED NER TC NER REPAIR COMPLEX | Genes involved in Formation of transcription-coupled NER (TC-NER) repair complex |
| 0.6 | 13.2 | REACTOME PROLACTIN RECEPTOR SIGNALING | Genes involved in Prolactin receptor signaling |
| 0.6 | 25.9 | REACTOME MITOCHONDRIAL PROTEIN IMPORT | Genes involved in Mitochondrial Protein Import |
| 0.6 | 35.8 | REACTOME RESPIRATORY ELECTRON TRANSPORT | Genes involved in Respiratory electron transport |
| 0.6 | 1.8 | REACTOME ACYL CHAIN REMODELLING OF PG | Genes involved in Acyl chain remodelling of PG |
| 0.6 | 13.1 | REACTOME METABOLISM OF NON CODING RNA | Genes involved in Metabolism of non-coding RNA |
| 0.6 | 9.6 | REACTOME GABA A RECEPTOR ACTIVATION | Genes involved in GABA A receptor activation |
| 0.6 | 10.1 | REACTOME RNA POL II TRANSCRIPTION PRE INITIATION AND PROMOTER OPENING | Genes involved in RNA Polymerase II Transcription Pre-Initiation And Promoter Opening |
| 0.5 | 8.0 | REACTOME CREB PHOSPHORYLATION THROUGH THE ACTIVATION OF CAMKII | Genes involved in CREB phosphorylation through the activation of CaMKII |
| 0.5 | 14.6 | REACTOME MEIOSIS | Genes involved in Meiosis |
| 0.5 | 23.3 | REACTOME DNA REPAIR | Genes involved in DNA Repair |
| 0.4 | 7.6 | REACTOME RNA POL III TRANSCRIPTION TERMINATION | Genes involved in RNA Polymerase III Transcription Termination |
| 0.4 | 6.7 | REACTOME TRAFFICKING OF GLUR2 CONTAINING AMPA RECEPTORS | Genes involved in Trafficking of GluR2-containing AMPA receptors |
| 0.4 | 8.6 | REACTOME SEMA3A PAK DEPENDENT AXON REPULSION | Genes involved in Sema3A PAK dependent Axon repulsion |
| 0.4 | 3.6 | REACTOME THE ACTIVATION OF ARYLSULFATASES | Genes involved in The activation of arylsulfatases |
| 0.4 | 5.2 | REACTOME CYTOSOLIC SULFONATION OF SMALL MOLECULES | Genes involved in Cytosolic sulfonation of small molecules |
| 0.4 | 9.8 | REACTOME KINESINS | Genes involved in Kinesins |
| 0.4 | 4.3 | REACTOME LIGAND GATED ION CHANNEL TRANSPORT | Genes involved in Ligand-gated ion channel transport |
| 0.4 | 13.4 | REACTOME INTERACTION BETWEEN L1 AND ANKYRINS | Genes involved in Interaction between L1 and Ankyrins |
| 0.4 | 3.0 | REACTOME OXYGEN DEPENDENT PROLINE HYDROXYLATION OF HYPOXIA INDUCIBLE FACTOR ALPHA | Genes involved in Oxygen-dependent Proline Hydroxylation of Hypoxia-inducible Factor Alpha |
| 0.4 | 6.4 | REACTOME BMAL1 CLOCK NPAS2 ACTIVATES CIRCADIAN EXPRESSION | Genes involved in BMAL1:CLOCK/NPAS2 Activates Circadian Expression |
| 0.4 | 83.6 | REACTOME ANTIGEN PROCESSING UBIQUITINATION PROTEASOME DEGRADATION | Genes involved in Antigen processing: Ubiquitination & Proteasome degradation |
| 0.4 | 8.2 | REACTOME REGULATION OF GENE EXPRESSION IN BETA CELLS | Genes involved in Regulation of gene expression in beta cells |
| 0.4 | 1.1 | REACTOME INFLUENZA VIRAL RNA TRANSCRIPTION AND REPLICATION | Genes involved in Influenza Viral RNA Transcription and Replication |
| 0.4 | 5.5 | REACTOME FACILITATIVE NA INDEPENDENT GLUCOSE TRANSPORTERS | Genes involved in Facilitative Na+-independent glucose transporters |
| 0.3 | 1.4 | REACTOME PKA MEDIATED PHOSPHORYLATION OF CREB | Genes involved in PKA-mediated phosphorylation of CREB |
| 0.3 | 5.7 | REACTOME GLYCOGEN BREAKDOWN GLYCOGENOLYSIS | Genes involved in Glycogen breakdown (glycogenolysis) |
| 0.3 | 4.0 | REACTOME ELEVATION OF CYTOSOLIC CA2 LEVELS | Genes involved in Elevation of cytosolic Ca2+ levels |
| 0.3 | 2.0 | REACTOME IL 6 SIGNALING | Genes involved in Interleukin-6 signaling |
| 0.3 | 16.8 | REACTOME FORMATION OF THE TERNARY COMPLEX AND SUBSEQUENTLY THE 43S COMPLEX | Genes involved in Formation of the ternary complex, and subsequently, the 43S complex |
| 0.3 | 10.8 | REACTOME SPHINGOLIPID DE NOVO BIOSYNTHESIS | Genes involved in Sphingolipid de novo biosynthesis |
| 0.3 | 8.8 | REACTOME PYRIMIDINE METABOLISM | Genes involved in Pyrimidine metabolism |
| 0.3 | 9.2 | REACTOME POST TRANSLATIONAL MODIFICATION SYNTHESIS OF GPI ANCHORED PROTEINS | Genes involved in Post-translational modification: synthesis of GPI-anchored proteins |
| 0.3 | 9.1 | REACTOME G ALPHA Z SIGNALLING EVENTS | Genes involved in G alpha (z) signalling events |
| 0.3 | 2.8 | REACTOME JNK C JUN KINASES PHOSPHORYLATION AND ACTIVATION MEDIATED BY ACTIVATED HUMAN TAK1 | Genes involved in JNK (c-Jun kinases) phosphorylation and activation mediated by activated human TAK1 |
| 0.3 | 4.3 | REACTOME POST CHAPERONIN TUBULIN FOLDING PATHWAY | Genes involved in Post-chaperonin tubulin folding pathway |
| 0.3 | 8.8 | REACTOME SYNTHESIS OF PIPS AT THE PLASMA MEMBRANE | Genes involved in Synthesis of PIPs at the plasma membrane |
| 0.3 | 4.1 | REACTOME REGULATION OF IFNG SIGNALING | Genes involved in Regulation of IFNG signaling |
| 0.3 | 3.0 | REACTOME SYNTHESIS OF PIPS AT THE GOLGI MEMBRANE | Genes involved in Synthesis of PIPs at the Golgi membrane |
| 0.2 | 7.7 | REACTOME GLYCOLYSIS | Genes involved in Glycolysis |
| 0.2 | 4.5 | REACTOME CLASS C 3 METABOTROPIC GLUTAMATE PHEROMONE RECEPTORS | Genes involved in Class C/3 (Metabotropic glutamate/pheromone receptors) |
| 0.2 | 4.9 | REACTOME INWARDLY RECTIFYING K CHANNELS | Genes involved in Inwardly rectifying K+ channels |
| 0.2 | 4.9 | REACTOME SMAD2 SMAD3 SMAD4 HETEROTRIMER REGULATES TRANSCRIPTION | Genes involved in SMAD2/SMAD3:SMAD4 heterotrimer regulates transcription |
| 0.2 | 2.5 | REACTOME GLUTAMATE NEUROTRANSMITTER RELEASE CYCLE | Genes involved in Glutamate Neurotransmitter Release Cycle |
| 0.2 | 9.7 | REACTOME VOLTAGE GATED POTASSIUM CHANNELS | Genes involved in Voltage gated Potassium channels |
| 0.2 | 6.5 | REACTOME NOD1 2 SIGNALING PATHWAY | Genes involved in NOD1/2 Signaling Pathway |
| 0.2 | 3.1 | REACTOME ERK MAPK TARGETS | Genes involved in ERK/MAPK targets |
| 0.2 | 0.9 | REACTOME RETROGRADE NEUROTROPHIN SIGNALLING | Genes involved in Retrograde neurotrophin signalling |
| 0.2 | 4.8 | REACTOME SPHINGOLIPID METABOLISM | Genes involved in Sphingolipid metabolism |
| 0.1 | 1.5 | REACTOME NRIF SIGNALS CELL DEATH FROM THE NUCLEUS | Genes involved in NRIF signals cell death from the nucleus |
| 0.1 | 1.5 | REACTOME SIGNALING BY FGFR1 FUSION MUTANTS | Genes involved in Signaling by FGFR1 fusion mutants |
| 0.1 | 1.7 | REACTOME THROMBIN SIGNALLING THROUGH PROTEINASE ACTIVATED RECEPTORS PARS | Genes involved in Thrombin signalling through proteinase activated receptors (PARs) |
| 0.1 | 5.7 | REACTOME GOLGI ASSOCIATED VESICLE BIOGENESIS | Genes involved in Golgi Associated Vesicle Biogenesis |
| 0.1 | 8.4 | REACTOME NONSENSE MEDIATED DECAY ENHANCED BY THE EXON JUNCTION COMPLEX | Genes involved in Nonsense Mediated Decay Enhanced by the Exon Junction Complex |
| 0.1 | 3.4 | REACTOME TRANSLATION | Genes involved in Translation |
| 0.1 | 6.3 | REACTOME FACTORS INVOLVED IN MEGAKARYOCYTE DEVELOPMENT AND PLATELET PRODUCTION | Genes involved in Factors involved in megakaryocyte development and platelet production |
| 0.1 | 1.4 | REACTOME SIGNALING BY HIPPO | Genes involved in Signaling by Hippo |
| 0.1 | 1.1 | REACTOME REGULATION OF APOPTOSIS | Genes involved in Regulation of Apoptosis |
| 0.1 | 2.0 | REACTOME NUCLEAR SIGNALING BY ERBB4 | Genes involved in Nuclear signaling by ERBB4 |
| 0.1 | 1.2 | REACTOME DEADENYLATION DEPENDENT MRNA DECAY | Genes involved in Deadenylation-dependent mRNA decay |
| 0.1 | 0.8 | REACTOME EGFR DOWNREGULATION | Genes involved in EGFR downregulation |
| 0.1 | 1.0 | REACTOME ZINC TRANSPORTERS | Genes involved in Zinc transporters |
| 0.1 | 0.2 | REACTOME DOPAMINE NEUROTRANSMITTER RELEASE CYCLE | Genes involved in Dopamine Neurotransmitter Release Cycle |
| 0.1 | 2.6 | REACTOME INTEGRATION OF ENERGY METABOLISM | Genes involved in Integration of energy metabolism |
| 0.1 | 1.4 | REACTOME BIOSYNTHESIS OF THE N GLYCAN PRECURSOR DOLICHOL LIPID LINKED OLIGOSACCHARIDE LLO AND TRANSFER TO A NASCENT PROTEIN | Genes involved in Biosynthesis of the N-glycan precursor (dolichol lipid-linked oligosaccharide, LLO) and transfer to a nascent protein |
| 0.0 | 0.3 | REACTOME SIGNALING BY EGFR IN CANCER | Genes involved in Signaling by EGFR in Cancer |
| 0.0 | 0.3 | REACTOME TRANS GOLGI NETWORK VESICLE BUDDING | Genes involved in trans-Golgi Network Vesicle Budding |
| 0.0 | 2.7 | REACTOME CLASS B 2 SECRETIN FAMILY RECEPTORS | Genes involved in Class B/2 (Secretin family receptors) |
| 0.0 | 0.2 | REACTOME SPRY REGULATION OF FGF SIGNALING | Genes involved in Spry regulation of FGF signaling |
| 0.0 | 0.8 | REACTOME RNA POL I RNA POL III AND MITOCHONDRIAL TRANSCRIPTION | Genes involved in RNA Polymerase I, RNA Polymerase III, and Mitochondrial Transcription |
| 0.0 | 3.1 | REACTOME PEPTIDE LIGAND BINDING RECEPTORS | Genes involved in Peptide ligand-binding receptors |
| 0.0 | 0.1 | REACTOME ABACAVIR TRANSPORT AND METABOLISM | Genes involved in Abacavir transport and metabolism |
| 0.0 | 0.3 | REACTOME ACYL CHAIN REMODELLING OF PS | Genes involved in Acyl chain remodelling of PS |
| 0.0 | 0.2 | REACTOME PRE NOTCH PROCESSING IN GOLGI | Genes involved in Pre-NOTCH Processing in Golgi |