Project
GSE53960: rat RNA-Seq transcriptomic Bodymap
Navigation
Downloads
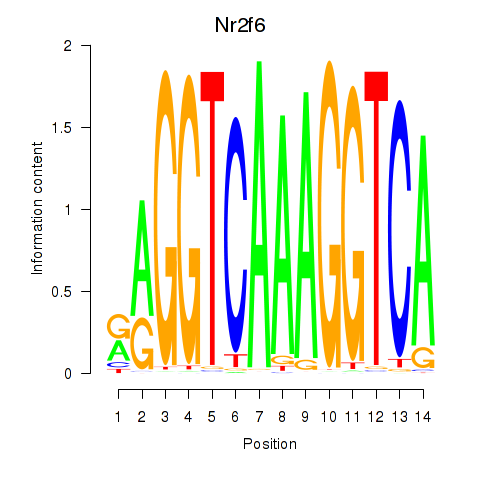
Results for Nr2f6
Z-value: 0.75
Motif logo
Transcription factors associated with Nr2f6
| Gene Symbol | Gene ID | Gene Info |
|---|---|---|
|
Nr2f6
|
ENSRNOG00000016892 | nuclear receptor subfamily 2, group F, member 6 |
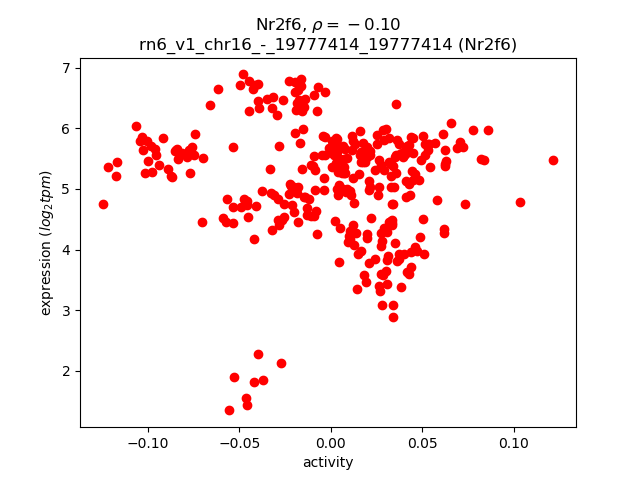
Activity-expression correlation:
| Gene | Promoter | Pearson corr. coef. | P-value | Plot |
|---|---|---|---|---|
| Nr2f6 | rn6_v1_chr16_-_19777414_19777414 | -0.10 | 8.1e-02 | Click! |
Activity profile of Nr2f6 motif
Sorted Z-values of Nr2f6 motif
| Promoter | Log-likelihood | Transcript | Gene | Gene Info |
|---|---|---|---|---|
| chr1_+_219144205 | 24.96 |
ENSRNOT00000083942
|
Unc93b1
|
unc-93 homolog B1 (C. elegans) |
| chr1_+_215628785 | 21.13 |
ENSRNOT00000054864
|
Lsp1
|
lymphocyte-specific protein 1 |
| chr1_+_100224401 | 21.07 |
ENSRNOT00000025846
|
Fv1
|
Friend virus susceptibility 1 |
| chrX_+_45420596 | 18.70 |
ENSRNOT00000051897
|
Sts
|
steroid sulfatase (microsomal), isozyme S |
| chr2_-_225107283 | 18.42 |
ENSRNOT00000055711
|
Slc44a3
|
solute carrier family 44, member 3 |
| chr10_-_55965216 | 17.60 |
ENSRNOT00000057058
|
Chd3
|
chromodomain helicase DNA binding protein 3 |
| chr1_-_7480825 | 17.59 |
ENSRNOT00000048754
|
Phactr2
|
phosphatase and actin regulator 2 |
| chr20_+_3351303 | 15.95 |
ENSRNOT00000080419
ENSRNOT00000001065 ENSRNOT00000086503 |
Atat1
|
alpha tubulin acetyltransferase 1 |
| chr7_+_11077411 | 15.87 |
ENSRNOT00000007117
|
S1pr4
|
sphingosine-1-phosphate receptor 4 |
| chr1_+_226091774 | 15.71 |
ENSRNOT00000027693
|
Fads3
|
fatty acid desaturase 3 |
| chr5_+_137257287 | 15.24 |
ENSRNOT00000037160
|
Elovl1
|
ELOVL fatty acid elongase 1 |
| chr18_-_16542165 | 14.88 |
ENSRNOT00000079381
|
Slc39a6
|
solute carrier family 39 member 6 |
| chr6_+_43001948 | 14.79 |
ENSRNOT00000007374
|
Hpcal1
|
hippocalcin-like 1 |
| chr1_+_85162452 | 14.36 |
ENSRNOT00000093347
|
Pak4
|
p21 (RAC1) activated kinase 4 |
| chr1_-_262014066 | 13.61 |
ENSRNOT00000087083
|
Hps1
|
HPS1, biogenesis of lysosomal organelles complex 3 subunit 1 |
| chr1_-_101651668 | 12.61 |
ENSRNOT00000028519
|
Fut2
|
fucosyltransferase 2 |
| chr3_+_62648447 | 12.51 |
ENSRNOT00000002111
|
Agps
|
alkylglycerone phosphate synthase |
| chr3_+_176494768 | 12.43 |
ENSRNOT00000040270
|
Col20a1
|
collagen type XX alpha 1 chain |
| chr20_-_3374344 | 12.34 |
ENSRNOT00000082999
|
Ppp1r18
|
protein phosphatase 1, regulatory subunit 18 |
| chr4_+_162437089 | 12.12 |
ENSRNOT00000038801
|
Clec2d2
|
C-type lectin domain family 2 member D2 |
| chr19_+_49637016 | 12.10 |
ENSRNOT00000016880
|
Bco1
|
beta-carotene oxygenase 1 |
| chr6_+_106496992 | 11.82 |
ENSRNOT00000086136
ENSRNOT00000058181 |
Rgs6
|
regulator of G-protein signaling 6 |
| chr1_-_100231460 | 11.73 |
ENSRNOT00000032200
|
Acpt
|
acid phosphatase, testicular |
| chr4_+_157659147 | 11.70 |
ENSRNOT00000048379
|
Iffo1
|
intermediate filament family orphan 1 |
| chr7_+_12471824 | 11.31 |
ENSRNOT00000068197
|
Sbno2
|
strawberry notch homolog 2 |
| chrX_+_156873849 | 11.24 |
ENSRNOT00000085410
|
Arhgap4
|
Rho GTPase activating protein 4 |
| chr9_+_81783349 | 11.17 |
ENSRNOT00000021548
|
Cnot9
|
CCR4-NOT transcription complex subunit 9 |
| chr8_+_55603968 | 10.67 |
ENSRNOT00000066848
|
Pou2af1
|
POU class 2 associating factor 1 |
| chr7_-_124620703 | 10.36 |
ENSRNOT00000017727
|
Scube1
|
signal peptide, CUB domain and EGF like domain containing 1 |
| chr8_+_127171537 | 10.28 |
ENSRNOT00000078625
ENSRNOT00000051290 ENSRNOT00000087753 |
Golga4
|
golgin A4 |
| chr3_-_161322289 | 9.97 |
ENSRNOT00000022594
|
Pltp
|
phospholipid transfer protein |
| chr1_-_206282575 | 9.95 |
ENSRNOT00000024974
|
Adam12
|
ADAM metallopeptidase domain 12 |
| chr17_+_23661429 | 9.86 |
ENSRNOT00000046523
|
Phactr1
|
phosphatase and actin regulator 1 |
| chr6_-_26051229 | 9.28 |
ENSRNOT00000005855
|
Bre
|
brain and reproductive organ-expressed (TNFRSF1A modulator) |
| chr18_+_59096643 | 9.18 |
ENSRNOT00000025325
|
Wdr7
|
WD repeat domain 7 |
| chr17_+_32516679 | 9.04 |
ENSRNOT00000032707
|
Serpinb9d
|
serine (or cysteine) peptidase inhibitor, clade B, member 9d |
| chr3_+_155297566 | 8.79 |
ENSRNOT00000021435
ENSRNOT00000084866 |
Dhx35
|
DEAH-box helicase 35 |
| chr7_-_117605141 | 8.74 |
ENSRNOT00000035199
|
Fbxl6
|
F-box and leucine-rich repeat protein 6 |
| chrX_+_15610230 | 8.74 |
ENSRNOT00000012880
|
Ccdc120
|
coiled-coil domain containing 120 |
| chr13_+_89774764 | 8.67 |
ENSRNOT00000005619
|
Arhgap30
|
Rho GTPase activating protein 30 |
| chr4_+_150199627 | 8.55 |
ENSRNOT00000052259
|
AABR07061871.1
|
|
| chr5_+_137257637 | 8.36 |
ENSRNOT00000093001
|
Elovl1
|
ELOVL fatty acid elongase 1 |
| chr5_-_102743417 | 8.26 |
ENSRNOT00000067389
|
Bnc2
|
basonuclin 2 |
| chr2_+_86914989 | 8.18 |
ENSRNOT00000085164
ENSRNOT00000081966 |
LOC100360380
|
zinc finger protein 457-like |
| chr5_+_173640780 | 8.03 |
ENSRNOT00000027476
|
Perm1
|
PPARGC1 and ESRR induced regulator, muscle 1 |
| chr14_+_85230648 | 7.88 |
ENSRNOT00000089866
|
Ap1b1
|
adaptor-related protein complex 1, beta 1 subunit |
| chr8_+_99880073 | 7.88 |
ENSRNOT00000010765
|
Plscr4
|
phospholipid scramblase 4 |
| chr12_-_24537313 | 7.81 |
ENSRNOT00000001975
|
Baz1b
|
bromodomain adjacent to zinc finger domain, 1B |
| chr6_-_128690741 | 7.80 |
ENSRNOT00000035826
|
Syne3
|
spectrin repeat containing, nuclear envelope family member 3 |
| chr5_-_137238354 | 7.79 |
ENSRNOT00000039235
|
Szt2
|
seizure threshold 2 homolog (mouse) |
| chr1_-_144601327 | 7.66 |
ENSRNOT00000029244
ENSRNOT00000078144 |
Saxo2
|
stabilizer of axonemal microtubules 2 |
| chr1_+_85192174 | 7.64 |
ENSRNOT00000026966
|
Pak4
|
p21 (RAC1) activated kinase 4 |
| chr6_+_44230985 | 7.57 |
ENSRNOT00000005858
|
Kidins220
|
kinase D-interacting substrate 220 |
| chr1_-_163814364 | 7.53 |
ENSRNOT00000067026
|
RGD1561870
|
similar to ribosomal protein L27 |
| chr18_-_68983619 | 7.51 |
ENSRNOT00000014670
|
LOC361346
|
similar to chromosome 18 open reading frame 54 |
| chr6_+_10348308 | 7.48 |
ENSRNOT00000034991
|
Epas1
|
endothelial PAS domain protein 1 |
| chr4_+_162292305 | 7.44 |
ENSRNOT00000010098
|
Clec2d
|
C-type lectin domain family 2, member D |
| chr12_-_18526250 | 7.43 |
ENSRNOT00000001791
|
Asmt
|
acetylserotonin O-methyltransferase |
| chr4_+_14109864 | 7.37 |
ENSRNOT00000076349
|
RGD1565355
|
similar to fatty acid translocase/CD36 |
| chr17_+_42302540 | 7.36 |
ENSRNOT00000025389
|
Gmnn
|
geminin, DNA replication inhibitor |
| chr14_+_46001849 | 7.31 |
ENSRNOT00000076611
|
Rell1
|
RELT-like 1 |
| chr3_+_161272385 | 7.23 |
ENSRNOT00000021052
|
Zswim3
|
zinc finger, SWIM-type containing 3 |
| chr17_+_9595761 | 7.20 |
ENSRNOT00000089990
|
Fam193b
|
family with sequence similarity 193, member B |
| chr17_+_55065621 | 7.05 |
ENSRNOT00000086342
|
Zfp438
|
zinc finger protein 438 |
| chr7_-_127081704 | 7.04 |
ENSRNOT00000055893
|
LOC108351584
|
uncharacterized LOC108351584 |
| chr1_-_262013619 | 6.83 |
ENSRNOT00000021278
|
Hps1
|
HPS1, biogenesis of lysosomal organelles complex 3 subunit 1 |
| chr7_+_35070284 | 6.51 |
ENSRNOT00000009578
|
Nr2c1
|
nuclear receptor subfamily 2, group C, member 1 |
| chr5_-_171710312 | 6.41 |
ENSRNOT00000076044
ENSRNOT00000071280 ENSRNOT00000072059 ENSRNOT00000077015 |
Prdm16
|
PR/SET domain 16 |
| chr14_+_1463359 | 6.38 |
ENSRNOT00000070834
|
Csf2ra
|
colony stimulating factor 2 receptor alpha subunit |
| chr15_-_14510828 | 6.16 |
ENSRNOT00000039347
|
Sntn
|
sentan, cilia apical structure protein |
| chr6_+_123361864 | 6.08 |
ENSRNOT00000057577
|
AABR07065353.1
|
|
| chr4_+_117215064 | 6.07 |
ENSRNOT00000020909
|
Smyd5
|
SMYD family member 5 |
| chr2_+_40554146 | 5.88 |
ENSRNOT00000015138
|
Pde4d
|
phosphodiesterase 4D |
| chr2_+_3662763 | 5.86 |
ENSRNOT00000017828
|
Mctp1
|
multiple C2 and transmembrane domain containing 1 |
| chr1_+_89491654 | 5.78 |
ENSRNOT00000028632
|
Lgi4
|
leucine-rich repeat LGI family, member 4 |
| chr7_-_62162453 | 5.76 |
ENSRNOT00000010720
|
Cand1
|
cullin-associated and neddylation-dissociated 1 |
| chr10_-_90312386 | 5.73 |
ENSRNOT00000028445
|
Slc4a1
|
solute carrier family 4 member 1 |
| chr7_-_34485034 | 5.69 |
ENSRNOT00000007351
|
Snrpf
|
small nuclear ribonucleoprotein polypeptide F |
| chr11_-_70211701 | 5.58 |
ENSRNOT00000076114
|
Muc13
|
mucin 13, cell surface associated |
| chr8_+_61671513 | 5.55 |
ENSRNOT00000091128
|
Ptpn9
|
protein tyrosine phosphatase, non-receptor type 9 |
| chr20_-_29738506 | 5.54 |
ENSRNOT00000000697
|
Chst3
|
carbohydrate sulfotransferase 3 |
| chr1_+_226573105 | 5.51 |
ENSRNOT00000028074
|
Cpsf7
|
cleavage and polyadenylation specific factor 7 |
| chr5_+_129257429 | 5.49 |
ENSRNOT00000072396
|
Ttc39a
|
tetratricopeptide repeat domain 39A |
| chr13_-_90589466 | 5.35 |
ENSRNOT00000070812
|
Pea15
|
phosphoprotein enriched in astrocytes 15 |
| chr1_+_144601410 | 5.34 |
ENSRNOT00000047408
|
Efl1
|
elongation factor like GTPase 1 |
| chr20_+_4530342 | 5.30 |
ENSRNOT00000076352
ENSRNOT00000000478 ENSRNOT00000075925 |
Nelfe
|
negative elongation factor complex member E |
| chr7_+_118490345 | 5.28 |
ENSRNOT00000046227
|
LOC108348145
|
zinc finger protein 7-like |
| chr14_+_84465515 | 5.25 |
ENSRNOT00000035591
|
Osm
|
oncostatin M |
| chr14_+_1462358 | 5.23 |
ENSRNOT00000077243
|
Csf2ra
|
colony stimulating factor 2 receptor alpha subunit |
| chr20_-_12938891 | 5.20 |
ENSRNOT00000017141
|
RGD1564149
|
similar to Protein C21orf58 |
| chr17_-_87826421 | 5.16 |
ENSRNOT00000068156
|
Arhgap21
|
Rho GTPase activating protein 21 |
| chr15_-_45947030 | 5.14 |
ENSRNOT00000035888
|
Ints6
|
integrator complex subunit 6 |
| chr1_+_79982639 | 5.03 |
ENSRNOT00000071916
|
Dmwd
|
dystrophia myotonica, WD repeat containing |
| chr7_-_12777901 | 4.93 |
ENSRNOT00000017245
|
Tmem259
|
transmembrane protein 259 |
| chr7_+_127081978 | 4.90 |
ENSRNOT00000022945
|
Tbc1d22a
|
TBC1 domain family, member 22a |
| chr1_-_80864846 | 4.80 |
ENSRNOT00000074412
|
Igsf23
|
immunoglobulin superfamily, member 23 |
| chr10_+_43538160 | 4.76 |
ENSRNOT00000089217
|
Cnot8
|
CCR4-NOT transcription complex, subunit 8 |
| chr1_+_225129097 | 4.74 |
ENSRNOT00000026938
|
Eml3
|
echinoderm microtubule associated protein like 3 |
| chr6_+_26537707 | 4.72 |
ENSRNOT00000050102
|
Zfp513
|
zinc finger protein 513 |
| chr6_+_123034304 | 4.50 |
ENSRNOT00000078938
|
Cpg1
|
candidate plasticity gene 1 |
| chr1_-_80630038 | 4.49 |
ENSRNOT00000025281
|
Tomm40
|
translocase of outer mitochondrial membrane 40 |
| chr7_+_35069814 | 4.47 |
ENSRNOT00000089228
|
Nr2c1
|
nuclear receptor subfamily 2, group C, member 1 |
| chr13_-_48284408 | 4.45 |
ENSRNOT00000085967
|
Srgap2
|
SLIT-ROBO Rho GTPase activating protein 2 |
| chr2_-_196304169 | 4.43 |
ENSRNOT00000028639
|
Scnm1
|
sodium channel modifier 1 |
| chr1_-_8878136 | 4.41 |
ENSRNOT00000064836
ENSRNOT00000075850 |
Vta1
|
vesicle trafficking 1 |
| chr3_-_3691972 | 4.38 |
ENSRNOT00000061735
|
Qsox2
|
quiescin sulfhydryl oxidase 2 |
| chr9_-_83253458 | 4.36 |
ENSRNOT00000041689
|
Epha4
|
Eph receptor A4 |
| chr15_-_43733182 | 4.31 |
ENSRNOT00000015318
|
Ppp2r2a
|
protein phosphatase 2, regulatory subunit B, alpha |
| chr18_-_410098 | 4.26 |
ENSRNOT00000084138
|
LOC102546764
|
cx9C motif-containing protein 4-like |
| chr19_-_37675077 | 4.23 |
ENSRNOT00000031033
|
Enkd1
|
enkurin domain containing 1 |
| chr1_-_224986291 | 4.06 |
ENSRNOT00000026284
|
Taf6l
|
TATA-box binding protein associated factor 6 like |
| chr20_-_5533600 | 3.98 |
ENSRNOT00000072319
|
Cuta
|
cutA divalent cation tolerance homolog |
| chr12_+_6403940 | 3.82 |
ENSRNOT00000083484
|
B3glct
|
beta 3-glucosyltransferase |
| chr12_+_51937175 | 3.65 |
ENSRNOT00000056780
|
Pus1
|
pseudouridylate synthase 1 |
| chr9_+_42620006 | 3.63 |
ENSRNOT00000019966
|
Hs6st1
|
heparan sulfate 6-O-sulfotransferase 1 |
| chr2_-_80293181 | 3.52 |
ENSRNOT00000016111
|
Otulin
|
OTU deubiquitinase with linear linkage specificity |
| chr2_+_196304492 | 3.52 |
ENSRNOT00000028640
|
Lysmd1
|
LysM domain containing 1 |
| chr3_+_154507035 | 3.45 |
ENSRNOT00000017265
|
Rprd1b
|
regulation of nuclear pre-mRNA domain containing 1B |
| chr1_+_265904566 | 3.42 |
ENSRNOT00000086041
ENSRNOT00000036156 |
Gbf1
|
golgi brefeldin A resistant guanine nucleotide exchange factor 1 |
| chr7_-_117688187 | 3.34 |
ENSRNOT00000019707
|
Vps28
|
VPS28, ESCRT-I subunit |
| chr1_-_22269831 | 3.18 |
ENSRNOT00000081804
|
Stx7
|
syntaxin 7 |
| chr10_+_3227160 | 3.18 |
ENSRNOT00000088075
|
Ntan1
|
N-terminal asparagine amidase |
| chr13_-_44345735 | 3.13 |
ENSRNOT00000005006
|
Tmem163
|
transmembrane protein 163 |
| chr9_+_69953440 | 3.09 |
ENSRNOT00000034740
|
Eef1b2
|
eukaryotic translation elongation factor 1 beta 2 |
| chr20_+_11168298 | 2.99 |
ENSRNOT00000032240
|
Trappc10
|
trafficking protein particle complex 10 |
| chr2_+_44096061 | 2.93 |
ENSRNOT00000018438
|
Ankrd55
|
ankyrin repeat domain 55 |
| chr5_-_159577134 | 2.85 |
ENSRNOT00000011114
|
Crocc
|
ciliary rootlet coiled-coil, rootletin |
| chr18_+_68983545 | 2.84 |
ENSRNOT00000085317
|
Stard6
|
StAR-related lipid transfer domain containing 6 |
| chr2_+_189582991 | 2.78 |
ENSRNOT00000022627
|
Rab13
|
RAB13, member RAS oncogene family |
| chr7_-_14054639 | 2.72 |
ENSRNOT00000039852
|
Ilvbl
|
ilvB acetolactate synthase like |
| chr9_+_79659251 | 2.69 |
ENSRNOT00000021656
|
Xrcc5
|
X-ray repair cross complementing 5 |
| chr20_-_5533448 | 2.69 |
ENSRNOT00000000568
|
Cuta
|
cutA divalent cation tolerance homolog |
| chr13_-_89745835 | 2.61 |
ENSRNOT00000005352
|
Klhdc9
|
kelch domain containing 9 |
| chr3_+_151691515 | 2.60 |
ENSRNOT00000052236
|
AC118414.1
|
|
| chr4_-_6449949 | 2.44 |
ENSRNOT00000062026
|
Galntl5
|
polypeptide N-acetylgalactosaminyltransferase-like 5 |
| chr5_-_24320786 | 2.37 |
ENSRNOT00000061569
|
Ndufaf6
|
NADH:ubiquinone oxidoreductase complex assembly factor 6 |
| chr13_+_110511668 | 2.34 |
ENSRNOT00000006235
|
Nek2
|
NIMA-related kinase 2 |
| chr3_+_141068023 | 2.32 |
ENSRNOT00000036527
|
Kiz
|
kizuna centrosomal protein |
| chr1_+_47942800 | 2.30 |
ENSRNOT00000079312
|
Wtap
|
Wilms tumor 1 associated protein |
| chr10_+_89352835 | 2.24 |
ENSRNOT00000028060
|
Rpl27
|
ribosomal protein L27 |
| chr8_+_117246376 | 2.18 |
ENSRNOT00000074493
|
Ccdc71
|
coiled-coil domain containing 71 |
| chr3_+_140024043 | 2.13 |
ENSRNOT00000086409
|
Rin2
|
Ras and Rab interactor 2 |
| chr13_-_73622211 | 2.07 |
ENSRNOT00000005235
|
Cep350
|
centrosomal protein 350 |
| chr6_-_52401853 | 2.06 |
ENSRNOT00000075513
|
Cdhr3
|
cadherin-related family member 3 |
| chr2_+_239415046 | 1.93 |
ENSRNOT00000072196
|
Cxxc4
|
CXXC finger protein 4 |
| chr1_-_226049929 | 1.90 |
ENSRNOT00000007320
|
Best1
|
bestrophin 1 |
| chr10_-_12916784 | 1.83 |
ENSRNOT00000004589
|
Zfp13
|
zinc finger protein 13 |
| chr4_-_113988246 | 1.76 |
ENSRNOT00000013128
|
LOC103692166
|
WD repeat-containing protein 54 |
| chr1_-_154170409 | 1.70 |
ENSRNOT00000089014
|
Hikeshi
|
Hikeshi, heat shock protein nuclear import factor |
| chr12_-_6078411 | 1.64 |
ENSRNOT00000001197
|
Rxfp2
|
relaxin/insulin-like family peptide receptor 2 |
| chr19_-_55434252 | 1.64 |
ENSRNOT00000045052
|
Pabpn1l
|
poly(A)binding protein nuclear 1-like |
| chr1_+_185210922 | 1.62 |
ENSRNOT00000055120
|
Pik3c2a
|
phosphatidylinositol-4-phosphate 3-kinase, catalytic subunit type 2 alpha |
| chr17_-_49990982 | 1.60 |
ENSRNOT00000018458
ENSRNOT00000080628 |
Mplkip
|
M-phase specific PLK1 interacting protein |
| chr1_-_37957400 | 1.57 |
ENSRNOT00000085560
ENSRNOT00000079626 ENSRNOT00000071889 |
LOC102549842
|
zinc finger protein 91-like |
| chr16_+_74810938 | 1.53 |
ENSRNOT00000058091
|
Nek5
|
NIMA-related kinase 5 |
| chr1_+_47942500 | 1.35 |
ENSRNOT00000025936
|
Wtap
|
Wilms tumor 1 associated protein |
| chr7_-_123101851 | 1.32 |
ENSRNOT00000090984
ENSRNOT00000005837 |
Phf5a
|
PHD finger protein 5A |
| chr2_+_218834034 | 1.31 |
ENSRNOT00000018367
|
Dph5
|
diphthamide biosynthesis 5 |
| chr3_-_111037425 | 1.26 |
ENSRNOT00000085628
|
Ppp1r14d
|
protein phosphatase 1, regulatory (inhibitor) subunit 14D |
| chr1_+_255185629 | 1.23 |
ENSRNOT00000083002
|
Hectd2
|
HECT domain E3 ubiquitin protein ligase 2 |
| chr7_+_117951154 | 1.19 |
ENSRNOT00000060181
|
Znf7
|
zinc finger protein 7 |
| chr1_+_221612584 | 1.18 |
ENSRNOT00000090100
|
Atg2a
|
autophagy related 2A |
| chr12_-_37699616 | 1.08 |
ENSRNOT00000077803
|
RGD1563482
|
similar to hypothetical protein FLJ38663 |
| chr12_+_22026075 | 1.03 |
ENSRNOT00000029041
|
LOC100910838
|
neuronal tyrosine-phosphorylated phosphoinositide-3-kinase adapter 1-like |
| chr3_-_160922341 | 0.91 |
ENSRNOT00000029206
|
Tp53tg5
|
TP53 target 5 |
| chr1_-_89488223 | 0.85 |
ENSRNOT00000028624
|
Fxyd1
|
FXYD domain-containing ion transport regulator 1 |
| chr15_+_30525754 | 0.81 |
ENSRNOT00000086842
|
AABR07017745.2
|
|
| chr15_-_33218456 | 0.80 |
ENSRNOT00000017753
|
Ajuba
|
ajuba LIM protein |
| chr3_-_111037166 | 0.80 |
ENSRNOT00000017070
|
Ppp1r14d
|
protein phosphatase 1, regulatory (inhibitor) subunit 14D |
| chr18_+_61261418 | 0.65 |
ENSRNOT00000064250
|
Zfp532
|
zinc finger protein 532 |
| chr18_-_52017734 | 0.60 |
ENSRNOT00000081020
|
March3
|
membrane associated ring-CH-type finger 3 |
| chrX_-_128268285 | 0.58 |
ENSRNOT00000009755
ENSRNOT00000081880 |
Thoc2
|
THO complex 2 |
| chr2_-_187706300 | 0.43 |
ENSRNOT00000092349
ENSRNOT00000026414 |
Tmem79
|
transmembrane protein 79 |
| chr4_+_146455332 | 0.25 |
ENSRNOT00000009775
|
Hrh1
|
histamine receptor H 1 |
| chr9_-_27511176 | 0.13 |
ENSRNOT00000036813
|
LOC501110
|
similar to Glutathione S-transferase A1 (GTH1) (HA subunit 1) (GST-epsilon) (GSTA1-1) (GST class-alpha) |
| chr10_-_65692016 | 0.13 |
ENSRNOT00000085074
ENSRNOT00000038690 |
Slc13a2
|
solute carrier family 13 member 2 |
| chr13_+_99005142 | 0.12 |
ENSRNOT00000004293
|
Acbd3
|
acyl-CoA binding domain containing 3 |
| chr10_+_89635675 | 0.10 |
ENSRNOT00000028179
|
RGD1561590
|
similar to SAP18 |
| chr10_+_34975708 | 0.08 |
ENSRNOT00000064984
|
Nhp2
|
NHP2 ribonucleoprotein |
| chr11_+_74014983 | 0.08 |
ENSRNOT00000040884
|
NEWGENE_2724
|
glycoprotein V platelet |
| chr10_-_60942351 | 0.03 |
ENSRNOT00000026926
|
Olr1509
|
olfactory receptor 1509 |
| chr1_-_189666440 | 0.00 |
ENSRNOT00000019167
|
Dcun1d3
|
defective in cullin neddylation 1 domain containing 3 |
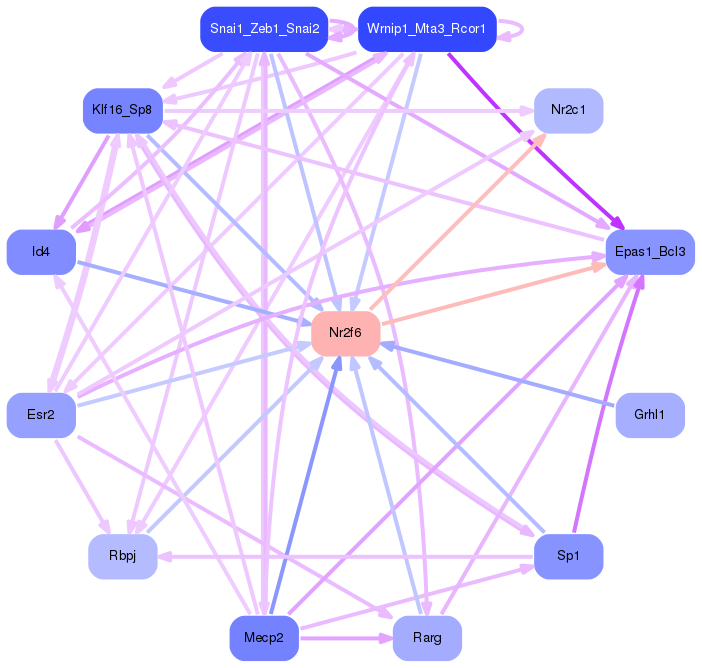
Network of associatons between targets according to the STRING database.

First level regulatory network of Nr2f6
Gene Ontology Analysis
Gene overrepresentation in biological process category:
| Log-likelihood per target | Total log-likelihood | Term | Description |
|---|---|---|---|
| 5.3 | 15.9 | GO:0071929 | alpha-tubulin acetylation(GO:0071929) |
| 3.8 | 11.3 | GO:0071348 | cellular response to interleukin-11(GO:0071348) |
| 3.6 | 25.0 | GO:2001184 | toll-like receptor 7 signaling pathway(GO:0034154) positive regulation of interleukin-12 secretion(GO:2001184) |
| 3.4 | 23.6 | GO:0035338 | fatty acid elongation, monounsaturated fatty acid(GO:0034625) long-chain fatty-acyl-CoA biosynthetic process(GO:0035338) |
| 3.3 | 10.0 | GO:0042360 | vitamin E metabolic process(GO:0042360) |
| 2.9 | 11.6 | GO:0038158 | granulocyte colony-stimulating factor signaling pathway(GO:0038158) |
| 2.6 | 20.4 | GO:1903232 | melanosome assembly(GO:1903232) |
| 2.5 | 7.4 | GO:0030186 | melatonin metabolic process(GO:0030186) |
| 2.5 | 7.4 | GO:0071163 | DNA replication preinitiation complex assembly(GO:0071163) |
| 2.2 | 11.2 | GO:2000327 | positive regulation of ligand-dependent nuclear receptor transcription coactivator activity(GO:2000327) |
| 2.1 | 12.5 | GO:0008611 | ether lipid biosynthetic process(GO:0008611) glycerol ether biosynthetic process(GO:0046504) ether biosynthetic process(GO:1901503) |
| 2.0 | 5.9 | GO:0086024 | adrenergic receptor signaling pathway involved in positive regulation of heart rate(GO:0086024) |
| 1.9 | 5.8 | GO:0010265 | SCF complex assembly(GO:0010265) |
| 1.8 | 11.0 | GO:0048386 | positive regulation of retinoic acid receptor signaling pathway(GO:0048386) |
| 1.5 | 7.5 | GO:0048625 | myoblast fate commitment(GO:0048625) |
| 1.5 | 4.4 | GO:0003363 | lamellipodium assembly involved in ameboidal cell migration(GO:0003363) extension of a leading process involved in cell motility in cerebral cortex radial glia guided migration(GO:0021816) |
| 1.5 | 4.4 | GO:2001106 | fasciculation of motor neuron axon(GO:0097156) regulation of Rho guanyl-nucleotide exchange factor activity(GO:2001106) |
| 1.4 | 14.9 | GO:0071578 | zinc II ion transmembrane import(GO:0071578) |
| 1.3 | 5.2 | GO:0038165 | oncostatin-M-mediated signaling pathway(GO:0038165) |
| 1.3 | 7.8 | GO:1901668 | regulation of superoxide dismutase activity(GO:1901668) |
| 1.3 | 5.2 | GO:0051684 | maintenance of Golgi location(GO:0051684) |
| 1.2 | 11.2 | GO:0010764 | negative regulation of fibroblast migration(GO:0010764) |
| 1.2 | 3.6 | GO:0015015 | heparan sulfate proteoglycan biosynthetic process, enzymatic modification(GO:0015015) |
| 1.2 | 3.5 | GO:1990108 | protein linear deubiquitination(GO:1990108) |
| 1.2 | 2.3 | GO:0030997 | regulation of centriole-centriole cohesion(GO:0030997) |
| 1.1 | 3.4 | GO:0035964 | COPI-coated vesicle budding(GO:0035964) |
| 1.1 | 15.9 | GO:0003376 | sphingosine-1-phosphate signaling pathway(GO:0003376) |
| 1.0 | 7.8 | GO:0048096 | chromatin-mediated maintenance of transcription(GO:0048096) |
| 1.0 | 7.8 | GO:0090286 | cytoskeletal anchoring at nuclear membrane(GO:0090286) |
| 0.9 | 2.8 | GO:1903566 | ciliary basal body organization(GO:0032053) positive regulation of protein localization to cilium(GO:1903566) |
| 0.9 | 2.8 | GO:1902463 | protein localization to cell leading edge(GO:1902463) |
| 0.9 | 6.4 | GO:0090336 | positive regulation of brown fat cell differentiation(GO:0090336) |
| 0.9 | 3.7 | GO:1990481 | mRNA pseudouridine synthesis(GO:1990481) |
| 0.9 | 12.6 | GO:0036065 | fucosylation(GO:0036065) |
| 0.8 | 3.3 | GO:0070086 | protein targeting to vacuole involved in ubiquitin-dependent protein catabolic process via the multivesicular body sorting pathway(GO:0043328) ubiquitin-dependent endocytosis(GO:0070086) |
| 0.8 | 1.6 | GO:0071579 | regulation of zinc ion transport(GO:0071579) |
| 0.8 | 3.2 | GO:1902683 | regulation of receptor localization to synapse(GO:1902683) |
| 0.8 | 5.3 | GO:0042256 | mature ribosome assembly(GO:0042256) |
| 0.7 | 12.1 | GO:0042574 | retinal metabolic process(GO:0042574) |
| 0.7 | 3.4 | GO:0070940 | dephosphorylation of RNA polymerase II C-terminal domain(GO:0070940) |
| 0.7 | 2.7 | GO:1904430 | negative regulation of t-circle formation(GO:1904430) |
| 0.6 | 5.3 | GO:1900364 | negative regulation of mRNA polyadenylation(GO:1900364) |
| 0.5 | 8.4 | GO:0000042 | protein targeting to Golgi(GO:0000042) |
| 0.5 | 7.6 | GO:0038180 | nerve growth factor signaling pathway(GO:0038180) |
| 0.5 | 5.5 | GO:0030206 | chondroitin sulfate biosynthetic process(GO:0030206) |
| 0.4 | 4.4 | GO:0071985 | multivesicular body sorting pathway(GO:0071985) |
| 0.4 | 7.9 | GO:0017121 | phospholipid scrambling(GO:0017121) |
| 0.4 | 3.7 | GO:0080009 | mRNA methylation(GO:0080009) |
| 0.4 | 5.6 | GO:0030277 | maintenance of gastrointestinal epithelium(GO:0030277) |
| 0.4 | 7.9 | GO:0048268 | clathrin coat assembly(GO:0048268) |
| 0.4 | 1.8 | GO:0010728 | regulation of hydrogen peroxide biosynthetic process(GO:0010728) |
| 0.4 | 4.9 | GO:1904294 | positive regulation of ERAD pathway(GO:1904294) |
| 0.3 | 18.7 | GO:0009268 | response to pH(GO:0009268) |
| 0.3 | 10.4 | GO:0045880 | positive regulation of smoothened signaling pathway(GO:0045880) |
| 0.3 | 2.6 | GO:0043928 | exonucleolytic nuclear-transcribed mRNA catabolic process involved in deadenylation-dependent decay(GO:0043928) |
| 0.3 | 0.9 | GO:1903797 | positive regulation of inorganic anion transmembrane transport(GO:1903797) |
| 0.3 | 8.3 | GO:0003416 | endochondral bone growth(GO:0003416) |
| 0.3 | 3.0 | GO:0034498 | early endosome to Golgi transport(GO:0034498) |
| 0.3 | 5.3 | GO:1902043 | positive regulation of extrinsic apoptotic signaling pathway via death domain receptors(GO:1902043) |
| 0.3 | 1.3 | GO:0017182 | peptidyl-diphthamide metabolic process(GO:0017182) peptidyl-diphthamide biosynthetic process from peptidyl-histidine(GO:0017183) |
| 0.3 | 5.1 | GO:0016180 | snRNA processing(GO:0016180) |
| 0.3 | 4.3 | GO:0070262 | peptidyl-serine dephosphorylation(GO:0070262) |
| 0.2 | 2.2 | GO:1904044 | response to aldosterone(GO:1904044) |
| 0.2 | 1.9 | GO:0030321 | transepithelial chloride transport(GO:0030321) |
| 0.2 | 5.8 | GO:0022011 | myelination in peripheral nervous system(GO:0022011) peripheral nervous system axon ensheathment(GO:0032292) |
| 0.2 | 5.7 | GO:0015701 | bicarbonate transport(GO:0015701) |
| 0.2 | 5.7 | GO:0000387 | spliceosomal snRNP assembly(GO:0000387) |
| 0.2 | 9.3 | GO:0045739 | positive regulation of DNA repair(GO:0045739) |
| 0.1 | 0.4 | GO:0042335 | cuticle development(GO:0042335) cornification(GO:0070268) |
| 0.1 | 0.8 | GO:0035331 | negative regulation of hippo signaling(GO:0035331) |
| 0.1 | 17.6 | GO:0006333 | chromatin assembly or disassembly(GO:0006333) |
| 0.1 | 2.1 | GO:0034453 | microtubule anchoring(GO:0034453) |
| 0.1 | 13.6 | GO:0060996 | dendritic spine development(GO:0060996) |
| 0.1 | 9.9 | GO:0043149 | contractile actin filament bundle assembly(GO:0030038) stress fiber assembly(GO:0043149) |
| 0.1 | 0.3 | GO:0007199 | G-protein coupled receptor signaling pathway coupled to cGMP nucleotide second messenger(GO:0007199) |
| 0.1 | 1.2 | GO:0044804 | nucleophagy(GO:0044804) |
| 0.1 | 11.7 | GO:0042476 | odontogenesis(GO:0042476) |
| 0.1 | 1.6 | GO:0001556 | oocyte maturation(GO:0001556) |
| 0.1 | 4.9 | GO:0031338 | regulation of vesicle fusion(GO:0031338) |
| 0.1 | 4.1 | GO:0043966 | histone H3 acetylation(GO:0043966) |
| 0.1 | 0.6 | GO:0010793 | regulation of mRNA export from nucleus(GO:0010793) |
| 0.1 | 1.1 | GO:0006415 | translational termination(GO:0006415) |
| 0.0 | 5.5 | GO:0035335 | peptidyl-tyrosine dephosphorylation(GO:0035335) |
| 0.0 | 6.0 | GO:0006633 | fatty acid biosynthetic process(GO:0006633) |
| 0.0 | 3.1 | GO:0006414 | translational elongation(GO:0006414) |
| 0.0 | 18.2 | GO:0043547 | positive regulation of GTPase activity(GO:0043547) |
| 0.0 | 2.4 | GO:0045454 | cell redox homeostasis(GO:0045454) |
| 0.0 | 4.9 | GO:0051262 | protein tetramerization(GO:0051262) |
| 0.0 | 9.0 | GO:0010951 | negative regulation of endopeptidase activity(GO:0010951) |
| 0.0 | 1.7 | GO:0034605 | cellular response to heat(GO:0034605) |
| 0.0 | 3.3 | GO:0016579 | protein deubiquitination(GO:0016579) |
| 0.0 | 1.5 | GO:0051155 | positive regulation of striated muscle cell differentiation(GO:0051155) |
| 0.0 | 4.7 | GO:0060041 | retina development in camera-type eye(GO:0060041) |
| 0.0 | 1.9 | GO:0030178 | negative regulation of Wnt signaling pathway(GO:0030178) |
| 0.0 | 0.1 | GO:0000454 | snoRNA guided rRNA pseudouridine synthesis(GO:0000454) |
| 0.0 | 2.3 | GO:0007051 | spindle organization(GO:0007051) |
| 0.0 | 2.4 | GO:0006486 | protein glycosylation(GO:0006486) macromolecule glycosylation(GO:0043413) |
Gene overrepresentation in cellular component category:
| Log-likelihood per target | Total log-likelihood | Term | Description |
|---|---|---|---|
| 4.1 | 20.4 | GO:0031085 | BLOC-3 complex(GO:0031085) |
| 4.0 | 15.9 | GO:0097427 | microtubule bundle(GO:0097427) |
| 2.3 | 25.0 | GO:0032009 | early phagosome(GO:0032009) |
| 2.2 | 11.2 | GO:0030015 | CCR4-NOT core complex(GO:0030015) |
| 1.5 | 7.5 | GO:0070552 | BRISC complex(GO:0070552) |
| 1.3 | 5.3 | GO:0032021 | NELF complex(GO:0032021) |
| 1.1 | 7.8 | GO:0034993 | microtubule organizing center attachment site(GO:0034992) LINC complex(GO:0034993) |
| 1.0 | 3.1 | GO:0005853 | eukaryotic translation elongation factor 1 complex(GO:0005853) |
| 0.9 | 5.7 | GO:0034715 | pICln-Sm protein complex(GO:0034715) |
| 0.8 | 14.9 | GO:0031258 | lamellipodium membrane(GO:0031258) |
| 0.8 | 17.6 | GO:0016581 | NuRD complex(GO:0016581) CHD-type complex(GO:0090545) |
| 0.7 | 3.5 | GO:0071797 | LUBAC complex(GO:0071797) |
| 0.7 | 2.7 | GO:0043564 | DNA-dependent protein kinase-DNA ligase 4 complex(GO:0005958) Ku70:Ku80 complex(GO:0043564) |
| 0.6 | 3.7 | GO:0036396 | MIS complex(GO:0036396) |
| 0.5 | 4.5 | GO:0005742 | mitochondrial outer membrane translocase complex(GO:0005742) |
| 0.4 | 3.2 | GO:0070820 | tertiary granule(GO:0070820) |
| 0.4 | 3.3 | GO:0000813 | ESCRT I complex(GO:0000813) |
| 0.4 | 4.4 | GO:0044327 | dendritic spine head(GO:0044327) |
| 0.3 | 4.8 | GO:0030014 | CCR4-NOT complex(GO:0030014) |
| 0.3 | 4.1 | GO:0030914 | STAGA complex(GO:0030914) |
| 0.3 | 5.1 | GO:0032039 | integrator complex(GO:0032039) |
| 0.3 | 11.8 | GO:0005834 | heterotrimeric G-protein complex(GO:0005834) |
| 0.3 | 5.5 | GO:0005849 | mRNA cleavage factor complex(GO:0005849) |
| 0.2 | 3.0 | GO:0030008 | TRAPP complex(GO:0030008) |
| 0.2 | 7.8 | GO:0005721 | pericentric heterochromatin(GO:0005721) |
| 0.2 | 7.9 | GO:0030131 | clathrin adaptor complex(GO:0030131) |
| 0.2 | 2.8 | GO:0032593 | insulin-responsive compartment(GO:0032593) |
| 0.2 | 2.8 | GO:0035253 | ciliary rootlet(GO:0035253) |
| 0.2 | 12.6 | GO:0032580 | Golgi cisterna membrane(GO:0032580) |
| 0.2 | 22.0 | GO:0005913 | cell-cell adherens junction(GO:0005913) |
| 0.2 | 4.3 | GO:0000159 | protein phosphatase type 2A complex(GO:0000159) |
| 0.1 | 5.9 | GO:0005891 | voltage-gated calcium channel complex(GO:0005891) |
| 0.1 | 3.1 | GO:0030285 | integral component of synaptic vesicle membrane(GO:0030285) intrinsic component of synaptic vesicle membrane(GO:0098563) |
| 0.1 | 5.7 | GO:0016235 | aggresome(GO:0016235) |
| 0.1 | 11.0 | GO:0016605 | PML body(GO:0016605) |
| 0.1 | 4.4 | GO:0044295 | axonal growth cone(GO:0044295) |
| 0.1 | 4.4 | GO:0030173 | integral component of Golgi membrane(GO:0030173) |
| 0.1 | 9.8 | GO:0022625 | cytosolic large ribosomal subunit(GO:0022625) |
| 0.1 | 5.7 | GO:0014704 | intercalated disc(GO:0014704) |
| 0.1 | 3.4 | GO:0016591 | DNA-directed RNA polymerase II, holoenzyme(GO:0016591) |
| 0.1 | 10.1 | GO:0071013 | catalytic step 2 spliceosome(GO:0071013) |
| 0.1 | 10.7 | GO:0090575 | RNA polymerase II transcription factor complex(GO:0090575) |
| 0.1 | 1.6 | GO:0005942 | phosphatidylinositol 3-kinase complex(GO:0005942) |
| 0.1 | 3.4 | GO:0005801 | cis-Golgi network(GO:0005801) |
| 0.1 | 4.2 | GO:0005881 | cytoplasmic microtubule(GO:0005881) |
| 0.1 | 11.2 | GO:0030426 | growth cone(GO:0030426) |
| 0.1 | 0.6 | GO:0000445 | THO complex(GO:0000347) THO complex part of transcription export complex(GO:0000445) |
| 0.1 | 3.6 | GO:0031903 | peroxisomal membrane(GO:0005778) microbody membrane(GO:0031903) |
| 0.1 | 9.2 | GO:0008021 | synaptic vesicle(GO:0008021) |
| 0.1 | 2.8 | GO:0034707 | chloride channel complex(GO:0034707) |
| 0.0 | 7.6 | GO:0005770 | late endosome(GO:0005770) |
| 0.0 | 3.9 | GO:0042579 | peroxisome(GO:0005777) microbody(GO:0042579) |
| 0.0 | 5.4 | GO:0005882 | intermediate filament(GO:0005882) |
| 0.0 | 13.2 | GO:0000139 | Golgi membrane(GO:0000139) |
| 0.0 | 2.3 | GO:0000794 | condensed nuclear chromosome(GO:0000794) |
| 0.0 | 12.6 | GO:0005789 | endoplasmic reticulum membrane(GO:0005789) |
| 0.0 | 0.6 | GO:0031901 | early endosome membrane(GO:0031901) |
| 0.0 | 2.0 | GO:0019897 | extrinsic component of plasma membrane(GO:0019897) |
| 0.0 | 4.1 | GO:0016607 | nuclear speck(GO:0016607) |
Gene overrepresentation in molecular function category:
| Log-likelihood per target | Total log-likelihood | Term | Description |
|---|---|---|---|
| 4.2 | 12.6 | GO:0008107 | galactoside 2-alpha-L-fucosyltransferase activity(GO:0008107) alpha-(1,2)-fucosyltransferase activity(GO:0031127) |
| 3.9 | 11.6 | GO:0051916 | granulocyte colony-stimulating factor binding(GO:0051916) |
| 2.4 | 23.6 | GO:0102338 | fatty acid elongase activity(GO:0009922) 3-oxo-arachidoyl-CoA synthase activity(GO:0102336) 3-oxo-cerotoyl-CoA synthase activity(GO:0102337) 3-oxo-lignoceronyl-CoA synthase activity(GO:0102338) |
| 2.3 | 15.9 | GO:0004468 | lysine N-acetyltransferase activity, acting on acetyl phosphate as donor(GO:0004468) |
| 1.8 | 25.0 | GO:0035325 | Toll-like receptor binding(GO:0035325) |
| 1.6 | 15.9 | GO:0038036 | sphingosine-1-phosphate receptor activity(GO:0038036) |
| 1.5 | 4.4 | GO:0016971 | flavin-linked sulfhydryl oxidase activity(GO:0016971) |
| 1.3 | 18.7 | GO:0008484 | sulfuric ester hydrolase activity(GO:0008484) |
| 1.0 | 22.0 | GO:0098641 | cadherin binding involved in cell-cell adhesion(GO:0098641) |
| 1.0 | 29.5 | GO:0004864 | protein phosphatase inhibitor activity(GO:0004864) |
| 0.9 | 5.5 | GO:0034481 | N-acetylglucosamine 6-O-sulfotransferase activity(GO:0001517) chondroitin sulfotransferase activity(GO:0034481) |
| 0.9 | 4.4 | GO:0042731 | PH domain binding(GO:0042731) |
| 0.6 | 7.5 | GO:0050897 | cobalt ion binding(GO:0050897) |
| 0.6 | 14.9 | GO:0005385 | zinc ion transmembrane transporter activity(GO:0005385) |
| 0.6 | 7.9 | GO:0042609 | CD4 receptor binding(GO:0042609) |
| 0.5 | 5.9 | GO:0031698 | beta-2 adrenergic receptor binding(GO:0031698) |
| 0.5 | 4.5 | GO:0015266 | protein channel activity(GO:0015266) |
| 0.5 | 2.7 | GO:0030976 | thiamine pyrophosphate binding(GO:0030976) |
| 0.4 | 12.1 | GO:0016702 | oxidoreductase activity, acting on single donors with incorporation of molecular oxygen, incorporation of two atoms of oxygen(GO:0016702) |
| 0.4 | 2.7 | GO:0051575 | 5'-deoxyribose-5-phosphate lyase activity(GO:0051575) |
| 0.4 | 7.4 | GO:0008171 | O-methyltransferase activity(GO:0008171) |
| 0.3 | 7.8 | GO:0070577 | lysine-acetylated histone binding(GO:0070577) |
| 0.3 | 3.2 | GO:0019869 | chloride channel inhibitor activity(GO:0019869) |
| 0.3 | 4.8 | GO:0004535 | poly(A)-specific ribonuclease activity(GO:0004535) |
| 0.3 | 5.7 | GO:0015106 | bicarbonate transmembrane transporter activity(GO:0015106) |
| 0.2 | 3.7 | GO:0009982 | pseudouridine synthase activity(GO:0009982) |
| 0.2 | 3.6 | GO:0034483 | heparan sulfate sulfotransferase activity(GO:0034483) |
| 0.2 | 4.6 | GO:0003993 | acid phosphatase activity(GO:0003993) |
| 0.2 | 24.2 | GO:0070035 | ATP-dependent helicase activity(GO:0008026) purine NTP-dependent helicase activity(GO:0070035) |
| 0.2 | 5.9 | GO:0005544 | calcium-dependent phospholipid binding(GO:0005544) |
| 0.2 | 9.3 | GO:0005164 | tumor necrosis factor receptor binding(GO:0005164) |
| 0.2 | 1.6 | GO:0035005 | 1-phosphatidylinositol-4-phosphate 3-kinase activity(GO:0035005) |
| 0.2 | 4.9 | GO:0071889 | 14-3-3 protein binding(GO:0071889) |
| 0.2 | 5.8 | GO:0017025 | TBP-class protein binding(GO:0017025) |
| 0.2 | 3.4 | GO:0000993 | RNA polymerase II core binding(GO:0000993) |
| 0.1 | 10.7 | GO:0000979 | RNA polymerase II core promoter sequence-specific DNA binding(GO:0000979) |
| 0.1 | 3.4 | GO:0005086 | ARF guanyl-nucleotide exchange factor activity(GO:0005086) |
| 0.1 | 3.1 | GO:0003746 | translation elongation factor activity(GO:0003746) |
| 0.1 | 39.1 | GO:0005096 | GTPase activator activity(GO:0005096) |
| 0.1 | 3.6 | GO:0071949 | FAD binding(GO:0071949) |
| 0.1 | 18.3 | GO:0042826 | histone deacetylase binding(GO:0042826) |
| 0.1 | 0.8 | GO:0045294 | alpha-catenin binding(GO:0045294) |
| 0.1 | 1.6 | GO:0016500 | protein-hormone receptor activity(GO:0016500) |
| 0.1 | 2.8 | GO:0034236 | protein kinase A catalytic subunit binding(GO:0034236) |
| 0.1 | 20.4 | GO:0005085 | guanyl-nucleotide exchange factor activity(GO:0005085) |
| 0.1 | 7.9 | GO:0030276 | clathrin binding(GO:0030276) |
| 0.1 | 6.7 | GO:0005507 | copper ion binding(GO:0005507) |
| 0.1 | 6.4 | GO:0033613 | activating transcription factor binding(GO:0033613) |
| 0.1 | 4.3 | GO:0019888 | protein phosphatase regulator activity(GO:0019888) |
| 0.1 | 1.1 | GO:0003747 | translation release factor activity(GO:0003747) translation termination factor activity(GO:0008079) |
| 0.1 | 9.9 | GO:0004222 | metalloendopeptidase activity(GO:0004222) |
| 0.1 | 9.0 | GO:0004867 | serine-type endopeptidase inhibitor activity(GO:0004867) |
| 0.1 | 13.9 | GO:0019902 | phosphatase binding(GO:0019902) |
| 0.1 | 9.5 | GO:0030165 | PDZ domain binding(GO:0030165) |
| 0.1 | 2.8 | GO:0019894 | kinesin binding(GO:0019894) |
| 0.1 | 0.3 | GO:0004969 | histamine receptor activity(GO:0004969) |
| 0.0 | 7.8 | GO:0051015 | actin filament binding(GO:0051015) |
| 0.0 | 11.9 | GO:0008017 | microtubule binding(GO:0008017) |
| 0.0 | 5.5 | GO:0004725 | protein tyrosine phosphatase activity(GO:0004725) |
| 0.0 | 3.5 | GO:0004843 | thiol-dependent ubiquitin-specific protease activity(GO:0004843) |
| 0.0 | 1.7 | GO:0030544 | Hsp70 protein binding(GO:0030544) |
| 0.0 | 2.2 | GO:0043022 | ribosome binding(GO:0043022) |
| 0.0 | 2.8 | GO:0005254 | chloride channel activity(GO:0005254) |
| 0.0 | 5.2 | GO:0008083 | growth factor activity(GO:0008083) |
| 0.0 | 6.2 | GO:0051020 | GTPase binding(GO:0051020) |
| 0.0 | 8.2 | GO:0030246 | carbohydrate binding(GO:0030246) |
| 0.0 | 6.3 | GO:0016757 | transferase activity, transferring glycosyl groups(GO:0016757) |
| 0.0 | 6.1 | GO:0003735 | structural constituent of ribosome(GO:0003735) |
| 0.0 | 9.6 | GO:0046982 | protein heterodimerization activity(GO:0046982) |
| 0.0 | 1.6 | GO:0030674 | protein binding, bridging(GO:0030674) |
| 0.0 | 0.1 | GO:0034513 | box H/ACA snoRNA binding(GO:0034513) |
| 0.0 | 1.3 | GO:0008757 | S-adenosylmethionine-dependent methyltransferase activity(GO:0008757) |
Gene overrepresentation in curated gene sets: canonical pathways category:
| Log-likelihood per target | Total log-likelihood | Term | Description |
|---|---|---|---|
| 1.1 | 15.9 | PID S1P S1P4 PATHWAY | S1P4 pathway |
| 0.8 | 21.1 | PID P38 MK2 PATHWAY | p38 signaling mediated by MAPKAP kinases |
| 0.7 | 21.6 | PID INTEGRIN A9B1 PATHWAY | Alpha9 beta1 integrin signaling events |
| 0.5 | 33.2 | SIG CHEMOTAXIS | Genes related to chemotaxis |
| 0.3 | 25.2 | PID HDAC CLASSI PATHWAY | Signaling events mediated by HDAC Class I |
| 0.2 | 12.1 | NABA COLLAGENS | Genes encoding collagen proteins |
| 0.2 | 4.4 | PID IL3 PATHWAY | IL3-mediated signaling events |
| 0.2 | 3.4 | PID ARF 3PATHWAY | Arf1 pathway |
| 0.2 | 7.9 | PID HNF3A PATHWAY | FOXA1 transcription factor network |
| 0.1 | 2.7 | PID DNA PK PATHWAY | DNA-PK pathway in nonhomologous end joining |
| 0.1 | 4.4 | PID EPHA FWDPATHWAY | EPHA forward signaling |
| 0.1 | 13.0 | NABA ECM AFFILIATED | Genes encoding proteins affiliated structurally or functionally to extracellular matrix proteins |
| 0.1 | 2.7 | PID HIF2PATHWAY | HIF-2-alpha transcription factor network |
| 0.1 | 4.3 | PID TGFBR PATHWAY | TGF-beta receptor signaling |
| 0.1 | 5.3 | PID P73PATHWAY | p73 transcription factor network |
| 0.1 | 1.9 | ST WNT BETA CATENIN PATHWAY | Wnt/beta-catenin Pathway |
| 0.1 | 1.6 | PID AVB3 INTEGRIN PATHWAY | Integrins in angiogenesis |
| 0.0 | 2.1 | PID MET PATHWAY | Signaling events mediated by Hepatocyte Growth Factor Receptor (c-Met) |
| 0.0 | 10.4 | NABA SECRETED FACTORS | Genes encoding secreted soluble factors |
| 0.0 | 3.5 | NABA ECM GLYCOPROTEINS | Genes encoding structural ECM glycoproteins |
Gene overrepresentation in curated gene sets: REACTOME pathways category:
| Log-likelihood per target | Total log-likelihood | Term | Description |
|---|---|---|---|
| 1.9 | 25.0 | REACTOME TRAFFICKING AND PROCESSING OF ENDOSOMAL TLR | Genes involved in Trafficking and processing of endosomal TLR |
| 1.9 | 18.7 | REACTOME THE ACTIVATION OF ARYLSULFATASES | Genes involved in The activation of arylsulfatases |
| 1.3 | 23.6 | REACTOME SYNTHESIS OF VERY LONG CHAIN FATTY ACYL COAS | Genes involved in Synthesis of very long-chain fatty acyl-CoAs |
| 1.0 | 22.0 | REACTOME ACTIVATION OF RAC | Genes involved in Activation of Rac |
| 1.0 | 7.9 | REACTOME NEF MEDIATED DOWNREGULATION OF MHC CLASS I COMPLEX CELL SURFACE EXPRESSION | Genes involved in Nef mediated downregulation of MHC class I complex cell surface expression |
| 0.8 | 14.9 | REACTOME ZINC TRANSPORTERS | Genes involved in Zinc transporters |
| 0.7 | 18.4 | REACTOME SYNTHESIS OF PC | Genes involved in Synthesis of PC |
| 0.6 | 3.3 | REACTOME MEMBRANE BINDING AND TARGETTING OF GAG PROTEINS | Genes involved in Membrane binding and targetting of GAG proteins |
| 0.5 | 5.7 | REACTOME SLBP DEPENDENT PROCESSING OF REPLICATION DEPENDENT HISTONE PRE MRNAS | Genes involved in SLBP Dependent Processing of Replication-Dependent Histone Pre-mRNAs |
| 0.4 | 7.4 | REACTOME ASSOCIATION OF LICENSING FACTORS WITH THE PRE REPLICATIVE COMPLEX | Genes involved in Association of licensing factors with the pre-replicative complex |
| 0.4 | 7.5 | REACTOME OXYGEN DEPENDENT PROLINE HYDROXYLATION OF HYPOXIA INDUCIBLE FACTOR ALPHA | Genes involved in Oxygen-dependent Proline Hydroxylation of Hypoxia-inducible Factor Alpha |
| 0.4 | 5.6 | REACTOME TERMINATION OF O GLYCAN BIOSYNTHESIS | Genes involved in Termination of O-glycan biosynthesis |
| 0.3 | 7.6 | REACTOME ARMS MEDIATED ACTIVATION | Genes involved in ARMS-mediated activation |
| 0.3 | 5.5 | REACTOME PROCESSING OF CAPPED INTRONLESS PRE MRNA | Genes involved in Processing of Capped Intronless Pre-mRNA |
| 0.3 | 10.8 | REACTOME IL RECEPTOR SHC SIGNALING | Genes involved in Interleukin receptor SHC signaling |
| 0.3 | 4.4 | REACTOME ENDOSOMAL SORTING COMPLEX REQUIRED FOR TRANSPORT ESCRT | Genes involved in Endosomal Sorting Complex Required For Transport (ESCRT) |
| 0.3 | 2.7 | REACTOME INTEGRATION OF PROVIRUS | Genes involved in Integration of provirus |
| 0.2 | 5.5 | REACTOME CHONDROITIN SULFATE BIOSYNTHESIS | Genes involved in Chondroitin sulfate biosynthesis |
| 0.2 | 11.2 | REACTOME NRAGE SIGNALS DEATH THROUGH JNK | Genes involved in NRAGE signals death through JNK |
| 0.2 | 4.8 | REACTOME DEADENYLATION OF MRNA | Genes involved in Deadenylation of mRNA |
| 0.2 | 5.9 | REACTOME DARPP 32 EVENTS | Genes involved in DARPP-32 events |
| 0.2 | 3.2 | REACTOME PROTEOLYTIC CLEAVAGE OF SNARE COMPLEX PROTEINS | Genes involved in Proteolytic cleavage of SNARE complex proteins |
| 0.1 | 4.4 | REACTOME SIGNALING BY ROBO RECEPTOR | Genes involved in Signaling by Robo receptor |
| 0.1 | 1.6 | REACTOME SYNTHESIS OF PIPS AT THE LATE ENDOSOME MEMBRANE | Genes involved in Synthesis of PIPs at the late endosome membrane |
| 0.1 | 27.7 | REACTOME G ALPHA I SIGNALLING EVENTS | Genes involved in G alpha (i) signalling events |
| 0.1 | 3.6 | REACTOME HS GAG BIOSYNTHESIS | Genes involved in HS-GAG biosynthesis |
| 0.1 | 9.9 | REACTOME SIGNALING BY EGFR IN CANCER | Genes involved in Signaling by EGFR in Cancer |
| 0.1 | 2.3 | REACTOME APC CDC20 MEDIATED DEGRADATION OF NEK2A | Genes involved in APC-Cdc20 mediated degradation of Nek2A |
| 0.1 | 1.6 | REACTOME HDL MEDIATED LIPID TRANSPORT | Genes involved in HDL-mediated lipid transport |
| 0.1 | 2.8 | REACTOME STEROID HORMONES | Genes involved in Steroid hormones |
| 0.1 | 8.7 | REACTOME SIGNALING BY RHO GTPASES | Genes involved in Signaling by Rho GTPases |
| 0.1 | 3.4 | REACTOME TRANS GOLGI NETWORK VESICLE BUDDING | Genes involved in trans-Golgi Network Vesicle Budding |
| 0.1 | 2.4 | REACTOME O LINKED GLYCOSYLATION OF MUCINS | Genes involved in O-linked glycosylation of mucins |
| 0.1 | 6.5 | REACTOME NONSENSE MEDIATED DECAY ENHANCED BY THE EXON JUNCTION COMPLEX | Genes involved in Nonsense Mediated Decay Enhanced by the Exon Junction Complex |
| 0.1 | 3.1 | REACTOME TRANSLATION | Genes involved in Translation |
| 0.0 | 5.7 | REACTOME TRANSPORT OF INORGANIC CATIONS ANIONS AND AMINO ACIDS OLIGOPEPTIDES | Genes involved in Transport of inorganic cations/anions and amino acids/oligopeptides |
| 0.0 | 1.6 | REACTOME PEPTIDE LIGAND BINDING RECEPTORS | Genes involved in Peptide ligand-binding receptors |
| 0.0 | 1.3 | REACTOME MRNA SPLICING | Genes involved in mRNA Splicing |