Project
GSE53960: rat RNA-Seq transcriptomic Bodymap
Navigation
Downloads
Results for Nfe2l2
Z-value: 0.99
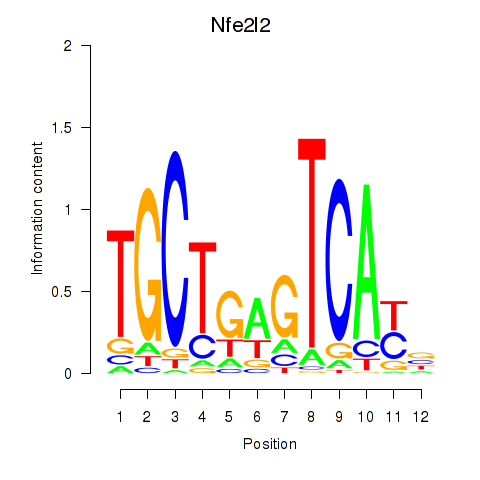
Motif logo
Transcription factors associated with Nfe2l2
| Gene Symbol | Gene ID | Gene Info |
|---|---|---|
|
Nfe2l2
|
ENSRNOG00000001548 | nuclear factor, erythroid 2-like 2 |
Activity-expression correlation:
| Gene | Promoter | Pearson corr. coef. | P-value | Plot |
|---|---|---|---|---|
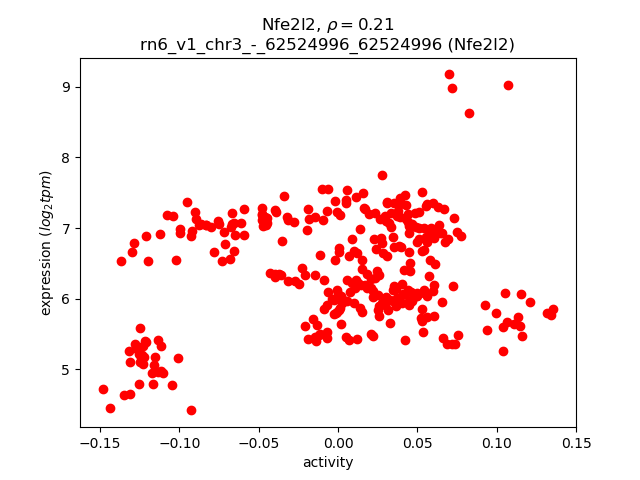
| Nfe2l2 | rn6_v1_chr3_-_62524996_62524996 | 0.21 | 1.7e-04 | Click! |
Activity profile of Nfe2l2 motif
Sorted Z-values of Nfe2l2 motif
| Promoter | Log-likelihood | Transcript | Gene | Gene Info |
|---|---|---|---|---|
| chr13_-_90602365 | 29.54 |
ENSRNOT00000009344
|
Casq1
|
calsequestrin 1 |
| chr15_+_2733114 | 28.38 |
ENSRNOT00000074545
|
LOC108348179
|
dual specificity protein phosphatase 13 |
| chr15_+_2526368 | 28.11 |
ENSRNOT00000048713
ENSRNOT00000074803 |
Dusp13
Dusp13
|
dual specificity phosphatase 13 dual specificity phosphatase 13 |
| chr19_+_52077109 | 27.91 |
ENSRNOT00000020225
|
Osgin1
|
oxidative stress induced growth inhibitor 1 |
| chr19_+_52077501 | 25.90 |
ENSRNOT00000079240
|
Osgin1
|
oxidative stress induced growth inhibitor 1 |
| chr1_-_198232344 | 25.61 |
ENSRNOT00000080988
|
Aldoa
|
aldolase, fructose-bisphosphate A |
| chr4_-_44136815 | 23.50 |
ENSRNOT00000086810
|
Tfec
|
transcription factor EC |
| chr20_+_295250 | 23.28 |
ENSRNOT00000000955
|
Clic2
|
chloride intracellular channel 2 |
| chr1_+_12915734 | 21.99 |
ENSRNOT00000089066
|
Txlnb
|
taxilin beta |
| chr5_+_90338795 | 19.91 |
ENSRNOT00000077864
ENSRNOT00000058882 |
LOC298139
|
similar to RIKEN cDNA 2310003M01 |
| chr9_+_10963723 | 19.54 |
ENSRNOT00000075424
|
Plin4
|
perilipin 4 |
| chr8_-_94368834 | 17.92 |
ENSRNOT00000078977
|
Me1
|
malic enzyme 1 |
| chr11_-_76888178 | 17.69 |
ENSRNOT00000049841
|
Ostn
|
osteocrin |
| chr1_+_101324652 | 16.40 |
ENSRNOT00000028116
|
Hrc
|
histidine rich calcium binding protein |
| chr8_+_33514042 | 16.34 |
ENSRNOT00000081614
ENSRNOT00000081525 |
Kcnj1
|
potassium voltage-gated channel subfamily J member 1 |
| chr3_+_146365092 | 15.63 |
ENSRNOT00000008865
|
Cst7
|
cystatin F |
| chr6_-_128690741 | 15.33 |
ENSRNOT00000035826
|
Syne3
|
spectrin repeat containing, nuclear envelope family member 3 |
| chr19_-_43848937 | 14.98 |
ENSRNOT00000044844
|
Ldhd
|
lactate dehydrogenase D |
| chr3_-_10371240 | 14.90 |
ENSRNOT00000012075
|
Ass1
|
argininosuccinate synthase 1 |
| chr2_+_225827504 | 14.86 |
ENSRNOT00000018343
|
Gclm
|
glutamate cysteine ligase, modifier subunit |
| chr16_-_14382641 | 13.08 |
ENSRNOT00000018723
|
Ghitm
|
growth hormone inducible transmembrane protein |
| chr5_-_157199441 | 12.96 |
ENSRNOT00000022559
|
Pla2g2f
|
phospholipase A2, group IIF |
| chr16_+_23317953 | 12.91 |
ENSRNOT00000075287
|
AABR07024972.1
|
|
| chr15_+_32832035 | 11.73 |
ENSRNOT00000060250
|
AABR07017902.1
|
|
| chr6_-_138508753 | 11.61 |
ENSRNOT00000006888
|
Ighm
|
immunoglobulin heavy constant mu |
| chr14_+_2050483 | 11.09 |
ENSRNOT00000000047
|
Slc26a1
|
solute carrier family 26 member 1 |
| chr6_+_42092467 | 10.95 |
ENSRNOT00000060499
|
E2f6
|
E2F transcription factor 6 |
| chr10_+_84309430 | 10.93 |
ENSRNOT00000030159
|
Skap1
|
src kinase associated phosphoprotein 1 |
| chr7_-_117267803 | 10.80 |
ENSRNOT00000082271
|
Plec
|
plectin |
| chr10_+_46906115 | 10.50 |
ENSRNOT00000034006
|
Alkbh5
|
alkB homolog 5, RNA demethylase |
| chr18_-_27749235 | 10.44 |
ENSRNOT00000026696
|
Hspa9
|
heat shock protein family A member 9 |
| chr16_-_20383337 | 10.39 |
ENSRNOT00000025977
|
Il12rb1
|
interleukin 12 receptor subunit beta 1 |
| chr7_-_117267402 | 9.82 |
ENSRNOT00000088945
|
Plec
|
plectin |
| chr1_+_79989019 | 9.80 |
ENSRNOT00000020428
|
Dmpk
|
dystrophia myotonica-protein kinase |
| chr10_+_55478298 | 9.70 |
ENSRNOT00000038454
|
Rnf222
|
ring finger protein 222 |
| chr8_+_71167305 | 9.70 |
ENSRNOT00000021337
|
Rbpms2
|
RNA binding protein with multiple splicing 2 |
| chr3_-_175426395 | 9.55 |
ENSRNOT00000082686
|
Psma7
|
proteasome subunit alpha 7 |
| chr3_+_147609095 | 9.14 |
ENSRNOT00000041456
|
Srxn1
|
sulfiredoxin 1 |
| chr20_+_31313018 | 9.13 |
ENSRNOT00000036719
|
Tysnd1
|
trypsin domain containing 1 |
| chr18_+_55666027 | 9.12 |
ENSRNOT00000045950
|
RGD1305184
|
similar to CDNA sequence BC023105 |
| chr15_+_44411865 | 9.08 |
ENSRNOT00000017566
|
Kctd9
|
potassium channel tetramerization domain containing 9 |
| chr15_-_35113678 | 8.99 |
ENSRNOT00000059677
|
Ctsg
|
cathepsin G |
| chr1_-_256013495 | 8.90 |
ENSRNOT00000023342
|
Ide
|
insulin degrading enzyme |
| chr8_-_130550388 | 8.79 |
ENSRNOT00000026355
|
Cyp8b1
|
cytochrome P450, family 8, subfamily b, polypeptide 1 |
| chr5_-_58445953 | 8.62 |
ENSRNOT00000046102
|
Vcp
|
valosin-containing protein |
| chr11_+_81796891 | 8.56 |
ENSRNOT00000058402
|
Crygs
|
crystallin, gamma S |
| chr3_+_147992754 | 8.49 |
ENSRNOT00000055412
|
Defb28
|
defensin beta 28 |
| chr7_+_119626637 | 8.38 |
ENSRNOT00000000201
|
Mpst
|
mercaptopyruvate sulfurtransferase |
| chr13_+_92264231 | 8.09 |
ENSRNOT00000066509
ENSRNOT00000004716 |
Spta1
|
spectrin, alpha, erythrocytic 1 |
| chr8_+_119228612 | 8.05 |
ENSRNOT00000078439
ENSRNOT00000043737 |
Lrrc2
|
leucine rich repeat containing 2 |
| chr20_+_3987230 | 8.00 |
ENSRNOT00000088615
|
Tap1
|
transporter 1, ATP binding cassette subfamily B member |
| chr5_+_135536413 | 7.90 |
ENSRNOT00000023132
|
Prdx1
|
peroxiredoxin 1 |
| chr8_-_115179191 | 7.89 |
ENSRNOT00000017224
|
Parp3
|
poly (ADP-ribose) polymerase family, member 3 |
| chr6_-_140715174 | 7.85 |
ENSRNOT00000085345
|
AABR07065773.1
|
|
| chr1_+_199555722 | 7.80 |
ENSRNOT00000054983
|
Itgax
|
integrin subunit alpha X |
| chr14_-_115052450 | 7.63 |
ENSRNOT00000067998
|
Acyp2
|
acylphosphatase 2 |
| chr1_-_88881460 | 7.60 |
ENSRNOT00000028287
|
Hcst
|
hematopoietic cell signal transducer |
| chr9_-_13513960 | 7.51 |
ENSRNOT00000067626
|
Mocs1
|
molybdenum cofactor synthesis 1 |
| chr2_+_24546536 | 7.46 |
ENSRNOT00000014036
|
Otp
|
orthopedia homeobox |
| chr16_-_62239987 | 7.38 |
ENSRNOT00000020252
|
Gsr
|
glutathione-disulfide reductase |
| chr13_-_36101411 | 7.06 |
ENSRNOT00000074471
|
Tmem37
|
transmembrane protein 37 |
| chr4_+_3043231 | 7.03 |
ENSRNOT00000013732
|
Il6
|
interleukin 6 |
| chr4_-_113866674 | 6.99 |
ENSRNOT00000010020
|
Dok1
|
docking protein 1 |
| chr3_+_154741631 | 6.94 |
ENSRNOT00000039994
|
Bpi
|
bactericidal/permeability-increasing protein |
| chr15_-_30161465 | 6.92 |
ENSRNOT00000068439
|
RGD1563780
|
similar to RIKEN cDNA A430107P09 gene |
| chr18_+_35249137 | 6.77 |
ENSRNOT00000017489
|
LOC100910942
|
serine protease inhibitor Kazal-type 6-like |
| chr11_+_30363280 | 6.73 |
ENSRNOT00000002885
|
Sod1
|
superoxide dismutase 1, soluble |
| chr18_-_59086251 | 6.69 |
ENSRNOT00000025510
ENSRNOT00000083831 |
Txnl1
|
thioredoxin-like 1 |
| chr17_+_9639330 | 6.61 |
ENSRNOT00000018232
|
Dok3
|
docking protein 3 |
| chr4_+_9882904 | 6.50 |
ENSRNOT00000016909
|
Dnajc2
|
DnaJ heat shock protein family (Hsp40) member C2 |
| chr6_+_139551751 | 6.41 |
ENSRNOT00000081684
|
AABR07065699.2
|
|
| chr15_+_4351292 | 6.01 |
ENSRNOT00000009207
|
Mrps16
|
mitochondrial ribosomal protein S16 |
| chr15_+_31469953 | 5.91 |
ENSRNOT00000077849
|
AABR07017825.4
|
|
| chr5_-_74368186 | 5.65 |
ENSRNOT00000059627
|
Ptpn3
|
protein tyrosine phosphatase, non-receptor type 3 |
| chr2_+_46980976 | 5.54 |
ENSRNOT00000083668
ENSRNOT00000082990 |
Mocs2
|
molybdenum cofactor synthesis 2 |
| chr9_+_64929721 | 5.54 |
ENSRNOT00000068633
|
Aox1
|
aldehyde oxidase 1 |
| chr15_+_31072340 | 5.48 |
ENSRNOT00000086675
|
AABR07017786.1
|
|
| chr3_-_2456041 | 5.22 |
ENSRNOT00000062001
|
Rnf224
|
ring finger protein 224 |
| chr4_-_57823283 | 5.19 |
ENSRNOT00000032772
ENSRNOT00000091255 |
Tmem209
|
transmembrane protein 209 |
| chr1_-_166943592 | 5.18 |
ENSRNOT00000026962
|
Folr1
|
folate receptor 1 |
| chr4_+_122217505 | 5.12 |
ENSRNOT00000030426
|
LOC685964
|
hypothetical protein LOC685964 |
| chr5_-_113578928 | 5.06 |
ENSRNOT00000010621
|
Plaa
|
phospholipase A2, activating protein |
| chr15_+_31141142 | 4.99 |
ENSRNOT00000060304
|
LOC103693854
|
uncharacterized LOC103693854 |
| chr2_-_188727670 | 4.91 |
ENSRNOT00000074920
|
Lenep
|
lens epithelial protein |
| chr20_+_6875228 | 4.85 |
ENSRNOT00000093377
|
RGD735065
|
similar to GI:13385412-like protein splice form I |
| chr18_+_47659128 | 4.78 |
ENSRNOT00000051142
|
Gykl1
|
glycerol kinase-like 1 |
| chr15_+_8730871 | 4.74 |
ENSRNOT00000081845
|
Nr1d2
|
nuclear receptor subfamily 1, group D, member 2 |
| chr15_+_32060750 | 4.68 |
ENSRNOT00000084376
|
AABR07017870.2
|
|
| chr15_-_30174197 | 4.67 |
ENSRNOT00000074419
|
LOC688340
|
T-cell receptor alpha chain V region PHDS58-like |
| chr2_-_222935973 | 4.63 |
ENSRNOT00000071934
|
AABR07013095.1
|
|
| chr20_+_5526975 | 4.63 |
ENSRNOT00000059548
|
Phf1
|
PHD finger protein 1 |
| chr8_+_76426335 | 4.62 |
ENSRNOT00000085496
|
Gtf2a2
|
general transcription factor2A subunit 2 |
| chr8_+_80965255 | 4.58 |
ENSRNOT00000079508
|
Wdr72
|
WD repeat domain 72 |
| chr10_-_35716260 | 4.51 |
ENSRNOT00000004308
ENSRNOT00000059255 |
Sqstm1
|
sequestosome 1 |
| chr11_-_83944763 | 4.50 |
ENSRNOT00000002358
|
Psmd2
|
proteasome 26S subunit, non-ATPase 2 |
| chr3_-_105663457 | 4.36 |
ENSRNOT00000067646
|
Zfp770
|
zinc finger protein 770 |
| chr2_+_211050360 | 4.34 |
ENSRNOT00000026928
|
Psma5
|
proteasome subunit alpha 5 |
| chr5_-_144341586 | 4.29 |
ENSRNOT00000014586
|
Adprhl2
|
ADP-ribosylhydrolase like 2 |
| chr6_+_76188083 | 4.22 |
ENSRNOT00000009666
|
Psma6
|
proteasome subunit alpha 6 |
| chr7_+_79138925 | 4.20 |
ENSRNOT00000047511
|
AABR07057586.1
|
|
| chr15_+_5783951 | 4.15 |
ENSRNOT00000061040
|
LOC305806
|
similar to glutaredoxin 1 (thioltransferase); glutaredoxin |
| chr4_-_107443853 | 4.12 |
ENSRNOT00000066666
|
AABR07061158.1
|
|
| chr1_-_183744586 | 4.00 |
ENSRNOT00000015946
|
Psma1
|
proteasome subunit alpha 1 |
| chr17_+_53102534 | 3.95 |
ENSRNOT00000021433
|
Mrpl32
|
mitochondrial ribosomal protein L32 |
| chr10_-_16046033 | 3.90 |
ENSRNOT00000089460
|
Cpeb4
|
cytoplasmic polyadenylation element binding protein 4 |
| chr14_-_72380330 | 3.83 |
ENSRNOT00000082653
ENSRNOT00000081878 ENSRNOT00000006727 |
Cpeb2
|
cytoplasmic polyadenylation element binding protein 2 |
| chr20_+_6874916 | 3.72 |
ENSRNOT00000093638
|
RGD735065
|
similar to GI:13385412-like protein splice form I |
| chr17_-_66511870 | 3.72 |
ENSRNOT00000044662
|
Lgals8
|
galectin 8 |
| chr3_-_2490392 | 3.66 |
ENSRNOT00000014993
|
Ssna1
|
SS nuclear autoantigen 1 |
| chr4_+_66670618 | 3.53 |
ENSRNOT00000010796
|
Tbxas1
|
thromboxane A synthase 1 |
| chr3_-_57119001 | 3.51 |
ENSRNOT00000083171
|
Tlk1
|
tousled-like kinase 1 |
| chr1_+_169966190 | 3.50 |
ENSRNOT00000023307
|
Olr190
|
olfactory receptor 190 |
| chr14_+_34727915 | 3.46 |
ENSRNOT00000085089
|
Kdr
|
kinase insert domain receptor |
| chr9_+_38799881 | 3.43 |
ENSRNOT00000083847
|
AABR07067300.1
|
|
| chr1_+_173047669 | 3.42 |
ENSRNOT00000073565
|
LOC687119
|
similar to olfactory receptor 513 |
| chr13_-_47670407 | 3.36 |
ENSRNOT00000035044
|
Il19
|
interleukin 19 |
| chr3_-_103111795 | 3.27 |
ENSRNOT00000006622
|
Olr778
|
olfactory receptor 778 |
| chr1_-_173180745 | 3.14 |
ENSRNOT00000043904
|
Olr203
|
olfactory receptor 203 |
| chr18_+_44737154 | 3.06 |
ENSRNOT00000021972
|
Tnfaip8
|
TNF alpha induced protein 8 |
| chr3_-_147985616 | 3.03 |
ENSRNOT00000087431
|
Defb26
|
defensin beta 26 |
| chr1_-_57489727 | 2.98 |
ENSRNOT00000002037
|
Psmb1
|
proteasome subunit beta 1 |
| chr10_+_105499569 | 2.87 |
ENSRNOT00000088457
|
Sphk1
|
sphingosine kinase 1 |
| chr4_+_1557599 | 2.84 |
ENSRNOT00000074489
|
Olr1242
|
olfactory receptor 1242 |
| chr15_-_33263659 | 2.84 |
ENSRNOT00000018005
|
Psmb5
|
proteasome subunit beta 5 |
| chr1_-_88123643 | 2.83 |
ENSRNOT00000027937
|
Psmd8
|
proteasome 26S subunit, non-ATPase 8 |
| chr20_+_5527181 | 2.76 |
ENSRNOT00000091364
|
Phf1
|
PHD finger protein 1 |
| chr15_-_29672591 | 2.76 |
ENSRNOT00000060298
|
LOC100911282
|
uncharacterized LOC100911282 |
| chr1_+_170887363 | 2.73 |
ENSRNOT00000036261
|
Olr215
|
olfactory receptor 215 |
| chr20_-_41209728 | 2.69 |
ENSRNOT00000000657
|
Nt5dc1
|
5'-nucleotidase domain containing 1 |
| chr4_+_7314369 | 2.67 |
ENSRNOT00000029724
|
Atg9b
|
autophagy related 9B |
| chr9_+_17817721 | 2.66 |
ENSRNOT00000086986
ENSRNOT00000026920 |
Hsp90ab1
|
heat shock protein 90 alpha family class B member 1 |
| chr10_+_91254058 | 2.61 |
ENSRNOT00000087218
ENSRNOT00000065373 |
Fmnl1
|
formin-like 1 |
| chr1_-_170034892 | 2.61 |
ENSRNOT00000042936
|
Olr194
|
olfactory receptor 194 |
| chr11_+_86797557 | 2.59 |
ENSRNOT00000083049
ENSRNOT00000046594 |
Tango2
|
transport and golgi organization 2 homolog |
| chr7_-_2588843 | 2.58 |
ENSRNOT00000088619
|
Rbms2
|
RNA binding motif, single stranded interacting protein 2 |
| chr7_+_2479311 | 2.56 |
ENSRNOT00000003787
|
Ptges3
|
prostaglandin E synthase 3 |
| chr13_+_60545635 | 2.48 |
ENSRNOT00000077153
|
Uchl5
|
ubiquitin C-terminal hydrolase L5 |
| chr17_-_14687408 | 2.40 |
ENSRNOT00000088542
|
AC120310.1
|
|
| chr10_+_95706685 | 2.37 |
ENSRNOT00000004283
|
Psmd12
|
proteasome 26S subunit, non-ATPase 12 |
| chr13_+_27889345 | 2.36 |
ENSRNOT00000079134
ENSRNOT00000003274 |
Serpinb8
|
serpin family B member 8 |
| chr6_-_78817641 | 2.12 |
ENSRNOT00000072117
|
AABR07064392.1
|
|
| chr4_+_166911595 | 2.06 |
ENSRNOT00000030813
|
Tas2r124
|
taste receptor, type 2, member 124 |
| chr1_-_168930776 | 1.98 |
ENSRNOT00000021468
|
LOC103694854
|
olfactory receptor 52Z1-like |
| chr15_-_4055539 | 1.94 |
ENSRNOT00000090352
|
Sec24c
|
SEC24 homolog C, COPII coat complex component |
| chr4_+_162392869 | 1.93 |
ENSRNOT00000047790
|
Clec2d
|
C-type lectin domain family 2, member D |
| chr1_+_199360645 | 1.88 |
ENSRNOT00000026527
|
Kat8
|
lysine acetyltransferase 8 |
| chr3_+_103747654 | 1.87 |
ENSRNOT00000006887
|
Nop10
|
NOP10 ribonucleoprotein |
| chr10_-_16045835 | 1.85 |
ENSRNOT00000064832
|
Cpeb4
|
cytoplasmic polyadenylation element binding protein 4 |
| chr11_-_81660395 | 1.71 |
ENSRNOT00000048739
|
Fetub
|
fetuin B |
| chr3_-_20518105 | 1.66 |
ENSRNOT00000050435
|
AABR07051735.1
|
|
| chr1_+_170863882 | 1.63 |
ENSRNOT00000072749
|
Olr214
|
olfactory receptor 214 |
| chr3_+_161413298 | 1.62 |
ENSRNOT00000023965
ENSRNOT00000088776 |
Mmp9
|
matrix metallopeptidase 9 |
| chr8_-_40564556 | 1.48 |
ENSRNOT00000075779
|
Olfr883
|
olfactory receptor 883 |
| chr2_-_196415530 | 1.45 |
ENSRNOT00000064238
|
RGD1359334
|
similar to hypothetical protein FLJ20519 |
| chr4_+_1470716 | 1.42 |
ENSRNOT00000044223
|
Olr1235
|
olfactory receptor 1235 |
| chr3_+_175426752 | 1.41 |
ENSRNOT00000085718
|
Ss18l1
|
SS18L1, nBAF chromatin remodeling complex subunit |
| chr3_+_58084606 | 1.40 |
ENSRNOT00000084797
|
Metap1d
|
methionyl aminopeptidase type 1D (mitochondrial) |
| chr12_+_40553741 | 1.31 |
ENSRNOT00000057396
|
LOC100360238
|
rCG21419-like |
| chr18_-_1216379 | 1.23 |
ENSRNOT00000020537
ENSRNOT00000084613 |
Usp14
|
ubiquitin specific peptidase 14 |
| chr1_-_170318935 | 1.23 |
ENSRNOT00000024119
|
Prkcdbp
|
protein kinase C, delta binding protein |
| chr17_+_6840463 | 1.20 |
ENSRNOT00000061233
|
Ubqln1
|
ubiquilin 1 |
| chr7_+_2737765 | 1.17 |
ENSRNOT00000004895
|
Cnpy2
|
canopy FGF signaling regulator 2 |
| chr4_-_28953067 | 1.12 |
ENSRNOT00000013989
|
Tfpi2
|
tissue factor pathway inhibitor 2 |
| chr6_-_42302254 | 1.12 |
ENSRNOT00000007071
|
Pqlc3
|
PQ loop repeat containing 3 |
| chr19_+_37282018 | 1.11 |
ENSRNOT00000021723
|
Tmem208
|
transmembrane protein 208 |
| chr3_-_92783569 | 1.06 |
ENSRNOT00000009073
ENSRNOT00000009000 |
Cd44
|
CD44 molecule (Indian blood group) |
| chrX_-_72034099 | 1.01 |
ENSRNOT00000004310
|
Ercc6l
|
ERCC excision repair 6 like, spindle assembly checkpoint helicase |
| chr3_-_5483239 | 0.98 |
ENSRNOT00000071754
|
Surf4
|
surfeit 4 |
| chr3_+_152294656 | 0.97 |
ENSRNOT00000027067
|
Phf20
|
PHD finger protein 20 |
| chr6_+_128738388 | 0.93 |
ENSRNOT00000050204
|
Rpl6-ps1
|
ribosomal protein L6, pseudogene 1 |
| chr3_-_11410732 | 0.89 |
ENSRNOT00000034930
|
RGD1561113
|
similar to Hypothetical UPF0184 protein C9orf16 homolog |
| chr6_-_26051229 | 0.88 |
ENSRNOT00000005855
|
Bre
|
brain and reproductive organ-expressed (TNFRSF1A modulator) |
| chr1_-_254513299 | 0.86 |
ENSRNOT00000086031
|
AC119111.1
|
|
| chr1_+_171188133 | 0.85 |
ENSRNOT00000026511
|
Olr231
|
olfactory receptor 231 |
| chr1_-_251387002 | 0.85 |
ENSRNOT00000092063
|
Atad1
|
ATPase family, AAA domain containing 1 |
| chr19_+_19395655 | 0.84 |
ENSRNOT00000019130
|
Snx20
|
sorting nexin 20 |
| chr16_+_10727571 | 0.81 |
ENSRNOT00000084422
|
Mmrn2
|
multimerin 2 |
| chr9_-_99659425 | 0.81 |
ENSRNOT00000051686
|
Olr1343
|
olfactory receptor 1343 |
| chr8_-_48634797 | 0.79 |
ENSRNOT00000012868
|
Hinfp
|
histone H4 transcription factor |
| chr6_-_49089855 | 0.73 |
ENSRNOT00000006526
|
Tpo
|
thyroid peroxidase |
| chr11_-_84037938 | 0.72 |
ENSRNOT00000002327
|
Abcf3
|
ATP binding cassette subfamily F member 3 |
| chr6_-_129010271 | 0.63 |
ENSRNOT00000075378
|
Serpina10
|
serpin family A member 10 |
| chr12_-_52676608 | 0.42 |
ENSRNOT00000072507
|
Plcxd1
|
phosphatidylinositol-specific phospholipase C, X domain containing 1 |
| chr18_+_56364620 | 0.35 |
ENSRNOT00000068535
ENSRNOT00000086033 |
Pdgfrb
|
platelet derived growth factor receptor beta |
| chr10_-_61576952 | 0.34 |
ENSRNOT00000092712
|
Pafah1b1
|
platelet-activating factor acetylhydrolase 1b, regulatory subunit 1 |
| chr17_-_70481750 | 0.33 |
ENSRNOT00000025252
|
Il15ra
|
interleukin 15 receptor subunit alpha |
| chr1_+_87066289 | 0.30 |
ENSRNOT00000027645
|
Capn12
|
calpain 12 |
| chr1_+_70437776 | 0.24 |
ENSRNOT00000020448
|
Olr3
|
olfactory receptor 3 |
| chr11_+_53081025 | 0.16 |
ENSRNOT00000002700
|
Bbx
|
BBX, HMG-box containing |
| chr3_-_20883265 | 0.10 |
ENSRNOT00000052047
|
Olr414
|
olfactory receptor 414 |
| chr8_+_41365984 | 0.04 |
ENSRNOT00000074250
|
Olr1228
|
olfactory receptor 1228 |
| chr1_-_219294147 | 0.03 |
ENSRNOT00000024601
|
Gstp1
|
glutathione S-transferase pi 1 |
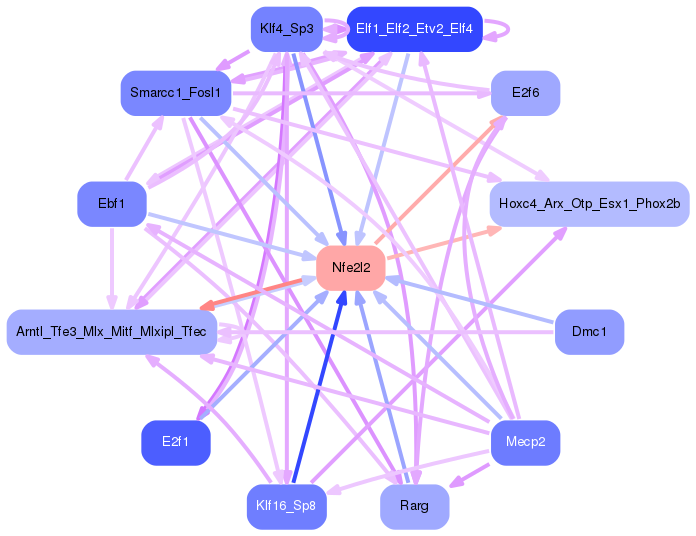
Network of associatons between targets according to the STRING database.

First level regulatory network of Nfe2l2
Gene Ontology Analysis
Gene overrepresentation in biological process category:
| Log-likelihood per target | Total log-likelihood | Term | Description |
|---|---|---|---|
| 7.9 | 39.3 | GO:0014722 | regulation of skeletal muscle contraction by calcium ion signaling(GO:0014722) |
| 5.9 | 17.7 | GO:1903860 | negative regulation of dendrite extension(GO:1903860) |
| 5.5 | 16.4 | GO:1990036 | calcium ion import into sarcoplasmic reticulum(GO:1990036) |
| 5.4 | 16.3 | GO:1901979 | regulation of inward rectifier potassium channel activity(GO:1901979) |
| 5.0 | 14.9 | GO:0000053 | argininosuccinate metabolic process(GO:0000053) |
| 3.7 | 14.9 | GO:0097069 | cellular response to thyroxine stimulus(GO:0097069) |
| 3.5 | 10.4 | GO:1902037 | negative regulation of hematopoietic stem cell differentiation(GO:1902037) |
| 3.5 | 10.4 | GO:0071349 | interleukin-12-mediated signaling pathway(GO:0035722) cellular response to interleukin-12(GO:0071349) |
| 3.3 | 23.3 | GO:0060315 | negative regulation of ryanodine-sensitive calcium-release channel activity(GO:0060315) |
| 3.0 | 9.0 | GO:0070946 | neutrophil mediated killing of gram-positive bacterium(GO:0070946) |
| 3.0 | 8.9 | GO:1901143 | insulin catabolic process(GO:1901143) |
| 2.9 | 8.6 | GO:0042726 | flavin-containing compound metabolic process(GO:0042726) positive regulation of ubiquitin-specific protease activity(GO:2000158) |
| 2.8 | 8.4 | GO:0070814 | hydrogen sulfide biosynthetic process(GO:0070814) |
| 2.7 | 8.0 | GO:0046968 | cytosol to ER transport(GO:0046967) peptide antigen transport(GO:0046968) |
| 2.6 | 7.9 | GO:1990166 | protein localization to site of double-strand break(GO:1990166) |
| 2.6 | 10.5 | GO:0035513 | oxidative RNA demethylation(GO:0035513) oxidative single-stranded RNA demethylation(GO:0035553) |
| 2.3 | 7.0 | GO:2000660 | negative regulation of chemokine biosynthetic process(GO:0045079) negative regulation of interleukin-1-mediated signaling pathway(GO:2000660) |
| 1.9 | 15.3 | GO:0090286 | cytoskeletal anchoring at nuclear membrane(GO:0090286) |
| 1.8 | 25.6 | GO:0030388 | fructose 1,6-bisphosphate metabolic process(GO:0030388) |
| 1.8 | 17.9 | GO:1902031 | regulation of NADP metabolic process(GO:1902031) |
| 1.7 | 5.2 | GO:0060974 | cell migration involved in heart formation(GO:0060974) |
| 1.6 | 4.8 | GO:0046167 | glycerol-3-phosphate biosynthetic process(GO:0046167) |
| 1.3 | 6.7 | GO:0097332 | response to antipsychotic drug(GO:0097332) |
| 1.2 | 13.1 | GO:0006777 | Mo-molybdopterin cofactor biosynthetic process(GO:0006777) Mo-molybdopterin cofactor metabolic process(GO:0019720) |
| 1.2 | 3.5 | GO:0038033 | positive regulation of endothelial cell chemotaxis by VEGF-activated vascular endothelial growth factor receptor signaling pathway(GO:0038033) |
| 1.1 | 5.5 | GO:0009115 | xanthine catabolic process(GO:0009115) |
| 1.1 | 20.6 | GO:0031581 | hemidesmosome assembly(GO:0031581) |
| 1.1 | 7.4 | GO:0061086 | negative regulation of histone H3-K27 methylation(GO:0061086) |
| 1.0 | 3.8 | GO:0045900 | negative regulation of translational elongation(GO:0045900) |
| 0.9 | 7.5 | GO:0021979 | hypothalamus cell differentiation(GO:0021979) |
| 0.9 | 3.7 | GO:0060830 | ciliary receptor clustering involved in smoothened signaling pathway(GO:0060830) |
| 0.9 | 2.7 | GO:1903660 | negative regulation of complement-dependent cytotoxicity(GO:1903660) |
| 0.9 | 6.9 | GO:0043031 | negative regulation of macrophage activation(GO:0043031) |
| 0.9 | 8.6 | GO:1901727 | positive regulation of histone deacetylase activity(GO:1901727) |
| 0.8 | 5.1 | GO:0010992 | ubiquitin homeostasis(GO:0010992) |
| 0.8 | 5.7 | GO:2000766 | negative regulation of cytoplasmic translation(GO:2000766) |
| 0.8 | 9.7 | GO:0033234 | negative regulation of protein sumoylation(GO:0033234) |
| 0.8 | 11.7 | GO:0000083 | regulation of transcription involved in G1/S transition of mitotic cell cycle(GO:0000083) |
| 0.8 | 9.0 | GO:0010041 | response to iron(III) ion(GO:0010041) |
| 0.7 | 9.7 | GO:0051151 | negative regulation of smooth muscle cell differentiation(GO:0051151) |
| 0.7 | 3.7 | GO:0002317 | plasma cell differentiation(GO:0002317) |
| 0.7 | 5.7 | GO:0051045 | negative regulation of membrane protein ectodomain proteolysis(GO:0051045) |
| 0.7 | 2.7 | GO:1902534 | single-organism membrane invagination(GO:1902534) |
| 0.7 | 11.1 | GO:0019532 | oxalate transport(GO:0019532) sulfate transmembrane transport(GO:1902358) |
| 0.6 | 2.9 | GO:0019371 | cyclooxygenase pathway(GO:0019371) |
| 0.5 | 4.5 | GO:0061635 | regulation of protein complex stability(GO:0061635) |
| 0.5 | 1.4 | GO:0070084 | protein initiator methionine removal(GO:0070084) |
| 0.4 | 9.1 | GO:0031998 | regulation of fatty acid beta-oxidation(GO:0031998) |
| 0.4 | 1.2 | GO:1903070 | negative regulation of ER-associated ubiquitin-dependent protein catabolic process(GO:1903070) |
| 0.4 | 1.2 | GO:0034140 | negative regulation of toll-like receptor 3 signaling pathway(GO:0034140) |
| 0.4 | 3.5 | GO:0030644 | cellular chloride ion homeostasis(GO:0030644) |
| 0.4 | 1.2 | GO:0045716 | positive regulation of low-density lipoprotein particle receptor biosynthetic process(GO:0045716) |
| 0.4 | 10.7 | GO:0071450 | cellular response to oxygen radical(GO:0071450) cellular response to superoxide(GO:0071451) |
| 0.4 | 1.9 | GO:0000454 | snoRNA guided rRNA pseudouridine synthesis(GO:0000454) |
| 0.4 | 1.1 | GO:1900625 | regulation of monocyte aggregation(GO:1900623) positive regulation of monocyte aggregation(GO:1900625) |
| 0.4 | 3.5 | GO:0001672 | regulation of chromatin assembly or disassembly(GO:0001672) |
| 0.3 | 22.6 | GO:0034605 | cellular response to heat(GO:0034605) |
| 0.3 | 12.8 | GO:1903963 | arachidonic acid secretion(GO:0050482) arachidonate transport(GO:1903963) |
| 0.3 | 4.0 | GO:0002862 | negative regulation of inflammatory response to antigenic stimulus(GO:0002862) |
| 0.3 | 53.8 | GO:0030308 | negative regulation of cell growth(GO:0030308) |
| 0.3 | 34.1 | GO:0035335 | peptidyl-tyrosine dephosphorylation(GO:0035335) |
| 0.3 | 2.6 | GO:0070389 | chaperone cofactor-dependent protein refolding(GO:0070389) |
| 0.3 | 4.7 | GO:2000505 | regulation of energy homeostasis(GO:2000505) |
| 0.3 | 8.1 | GO:0006779 | porphyrin-containing compound biosynthetic process(GO:0006779) |
| 0.2 | 4.6 | GO:0070166 | enamel mineralization(GO:0070166) |
| 0.2 | 3.4 | GO:0042226 | interleukin-6 biosynthetic process(GO:0042226) |
| 0.2 | 0.8 | GO:0030948 | negative regulation of vascular endothelial growth factor receptor signaling pathway(GO:0030948) |
| 0.2 | 2.5 | GO:0021670 | lateral ventricle development(GO:0021670) |
| 0.2 | 2.6 | GO:0051014 | actin filament severing(GO:0051014) |
| 0.2 | 0.3 | GO:0043622 | cortical microtubule organization(GO:0043622) |
| 0.2 | 2.8 | GO:0043248 | proteasome assembly(GO:0043248) |
| 0.1 | 2.8 | GO:0043981 | histone H4-K5 acetylation(GO:0043981) histone H4-K8 acetylation(GO:0043982) |
| 0.1 | 7.8 | GO:0034113 | heterotypic cell-cell adhesion(GO:0034113) |
| 0.1 | 2.4 | GO:0090136 | epithelial cell-cell adhesion(GO:0090136) |
| 0.1 | 10.9 | GO:0050852 | T cell receptor signaling pathway(GO:0050852) |
| 0.1 | 7.9 | GO:0014068 | positive regulation of phosphatidylinositol 3-kinase signaling(GO:0014068) |
| 0.1 | 6.0 | GO:0032543 | mitochondrial translation(GO:0032543) |
| 0.1 | 6.7 | GO:0045454 | cell redox homeostasis(GO:0045454) |
| 0.1 | 8.6 | GO:0002088 | lens development in camera-type eye(GO:0002088) |
| 0.1 | 1.1 | GO:0006488 | dolichol-linked oligosaccharide biosynthetic process(GO:0006488) |
| 0.1 | 28.9 | GO:0010951 | negative regulation of endopeptidase activity(GO:0010951) |
| 0.1 | 0.7 | GO:0042744 | hydrogen peroxide catabolic process(GO:0042744) |
| 0.1 | 1.0 | GO:0034498 | early endosome to Golgi transport(GO:0034498) |
| 0.1 | 2.2 | GO:0051123 | RNA polymerase II transcriptional preinitiation complex assembly(GO:0051123) |
| 0.1 | 0.8 | GO:0051967 | negative regulation of synaptic transmission, glutamatergic(GO:0051967) |
| 0.0 | 7.6 | GO:0031032 | actomyosin structure organization(GO:0031032) |
| 0.0 | 4.2 | GO:0051092 | positive regulation of NF-kappaB transcription factor activity(GO:0051092) |
| 0.0 | 4.5 | GO:0042176 | regulation of protein catabolic process(GO:0042176) |
| 0.0 | 7.1 | GO:0070588 | calcium ion transmembrane transport(GO:0070588) |
| 0.0 | 0.3 | GO:0032825 | positive regulation of natural killer cell differentiation(GO:0032825) |
| 0.0 | 1.9 | GO:0006888 | ER to Golgi vesicle-mediated transport(GO:0006888) |
| 0.0 | 0.9 | GO:0045739 | positive regulation of DNA repair(GO:0045739) |
| 0.0 | 6.5 | GO:0007265 | Ras protein signal transduction(GO:0007265) |
| 0.0 | 4.7 | GO:0051260 | protein homooligomerization(GO:0051260) |
| 0.0 | 19.7 | GO:0050911 | detection of chemical stimulus involved in sensory perception of smell(GO:0050911) |
| 0.0 | 0.0 | GO:2000468 | regulation of smooth muscle cell chemotaxis(GO:0071671) negative regulation of smooth muscle cell chemotaxis(GO:0071672) negative regulation of vascular smooth muscle cell proliferation(GO:1904706) regulation of peroxidase activity(GO:2000468) |
| 0.0 | 4.3 | GO:0043161 | proteasome-mediated ubiquitin-dependent protein catabolic process(GO:0043161) |
| 0.0 | 10.1 | GO:0055114 | oxidation-reduction process(GO:0055114) |
Gene overrepresentation in cellular component category:
| Log-likelihood per target | Total log-likelihood | Term | Description |
|---|---|---|---|
| 7.4 | 29.5 | GO:0033018 | sarcoplasmic reticulum lumen(GO:0033018) |
| 2.9 | 8.6 | GO:1990730 | VCP-NSFL1C complex(GO:1990730) |
| 2.3 | 7.0 | GO:0005896 | interleukin-6 receptor complex(GO:0005896) |
| 2.2 | 15.3 | GO:0034993 | microtubule organizing center attachment site(GO:0034992) LINC complex(GO:0034993) |
| 1.7 | 15.7 | GO:0019773 | proteasome core complex, alpha-subunit complex(GO:0019773) |
| 1.5 | 25.6 | GO:0035686 | sperm fibrous sheath(GO:0035686) |
| 1.1 | 8.0 | GO:0042825 | MHC class I peptide loading complex(GO:0042824) TAP complex(GO:0042825) |
| 1.0 | 20.6 | GO:0030056 | hemidesmosome(GO:0030056) |
| 0.9 | 14.9 | GO:0070852 | cell body fiber(GO:0070852) |
| 0.9 | 8.1 | GO:0008091 | spectrin(GO:0008091) |
| 0.8 | 16.8 | GO:0005782 | peroxisomal matrix(GO:0005782) microbody lumen(GO:0031907) |
| 0.8 | 26.2 | GO:0033017 | sarcoplasmic reticulum membrane(GO:0033017) |
| 0.8 | 4.6 | GO:0005672 | transcription factor TFIIA complex(GO:0005672) |
| 0.6 | 10.9 | GO:0042101 | T cell receptor complex(GO:0042101) |
| 0.6 | 5.2 | GO:0008541 | proteasome regulatory particle, lid subcomplex(GO:0008541) |
| 0.5 | 2.7 | GO:0034751 | aryl hydrocarbon receptor complex(GO:0034751) |
| 0.5 | 1.9 | GO:0072487 | MSL complex(GO:0072487) |
| 0.4 | 9.6 | GO:1990124 | messenger ribonucleoprotein complex(GO:1990124) |
| 0.4 | 3.5 | GO:0097443 | sorting endosome(GO:0097443) |
| 0.4 | 6.7 | GO:0031045 | dense core granule(GO:0031045) |
| 0.4 | 23.3 | GO:0034707 | chloride channel complex(GO:0034707) |
| 0.4 | 15.3 | GO:0035861 | site of double-strand break(GO:0035861) |
| 0.4 | 11.9 | GO:0071339 | MLL1/2 complex(GO:0044665) MLL1 complex(GO:0071339) |
| 0.4 | 5.7 | GO:0005839 | proteasome core complex(GO:0005839) |
| 0.4 | 1.9 | GO:0090661 | box H/ACA telomerase RNP complex(GO:0090661) |
| 0.4 | 1.1 | GO:0035692 | macrophage migration inhibitory factor receptor complex(GO:0035692) |
| 0.3 | 4.5 | GO:0044754 | autolysosome(GO:0044754) |
| 0.3 | 5.2 | GO:0031362 | anchored component of external side of plasma membrane(GO:0031362) |
| 0.3 | 19.5 | GO:0005811 | lipid particle(GO:0005811) |
| 0.2 | 7.8 | GO:0008305 | integrin complex(GO:0008305) |
| 0.2 | 11.7 | GO:0000502 | proteasome complex(GO:0000502) |
| 0.2 | 0.9 | GO:0070552 | BRISC complex(GO:0070552) |
| 0.2 | 6.0 | GO:0000314 | organellar small ribosomal subunit(GO:0000314) mitochondrial small ribosomal subunit(GO:0005763) |
| 0.2 | 10.4 | GO:0009295 | nucleoid(GO:0009295) mitochondrial nucleoid(GO:0042645) |
| 0.2 | 9.0 | GO:0010494 | cytoplasmic stress granule(GO:0010494) |
| 0.1 | 1.9 | GO:0030127 | COPII vesicle coat(GO:0030127) |
| 0.1 | 4.5 | GO:0000152 | nuclear ubiquitin ligase complex(GO:0000152) |
| 0.1 | 2.6 | GO:0005697 | telomerase holoenzyme complex(GO:0005697) |
| 0.1 | 2.7 | GO:0000407 | pre-autophagosomal structure(GO:0000407) |
| 0.1 | 1.4 | GO:0071565 | nBAF complex(GO:0071565) |
| 0.1 | 33.4 | GO:0005743 | mitochondrial inner membrane(GO:0005743) |
| 0.1 | 10.0 | GO:0005777 | peroxisome(GO:0005777) microbody(GO:0042579) |
| 0.1 | 17.8 | GO:0009897 | external side of plasma membrane(GO:0009897) |
| 0.1 | 7.8 | GO:0030496 | midbody(GO:0030496) |
| 0.0 | 2.6 | GO:0045335 | phagocytic vesicle(GO:0045335) |
| 0.0 | 15.9 | GO:0016607 | nuclear speck(GO:0016607) |
| 0.0 | 0.3 | GO:0000235 | astral microtubule(GO:0000235) aster(GO:0005818) |
| 0.0 | 0.4 | GO:0043202 | lysosomal lumen(GO:0043202) |
| 0.0 | 3.7 | GO:0036064 | ciliary basal body(GO:0036064) |
| 0.0 | 5.0 | GO:0009898 | cytoplasmic side of plasma membrane(GO:0009898) |
| 0.0 | 35.9 | GO:0005739 | mitochondrion(GO:0005739) |
| 0.0 | 0.8 | GO:0015030 | Cajal body(GO:0015030) |
| 0.0 | 4.4 | GO:0031965 | nuclear membrane(GO:0031965) |
| 0.0 | 2.9 | GO:0008021 | synaptic vesicle(GO:0008021) |
| 0.0 | 1.0 | GO:0005793 | endoplasmic reticulum-Golgi intermediate compartment(GO:0005793) |
| 0.0 | 0.8 | GO:0031901 | early endosome membrane(GO:0031901) |
| 0.0 | 10.5 | GO:0005887 | integral component of plasma membrane(GO:0005887) |
Gene overrepresentation in molecular function category:
| Log-likelihood per target | Total log-likelihood | Term | Description |
|---|---|---|---|
| 6.0 | 17.9 | GO:0008948 | oxaloacetate decarboxylase activity(GO:0008948) |
| 4.1 | 16.3 | GO:0015272 | ATP-activated inward rectifier potassium channel activity(GO:0015272) |
| 3.7 | 25.6 | GO:0004332 | fructose-bisphosphate aldolase activity(GO:0004332) |
| 2.9 | 8.6 | GO:0035800 | deubiquitinase activator activity(GO:0035800) |
| 2.8 | 8.4 | GO:0004792 | thiosulfate sulfurtransferase activity(GO:0004792) |
| 2.7 | 8.0 | GO:0046980 | peptide antigen-transporting ATPase activity(GO:0015433) tapasin binding(GO:0046980) |
| 2.6 | 10.5 | GO:0035515 | oxidative RNA demethylase activity(GO:0035515) |
| 2.6 | 10.4 | GO:0005143 | interleukin-12 receptor binding(GO:0005143) |
| 2.0 | 7.9 | GO:0008379 | thioredoxin peroxidase activity(GO:0008379) |
| 1.6 | 4.8 | GO:0004370 | glycerol kinase activity(GO:0004370) |
| 1.3 | 2.7 | GO:0017098 | sulfonylurea receptor binding(GO:0017098) |
| 1.3 | 5.2 | GO:0051870 | methotrexate binding(GO:0051870) |
| 1.1 | 5.5 | GO:0016726 | aldehyde oxidase activity(GO:0004031) xanthine dehydrogenase activity(GO:0004854) oxidoreductase activity, acting on the aldehyde or oxo group of donors, oxygen as acceptor(GO:0016623) oxidoreductase activity, acting on CH or CH2 groups, NAD or NADP as acceptor(GO:0016726) |
| 1.1 | 7.4 | GO:0015038 | glutathione disulfide oxidoreductase activity(GO:0015038) |
| 1.0 | 5.2 | GO:0004784 | superoxide dismutase activity(GO:0004784) oxidoreductase activity, acting on superoxide radicals as acceptor(GO:0016721) |
| 1.0 | 56.5 | GO:0008138 | protein tyrosine/serine/threonine phosphatase activity(GO:0008138) |
| 1.0 | 7.0 | GO:0005138 | interleukin-6 receptor binding(GO:0005138) |
| 1.0 | 8.9 | GO:0043559 | insulin binding(GO:0043559) |
| 1.0 | 2.9 | GO:0008481 | sphinganine kinase activity(GO:0008481) |
| 0.9 | 7.9 | GO:0003910 | DNA ligase activity(GO:0003909) DNA ligase (ATP) activity(GO:0003910) |
| 0.9 | 2.6 | GO:0050220 | prostaglandin-E synthase activity(GO:0050220) |
| 0.8 | 6.7 | GO:0047134 | protein-disulfide reductase activity(GO:0047134) |
| 0.8 | 21.5 | GO:0004298 | threonine-type endopeptidase activity(GO:0004298) threonine-type peptidase activity(GO:0070003) |
| 0.8 | 14.9 | GO:0015643 | toxic substance binding(GO:0015643) |
| 0.7 | 11.1 | GO:0019531 | oxalate transmembrane transporter activity(GO:0019531) |
| 0.7 | 14.9 | GO:0016881 | acid-amino acid ligase activity(GO:0016881) |
| 0.7 | 5.5 | GO:0016783 | sulfurtransferase activity(GO:0016783) |
| 0.7 | 15.9 | GO:0004602 | glutathione peroxidase activity(GO:0004602) |
| 0.6 | 9.6 | GO:0000900 | translation repressor activity, nucleic acid binding(GO:0000900) |
| 0.5 | 20.6 | GO:0030506 | ankyrin binding(GO:0030506) |
| 0.5 | 9.1 | GO:0097602 | cullin family protein binding(GO:0097602) |
| 0.5 | 3.8 | GO:0038085 | vascular endothelial growth factor binding(GO:0038085) |
| 0.4 | 4.7 | GO:0004887 | thyroid hormone receptor activity(GO:0004887) |
| 0.4 | 5.1 | GO:0016004 | phospholipase activator activity(GO:0016004) |
| 0.4 | 10.9 | GO:0005070 | SH3/SH2 adaptor activity(GO:0005070) |
| 0.4 | 12.8 | GO:0004623 | phospholipase A2 activity(GO:0004623) |
| 0.4 | 8.6 | GO:0005212 | structural constituent of eye lens(GO:0005212) |
| 0.4 | 13.6 | GO:0005158 | insulin receptor binding(GO:0005158) |
| 0.4 | 10.4 | GO:0017134 | fibroblast growth factor binding(GO:0017134) |
| 0.3 | 6.9 | GO:0001530 | lipopolysaccharide binding(GO:0001530) |
| 0.3 | 8.8 | GO:0008395 | steroid hydroxylase activity(GO:0008395) |
| 0.3 | 20.4 | GO:0004869 | cysteine-type endopeptidase inhibitor activity(GO:0004869) |
| 0.3 | 48.1 | GO:0008083 | growth factor activity(GO:0008083) |
| 0.3 | 2.8 | GO:0046972 | histone acetyltransferase activity (H4-K5 specific)(GO:0043995) histone acetyltransferase activity (H4-K8 specific)(GO:0043996) histone acetyltransferase activity (H4-K16 specific)(GO:0046972) |
| 0.2 | 3.7 | GO:0070628 | proteasome binding(GO:0070628) |
| 0.2 | 22.0 | GO:0051117 | ATPase binding(GO:0051117) |
| 0.2 | 1.1 | GO:0005114 | type II transforming growth factor beta receptor binding(GO:0005114) |
| 0.2 | 1.9 | GO:0034513 | box H/ACA snoRNA binding(GO:0034513) |
| 0.2 | 7.6 | GO:0043548 | phosphatidylinositol 3-kinase binding(GO:0043548) |
| 0.2 | 9.1 | GO:0016667 | oxidoreductase activity, acting on a sulfur group of donors(GO:0016667) |
| 0.2 | 7.5 | GO:0051539 | 4 iron, 4 sulfur cluster binding(GO:0051539) |
| 0.2 | 15.0 | GO:0050660 | flavin adenine dinucleotide binding(GO:0050660) |
| 0.2 | 4.5 | GO:0070530 | K63-linked polyubiquitin binding(GO:0070530) |
| 0.2 | 22.0 | GO:0019905 | syntaxin binding(GO:0019905) |
| 0.2 | 6.5 | GO:0030544 | Hsp70 protein binding(GO:0030544) |
| 0.2 | 2.7 | GO:0008253 | 5'-nucleotidase activity(GO:0008253) |
| 0.1 | 2.6 | GO:0005522 | profilin binding(GO:0005522) |
| 0.1 | 4.6 | GO:0001103 | RNA polymerase II repressing transcription factor binding(GO:0001103) |
| 0.1 | 9.8 | GO:0019888 | protein phosphatase regulator activity(GO:0019888) |
| 0.1 | 17.7 | GO:0005179 | hormone activity(GO:0005179) |
| 0.1 | 7.6 | GO:0005200 | structural constituent of cytoskeleton(GO:0005200) |
| 0.1 | 3.5 | GO:0016860 | intramolecular oxidoreductase activity(GO:0016860) |
| 0.1 | 10.9 | GO:0004867 | serine-type endopeptidase inhibitor activity(GO:0004867) |
| 0.1 | 2.1 | GO:0031593 | polyubiquitin binding(GO:0031593) |
| 0.1 | 9.1 | GO:0002020 | protease binding(GO:0002020) |
| 0.1 | 0.3 | GO:0047179 | platelet-activating factor acetyltransferase activity(GO:0047179) |
| 0.1 | 13.6 | GO:0051015 | actin filament binding(GO:0051015) |
| 0.1 | 9.0 | GO:0008201 | heparin binding(GO:0008201) |
| 0.1 | 1.6 | GO:0001968 | fibronectin binding(GO:0001968) |
| 0.1 | 23.5 | GO:0001077 | transcriptional activator activity, RNA polymerase II core promoter proximal region sequence-specific binding(GO:0001077) |
| 0.1 | 1.4 | GO:0070006 | metalloaminopeptidase activity(GO:0070006) |
| 0.1 | 7.1 | GO:0005262 | calcium channel activity(GO:0005262) |
| 0.1 | 3.8 | GO:0035064 | methylated histone binding(GO:0035064) |
| 0.1 | 0.8 | GO:0008568 | microtubule-severing ATPase activity(GO:0008568) |
| 0.0 | 0.7 | GO:0016684 | peroxidase activity(GO:0004601) oxidoreductase activity, acting on peroxide as acceptor(GO:0016684) |
| 0.0 | 22.7 | GO:0005509 | calcium ion binding(GO:0005509) |
| 0.0 | 8.7 | GO:0003735 | structural constituent of ribosome(GO:0003735) |
| 0.0 | 0.8 | GO:0032266 | phosphatidylinositol-3-phosphate binding(GO:0032266) |
| 0.0 | 9.1 | GO:0005525 | GTP binding(GO:0005525) |
| 0.0 | 4.5 | GO:0061630 | ubiquitin protein ligase activity(GO:0061630) |
| 0.0 | 5.6 | GO:0030246 | carbohydrate binding(GO:0030246) |
| 0.0 | 3.3 | GO:0044822 | mRNA binding(GO:0003729) poly(A) RNA binding(GO:0044822) |
| 0.0 | 19.7 | GO:0004984 | olfactory receptor activity(GO:0004984) |
Gene overrepresentation in curated gene sets: canonical pathways category:
| Log-likelihood per target | Total log-likelihood | Term | Description |
|---|---|---|---|
| 0.6 | 17.4 | PID IL27 PATHWAY | IL27-mediated signaling events |
| 0.3 | 3.5 | PID VEGF VEGFR PATHWAY | VEGF and VEGFR signaling network |
| 0.3 | 25.6 | PID HIF1 TFPATHWAY | HIF-1-alpha transcription factor network |
| 0.3 | 7.8 | PID INTEGRIN CS PATHWAY | Integrin family cell surface interactions |
| 0.3 | 11.0 | PID UPA UPAR PATHWAY | Urokinase-type plasminogen activator (uPA) and uPAR-mediated signaling |
| 0.2 | 23.5 | PID CMYB PATHWAY | C-MYB transcription factor network |
| 0.2 | 7.9 | ST B CELL ANTIGEN RECEPTOR | B Cell Antigen Receptor |
| 0.2 | 3.4 | PID IL23 PATHWAY | IL23-mediated signaling events |
| 0.2 | 2.9 | PID S1P S1P1 PATHWAY | S1P1 pathway |
| 0.2 | 7.0 | PID RET PATHWAY | Signaling events regulated by Ret tyrosine kinase |
| 0.2 | 4.5 | PID IL1 PATHWAY | IL1-mediated signaling events |
| 0.2 | 11.0 | PID E2F PATHWAY | E2F transcription factor network |
| 0.2 | 6.7 | PID HNF3A PATHWAY | FOXA1 transcription factor network |
| 0.1 | 18.6 | NABA ECM REGULATORS | Genes encoding enzymes and their regulators involved in the remodeling of the extracellular matrix |
| 0.1 | 1.1 | SA MMP CYTOKINE CONNECTION | Cytokines can induce activation of matrix metalloproteinases, which degrade extracellular matrix. |
| 0.1 | 8.0 | PID P53 DOWNSTREAM PATHWAY | Direct p53 effectors |
| 0.1 | 2.7 | PID VEGFR1 2 PATHWAY | Signaling events mediated by VEGFR1 and VEGFR2 |
| 0.0 | 2.6 | PID TELOMERASE PATHWAY | Regulation of Telomerase |
| 0.0 | 1.9 | PID P53 REGULATION PATHWAY | p53 pathway |
| 0.0 | 5.6 | NABA ECM AFFILIATED | Genes encoding proteins affiliated structurally or functionally to extracellular matrix proteins |
| 0.0 | 1.2 | PID CXCR4 PATHWAY | CXCR4-mediated signaling events |
| 0.0 | 1.0 | PID PLK1 PATHWAY | PLK1 signaling events |
| 0.0 | 0.3 | PID REELIN PATHWAY | Reelin signaling pathway |
Gene overrepresentation in curated gene sets: REACTOME pathways category:
| Log-likelihood per target | Total log-likelihood | Term | Description |
|---|---|---|---|
| 0.8 | 13.0 | REACTOME ACYL CHAIN REMODELLING OF PS | Genes involved in Acyl chain remodelling of PS |
| 0.7 | 20.6 | REACTOME CASPASE MEDIATED CLEAVAGE OF CYTOSKELETAL PROTEINS | Genes involved in Caspase-mediated cleavage of cytoskeletal proteins |
| 0.7 | 25.6 | REACTOME GLYCOLYSIS | Genes involved in Glycolysis |
| 0.6 | 35.9 | REACTOME ER PHAGOSOME PATHWAY | Genes involved in ER-Phagosome pathway |
| 0.5 | 7.0 | REACTOME IL 6 SIGNALING | Genes involved in Interleukin-6 signaling |
| 0.5 | 25.4 | REACTOME MITOCHONDRIAL PROTEIN IMPORT | Genes involved in Mitochondrial Protein Import |
| 0.5 | 8.8 | REACTOME ENDOGENOUS STEROLS | Genes involved in Endogenous sterols |
| 0.5 | 14.9 | REACTOME SULFUR AMINO ACID METABOLISM | Genes involved in Sulfur amino acid metabolism |
| 0.5 | 4.5 | REACTOME NFKB IS ACTIVATED AND SIGNALS SURVIVAL | Genes involved in NF-kB is activated and signals survival |
| 0.5 | 7.0 | REACTOME SIGNAL ATTENUATION | Genes involved in Signal attenuation |
| 0.4 | 16.3 | REACTOME INWARDLY RECTIFYING K CHANNELS | Genes involved in Inwardly rectifying K+ channels |
| 0.4 | 9.0 | REACTOME REGULATION OF INSULIN LIKE GROWTH FACTOR IGF ACTIVITY BY INSULIN LIKE GROWTH FACTOR BINDING PROTEINS IGFBPS | Genes involved in Regulation of Insulin-like Growth Factor (IGF) Activity by Insulin-like Growth Factor Binding Proteins (IGFBPs) |
| 0.4 | 7.4 | REACTOME SYNTHESIS AND INTERCONVERSION OF NUCLEOTIDE DI AND TRIPHOSPHATES | Genes involved in Synthesis and interconversion of nucleotide di- and triphosphates |
| 0.3 | 3.5 | REACTOME VEGF LIGAND RECEPTOR INTERACTIONS | Genes involved in VEGF ligand-receptor interactions |
| 0.3 | 8.1 | REACTOME INTERACTION BETWEEN L1 AND ANKYRINS | Genes involved in Interaction between L1 and Ankyrins |
| 0.2 | 3.5 | REACTOME CYTOCHROME P450 ARRANGED BY SUBSTRATE TYPE | Genes involved in Cytochrome P450 - arranged by substrate type |
| 0.2 | 2.7 | REACTOME THE NLRP3 INFLAMMASOME | Genes involved in The NLRP3 inflammasome |
| 0.2 | 13.1 | REACTOME METABOLISM OF VITAMINS AND COFACTORS | Genes involved in Metabolism of vitamins and cofactors |
| 0.2 | 1.9 | REACTOME ANTIGEN PRESENTATION FOLDING ASSEMBLY AND PEPTIDE LOADING OF CLASS I MHC | Genes involved in Antigen Presentation: Folding, assembly and peptide loading of class I MHC |
| 0.2 | 7.6 | REACTOME IMMUNOREGULATORY INTERACTIONS BETWEEN A LYMPHOID AND A NON LYMPHOID CELL | Genes involved in Immunoregulatory interactions between a Lymphoid and a non-Lymphoid cell |
| 0.1 | 17.9 | REACTOME PPARA ACTIVATES GENE EXPRESSION | Genes involved in PPARA Activates Gene Expression |
| 0.1 | 7.8 | REACTOME INTEGRIN CELL SURFACE INTERACTIONS | Genes involved in Integrin cell surface interactions |
| 0.1 | 14.1 | REACTOME METABOLISM OF AMINO ACIDS AND DERIVATIVES | Genes involved in Metabolism of amino acids and derivatives |
| 0.1 | 4.6 | REACTOME RNA POL II TRANSCRIPTION PRE INITIATION AND PROMOTER OPENING | Genes involved in RNA Polymerase II Transcription Pre-Initiation And Promoter Opening |
| 0.1 | 11.1 | REACTOME TRANSPORT OF INORGANIC CATIONS ANIONS AND AMINO ACIDS OLIGOPEPTIDES | Genes involved in Transport of inorganic cations/anions and amino acids/oligopeptides |
| 0.1 | 2.5 | REACTOME DOWNREGULATION OF TGF BETA RECEPTOR SIGNALING | Genes involved in Downregulation of TGF-beta receptor signaling |
| 0.1 | 2.9 | REACTOME ASSOCIATION OF TRIC CCT WITH TARGET PROTEINS DURING BIOSYNTHESIS | Genes involved in Association of TriC/CCT with target proteins during biosynthesis |
| 0.1 | 1.1 | REACTOME HYALURONAN UPTAKE AND DEGRADATION | Genes involved in Hyaluronan uptake and degradation |
| 0.1 | 4.7 | REACTOME NUCLEAR RECEPTOR TRANSCRIPTION PATHWAY | Genes involved in Nuclear Receptor transcription pathway |
| 0.1 | 1.6 | REACTOME DEGRADATION OF THE EXTRACELLULAR MATRIX | Genes involved in Degradation of the extracellular matrix |
| 0.1 | 4.0 | REACTOME LOSS OF NLP FROM MITOTIC CENTROSOMES | Genes involved in Loss of Nlp from mitotic centrosomes |
| 0.0 | 2.1 | REACTOME RESPONSE TO ELEVATED PLATELET CYTOSOLIC CA2 | Genes involved in Response to elevated platelet cytosolic Ca2+ |
| 0.0 | 1.0 | REACTOME MITOTIC PROMETAPHASE | Genes involved in Mitotic Prometaphase |