Project
GSE53960: rat RNA-Seq transcriptomic Bodymap
Navigation
Downloads
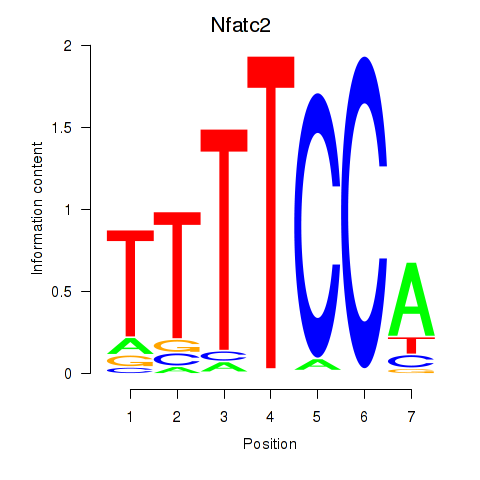
Results for Nfatc2
Z-value: 2.04
Motif logo
Transcription factors associated with Nfatc2
| Gene Symbol | Gene ID | Gene Info |
|---|---|---|
|
Nfatc2
|
ENSRNOG00000012175 | nuclear factor of activated T-cells 2 |
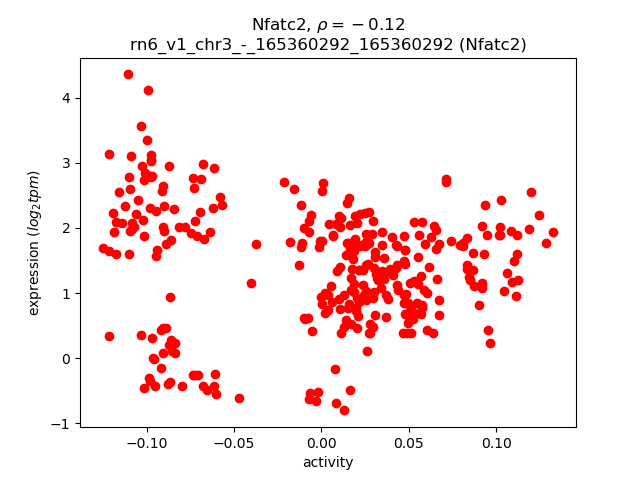
Activity-expression correlation:
| Gene | Promoter | Pearson corr. coef. | P-value | Plot |
|---|---|---|---|---|
| Nfatc2 | rn6_v1_chr3_-_165360292_165360292 | -0.12 | 3.4e-02 | Click! |
Activity profile of Nfatc2 motif
Sorted Z-values of Nfatc2 motif
| Promoter | Log-likelihood | Transcript | Gene | Gene Info |
|---|---|---|---|---|
| chr8_-_82533689 | 80.58 |
ENSRNOT00000014124
|
Tmod2
|
tropomodulin 2 |
| chrX_+_6791136 | 63.06 |
ENSRNOT00000003984
|
LOC100909913
|
norrin-like |
| chr2_+_58448917 | 51.66 |
ENSRNOT00000082562
|
Ranbp3l
|
RAN binding protein 3-like |
| chr17_-_81187739 | 46.59 |
ENSRNOT00000063911
|
Hacd1
|
3-hydroxyacyl-CoA dehydratase 1 |
| chr5_+_64294321 | 46.32 |
ENSRNOT00000083796
|
Msantd3
|
Myb/SANT DNA binding domain containing 3 |
| chr4_-_29778039 | 46.30 |
ENSRNOT00000074177
|
Sgce
|
sarcoglycan, epsilon |
| chrX_+_107323215 | 45.94 |
ENSRNOT00000071874
|
Tceal3
|
transcription elongation factor A like 3 |
| chr2_-_102370757 | 44.65 |
ENSRNOT00000074255
|
Tceal6
|
transcription elongation factor A (SII)-like 6 |
| chr9_-_32019205 | 44.32 |
ENSRNOT00000016194
|
Adgrb3
|
adhesion G protein-coupled receptor B3 |
| chr3_-_48535909 | 43.64 |
ENSRNOT00000008148
|
Fap
|
fibroblast activation protein, alpha |
| chr11_+_36555416 | 43.49 |
ENSRNOT00000064981
|
Sh3bgr
|
SH3 domain binding glutamate-rich protein |
| chr9_-_61810417 | 42.96 |
ENSRNOT00000020910
|
Rftn2
|
raftlin family member 2 |
| chr1_+_37507276 | 41.59 |
ENSRNOT00000047627
|
Adcy2
|
adenylate cyclase 2 |
| chrX_-_106747303 | 41.15 |
ENSRNOT00000073529
|
Tceal5
|
transcription elongation factor A like 5 |
| chr18_+_30023828 | 37.44 |
ENSRNOT00000079008
|
Pcdha4
|
protocadherin alpha 4 |
| chr18_+_29993361 | 35.49 |
ENSRNOT00000075810
|
Pcdha4
|
protocadherin alpha 4 |
| chr15_+_50891127 | 34.91 |
ENSRNOT00000020728
|
Stc1
|
stanniocalcin 1 |
| chr2_+_60920257 | 34.06 |
ENSRNOT00000025170
|
C1qtnf3
|
C1q and tumor necrosis factor related protein 3 |
| chr8_-_105462141 | 33.95 |
ENSRNOT00000066731
ENSRNOT00000078760 |
Clstn2
|
calsyntenin 2 |
| chr13_+_113691932 | 33.60 |
ENSRNOT00000084709
|
Cd34
|
CD34 molecule |
| chr11_-_39448503 | 32.07 |
ENSRNOT00000047347
|
LOC102553613
|
SH3 domain-binding glutamic acid-rich protein-like |
| chr14_-_112946204 | 31.99 |
ENSRNOT00000056813
|
LOC103690141
|
coiled-coil domain-containing protein 85A-like |
| chr2_-_247446882 | 31.74 |
ENSRNOT00000021963
|
Bmpr1b
|
bone morphogenetic protein receptor type 1B |
| chr18_+_29987206 | 31.71 |
ENSRNOT00000027383
|
Pcdha4
|
protocadherin alpha 4 |
| chr2_-_44907030 | 30.44 |
ENSRNOT00000013979
|
Gpx8
|
glutathione peroxidase 8 |
| chr11_+_75905443 | 30.39 |
ENSRNOT00000002650
|
Fgf12
|
fibroblast growth factor 12 |
| chr8_+_44847157 | 30.14 |
ENSRNOT00000080288
|
Clmp
|
CXADR-like membrane protein |
| chr2_-_62634785 | 30.11 |
ENSRNOT00000017937
|
Pdzd2
|
PDZ domain containing 2 |
| chr12_-_12712742 | 29.62 |
ENSRNOT00000034483
|
Rsph10b
|
radial spoke head 10 homolog B |
| chr7_-_29701586 | 29.24 |
ENSRNOT00000009084
ENSRNOT00000089269 |
Ano4
|
anoctamin 4 |
| chr3_+_122836446 | 29.09 |
ENSRNOT00000028816
|
Ebf4
|
early B-cell factor 4 |
| chr4_-_16130848 | 29.01 |
ENSRNOT00000042914
|
Cacna2d1
|
calcium voltage-gated channel auxiliary subunit alpha2delta 1 |
| chr3_-_48536235 | 29.00 |
ENSRNOT00000083536
|
Fap
|
fibroblast activation protein, alpha |
| chr5_+_59228199 | 28.89 |
ENSRNOT00000060282
|
Hrct1
|
histidine rich carboxyl terminus 1 |
| chr3_-_176666282 | 28.49 |
ENSRNOT00000016947
|
Eef1a2
|
eukaryotic translation elongation factor 1 alpha 2 |
| chr4_-_16130563 | 28.42 |
ENSRNOT00000090240
ENSRNOT00000034969 |
Cacna2d1
|
calcium voltage-gated channel auxiliary subunit alpha2delta 1 |
| chrX_-_40086870 | 28.35 |
ENSRNOT00000010027
|
Smpx
|
small muscle protein, X-linked |
| chr18_+_29966245 | 28.34 |
ENSRNOT00000074028
|
Pcdha4
|
protocadherin alpha 4 |
| chr7_+_139685573 | 27.74 |
ENSRNOT00000088376
|
Pfkm
|
phosphofructokinase, muscle |
| chr18_+_30496318 | 27.32 |
ENSRNOT00000027179
|
Pcdhb11
|
protocadherin beta 11 |
| chr9_+_84569597 | 27.15 |
ENSRNOT00000020161
|
Acsl3
|
acyl-CoA synthetase long-chain family member 3 |
| chr18_+_29999290 | 27.12 |
ENSRNOT00000027372
|
Pcdha4
|
protocadherin alpha 4 |
| chr3_-_107760550 | 27.09 |
ENSRNOT00000077091
ENSRNOT00000051638 |
Meis2
|
Meis homeobox 2 |
| chr2_+_266315036 | 27.00 |
ENSRNOT00000055245
|
Wls
|
wntless Wnt ligand secretion mediator |
| chr6_+_98284170 | 26.87 |
ENSRNOT00000031979
|
Rhoj
|
ras homolog family member J |
| chr8_-_87419564 | 26.72 |
ENSRNOT00000015365
|
Filip1
|
filamin A interacting protein 1 |
| chr9_-_88256115 | 26.57 |
ENSRNOT00000076472
|
Col4a4
|
collagen type IV alpha 4 chain |
| chr10_+_71159869 | 26.49 |
ENSRNOT00000075977
ENSRNOT00000047427 |
Hnf1b
|
HNF1 homeobox B |
| chr6_-_39363367 | 26.36 |
ENSRNOT00000088687
ENSRNOT00000065531 |
Fam84a
|
family with sequence similarity 84, member A |
| chr18_+_30527705 | 25.54 |
ENSRNOT00000027168
|
Pcdhb14
|
protocadherin beta 14 |
| chr13_+_80125391 | 25.43 |
ENSRNOT00000044190
|
Mir199a2
|
microRNA 199a-2 |
| chr3_+_113318563 | 24.73 |
ENSRNOT00000089230
|
Ckmt1
|
creatine kinase, mitochondrial 1 |
| chr10_+_42614713 | 24.49 |
ENSRNOT00000081136
ENSRNOT00000073148 |
Gria1
|
glutamate ionotropic receptor AMPA type subunit 1 |
| chr8_-_107656861 | 24.10 |
ENSRNOT00000050374
|
Mras
|
muscle RAS oncogene homolog |
| chr1_-_236900904 | 24.02 |
ENSRNOT00000066846
|
AABR07006480.1
|
|
| chr18_+_29960072 | 23.84 |
ENSRNOT00000071366
|
AC103179.1
|
|
| chr6_-_109935533 | 23.71 |
ENSRNOT00000013516
|
Tgfb3
|
transforming growth factor, beta 3 |
| chr6_-_23291568 | 23.41 |
ENSRNOT00000085708
|
Clip4
|
CAP-GLY domain containing linker protein family, member 4 |
| chr11_-_65845418 | 23.31 |
ENSRNOT00000091057
|
Fstl1
|
follistatin-like 1 |
| chr3_+_14482388 | 23.29 |
ENSRNOT00000025857
|
Gsn
|
gelsolin |
| chr4_-_17594598 | 23.29 |
ENSRNOT00000008936
|
Sema3e
|
semaphorin 3E |
| chr11_+_33863500 | 23.25 |
ENSRNOT00000072384
|
LOC102556347
|
carbonyl reductase [NADPH] 1-like |
| chr2_-_184993341 | 23.13 |
ENSRNOT00000071580
|
Fam160a1
|
family with sequence similarity 160, member A1 |
| chr17_+_5513930 | 22.96 |
ENSRNOT00000091370
|
Agtpbp1
|
ATP/GTP binding protein 1 |
| chrX_-_139916883 | 22.84 |
ENSRNOT00000090442
|
Gpc3
|
glypican 3 |
| chrX_-_142131545 | 22.44 |
ENSRNOT00000077402
|
Fgf13
|
fibroblast growth factor 13 |
| chr18_+_30036887 | 22.44 |
ENSRNOT00000077824
|
Pcdha4
|
protocadherin alpha 4 |
| chr10_+_84135116 | 21.59 |
ENSRNOT00000031035
|
Hoxb7
|
homeo box B7 |
| chr8_+_23113048 | 21.52 |
ENSRNOT00000029577
|
Cnn1
|
calponin 1 |
| chr10_-_86690815 | 21.07 |
ENSRNOT00000012537
|
Nr1d1
|
nuclear receptor subfamily 1, group D, member 1 |
| chr18_+_30562178 | 20.94 |
ENSRNOT00000040998
|
LOC108348771
|
protocadherin beta-16-like |
| chr18_+_58270410 | 20.88 |
ENSRNOT00000067554
|
Apcdd1
|
APC down-regulated 1 |
| chr3_+_139695028 | 20.68 |
ENSRNOT00000089098
|
Slc24a3
|
solute carrier family 24 member 3 |
| chr8_-_72841496 | 20.29 |
ENSRNOT00000057641
ENSRNOT00000040808 ENSRNOT00000085894 ENSRNOT00000024575 ENSRNOT00000048044 ENSRNOT00000024493 |
Tpm1
|
tropomyosin 1, alpha |
| chr10_+_23661013 | 20.19 |
ENSRNOT00000076664
|
Ebf1
|
early B-cell factor 1 |
| chr3_-_101547478 | 20.17 |
ENSRNOT00000006203
|
Fibin
|
fin bud initiation factor homolog (zebrafish) |
| chr2_-_185303610 | 20.05 |
ENSRNOT00000093479
ENSRNOT00000046286 |
NEWGENE_1592020
|
protease, serine 48 |
| chr11_+_33812989 | 20.02 |
ENSRNOT00000042283
ENSRNOT00000075985 |
Cbr1
|
carbonyl reductase 1 |
| chr7_+_58814805 | 19.87 |
ENSRNOT00000005909
|
Tspan8
|
tetraspanin 8 |
| chr19_+_568287 | 19.62 |
ENSRNOT00000016419
|
Cdh16
|
cadherin 16 |
| chrX_+_105537602 | 19.57 |
ENSRNOT00000029833
|
Armcx1
|
armadillo repeat containing, X-linked 1 |
| chr2_+_251200686 | 19.49 |
ENSRNOT00000019210
|
Col24a1
|
collagen type XXIV alpha 1 chain |
| chr18_+_29972808 | 19.23 |
ENSRNOT00000074051
|
Pcdha4
|
protocadherin alpha 4 |
| chr16_+_54332660 | 19.20 |
ENSRNOT00000037685
|
Mtus1
|
microtubule associated tumor suppressor 1 |
| chr2_-_79078258 | 19.19 |
ENSRNOT00000031170
|
Fbxl7
|
F-box and leucine-rich repeat protein 7 |
| chr2_+_196655469 | 18.97 |
ENSRNOT00000028730
|
Ctsk
|
cathepsin K |
| chr3_+_113818872 | 18.81 |
ENSRNOT00000044158
|
Casc4
|
cancer susceptibility candidate 4 |
| chr20_+_44060731 | 18.79 |
ENSRNOT00000000737
|
Lama4
|
laminin subunit alpha 4 |
| chr4_+_153330069 | 18.72 |
ENSRNOT00000015560
|
Slc25a18
|
solute carrier family 25 member 18 |
| chr12_-_29743705 | 18.71 |
ENSRNOT00000001185
|
Caln1
|
calneuron 1 |
| chr12_-_5685448 | 18.70 |
ENSRNOT00000077167
|
Fry
|
FRY microtubule binding protein |
| chr18_-_37096132 | 18.59 |
ENSRNOT00000041188
|
Ppp2r2b
|
protein phosphatase 2, regulatory subunit B, beta |
| chr18_+_30004565 | 18.57 |
ENSRNOT00000027393
|
Pcdha4
|
protocadherin alpha 4 |
| chr14_+_86922223 | 18.54 |
ENSRNOT00000086468
|
Ramp3
|
receptor activity modifying protein 3 |
| chr10_+_92337879 | 18.52 |
ENSRNOT00000042984
|
Mapt
|
microtubule-associated protein tau |
| chrX_-_115073890 | 18.48 |
ENSRNOT00000006638
|
Capn6
|
calpain 6 |
| chr18_+_30890869 | 18.39 |
ENSRNOT00000060466
|
Pcdhgb6
|
protocadherin gamma subfamily B, 6 |
| chr18_+_30017918 | 18.30 |
ENSRNOT00000079794
|
Pcdha4
|
protocadherin alpha 4 |
| chr1_+_66898946 | 18.27 |
ENSRNOT00000074063
|
Zfp551
|
zinc finger protein 551 |
| chr8_-_82641536 | 18.22 |
ENSRNOT00000014491
|
Scg3
|
secretogranin III |
| chr14_+_70780623 | 18.20 |
ENSRNOT00000083871
ENSRNOT00000058803 |
Ldb2
|
LIM domain binding 2 |
| chr9_+_60039297 | 18.18 |
ENSRNOT00000016262
|
Slc39a10
|
solute carrier family 39 member 10 |
| chr13_-_86671515 | 18.11 |
ENSRNOT00000082869
|
AABR07021704.1
|
|
| chr8_-_17525906 | 18.01 |
ENSRNOT00000007855
|
Naalad2
|
N-acetylated alpha-linked acidic dipeptidase 2 |
| chr1_+_72860218 | 18.00 |
ENSRNOT00000024547
|
Syt5
|
synaptotagmin 5 |
| chr6_+_99433550 | 17.80 |
ENSRNOT00000079359
ENSRNOT00000008504 |
Hspa2
|
heat shock protein family A member 2 |
| chr10_-_32471454 | 17.72 |
ENSRNOT00000003224
|
Sgcd
|
sarcoglycan, delta |
| chr10_+_3411380 | 17.67 |
ENSRNOT00000004346
|
RGD1305733
|
similar to RIKEN cDNA 2900011O08 |
| chr5_-_72000318 | 17.65 |
ENSRNOT00000029187
|
AABR07048308.1
|
|
| chr6_-_38228379 | 17.61 |
ENSRNOT00000084924
|
Mycn
|
v-myc avian myelocytomatosis viral oncogene neuroblastoma derived homolog |
| chr6_-_125723944 | 17.59 |
ENSRNOT00000007004
|
Fbln5
|
fibulin 5 |
| chr7_+_38819771 | 17.53 |
ENSRNOT00000006109
|
Lum
|
lumican |
| chr1_+_89008117 | 17.52 |
ENSRNOT00000028401
|
Hspb6
|
heat shock protein family B (small) member 6 |
| chr7_+_120153184 | 17.46 |
ENSRNOT00000013538
|
Lgals1
|
galectin 1 |
| chrX_+_86126157 | 17.46 |
ENSRNOT00000006992
|
Klhl4
|
kelch-like family member 4 |
| chr18_+_29951094 | 17.45 |
ENSRNOT00000027402
|
LOC102553180
|
protocadherin alpha-1-like |
| chrX_+_119390013 | 17.44 |
ENSRNOT00000074269
|
Agtr2
|
angiotensin II receptor, type 2 |
| chr1_-_164308317 | 17.32 |
ENSRNOT00000022983
|
Serpinh1
|
serpin family H member 1 |
| chr18_+_30381322 | 17.29 |
ENSRNOT00000027216
|
Pcdhb3
|
protocadherin beta 3 |
| chr10_+_74871523 | 17.19 |
ENSRNOT00000076995
ENSRNOT00000076026 ENSRNOT00000088581 ENSRNOT00000076701 |
Sept4
|
septin 4 |
| chr1_-_250626844 | 17.16 |
ENSRNOT00000077135
|
Asah2
|
N-acylsphingosine amidohydrolase 2 |
| chr3_+_113251778 | 17.10 |
ENSRNOT00000083005
|
Map1a
|
microtubule-associated protein 1A |
| chr1_+_44311513 | 16.98 |
ENSRNOT00000065386
|
Tiam2
|
T-cell lymphoma invasion and metastasis 2 |
| chr1_+_64928503 | 16.86 |
ENSRNOT00000086274
|
Vom2r80
|
vomeronasal 2 receptor, 80 |
| chr16_+_80908340 | 16.83 |
ENSRNOT00000057761
|
Tmco3
|
transmembrane and coiled-coil domains 3 |
| chr9_-_44237117 | 16.81 |
ENSRNOT00000068496
|
RGD1310819
|
similar to putative protein (5S487) |
| chr13_+_98311827 | 16.76 |
ENSRNOT00000082844
|
Cdc42bpa
|
CDC42 binding protein kinase alpha |
| chr4_+_180291389 | 16.75 |
ENSRNOT00000002465
|
Sspn
|
sarcospan |
| chr7_+_144647587 | 16.48 |
ENSRNOT00000022398
|
Hoxc4
|
homeo box C4 |
| chr17_-_15467320 | 16.47 |
ENSRNOT00000072490
ENSRNOT00000093561 |
Ogn
|
osteoglycin |
| chr6_-_125723732 | 16.39 |
ENSRNOT00000084815
|
Fbln5
|
fibulin 5 |
| chr2_+_54191538 | 16.33 |
ENSRNOT00000019524
|
Plcxd3
|
phosphatidylinositol-specific phospholipase C, X domain containing 3 |
| chr7_+_140967282 | 16.29 |
ENSRNOT00000091306
|
Prpf40b
|
pre-mRNA processing factor 40 homolog B |
| chr2_+_203768729 | 16.09 |
ENSRNOT00000018895
|
Igsf3
|
immunoglobulin superfamily, member 3 |
| chr10_+_90930010 | 16.08 |
ENSRNOT00000003765
|
Higd1b
|
HIG1 hypoxia inducible domain family, member 1B |
| chr3_+_154043873 | 16.04 |
ENSRNOT00000072502
ENSRNOT00000034166 |
Nnat
|
neuronatin |
| chr6_-_94980004 | 15.96 |
ENSRNOT00000006373
|
Rtn1
|
reticulon 1 |
| chr6_+_3012804 | 15.79 |
ENSRNOT00000061980
|
Arhgef33
|
Rho guanine nucleotide exchange factor 33 |
| chr11_-_11213821 | 15.65 |
ENSRNOT00000093706
|
Robo2
|
roundabout guidance receptor 2 |
| chr4_-_89281222 | 15.64 |
ENSRNOT00000010898
|
Fam13a
|
family with sequence similarity 13, member A |
| chr2_+_22910236 | 15.61 |
ENSRNOT00000078266
|
Homer1
|
homer scaffolding protein 1 |
| chr1_+_206900617 | 15.56 |
ENSRNOT00000054897
|
Dock1
|
dedicator of cyto-kinesis 1 |
| chr6_+_76675418 | 15.52 |
ENSRNOT00000076169
ENSRNOT00000010948 ENSRNOT00000082286 |
Brms1l
Brms1l
|
breast cancer metastasis-suppressor 1-like breast cancer metastasis-suppressor 1-like |
| chr11_-_64583994 | 15.48 |
ENSRNOT00000004289
|
B4galt4
|
beta-1,4-galactosyltransferase 4 |
| chr2_-_123193130 | 15.42 |
ENSRNOT00000019554
|
Anxa5
|
annexin A5 |
| chr4_+_28989115 | 15.28 |
ENSRNOT00000075326
|
Gng11
|
G protein subunit gamma 11 |
| chr16_+_49266903 | 15.23 |
ENSRNOT00000014704
|
Slc25a4
|
solute carrier family 25 member 4 |
| chr14_-_43143973 | 15.20 |
ENSRNOT00000003248
|
Uchl1
|
ubiquitin C-terminal hydrolase L1 |
| chr18_+_30550877 | 15.17 |
ENSRNOT00000027164
|
LOC108348201
|
protocadherin beta-7-like |
| chr5_+_22392732 | 15.06 |
ENSRNOT00000087182
|
Clvs1
|
clavesin 1 |
| chr3_+_14889510 | 15.05 |
ENSRNOT00000080760
|
Dab2ip
|
DAB2 interacting protein |
| chr13_-_73819896 | 15.01 |
ENSRNOT00000036392
|
Fam163a
|
family with sequence similarity 163, member A |
| chr18_+_30010918 | 14.94 |
ENSRNOT00000084132
|
Pcdha4
|
protocadherin alpha 4 |
| chr1_-_80331626 | 14.81 |
ENSRNOT00000022577
|
AABR07002677.1
|
|
| chr3_+_132560506 | 14.80 |
ENSRNOT00000005920
|
Sptlc3
|
serine palmitoyltransferase, long chain base subunit 3 |
| chr7_-_121232741 | 14.72 |
ENSRNOT00000023196
|
Pdgfb
|
platelet derived growth factor subunit B |
| chr11_-_62128044 | 14.67 |
ENSRNOT00000093141
|
Zbtb20
|
zinc finger and BTB domain containing 20 |
| chrX_-_66602458 | 14.61 |
ENSRNOT00000076510
ENSRNOT00000017429 |
Eda2r
|
ectodysplasin A2 receptor |
| chr11_+_42945084 | 14.56 |
ENSRNOT00000002292
|
Crybg3
|
crystallin beta-gamma domain containing 3 |
| chr18_-_28017925 | 14.45 |
ENSRNOT00000075420
|
Lrrtm2
|
leucine rich repeat transmembrane neuronal 2 |
| chr2_-_46476203 | 14.38 |
ENSRNOT00000015217
|
Ndufs4
|
NADH:ubiquinone oxidoreductase subunit S4 |
| chr18_+_56364620 | 14.32 |
ENSRNOT00000068535
ENSRNOT00000086033 |
Pdgfrb
|
platelet derived growth factor receptor beta |
| chr18_+_61258911 | 14.31 |
ENSRNOT00000082403
|
Zfp532
|
zinc finger protein 532 |
| chr1_+_40389638 | 14.27 |
ENSRNOT00000021471
|
Plekhg1
|
pleckstrin homology and RhoGEF domain containing G1 |
| chr1_-_270472866 | 14.26 |
ENSRNOT00000015979
|
Sorcs1
|
sortilin-related VPS10 domain containing receptor 1 |
| chr18_+_65155685 | 14.25 |
ENSRNOT00000081797
|
Tcf4
|
transcription factor 4 |
| chr4_-_176922424 | 14.18 |
ENSRNOT00000055540
|
Abcc9
|
ATP binding cassette subfamily C member 9 |
| chr3_+_129599353 | 14.12 |
ENSRNOT00000008734
|
Snap25
|
synaptosomal-associated protein 25 |
| chr1_-_62558033 | 13.99 |
ENSRNOT00000015520
|
Zfp40
|
zinc finger protein 40 |
| chr8_-_114449956 | 13.94 |
ENSRNOT00000056414
|
Col6a6
|
collagen type VI alpha 6 chain |
| chr13_-_107886476 | 13.92 |
ENSRNOT00000077282
|
Kcnk2
|
potassium two pore domain channel subfamily K member 2 |
| chr18_-_55916220 | 13.78 |
ENSRNOT00000025934
|
Synpo
|
synaptopodin |
| chr9_+_50526811 | 13.74 |
ENSRNOT00000036990
|
RGD1305645
|
similar to RIKEN cDNA 1500015O10 |
| chr1_+_41192824 | 13.73 |
ENSRNOT00000082133
|
Esr1
|
estrogen receptor 1 |
| chr4_+_113968995 | 13.69 |
ENSRNOT00000079511
|
Rtkn
|
rhotekin |
| chr2_-_184289126 | 13.57 |
ENSRNOT00000081678
|
Fbxw7
|
F-box and WD repeat domain containing 7 |
| chr15_+_4125373 | 13.52 |
ENSRNOT00000029615
|
Usp54
|
ubiquitin specific peptidase 54 |
| chr11_-_11214141 | 13.51 |
ENSRNOT00000065748
|
Robo2
|
roundabout guidance receptor 2 |
| chr2_-_197991198 | 13.50 |
ENSRNOT00000056322
|
Ciart
|
circadian associated repressor of transcription |
| chr2_+_237148941 | 13.39 |
ENSRNOT00000015116
|
Dkk2
|
dickkopf WNT signaling pathway inhibitor 2 |
| chr4_+_114835064 | 13.38 |
ENSRNOT00000031964
|
LOC103692165
|
rhotekin |
| chr3_+_79613171 | 13.36 |
ENSRNOT00000011467
|
Agbl2
|
ATP/GTP binding protein-like 2 |
| chr8_-_62987182 | 13.21 |
ENSRNOT00000070885
|
Islr2
|
immunoglobulin superfamily containing leucine-rich repeat 2 |
| chr17_-_14679409 | 13.19 |
ENSRNOT00000020704
|
Aspn
|
asporin |
| chr5_-_77945016 | 13.18 |
ENSRNOT00000076223
|
Zfp37
|
zinc finger protein 37 |
| chr6_+_76349362 | 13.14 |
ENSRNOT00000043224
|
Aldoart2
|
aldolase 1 A retrogene 2 |
| chr6_-_114488880 | 13.12 |
ENSRNOT00000087560
|
AC118957.1
|
|
| chr5_-_28164326 | 12.95 |
ENSRNOT00000088165
|
Slc26a7
|
solute carrier family 26 member 7 |
| chr11_-_75144903 | 12.80 |
ENSRNOT00000002329
|
Hrasls
|
HRAS-like suppressor |
| chrX_-_105568343 | 12.72 |
ENSRNOT00000029807
|
Armcx6
|
armadillo repeat containing, X-linked 6 |
| chr19_-_59991590 | 12.68 |
ENSRNOT00000091620
|
AABR07072668.1
|
|
| chr4_+_70252366 | 12.66 |
ENSRNOT00000073039
|
Chl1
|
cell adhesion molecule L1-like |
| chr9_+_14529218 | 12.66 |
ENSRNOT00000016893
|
Apobec2
|
apolipoprotein B mRNA editing enzyme catalytic subunit 2 |
| chr8_+_99880073 | 12.64 |
ENSRNOT00000010765
|
Plscr4
|
phospholipid scramblase 4 |
| chr8_-_109621408 | 12.62 |
ENSRNOT00000087398
|
Ppp2r3a
|
protein phosphatase 2, regulatory subunit B'', alpha |
| chr1_+_171793782 | 12.61 |
ENSRNOT00000081351
|
Olfml1
|
olfactomedin-like 1 |
| chr8_-_109576353 | 12.57 |
ENSRNOT00000010320
|
Ppp2r3a
|
protein phosphatase 2, regulatory subunit B'', alpha |
| chr10_+_17327275 | 12.52 |
ENSRNOT00000005486
|
Ubtd2
|
ubiquitin domain containing 2 |
| chr1_+_252409268 | 12.46 |
ENSRNOT00000026219
|
Lipm
|
lipase, family member M |
| chr11_+_75434197 | 12.44 |
ENSRNOT00000032569
|
Mb21d2
|
Mab-21 domain containing 2 |
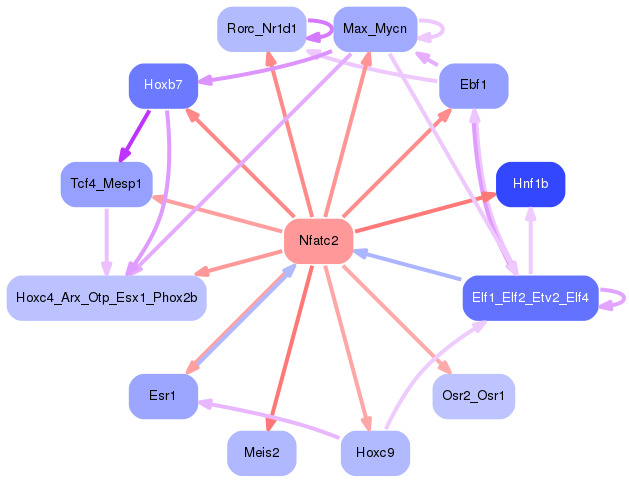
Network of associatons between targets according to the STRING database.

First level regulatory network of Nfatc2
Gene Ontology Analysis
Gene overrepresentation in biological process category:
| Log-likelihood per target | Total log-likelihood | Term | Description |
|---|---|---|---|
| 24.2 | 72.6 | GO:0097325 | melanocyte proliferation(GO:0097325) |
| 16.1 | 48.3 | GO:0072254 | metanephric mesangial cell differentiation(GO:0072209) metanephric glomerular mesangial cell differentiation(GO:0072254) |
| 15.5 | 46.6 | GO:0071529 | cementum mineralization(GO:0071529) |
| 10.7 | 32.0 | GO:1901146 | mesonephros morphogenesis(GO:0061206) mesonephric nephron development(GO:0061215) mesonephric nephron morphogenesis(GO:0061228) mesenchymal stem cell maintenance involved in mesonephric nephron morphogenesis(GO:0061235) regulation of mesenchymal cell apoptotic process involved in mesonephric nephron morphogenesis(GO:0061295) negative regulation of mesenchymal cell apoptotic process involved in mesonephric nephron morphogenesis(GO:0061296) mesenchymal cell apoptotic process involved in mesonephric nephron morphogenesis(GO:1901146) |
| 10.1 | 80.6 | GO:0051694 | pointed-end actin filament capping(GO:0051694) |
| 9.6 | 57.4 | GO:1901843 | membrane depolarization during bundle of His cell action potential(GO:0086048) positive regulation of high voltage-gated calcium channel activity(GO:1901843) |
| 9.1 | 27.2 | GO:2001245 | regulation of phosphatidylcholine biosynthetic process(GO:2001245) |
| 9.0 | 27.0 | GO:0061357 | positive regulation of Wnt protein secretion(GO:0061357) |
| 8.9 | 44.3 | GO:0061743 | motor learning(GO:0061743) |
| 8.7 | 34.7 | GO:1903225 | negative regulation of endodermal cell differentiation(GO:1903225) |
| 8.4 | 25.2 | GO:0090249 | cell motility involved in somitogenic axis elongation(GO:0090247) regulation of cell motility involved in somitogenic axis elongation(GO:0090249) |
| 7.9 | 23.7 | GO:1905075 | occluding junction disassembly(GO:1905071) regulation of occluding junction disassembly(GO:1905073) positive regulation of occluding junction disassembly(GO:1905075) |
| 7.8 | 23.3 | GO:1903903 | protein processing in phagocytic vesicle(GO:1900756) regulation of establishment of T cell polarity(GO:1903903) regulation of protein processing in phagocytic vesicle(GO:1903921) positive regulation of protein processing in phagocytic vesicle(GO:1903923) |
| 7.7 | 30.8 | GO:1901662 | phylloquinone metabolic process(GO:0042374) phylloquinone catabolic process(GO:0042376) quinone catabolic process(GO:1901662) |
| 7.2 | 43.0 | GO:0033227 | dsRNA transport(GO:0033227) |
| 7.0 | 21.1 | GO:0060086 | circadian temperature homeostasis(GO:0060086) |
| 6.9 | 27.7 | GO:0061622 | glycolytic process through glucose-1-phosphate(GO:0061622) |
| 6.8 | 33.9 | GO:0050925 | negative regulation of negative chemotaxis(GO:0050925) |
| 6.8 | 20.3 | GO:0003065 | positive regulation of heart rate by epinephrine(GO:0003065) |
| 6.4 | 19.1 | GO:0006480 | N-terminal protein amino acid methylation(GO:0006480) |
| 6.1 | 30.4 | GO:1905150 | regulation of voltage-gated sodium channel activity(GO:1905150) |
| 5.8 | 29.2 | GO:0061589 | calcium activated phosphatidylserine scrambling(GO:0061589) |
| 5.8 | 17.4 | GO:0035566 | G-protein coupled receptor signaling pathway coupled to cGMP nucleotide second messenger(GO:0007199) negative regulation of icosanoid secretion(GO:0032304) regulation of metanephros size(GO:0035566) |
| 5.7 | 22.8 | GO:0072180 | mesonephric duct morphogenesis(GO:0072180) |
| 5.5 | 16.5 | GO:1990792 | response to glial cell derived neurotrophic factor(GO:1990790) cellular response to glial cell derived neurotrophic factor(GO:1990792) |
| 5.4 | 10.8 | GO:0036023 | embryonic skeletal limb joint morphogenesis(GO:0036023) |
| 5.2 | 36.3 | GO:0035610 | protein side chain deglutamylation(GO:0035610) |
| 5.1 | 15.3 | GO:1903378 | positive regulation of oxidative stress-induced neuron intrinsic apoptotic signaling pathway(GO:1903378) |
| 5.0 | 10.0 | GO:1903181 | regulation of dopamine biosynthetic process(GO:1903179) positive regulation of dopamine biosynthetic process(GO:1903181) |
| 4.8 | 14.5 | GO:0060838 | lymphatic endothelial cell fate commitment(GO:0060838) regulation of transcription involved in lymphatic endothelial cell fate commitment(GO:0060849) |
| 4.7 | 14.1 | GO:1990926 | short-term synaptic potentiation(GO:1990926) |
| 4.7 | 18.7 | GO:1904428 | negative regulation of tubulin deacetylation(GO:1904428) |
| 4.6 | 9.3 | GO:0035564 | regulation of kidney size(GO:0035564) |
| 4.6 | 13.9 | GO:1900039 | positive regulation of cellular response to hypoxia(GO:1900039) |
| 4.4 | 17.8 | GO:1901896 | positive regulation of calcium-transporting ATPase activity(GO:1901896) |
| 4.3 | 34.1 | GO:0070163 | adiponectin secretion(GO:0070162) regulation of adiponectin secretion(GO:0070163) |
| 3.9 | 27.1 | GO:0022605 | oogenesis stage(GO:0022605) |
| 3.8 | 15.2 | GO:2000277 | positive regulation of oxidative phosphorylation uncoupler activity(GO:2000277) |
| 3.8 | 15.1 | GO:0036324 | vascular endothelial growth factor receptor-2 signaling pathway(GO:0036324) |
| 3.6 | 10.9 | GO:0098971 | anterograde dendritic transport of neurotransmitter receptor complex(GO:0098971) |
| 3.6 | 14.3 | GO:0072223 | cell migration involved in vasculogenesis(GO:0035441) VEGF-activated platelet-derived growth factor receptor signaling pathway(GO:0038086) positive regulation of cell proliferation by VEGF-activated platelet derived growth factor receptor signaling pathway(GO:0038091) metanephric glomerular mesangium development(GO:0072223) metanephric glomerulus morphogenesis(GO:0072275) metanephric glomerulus vasculature morphogenesis(GO:0072276) metanephric glomerular capillary formation(GO:0072277) |
| 3.5 | 10.6 | GO:0001827 | inner cell mass cell fate commitment(GO:0001827) inner cell mass cellular morphogenesis(GO:0001828) |
| 3.5 | 10.6 | GO:0045763 | negative regulation of cellular amino acid metabolic process(GO:0045763) |
| 3.5 | 24.5 | GO:0099566 | regulation of postsynaptic cytosolic calcium ion concentration(GO:0099566) |
| 3.5 | 17.5 | GO:0002317 | plasma cell differentiation(GO:0002317) |
| 3.4 | 13.8 | GO:0098886 | modification of dendritic spine(GO:0098886) |
| 3.4 | 17.2 | GO:0030382 | sperm mitochondrion organization(GO:0030382) |
| 3.4 | 13.7 | GO:1990375 | baculum development(GO:1990375) |
| 3.4 | 34.0 | GO:0048251 | elastic fiber assembly(GO:0048251) |
| 3.3 | 9.9 | GO:0032474 | otolith morphogenesis(GO:0032474) |
| 3.3 | 9.8 | GO:1902462 | regulation of mesenchymal stem cell proliferation(GO:1902460) positive regulation of mesenchymal stem cell proliferation(GO:1902462) |
| 3.2 | 9.6 | GO:0071898 | regulation of estrogen receptor binding(GO:0071898) negative regulation of estrogen receptor binding(GO:0071899) |
| 3.2 | 22.4 | GO:0045196 | establishment or maintenance of neuroblast polarity(GO:0045196) establishment of neuroblast polarity(GO:0045200) |
| 3.2 | 464.7 | GO:0007156 | homophilic cell adhesion via plasma membrane adhesion molecules(GO:0007156) |
| 3.2 | 25.4 | GO:0002091 | negative regulation of receptor internalization(GO:0002091) |
| 3.2 | 12.7 | GO:0016554 | cytidine to uridine editing(GO:0016554) |
| 3.2 | 19.0 | GO:0001957 | intramembranous ossification(GO:0001957) direct ossification(GO:0036072) |
| 3.1 | 9.3 | GO:0051935 | amino acid neurotransmitter reuptake(GO:0051933) glutamate reuptake(GO:0051935) |
| 3.1 | 18.5 | GO:1900034 | regulation of cellular response to heat(GO:1900034) |
| 3.1 | 21.5 | GO:1904706 | negative regulation of vascular smooth muscle cell proliferation(GO:1904706) |
| 3.1 | 24.4 | GO:0003433 | chondrocyte development involved in endochondral bone morphogenesis(GO:0003433) |
| 3.0 | 12.0 | GO:0009449 | gamma-aminobutyric acid biosynthetic process(GO:0009449) |
| 3.0 | 8.9 | GO:0071691 | cardiac muscle thin filament assembly(GO:0071691) |
| 3.0 | 41.6 | GO:1904322 | response to forskolin(GO:1904321) cellular response to forskolin(GO:1904322) |
| 3.0 | 8.9 | GO:2000820 | negative regulation of transcription from RNA polymerase II promoter involved in smooth muscle cell differentiation(GO:2000820) |
| 2.9 | 14.7 | GO:0038007 | netrin-activated signaling pathway(GO:0038007) |
| 2.9 | 17.5 | GO:0032914 | positive regulation of transforming growth factor beta1 production(GO:0032914) |
| 2.9 | 8.6 | GO:2000313 | fibroblast growth factor receptor signaling pathway involved in neural plate anterior/posterior pattern formation(GO:0060825) regulation of fibroblast growth factor receptor signaling pathway involved in neural plate anterior/posterior pattern formation(GO:2000313) |
| 2.8 | 14.2 | GO:0060327 | cytoplasmic actin-based contraction involved in cell motility(GO:0060327) |
| 2.8 | 25.3 | GO:0070459 | prolactin secretion(GO:0070459) |
| 2.8 | 35.8 | GO:0001886 | endothelial cell morphogenesis(GO:0001886) |
| 2.8 | 8.3 | GO:0006532 | fumarate metabolic process(GO:0006106) aspartate biosynthetic process(GO:0006532) aspartate catabolic process(GO:0006533) |
| 2.7 | 10.9 | GO:0019064 | fusion of virus membrane with host plasma membrane(GO:0019064) membrane fusion involved in viral entry into host cell(GO:0039663) multi-organism membrane fusion(GO:0044800) |
| 2.7 | 2.7 | GO:0071298 | cellular response to L-ascorbic acid(GO:0071298) |
| 2.7 | 5.4 | GO:0010710 | regulation of collagen catabolic process(GO:0010710) negative regulation of extracellular matrix disassembly(GO:0010716) |
| 2.7 | 10.7 | GO:0072092 | ureteric bud invasion(GO:0072092) |
| 2.7 | 10.7 | GO:0071288 | cellular response to mercury ion(GO:0071288) |
| 2.6 | 10.5 | GO:0035989 | tendon development(GO:0035989) |
| 2.6 | 10.2 | GO:0032962 | positive regulation of inositol trisphosphate biosynthetic process(GO:0032962) response to prostaglandin F(GO:0034696) |
| 2.5 | 17.7 | GO:0021814 | cell motility involved in cerebral cortex radial glia guided migration(GO:0021814) |
| 2.5 | 12.4 | GO:0098735 | positive regulation of the force of heart contraction(GO:0098735) |
| 2.4 | 4.9 | GO:0099543 | retrograde trans-synaptic signaling by soluble gas(GO:0098923) trans-synaptic signaling by soluble gas(GO:0099543) |
| 2.4 | 19.3 | GO:0015871 | choline transport(GO:0015871) |
| 2.4 | 9.5 | GO:0010730 | negative regulation of hydrogen peroxide biosynthetic process(GO:0010730) |
| 2.4 | 7.1 | GO:0032430 | positive regulation of phospholipase A2 activity(GO:0032430) |
| 2.3 | 4.7 | GO:0001757 | somite specification(GO:0001757) |
| 2.3 | 9.0 | GO:2001013 | positive regulation of macrophage apoptotic process(GO:2000111) epithelial cell proliferation involved in renal tubule morphogenesis(GO:2001013) |
| 2.2 | 11.2 | GO:0031117 | positive regulation of microtubule depolymerization(GO:0031117) |
| 2.2 | 4.5 | GO:0001951 | intestinal D-glucose absorption(GO:0001951) |
| 2.2 | 26.6 | GO:0032836 | glomerular basement membrane development(GO:0032836) |
| 2.2 | 13.2 | GO:0042483 | negative regulation of odontogenesis(GO:0042483) |
| 2.2 | 6.6 | GO:0032218 | riboflavin transport(GO:0032218) |
| 2.1 | 10.4 | GO:0014878 | response to electrical stimulus involved in regulation of muscle adaptation(GO:0014878) |
| 2.1 | 10.3 | GO:0031630 | regulation of synaptic vesicle fusion to presynaptic membrane(GO:0031630) |
| 2.1 | 12.4 | GO:0048386 | positive regulation of retinoic acid receptor signaling pathway(GO:0048386) |
| 2.1 | 26.9 | GO:0061299 | retina vasculature morphogenesis in camera-type eye(GO:0061299) |
| 2.1 | 18.5 | GO:0086103 | G-protein coupled receptor signaling pathway involved in heart process(GO:0086103) |
| 2.0 | 4.1 | GO:1904849 | positive regulation of cell chemotaxis to fibroblast growth factor(GO:1904849) positive regulation of endothelial cell chemotaxis to fibroblast growth factor(GO:2000546) |
| 2.0 | 5.9 | GO:0008355 | olfactory learning(GO:0008355) olefin metabolic process(GO:1900673) |
| 2.0 | 3.9 | GO:1905066 | regulation of canonical Wnt signaling pathway involved in cardiac muscle cell fate commitment(GO:1901295) regulation of canonical Wnt signaling pathway involved in heart development(GO:1905066) |
| 1.9 | 17.4 | GO:0019896 | axonal transport of mitochondrion(GO:0019896) |
| 1.9 | 11.6 | GO:0048669 | collateral sprouting in absence of injury(GO:0048669) |
| 1.9 | 11.3 | GO:0060721 | regulation of spongiotrophoblast cell proliferation(GO:0060721) regulation of cell proliferation involved in embryonic placenta development(GO:0060723) |
| 1.8 | 8.8 | GO:0045919 | positive regulation of cytolysis(GO:0045919) |
| 1.7 | 6.9 | GO:2001295 | malonyl-CoA biosynthetic process(GO:2001295) |
| 1.7 | 11.8 | GO:0021869 | forebrain ventricular zone progenitor cell division(GO:0021869) |
| 1.7 | 8.4 | GO:0033026 | negative regulation of mast cell apoptotic process(GO:0033026) mast cell proliferation(GO:0070662) regulation of mast cell proliferation(GO:0070666) positive regulation of mast cell proliferation(GO:0070668) |
| 1.7 | 6.7 | GO:0030167 | proteoglycan catabolic process(GO:0030167) |
| 1.7 | 5.0 | GO:0070093 | negative regulation of glucagon secretion(GO:0070093) |
| 1.7 | 29.9 | GO:0051895 | negative regulation of focal adhesion assembly(GO:0051895) |
| 1.7 | 18.2 | GO:0071578 | zinc II ion transmembrane import(GO:0071578) |
| 1.6 | 16.1 | GO:0032808 | lacrimal gland development(GO:0032808) |
| 1.6 | 17.7 | GO:0007097 | nuclear migration(GO:0007097) |
| 1.6 | 7.9 | GO:0051660 | establishment of centrosome localization(GO:0051660) |
| 1.6 | 7.8 | GO:0042780 | tRNA 3'-end processing(GO:0042780) |
| 1.5 | 18.4 | GO:0033139 | regulation of peptidyl-serine phosphorylation of STAT protein(GO:0033139) positive regulation of peptidyl-serine phosphorylation of STAT protein(GO:0033141) |
| 1.5 | 18.0 | GO:0042135 | neurotransmitter catabolic process(GO:0042135) |
| 1.5 | 5.8 | GO:0007172 | signal complex assembly(GO:0007172) |
| 1.4 | 4.3 | GO:0010796 | regulation of multivesicular body size(GO:0010796) |
| 1.4 | 7.1 | GO:0090394 | negative regulation of excitatory postsynaptic potential(GO:0090394) |
| 1.4 | 7.1 | GO:0010727 | negative regulation of hydrogen peroxide metabolic process(GO:0010727) |
| 1.4 | 13.9 | GO:0070314 | G1 to G0 transition(GO:0070314) |
| 1.4 | 23.3 | GO:0001953 | negative regulation of cell-matrix adhesion(GO:0001953) |
| 1.4 | 2.7 | GO:1903243 | negative regulation of cardiac muscle hypertrophy in response to stress(GO:1903243) |
| 1.3 | 14.8 | GO:0046520 | sphingoid biosynthetic process(GO:0046520) |
| 1.3 | 18.6 | GO:0043653 | mitochondrial fragmentation involved in apoptotic process(GO:0043653) |
| 1.3 | 5.1 | GO:0021564 | vagus nerve development(GO:0021564) |
| 1.3 | 8.9 | GO:0045631 | regulation of auditory receptor cell differentiation(GO:0045607) regulation of mechanoreceptor differentiation(GO:0045631) regulation of inner ear receptor cell differentiation(GO:2000980) |
| 1.3 | 2.5 | GO:0072076 | nephrogenic mesenchyme development(GO:0072076) |
| 1.3 | 5.0 | GO:0003406 | retinal pigment epithelium development(GO:0003406) |
| 1.2 | 7.5 | GO:0072675 | osteoclast fusion(GO:0072675) |
| 1.2 | 1.2 | GO:2000297 | negative regulation of synapse maturation(GO:2000297) |
| 1.2 | 4.9 | GO:0001712 | ectodermal cell fate commitment(GO:0001712) |
| 1.2 | 8.4 | GO:0006002 | fructose 6-phosphate metabolic process(GO:0006002) |
| 1.2 | 21.6 | GO:0090190 | positive regulation of branching involved in ureteric bud morphogenesis(GO:0090190) |
| 1.2 | 3.6 | GO:0030091 | protein repair(GO:0030091) |
| 1.2 | 3.5 | GO:0097051 | establishment of protein localization to endoplasmic reticulum membrane(GO:0097051) positive regulation of endoplasmic reticulum tubular network organization(GO:1903373) |
| 1.2 | 18.7 | GO:0089711 | L-glutamate transmembrane transport(GO:0089711) |
| 1.1 | 12.6 | GO:0017121 | phospholipid scrambling(GO:0017121) |
| 1.1 | 16.0 | GO:0021819 | layer formation in cerebral cortex(GO:0021819) |
| 1.1 | 10.1 | GO:2000381 | negative regulation of mesoderm development(GO:2000381) |
| 1.1 | 14.4 | GO:0007342 | fusion of sperm to egg plasma membrane(GO:0007342) |
| 1.1 | 14.3 | GO:0042118 | endothelial cell activation(GO:0042118) |
| 1.1 | 5.4 | GO:0034316 | negative regulation of Arp2/3 complex-mediated actin nucleation(GO:0034316) |
| 1.1 | 4.3 | GO:1900377 | negative regulation of melanin biosynthetic process(GO:0048022) negative regulation of secondary metabolite biosynthetic process(GO:1900377) |
| 1.1 | 4.3 | GO:0060591 | chondroblast differentiation(GO:0060591) |
| 1.1 | 12.8 | GO:0046485 | ether lipid metabolic process(GO:0046485) |
| 1.0 | 10.2 | GO:0031114 | regulation of microtubule depolymerization(GO:0031114) |
| 1.0 | 2.0 | GO:0043932 | ossification involved in bone remodeling(GO:0043932) |
| 1.0 | 6.1 | GO:0035021 | negative regulation of Rac protein signal transduction(GO:0035021) |
| 1.0 | 3.0 | GO:0061443 | endocardial cushion cell differentiation(GO:0061443) |
| 1.0 | 2.0 | GO:0002904 | positive regulation of B cell apoptotic process(GO:0002904) |
| 1.0 | 7.8 | GO:0070345 | negative regulation of fat cell proliferation(GO:0070345) |
| 1.0 | 15.6 | GO:0007216 | G-protein coupled glutamate receptor signaling pathway(GO:0007216) |
| 1.0 | 2.9 | GO:0010609 | mRNA localization resulting in posttranscriptional regulation of gene expression(GO:0010609) |
| 1.0 | 10.6 | GO:0051583 | dopamine uptake involved in synaptic transmission(GO:0051583) catecholamine uptake involved in synaptic transmission(GO:0051934) |
| 0.9 | 7.4 | GO:0030049 | muscle filament sliding(GO:0030049) |
| 0.9 | 0.9 | GO:2000502 | negative regulation of natural killer cell chemotaxis(GO:2000502) |
| 0.9 | 1.8 | GO:0097213 | regulation of lysosomal membrane permeability(GO:0097213) positive regulation of lysosomal membrane permeability(GO:0097214) |
| 0.9 | 7.2 | GO:0046710 | GDP metabolic process(GO:0046710) |
| 0.9 | 9.0 | GO:0048385 | regulation of retinoic acid receptor signaling pathway(GO:0048385) |
| 0.9 | 12.2 | GO:0032060 | bleb assembly(GO:0032060) |
| 0.9 | 18.2 | GO:0010669 | epithelial structure maintenance(GO:0010669) |
| 0.9 | 17.3 | GO:0045947 | negative regulation of translational initiation(GO:0045947) |
| 0.8 | 11.0 | GO:0006390 | transcription from mitochondrial promoter(GO:0006390) |
| 0.8 | 26.2 | GO:0034260 | negative regulation of GTPase activity(GO:0034260) |
| 0.8 | 9.8 | GO:0036159 | inner dynein arm assembly(GO:0036159) |
| 0.8 | 9.6 | GO:0003356 | regulation of cilium beat frequency(GO:0003356) |
| 0.8 | 8.7 | GO:0032331 | negative regulation of chondrocyte differentiation(GO:0032331) |
| 0.8 | 1.6 | GO:0018076 | N-terminal peptidyl-lysine acetylation(GO:0018076) |
| 0.8 | 20.2 | GO:0045663 | positive regulation of myoblast differentiation(GO:0045663) |
| 0.8 | 2.3 | GO:1902897 | regulation of postsynaptic density protein 95 clustering(GO:1902897) |
| 0.8 | 13.0 | GO:1902358 | sulfate transmembrane transport(GO:1902358) |
| 0.8 | 11.3 | GO:0035269 | protein O-linked mannosylation(GO:0035269) |
| 0.7 | 5.2 | GO:0070317 | negative regulation of G0 to G1 transition(GO:0070317) |
| 0.7 | 1.5 | GO:1901979 | regulation of inward rectifier potassium channel activity(GO:1901979) |
| 0.7 | 17.5 | GO:0010667 | negative regulation of cardiac muscle cell apoptotic process(GO:0010667) |
| 0.7 | 14.4 | GO:0010257 | NADH dehydrogenase complex assembly(GO:0010257) mitochondrial respiratory chain complex I assembly(GO:0032981) mitochondrial respiratory chain complex I biogenesis(GO:0097031) |
| 0.7 | 7.8 | GO:0051255 | spindle midzone assembly(GO:0051255) |
| 0.7 | 19.2 | GO:0031146 | SCF-dependent proteasomal ubiquitin-dependent protein catabolic process(GO:0031146) |
| 0.7 | 5.7 | GO:1900042 | positive regulation of interleukin-2 secretion(GO:1900042) |
| 0.7 | 2.1 | GO:0031161 | phosphatidylinositol catabolic process(GO:0031161) |
| 0.7 | 4.1 | GO:1901162 | serotonin biosynthetic process(GO:0042427) primary amino compound biosynthetic process(GO:1901162) |
| 0.7 | 19.0 | GO:0032728 | positive regulation of interferon-beta production(GO:0032728) |
| 0.7 | 12.2 | GO:0060992 | response to fungicide(GO:0060992) |
| 0.7 | 9.2 | GO:2000052 | positive regulation of non-canonical Wnt signaling pathway(GO:2000052) |
| 0.6 | 9.0 | GO:1903830 | magnesium ion transport(GO:0015693) magnesium ion transmembrane transport(GO:1903830) |
| 0.6 | 12.1 | GO:0048490 | anterograde synaptic vesicle transport(GO:0048490) synaptic vesicle cytoskeletal transport(GO:0099514) synaptic vesicle transport along microtubule(GO:0099517) |
| 0.6 | 11.4 | GO:0051642 | centrosome localization(GO:0051642) |
| 0.6 | 6.5 | GO:1900017 | positive regulation of cytokine production involved in inflammatory response(GO:1900017) |
| 0.6 | 3.5 | GO:0035865 | cellular response to potassium ion(GO:0035865) |
| 0.6 | 17.6 | GO:0090218 | positive regulation of lipid kinase activity(GO:0090218) |
| 0.6 | 5.8 | GO:0001778 | plasma membrane repair(GO:0001778) |
| 0.6 | 1.7 | GO:0032383 | regulation of intracellular lipid transport(GO:0032377) regulation of intracellular sterol transport(GO:0032380) regulation of intracellular cholesterol transport(GO:0032383) |
| 0.6 | 8.1 | GO:0045793 | positive regulation of cell size(GO:0045793) |
| 0.6 | 6.2 | GO:0045792 | negative regulation of cell size(GO:0045792) |
| 0.6 | 2.8 | GO:1904923 | regulation of mitophagy in response to mitochondrial depolarization(GO:1904923) |
| 0.6 | 4.4 | GO:0019695 | choline metabolic process(GO:0019695) |
| 0.5 | 2.2 | GO:0006428 | isoleucyl-tRNA aminoacylation(GO:0006428) |
| 0.5 | 2.2 | GO:0035720 | intraciliary anterograde transport(GO:0035720) |
| 0.5 | 4.8 | GO:0043569 | negative regulation of insulin-like growth factor receptor signaling pathway(GO:0043569) |
| 0.5 | 3.2 | GO:0030951 | establishment or maintenance of microtubule cytoskeleton polarity(GO:0030951) |
| 0.5 | 7.0 | GO:0046855 | inositol phosphate dephosphorylation(GO:0046855) |
| 0.5 | 7.0 | GO:0097577 | intracellular sequestering of iron ion(GO:0006880) sequestering of iron ion(GO:0097577) |
| 0.5 | 8.5 | GO:0043116 | negative regulation of vascular permeability(GO:0043116) |
| 0.5 | 16.5 | GO:0048662 | negative regulation of smooth muscle cell proliferation(GO:0048662) |
| 0.5 | 3.1 | GO:0016255 | attachment of GPI anchor to protein(GO:0016255) |
| 0.5 | 88.7 | GO:0060070 | canonical Wnt signaling pathway(GO:0060070) |
| 0.5 | 1.6 | GO:0051037 | regulation of transcription involved in meiotic cell cycle(GO:0051037) |
| 0.5 | 6.6 | GO:0009744 | response to sucrose(GO:0009744) response to disaccharide(GO:0034285) |
| 0.5 | 18.0 | GO:0048488 | synaptic vesicle endocytosis(GO:0048488) |
| 0.5 | 1.5 | GO:0035522 | monoubiquitinated histone deubiquitination(GO:0035521) monoubiquitinated histone H2A deubiquitination(GO:0035522) |
| 0.5 | 11.2 | GO:0045475 | locomotor rhythm(GO:0045475) |
| 0.5 | 2.4 | GO:1904751 | positive regulation of protein localization to nucleolus(GO:1904751) |
| 0.5 | 1.9 | GO:0003199 | endocardial cushion to mesenchymal transition involved in heart valve formation(GO:0003199) |
| 0.5 | 38.2 | GO:0001578 | microtubule bundle formation(GO:0001578) |
| 0.5 | 1.4 | GO:0060708 | spongiotrophoblast differentiation(GO:0060708) |
| 0.5 | 17.7 | GO:0045494 | photoreceptor cell maintenance(GO:0045494) |
| 0.4 | 4.0 | GO:0007000 | nucleolus organization(GO:0007000) |
| 0.4 | 3.1 | GO:0010193 | response to ozone(GO:0010193) |
| 0.4 | 3.6 | GO:0038161 | prolactin signaling pathway(GO:0038161) |
| 0.4 | 1.3 | GO:1990166 | protein localization to site of double-strand break(GO:1990166) |
| 0.4 | 18.8 | GO:0050873 | brown fat cell differentiation(GO:0050873) |
| 0.4 | 1.7 | GO:1902630 | regulation of membrane hyperpolarization(GO:1902630) |
| 0.4 | 6.1 | GO:0014877 | response to muscle inactivity involved in regulation of muscle adaptation(GO:0014877) response to denervation involved in regulation of muscle adaptation(GO:0014894) |
| 0.4 | 3.4 | GO:0031665 | negative regulation of lipopolysaccharide-mediated signaling pathway(GO:0031665) |
| 0.4 | 0.8 | GO:0032915 | positive regulation of transforming growth factor beta2 production(GO:0032915) |
| 0.4 | 18.2 | GO:0034605 | cellular response to heat(GO:0034605) |
| 0.4 | 7.0 | GO:0070208 | protein heterotrimerization(GO:0070208) |
| 0.4 | 18.2 | GO:1904893 | negative regulation of JAK-STAT cascade(GO:0046426) negative regulation of STAT cascade(GO:1904893) |
| 0.4 | 14.4 | GO:0045773 | positive regulation of axon extension(GO:0045773) |
| 0.4 | 1.2 | GO:0016476 | regulation of embryonic cell shape(GO:0016476) |
| 0.4 | 5.0 | GO:1900122 | positive regulation of receptor binding(GO:1900122) |
| 0.4 | 1.1 | GO:0034499 | late endosome to Golgi transport(GO:0034499) |
| 0.4 | 2.2 | GO:0042904 | 9-cis-retinoic acid biosynthetic process(GO:0042904) 9-cis-retinoic acid metabolic process(GO:0042905) |
| 0.4 | 10.5 | GO:0006099 | tricarboxylic acid cycle(GO:0006099) |
| 0.4 | 9.2 | GO:0045599 | negative regulation of fat cell differentiation(GO:0045599) |
| 0.4 | 6.2 | GO:0006027 | glycosaminoglycan catabolic process(GO:0006027) |
| 0.4 | 22.5 | GO:0048704 | embryonic skeletal system morphogenesis(GO:0048704) |
| 0.4 | 9.8 | GO:0060976 | coronary vasculature development(GO:0060976) |
| 0.4 | 8.6 | GO:0035025 | positive regulation of Rho protein signal transduction(GO:0035025) |
| 0.4 | 3.2 | GO:0045836 | positive regulation of meiotic nuclear division(GO:0045836) |
| 0.3 | 5.5 | GO:0031954 | positive regulation of protein autophosphorylation(GO:0031954) |
| 0.3 | 1.3 | GO:1904823 | purine nucleobase transmembrane transport(GO:1904823) |
| 0.3 | 65.7 | GO:0001822 | kidney development(GO:0001822) |
| 0.3 | 2.3 | GO:2000676 | positive regulation of type B pancreatic cell apoptotic process(GO:2000676) |
| 0.3 | 9.0 | GO:0001580 | detection of chemical stimulus involved in sensory perception of bitter taste(GO:0001580) |
| 0.3 | 1.9 | GO:0030321 | transepithelial chloride transport(GO:0030321) |
| 0.3 | 1.6 | GO:0070940 | dephosphorylation of RNA polymerase II C-terminal domain(GO:0070940) |
| 0.3 | 1.6 | GO:0050651 | dermatan sulfate proteoglycan biosynthetic process(GO:0050651) |
| 0.3 | 16.8 | GO:0080171 | lysosome organization(GO:0007040) lytic vacuole organization(GO:0080171) |
| 0.3 | 2.1 | GO:0000711 | meiotic DNA repair synthesis(GO:0000711) |
| 0.3 | 10.3 | GO:0034219 | carbohydrate transmembrane transport(GO:0034219) |
| 0.3 | 28.1 | GO:0035023 | regulation of Rho protein signal transduction(GO:0035023) |
| 0.3 | 1.4 | GO:0060005 | vestibular reflex(GO:0060005) |
| 0.3 | 5.9 | GO:0007520 | myoblast fusion(GO:0007520) |
| 0.3 | 1.6 | GO:0006621 | protein retention in ER lumen(GO:0006621) |
| 0.3 | 2.6 | GO:0000338 | protein deneddylation(GO:0000338) |
| 0.3 | 2.8 | GO:1902018 | negative regulation of cilium assembly(GO:1902018) |
| 0.2 | 2.0 | GO:2000653 | regulation of genetic imprinting(GO:2000653) |
| 0.2 | 10.6 | GO:0032024 | positive regulation of insulin secretion(GO:0032024) |
| 0.2 | 0.7 | GO:0006431 | methionyl-tRNA aminoacylation(GO:0006431) |
| 0.2 | 4.1 | GO:0042026 | protein refolding(GO:0042026) |
| 0.2 | 1.4 | GO:0070970 | interleukin-2 secretion(GO:0070970) |
| 0.2 | 1.9 | GO:0006072 | glycerol-3-phosphate metabolic process(GO:0006072) |
| 0.2 | 5.4 | GO:0032012 | ARF protein signal transduction(GO:0032011) regulation of ARF protein signal transduction(GO:0032012) |
| 0.2 | 2.6 | GO:0015825 | L-serine transport(GO:0015825) |
| 0.2 | 5.3 | GO:0032873 | negative regulation of stress-activated MAPK cascade(GO:0032873) negative regulation of stress-activated protein kinase signaling cascade(GO:0070303) |
| 0.2 | 4.8 | GO:0045292 | mRNA cis splicing, via spliceosome(GO:0045292) |
| 0.2 | 5.1 | GO:0030178 | negative regulation of Wnt signaling pathway(GO:0030178) |
| 0.2 | 13.6 | GO:0006096 | glycolytic process(GO:0006096) |
| 0.2 | 5.0 | GO:0001522 | pseudouridine synthesis(GO:0001522) |
| 0.2 | 9.6 | GO:0031016 | pancreas development(GO:0031016) |
| 0.2 | 11.5 | GO:0007368 | determination of left/right symmetry(GO:0007368) |
| 0.2 | 4.7 | GO:0061178 | regulation of insulin secretion involved in cellular response to glucose stimulus(GO:0061178) |
| 0.2 | 29.5 | GO:0006941 | striated muscle contraction(GO:0006941) |
| 0.2 | 1.4 | GO:1900364 | negative regulation of mRNA polyadenylation(GO:1900364) |
| 0.2 | 15.3 | GO:0010977 | negative regulation of neuron projection development(GO:0010977) |
| 0.2 | 1.1 | GO:0035338 | long-chain fatty-acyl-CoA biosynthetic process(GO:0035338) |
| 0.2 | 1.6 | GO:0035457 | cellular response to interferon-alpha(GO:0035457) |
| 0.2 | 11.6 | GO:1901800 | positive regulation of proteasomal protein catabolic process(GO:1901800) |
| 0.2 | 16.3 | GO:0006665 | sphingolipid metabolic process(GO:0006665) |
| 0.2 | 3.0 | GO:0090161 | Golgi ribbon formation(GO:0090161) |
| 0.2 | 1.2 | GO:0098780 | response to mitochondrial depolarisation(GO:0098780) |
| 0.2 | 12.0 | GO:0016575 | histone deacetylation(GO:0016575) |
| 0.2 | 12.9 | GO:0098869 | cellular oxidant detoxification(GO:0098869) |
| 0.1 | 1.4 | GO:0010839 | negative regulation of keratinocyte proliferation(GO:0010839) |
| 0.1 | 4.0 | GO:1900047 | negative regulation of blood coagulation(GO:0030195) negative regulation of hemostasis(GO:1900047) |
| 0.1 | 1.0 | GO:0042760 | very long-chain fatty acid catabolic process(GO:0042760) |
| 0.1 | 3.1 | GO:0051491 | positive regulation of filopodium assembly(GO:0051491) |
| 0.1 | 2.0 | GO:0048240 | sperm capacitation(GO:0048240) |
| 0.1 | 1.4 | GO:0006614 | SRP-dependent cotranslational protein targeting to membrane(GO:0006614) |
| 0.1 | 0.6 | GO:0051014 | actin filament severing(GO:0051014) |
| 0.1 | 1.7 | GO:0090005 | negative regulation of establishment of protein localization to plasma membrane(GO:0090005) |
| 0.1 | 1.7 | GO:0036297 | interstrand cross-link repair(GO:0036297) |
| 0.1 | 3.3 | GO:0007271 | synaptic transmission, cholinergic(GO:0007271) |
| 0.1 | 0.4 | GO:0006021 | inositol biosynthetic process(GO:0006021) |
| 0.1 | 3.4 | GO:0021762 | substantia nigra development(GO:0021762) |
| 0.1 | 9.6 | GO:0035725 | sodium ion transmembrane transport(GO:0035725) |
| 0.1 | 2.8 | GO:0015991 | ATP hydrolysis coupled proton transport(GO:0015991) |
| 0.1 | 0.6 | GO:0031145 | anaphase-promoting complex-dependent catabolic process(GO:0031145) |
| 0.1 | 1.2 | GO:0031573 | intra-S DNA damage checkpoint(GO:0031573) |
| 0.1 | 0.4 | GO:2000310 | regulation of N-methyl-D-aspartate selective glutamate receptor activity(GO:2000310) |
| 0.1 | 5.9 | GO:0010811 | positive regulation of cell-substrate adhesion(GO:0010811) |
| 0.1 | 1.2 | GO:0046339 | diacylglycerol metabolic process(GO:0046339) |
| 0.1 | 1.4 | GO:0045116 | protein neddylation(GO:0045116) |
| 0.1 | 0.3 | GO:0044313 | protein K6-linked deubiquitination(GO:0044313) |
| 0.1 | 2.4 | GO:0030433 | ER-associated ubiquitin-dependent protein catabolic process(GO:0030433) |
| 0.1 | 1.2 | GO:0006415 | translational termination(GO:0006415) |
| 0.1 | 3.8 | GO:0007224 | smoothened signaling pathway(GO:0007224) |
| 0.1 | 5.5 | GO:0016579 | protein deubiquitination(GO:0016579) |
| 0.1 | 2.5 | GO:0055123 | digestive system development(GO:0055123) |
| 0.0 | 2.0 | GO:0071391 | cellular response to estrogen stimulus(GO:0071391) |
| 0.0 | 0.9 | GO:0006450 | regulation of translational fidelity(GO:0006450) |
| 0.0 | 1.9 | GO:0060047 | heart contraction(GO:0060047) |
| 0.0 | 0.6 | GO:0048806 | genitalia development(GO:0048806) |
| 0.0 | 1.1 | GO:0046854 | phosphatidylinositol phosphorylation(GO:0046854) |
| 0.0 | 2.5 | GO:0007218 | neuropeptide signaling pathway(GO:0007218) |
| 0.0 | 1.6 | GO:0007052 | mitotic spindle organization(GO:0007052) |
| 0.0 | 0.1 | GO:0006117 | acetaldehyde metabolic process(GO:0006117) |
| 0.0 | 38.4 | GO:0007606 | sensory perception of chemical stimulus(GO:0007606) |
| 0.0 | 0.2 | GO:0090070 | positive regulation of ribosome biogenesis(GO:0090070) positive regulation of rRNA processing(GO:2000234) |
| 0.0 | 0.2 | GO:0032967 | positive regulation of collagen biosynthetic process(GO:0032967) |
| 0.0 | 0.5 | GO:0070527 | platelet aggregation(GO:0070527) |
| 0.0 | 0.9 | GO:0031338 | regulation of vesicle fusion(GO:0031338) |
| 0.0 | 2.5 | GO:0006486 | protein glycosylation(GO:0006486) macromolecule glycosylation(GO:0043413) |
Gene overrepresentation in cellular component category:
| Log-likelihood per target | Total log-likelihood | Term | Description |
|---|---|---|---|
| 12.4 | 87.0 | GO:0071438 | invadopodium membrane(GO:0071438) |
| 10.7 | 64.0 | GO:0016012 | sarcoglycan complex(GO:0016012) |
| 9.5 | 28.5 | GO:0005853 | eukaryotic translation elongation factor 1 complex(GO:0005853) |
| 9.2 | 27.7 | GO:0005945 | 6-phosphofructokinase complex(GO:0005945) |
| 8.7 | 34.7 | GO:0005588 | collagen type V trimer(GO:0005588) |
| 6.8 | 34.0 | GO:0071953 | elastic fiber(GO:0071953) |
| 5.7 | 28.3 | GO:0005927 | muscle tendon junction(GO:0005927) |
| 5.0 | 15.1 | GO:1990032 | parallel fiber(GO:1990032) |
| 4.8 | 57.4 | GO:1990454 | L-type voltage-gated calcium channel complex(GO:1990454) |
| 4.6 | 18.5 | GO:0045298 | tubulin complex(GO:0045298) |
| 4.6 | 13.8 | GO:0097444 | spine apparatus(GO:0097444) |
| 4.5 | 53.5 | GO:0098839 | postsynaptic density membrane(GO:0098839) |
| 3.9 | 23.3 | GO:0030478 | actin cap(GO:0030478) |
| 3.9 | 19.3 | GO:1990769 | proximal neuron projection(GO:1990769) |
| 3.7 | 44.3 | GO:0043083 | synaptic cleft(GO:0043083) |
| 3.5 | 14.2 | GO:0008282 | ATP-sensitive potassium channel complex(GO:0008282) |
| 3.5 | 10.5 | GO:0005592 | collagen type XI trimer(GO:0005592) |
| 3.5 | 17.5 | GO:0005583 | fibrillar collagen trimer(GO:0005583) banded collagen fibril(GO:0098643) |
| 3.3 | 26.6 | GO:0098645 | collagen type IV trimer(GO:0005587) network-forming collagen trimer(GO:0098642) collagen network(GO:0098645) |
| 3.1 | 15.3 | GO:1990452 | Parkin-FBXW7-Cul1 ubiquitin ligase complex(GO:1990452) |
| 2.9 | 43.6 | GO:0072687 | meiotic spindle(GO:0072687) |
| 2.9 | 20.3 | GO:0005862 | muscle thin filament tropomyosin(GO:0005862) |
| 2.8 | 14.1 | GO:0070032 | synaptobrevin 2-SNAP-25-syntaxin-1a-complexin I complex(GO:0070032) |
| 2.3 | 9.3 | GO:0097487 | multivesicular body, internal vesicle(GO:0097487) |
| 2.0 | 7.9 | GO:0005593 | FACIT collagen trimer(GO:0005593) |
| 1.9 | 69.8 | GO:0046930 | pore complex(GO:0046930) |
| 1.9 | 22.8 | GO:0016010 | dystrophin-associated glycoprotein complex(GO:0016010) glycoprotein complex(GO:0090665) |
| 1.9 | 14.8 | GO:0031211 | serine C-palmitoyltransferase complex(GO:0017059) endoplasmic reticulum palmitoyltransferase complex(GO:0031211) |
| 1.8 | 8.8 | GO:1990130 | Iml1 complex(GO:1990130) |
| 1.8 | 12.3 | GO:1990357 | terminal web(GO:1990357) |
| 1.7 | 13.9 | GO:0044305 | calyx of Held(GO:0044305) |
| 1.7 | 17.2 | GO:0005641 | nuclear envelope lumen(GO:0005641) |
| 1.7 | 10.3 | GO:0032983 | kainate selective glutamate receptor complex(GO:0032983) |
| 1.7 | 17.2 | GO:0097227 | septin complex(GO:0031105) sperm annulus(GO:0097227) |
| 1.7 | 5.0 | GO:0031095 | platelet dense tubular network membrane(GO:0031095) |
| 1.6 | 45.5 | GO:0032839 | dendrite cytoplasm(GO:0032839) |
| 1.6 | 3.1 | GO:0034774 | secretory granule lumen(GO:0034774) |
| 1.5 | 10.5 | GO:0001739 | sex chromatin(GO:0001739) |
| 1.5 | 6.0 | GO:0036156 | inner dynein arm(GO:0036156) |
| 1.3 | 35.7 | GO:0000159 | protein phosphatase type 2A complex(GO:0000159) |
| 1.3 | 39.5 | GO:0030673 | axolemma(GO:0030673) |
| 1.2 | 31.0 | GO:0008074 | guanylate cyclase complex, soluble(GO:0008074) |
| 1.2 | 12.4 | GO:0097550 | transcriptional preinitiation complex(GO:0097550) |
| 1.2 | 16.2 | GO:0043202 | lysosomal lumen(GO:0043202) |
| 1.1 | 23.7 | GO:0070822 | Sin3-type complex(GO:0070822) |
| 1.1 | 10.6 | GO:0034464 | BBSome(GO:0034464) |
| 1.0 | 16.3 | GO:0071004 | U2-type prespliceosome(GO:0071004) |
| 1.0 | 6.1 | GO:1990393 | Cul7-RING ubiquitin ligase complex(GO:0031467) 3M complex(GO:1990393) |
| 1.0 | 3.9 | GO:0002193 | MAML1-RBP-Jkappa- ICN1 complex(GO:0002193) |
| 1.0 | 15.6 | GO:0032045 | guanyl-nucleotide exchange factor complex(GO:0032045) |
| 1.0 | 5.8 | GO:0005826 | actomyosin contractile ring(GO:0005826) |
| 1.0 | 6.7 | GO:0030981 | cortical microtubule cytoskeleton(GO:0030981) |
| 1.0 | 5.7 | GO:0032437 | cuticular plate(GO:0032437) |
| 0.9 | 0.9 | GO:0044299 | C-fiber(GO:0044299) |
| 0.9 | 7.1 | GO:0032584 | growth cone membrane(GO:0032584) |
| 0.9 | 8.0 | GO:0030314 | junctional membrane complex(GO:0030314) |
| 0.9 | 8.6 | GO:0045180 | basal cortex(GO:0045180) |
| 0.9 | 18.8 | GO:0005605 | basal lamina(GO:0005605) |
| 0.8 | 16.9 | GO:0005614 | interstitial matrix(GO:0005614) |
| 0.8 | 19.0 | GO:0043034 | costamere(GO:0043034) |
| 0.8 | 6.2 | GO:0031931 | TORC1 complex(GO:0031931) |
| 0.8 | 21.7 | GO:0032588 | trans-Golgi network membrane(GO:0032588) |
| 0.8 | 6.2 | GO:0005890 | sodium:potassium-exchanging ATPase complex(GO:0005890) |
| 0.7 | 31.4 | GO:0030315 | T-tubule(GO:0030315) |
| 0.7 | 2.1 | GO:0000802 | transverse filament(GO:0000802) |
| 0.7 | 2.7 | GO:0070022 | transforming growth factor beta receptor homodimeric complex(GO:0070022) |
| 0.7 | 7.4 | GO:0032982 | myosin filament(GO:0032982) |
| 0.7 | 33.2 | GO:0005581 | collagen trimer(GO:0005581) |
| 0.7 | 28.2 | GO:1904115 | axon cytoplasm(GO:1904115) |
| 0.7 | 23.4 | GO:0016459 | myosin complex(GO:0016459) |
| 0.6 | 10.9 | GO:0031362 | anchored component of external side of plasma membrane(GO:0031362) |
| 0.6 | 16.4 | GO:0005868 | cytoplasmic dynein complex(GO:0005868) |
| 0.6 | 36.9 | GO:0042641 | actomyosin(GO:0042641) |
| 0.6 | 7.9 | GO:0097539 | ciliary transition fiber(GO:0097539) |
| 0.6 | 3.5 | GO:0035189 | Rb-E2F complex(GO:0035189) |
| 0.6 | 1.7 | GO:0098855 | HCN channel complex(GO:0098855) |
| 0.6 | 33.0 | GO:0005881 | cytoplasmic microtubule(GO:0005881) |
| 0.6 | 13.7 | GO:0060077 | inhibitory synapse(GO:0060077) |
| 0.6 | 3.4 | GO:0005869 | dynactin complex(GO:0005869) |
| 0.6 | 41.1 | GO:0014704 | intercalated disc(GO:0014704) |
| 0.5 | 8.0 | GO:0032433 | filopodium tip(GO:0032433) |
| 0.5 | 3.1 | GO:0042765 | GPI-anchor transamidase complex(GO:0042765) |
| 0.5 | 8.4 | GO:0030175 | filopodium(GO:0030175) |
| 0.5 | 16.0 | GO:0005790 | smooth endoplasmic reticulum(GO:0005790) |
| 0.5 | 9.4 | GO:0031430 | M band(GO:0031430) |
| 0.5 | 10.3 | GO:0032391 | photoreceptor connecting cilium(GO:0032391) |
| 0.5 | 7.2 | GO:0005883 | neurofilament(GO:0005883) |
| 0.5 | 10.5 | GO:0030286 | dynein complex(GO:0030286) |
| 0.5 | 1.9 | GO:0030877 | beta-catenin destruction complex(GO:0030877) |
| 0.5 | 0.9 | GO:0010009 | cytoplasmic side of endosome membrane(GO:0010009) |
| 0.5 | 5.5 | GO:0005861 | troponin complex(GO:0005861) |
| 0.4 | 121.8 | GO:0005578 | proteinaceous extracellular matrix(GO:0005578) |
| 0.4 | 1.7 | GO:0031232 | extrinsic component of external side of plasma membrane(GO:0031232) |
| 0.4 | 6.4 | GO:0044291 | cell-cell contact zone(GO:0044291) |
| 0.4 | 13.6 | GO:0008180 | COP9 signalosome(GO:0008180) |
| 0.4 | 5.3 | GO:0017101 | aminoacyl-tRNA synthetase multienzyme complex(GO:0017101) |
| 0.4 | 23.7 | GO:0001750 | photoreceptor outer segment(GO:0001750) |
| 0.4 | 18.4 | GO:0016235 | aggresome(GO:0016235) |
| 0.4 | 441.4 | GO:0005887 | integral component of plasma membrane(GO:0005887) |
| 0.4 | 57.0 | GO:0005741 | mitochondrial outer membrane(GO:0005741) |
| 0.4 | 9.6 | GO:0097546 | ciliary base(GO:0097546) |
| 0.4 | 76.0 | GO:0030427 | site of polarized growth(GO:0030427) |
| 0.4 | 25.1 | GO:0005788 | endoplasmic reticulum lumen(GO:0005788) |
| 0.4 | 23.8 | GO:0019005 | SCF ubiquitin ligase complex(GO:0019005) |
| 0.4 | 16.5 | GO:0031901 | early endosome membrane(GO:0031901) |
| 0.3 | 2.0 | GO:0036128 | CatSper complex(GO:0036128) |
| 0.3 | 23.0 | GO:0043197 | dendritic spine(GO:0043197) |
| 0.3 | 54.4 | GO:0031012 | extracellular matrix(GO:0031012) |
| 0.3 | 32.4 | GO:0045211 | postsynaptic membrane(GO:0045211) |
| 0.3 | 1.2 | GO:0031417 | NatC complex(GO:0031417) |
| 0.3 | 3.2 | GO:0000930 | gamma-tubulin complex(GO:0000930) |
| 0.3 | 5.5 | GO:0030014 | CCR4-NOT complex(GO:0030014) |
| 0.3 | 8.5 | GO:0071339 | MLL1/2 complex(GO:0044665) MLL1 complex(GO:0071339) |
| 0.3 | 14.4 | GO:0030964 | mitochondrial respiratory chain complex I(GO:0005747) NADH dehydrogenase complex(GO:0030964) respiratory chain complex I(GO:0045271) |
| 0.3 | 4.8 | GO:0030125 | clathrin vesicle coat(GO:0030125) |
| 0.3 | 17.5 | GO:0031463 | Cul3-RING ubiquitin ligase complex(GO:0031463) |
| 0.2 | 2.8 | GO:0033180 | proton-transporting V-type ATPase, V1 domain(GO:0033180) |
| 0.2 | 31.1 | GO:0043209 | myelin sheath(GO:0043209) |
| 0.2 | 17.5 | GO:0030017 | sarcomere(GO:0030017) |
| 0.2 | 1.4 | GO:0008024 | cyclin/CDK positive transcription elongation factor complex(GO:0008024) |
| 0.2 | 1.4 | GO:0072357 | PTW/PP1 phosphatase complex(GO:0072357) |
| 0.2 | 21.3 | GO:0043235 | receptor complex(GO:0043235) |
| 0.2 | 6.9 | GO:0098858 | actin-based cell projection(GO:0098858) |
| 0.2 | 1.4 | GO:0005786 | signal recognition particle, endoplasmic reticulum targeting(GO:0005786) |
| 0.2 | 12.2 | GO:0005923 | bicellular tight junction(GO:0005923) |
| 0.2 | 10.0 | GO:0032580 | Golgi cisterna membrane(GO:0032580) |
| 0.2 | 2.9 | GO:0031594 | neuromuscular junction(GO:0031594) |
| 0.1 | 1.3 | GO:0042405 | nuclear inclusion body(GO:0042405) |
| 0.1 | 33.3 | GO:0045177 | apical part of cell(GO:0045177) |
| 0.1 | 0.4 | GO:0036194 | muscle cell projection(GO:0036194) muscle cell projection membrane(GO:0036195) |
| 0.1 | 4.6 | GO:0005876 | spindle microtubule(GO:0005876) |
| 0.1 | 7.5 | GO:0005762 | organellar large ribosomal subunit(GO:0000315) mitochondrial large ribosomal subunit(GO:0005762) |
| 0.1 | 0.9 | GO:0042581 | primary lysosome(GO:0005766) specific granule(GO:0042581) azurophil granule(GO:0042582) |
| 0.1 | 18.0 | GO:0015629 | actin cytoskeleton(GO:0015629) |
| 0.1 | 2.1 | GO:0042383 | sarcolemma(GO:0042383) |
| 0.1 | 3.0 | GO:0005844 | polysome(GO:0005844) |
| 0.1 | 1.4 | GO:0005922 | connexon complex(GO:0005922) |
| 0.1 | 11.5 | GO:0001650 | fibrillar center(GO:0001650) |
| 0.1 | 17.3 | GO:0005925 | focal adhesion(GO:0005925) |
| 0.1 | 1.4 | GO:0005680 | anaphase-promoting complex(GO:0005680) |
| 0.1 | 0.3 | GO:0034991 | nuclear meiotic cohesin complex(GO:0034991) |
| 0.1 | 3.1 | GO:0005801 | cis-Golgi network(GO:0005801) |
| 0.0 | 1.7 | GO:0016323 | basolateral plasma membrane(GO:0016323) |
| 0.0 | 0.6 | GO:0043189 | NuA4 histone acetyltransferase complex(GO:0035267) H4/H2A histone acetyltransferase complex(GO:0043189) H4 histone acetyltransferase complex(GO:1902562) |
| 0.0 | 0.8 | GO:0005834 | heterotrimeric G-protein complex(GO:0005834) |
| 0.0 | 2.2 | GO:0030176 | integral component of endoplasmic reticulum membrane(GO:0030176) |
| 0.0 | 1.0 | GO:0016592 | mediator complex(GO:0016592) |
| 0.0 | 2.4 | GO:0031965 | nuclear membrane(GO:0031965) |
| 0.0 | 0.2 | GO:0030867 | rough endoplasmic reticulum membrane(GO:0030867) |
Gene overrepresentation in molecular function category:
| Log-likelihood per target | Total log-likelihood | Term | Description |
|---|---|---|---|
| 19.1 | 57.4 | GO:0086057 | voltage-gated calcium channel activity involved in bundle of His cell action potential(GO:0086057) |
| 15.5 | 46.6 | GO:0102344 | 3-hydroxy-behenoyl-CoA dehydratase activity(GO:0102344) 3-hydroxy-lignoceroyl-CoA dehydratase activity(GO:0102345) |
| 7.3 | 36.6 | GO:0004971 | AMPA glutamate receptor activity(GO:0004971) |
| 7.3 | 72.6 | GO:0008239 | dipeptidyl-peptidase activity(GO:0008239) |
| 6.9 | 27.7 | GO:0003872 | 6-phosphofructokinase activity(GO:0003872) |
| 6.4 | 19.1 | GO:0071885 | N-terminal protein N-methyltransferase activity(GO:0071885) |
| 6.2 | 30.8 | GO:0004090 | carbonyl reductase (NADPH) activity(GO:0004090) |
| 5.8 | 23.3 | GO:0045159 | myosin II binding(GO:0045159) |
| 5.3 | 26.5 | GO:0034714 | type III transforming growth factor beta receptor binding(GO:0034714) |
| 5.2 | 15.5 | GO:0003945 | N-acetyllactosamine synthase activity(GO:0003945) |
| 5.0 | 89.5 | GO:0005523 | tropomyosin binding(GO:0005523) |
| 4.8 | 14.3 | GO:0005017 | platelet-derived growth factor-activated receptor activity(GO:0005017) |
| 4.8 | 14.3 | GO:0001087 | transcription factor activity, sequence-specific DNA binding, RNA polymerase recruiting(GO:0001011) transcription factor activity, TFIIB-class binding(GO:0001087) |
| 4.7 | 14.2 | GO:0008281 | sulfonylurea receptor activity(GO:0008281) |
| 4.6 | 18.5 | GO:0099609 | microtubule lateral binding(GO:0099609) |
| 4.6 | 18.2 | GO:0005333 | norepinephrine transmembrane transporter activity(GO:0005333) |
| 4.2 | 33.6 | GO:0043199 | sulfate binding(GO:0043199) |
| 4.0 | 31.7 | GO:0005025 | transforming growth factor beta receptor activity, type I(GO:0005025) |
| 3.9 | 27.0 | GO:0031852 | mu-type opioid receptor binding(GO:0031852) |
| 3.8 | 15.2 | GO:0031694 | alpha-2A adrenergic receptor binding(GO:0031694) |
| 3.8 | 11.3 | GO:0097363 | protein O-GlcNAc transferase activity(GO:0097363) |
| 3.7 | 18.7 | GO:0005314 | high-affinity glutamate transmembrane transporter activity(GO:0005314) |
| 3.7 | 11.0 | GO:0030337 | DNA polymerase processivity factor activity(GO:0030337) |
| 3.6 | 10.9 | GO:0033906 | hyaluronoglucuronidase activity(GO:0033906) |
| 3.6 | 25.0 | GO:0008273 | calcium, potassium:sodium antiporter activity(GO:0008273) |
| 3.5 | 38.9 | GO:0048407 | platelet-derived growth factor binding(GO:0048407) |
| 3.5 | 24.7 | GO:0004111 | creatine kinase activity(GO:0004111) |
| 3.4 | 10.3 | GO:0060002 | plus-end directed microfilament motor activity(GO:0060002) |
| 3.4 | 13.7 | GO:0031798 | type 1 metabotropic glutamate receptor binding(GO:0031798) |
| 3.4 | 27.1 | GO:0005095 | GTPase inhibitor activity(GO:0005095) |
| 3.2 | 15.8 | GO:0004945 | angiotensin type II receptor activity(GO:0004945) |
| 3.1 | 15.6 | GO:0031802 | type 5 metabotropic glutamate receptor binding(GO:0031802) |
| 3.1 | 9.3 | GO:0034211 | GTP-dependent protein kinase activity(GO:0034211) |
| 3.1 | 15.3 | GO:0050816 | phosphothreonine binding(GO:0050816) |
| 3.0 | 14.8 | GO:0016454 | serine C-palmitoyltransferase activity(GO:0004758) C-palmitoyltransferase activity(GO:0016454) |
| 3.0 | 8.9 | GO:0035939 | microsatellite binding(GO:0035939) |
| 2.9 | 14.7 | GO:0005042 | netrin receptor activity(GO:0005042) |
| 2.9 | 11.7 | GO:0015220 | choline transmembrane transporter activity(GO:0015220) |
| 2.9 | 11.5 | GO:0008569 | ATP-dependent microtubule motor activity, minus-end-directed(GO:0008569) |
| 2.9 | 17.2 | GO:0017040 | ceramidase activity(GO:0017040) |
| 2.8 | 33.9 | GO:0008046 | axon guidance receptor activity(GO:0008046) |
| 2.8 | 13.9 | GO:0022841 | potassium ion leak channel activity(GO:0022841) |
| 2.8 | 8.3 | GO:0004069 | L-aspartate:2-oxoglutarate aminotransferase activity(GO:0004069) L-phenylalanine:2-oxoglutarate aminotransferase activity(GO:0080130) |
| 2.6 | 10.5 | GO:0004449 | isocitrate dehydrogenase (NAD+) activity(GO:0004449) |
| 2.5 | 15.1 | GO:0035662 | Toll-like receptor 4 binding(GO:0035662) |
| 2.4 | 41.6 | GO:0008179 | adenylate cyclase binding(GO:0008179) |
| 2.4 | 12.0 | GO:0004351 | glutamate decarboxylase activity(GO:0004351) |
| 2.3 | 9.4 | GO:0002046 | opsin binding(GO:0002046) |
| 2.3 | 18.2 | GO:0030274 | LIM domain binding(GO:0030274) |
| 2.3 | 27.2 | GO:0102391 | decanoate--CoA ligase activity(GO:0102391) |
| 2.2 | 6.6 | GO:0001605 | adrenomedullin receptor activity(GO:0001605) |
| 2.2 | 6.6 | GO:0032217 | riboflavin transporter activity(GO:0032217) |
| 2.1 | 12.7 | GO:0004126 | cytidine deaminase activity(GO:0004126) |
| 2.0 | 6.1 | GO:0000703 | oxidized pyrimidine nucleobase lesion DNA N-glycosylase activity(GO:0000703) |
| 2.0 | 5.9 | GO:1904315 | transmitter-gated ion channel activity involved in regulation of postsynaptic membrane potential(GO:1904315) |
| 1.9 | 23.3 | GO:0030215 | semaphorin receptor binding(GO:0030215) |
| 1.9 | 41.9 | GO:0017128 | phospholipid scramblase activity(GO:0017128) |
| 1.9 | 11.4 | GO:0048030 | disaccharide binding(GO:0048030) |
| 1.9 | 13.1 | GO:0004332 | fructose-bisphosphate aldolase activity(GO:0004332) |
| 1.8 | 18.4 | GO:0005132 | type I interferon receptor binding(GO:0005132) |
| 1.8 | 11.0 | GO:0031697 | beta-1 adrenergic receptor binding(GO:0031697) |
| 1.8 | 12.4 | GO:0005432 | calcium:sodium antiporter activity(GO:0005432) |
| 1.7 | 6.9 | GO:0003989 | acetyl-CoA carboxylase activity(GO:0003989) |
| 1.7 | 10.3 | GO:0015277 | kainate selective glutamate receptor activity(GO:0015277) |
| 1.7 | 15.2 | GO:0005347 | ATP transmembrane transporter activity(GO:0005347) ADP transmembrane transporter activity(GO:0015217) |
| 1.6 | 4.9 | GO:0030158 | protein xylosyltransferase activity(GO:0030158) |
| 1.6 | 8.1 | GO:0032795 | heterotrimeric G-protein binding(GO:0032795) |
| 1.6 | 9.6 | GO:0030284 | estrogen receptor activity(GO:0030284) |
| 1.6 | 31.8 | GO:0070742 | C2H2 zinc finger domain binding(GO:0070742) |
| 1.6 | 36.2 | GO:0015288 | porin activity(GO:0015288) |
| 1.5 | 7.7 | GO:0070052 | collagen V binding(GO:0070052) |
| 1.5 | 12.2 | GO:0004035 | alkaline phosphatase activity(GO:0004035) |
| 1.5 | 30.3 | GO:0001222 | transcription corepressor binding(GO:0001222) |
| 1.5 | 6.0 | GO:0016149 | translation release factor activity, codon specific(GO:0016149) |
| 1.5 | 4.4 | GO:0003990 | acetylcholinesterase activity(GO:0003990) |
| 1.4 | 7.1 | GO:0001601 | peptide YY receptor activity(GO:0001601) |
| 1.4 | 19.3 | GO:0042043 | neurexin family protein binding(GO:0042043) |
| 1.4 | 35.7 | GO:0004181 | metallocarboxypeptidase activity(GO:0004181) |
| 1.4 | 5.4 | GO:0050252 | retinol O-fatty-acyltransferase activity(GO:0050252) |
| 1.3 | 22.9 | GO:0001972 | retinoic acid binding(GO:0001972) |
| 1.3 | 13.4 | GO:0039706 | co-receptor binding(GO:0039706) |
| 1.3 | 28.5 | GO:0003746 | translation elongation factor activity(GO:0003746) |
| 1.2 | 8.7 | GO:0005229 | intracellular calcium activated chloride channel activity(GO:0005229) |
| 1.2 | 83.1 | GO:0005518 | collagen binding(GO:0005518) |
| 1.2 | 19.8 | GO:0004180 | carboxypeptidase activity(GO:0004180) |
| 1.2 | 24.3 | GO:0015299 | solute:proton antiporter activity(GO:0015299) |
| 1.2 | 8.4 | GO:0005173 | stem cell factor receptor binding(GO:0005173) |
| 1.2 | 3.6 | GO:0004925 | prolactin receptor activity(GO:0004925) |
| 1.2 | 10.5 | GO:0097027 | ubiquitin-protein transferase activator activity(GO:0097027) |
| 1.1 | 3.4 | GO:0005171 | hepatocyte growth factor receptor binding(GO:0005171) |
| 1.1 | 63.8 | GO:0005201 | extracellular matrix structural constituent(GO:0005201) |
| 1.1 | 6.7 | GO:0001537 | N-acetylgalactosamine 4-O-sulfotransferase activity(GO:0001537) |
| 1.1 | 15.3 | GO:0070679 | inositol 1,4,5 trisphosphate binding(GO:0070679) |
| 1.1 | 10.6 | GO:0031432 | titin binding(GO:0031432) |
| 1.0 | 17.3 | GO:0050431 | transforming growth factor beta binding(GO:0050431) |
| 1.0 | 9.0 | GO:0003680 | AT DNA binding(GO:0003680) |
| 1.0 | 20.8 | GO:0004198 | calcium-dependent cysteine-type endopeptidase activity(GO:0004198) |
| 1.0 | 18.5 | GO:0015026 | coreceptor activity(GO:0015026) |
| 1.0 | 7.6 | GO:0071253 | connexin binding(GO:0071253) |
| 1.0 | 7.6 | GO:0030957 | Tat protein binding(GO:0030957) |
| 0.9 | 41.8 | GO:0017080 | sodium channel regulator activity(GO:0017080) |
| 0.9 | 15.7 | GO:0017166 | vinculin binding(GO:0017166) |
| 0.9 | 21.2 | GO:0004602 | glutathione peroxidase activity(GO:0004602) |
| 0.9 | 20.9 | GO:0017147 | Wnt-protein binding(GO:0017147) |
| 0.9 | 3.6 | GO:0033743 | peptide-methionine (R)-S-oxide reductase activity(GO:0033743) |
| 0.9 | 7.1 | GO:0050291 | sphingosine N-acyltransferase activity(GO:0050291) |
| 0.9 | 7.0 | GO:0004439 | phosphatidylinositol-4,5-bisphosphate 5-phosphatase activity(GO:0004439) |
| 0.9 | 13.0 | GO:0019531 | oxalate transmembrane transporter activity(GO:0019531) |
| 0.8 | 565.6 | GO:0005509 | calcium ion binding(GO:0005509) |
| 0.8 | 7.2 | GO:0004385 | guanylate kinase activity(GO:0004385) |
| 0.8 | 5.5 | GO:0071532 | ankyrin repeat binding(GO:0071532) |
| 0.7 | 10.4 | GO:0033038 | bitter taste receptor activity(GO:0033038) |
| 0.7 | 7.4 | GO:0005412 | glucose:sodium symporter activity(GO:0005412) |
| 0.7 | 23.7 | GO:0004407 | histone deacetylase activity(GO:0004407) |
| 0.7 | 19.9 | GO:0050136 | NADH dehydrogenase (ubiquinone) activity(GO:0008137) NADH dehydrogenase (quinone) activity(GO:0050136) |
| 0.7 | 12.3 | GO:0002162 | dystroglycan binding(GO:0002162) |
| 0.7 | 63.8 | GO:0005089 | Rho guanyl-nucleotide exchange factor activity(GO:0005089) |
| 0.7 | 8.0 | GO:0008190 | eukaryotic initiation factor 4E binding(GO:0008190) |
| 0.7 | 9.3 | GO:0017154 | semaphorin receptor activity(GO:0017154) |
| 0.7 | 21.1 | GO:0048306 | calcium-dependent protein binding(GO:0048306) |
| 0.6 | 1.9 | GO:0052724 | inositol hexakisphosphate 1-kinase activity(GO:0052723) inositol hexakisphosphate 3-kinase activity(GO:0052724) |
| 0.6 | 63.4 | GO:0016503 | pheromone receptor activity(GO:0016503) |
| 0.6 | 3.1 | GO:0034235 | GPI anchor binding(GO:0034235) |
| 0.6 | 6.2 | GO:0005540 | hyaluronic acid binding(GO:0005540) |
| 0.6 | 20.3 | GO:0008307 | structural constituent of muscle(GO:0008307) |
| 0.6 | 11.0 | GO:0071837 | HMG box domain binding(GO:0071837) |
| 0.6 | 7.8 | GO:0051787 | misfolded protein binding(GO:0051787) |
| 0.6 | 9.0 | GO:0015095 | magnesium ion transmembrane transporter activity(GO:0015095) |
| 0.6 | 42.2 | GO:0046332 | SMAD binding(GO:0046332) |
| 0.6 | 4.1 | GO:0016714 | oxidoreductase activity, acting on paired donors, with incorporation or reduction of molecular oxygen, reduced pteridine as one donor, and incorporation of one atom of oxygen(GO:0016714) |
| 0.6 | 5.8 | GO:0008432 | JUN kinase binding(GO:0008432) |
| 0.6 | 19.0 | GO:0030742 | GTP-dependent protein binding(GO:0030742) |
| 0.6 | 3.3 | GO:0004366 | glycerol-3-phosphate O-acyltransferase activity(GO:0004366) |
| 0.5 | 2.2 | GO:0004822 | isoleucine-tRNA ligase activity(GO:0004822) |
| 0.5 | 4.3 | GO:0051959 | dynein light intermediate chain binding(GO:0051959) |
| 0.5 | 12.9 | GO:0080025 | phosphatidylinositol-3,5-bisphosphate binding(GO:0080025) |
| 0.5 | 11.8 | GO:0031435 | mitogen-activated protein kinase kinase kinase binding(GO:0031435) |
| 0.5 | 4.7 | GO:0001730 | 2'-5'-oligoadenylate synthetase activity(GO:0001730) |
| 0.5 | 1.6 | GO:0015018 | galactosylgalactosylxylosylprotein 3-beta-glucuronosyltransferase activity(GO:0015018) |
| 0.5 | 15.0 | GO:0001540 | beta-amyloid binding(GO:0001540) |
| 0.5 | 6.9 | GO:0043395 | heparan sulfate proteoglycan binding(GO:0043395) |
| 0.5 | 7.8 | GO:0035174 | histone serine kinase activity(GO:0035174) |
| 0.5 | 12.7 | GO:0005385 | zinc ion transmembrane transporter activity(GO:0005385) |
| 0.5 | 8.1 | GO:0050308 | sugar-phosphatase activity(GO:0050308) |
| 0.5 | 4.7 | GO:0050897 | cobalt ion binding(GO:0050897) |
| 0.5 | 5.1 | GO:0019966 | interleukin-1 binding(GO:0019966) |
| 0.5 | 10.0 | GO:0032266 | phosphatidylinositol-3-phosphate binding(GO:0032266) |
| 0.4 | 1.3 | GO:0015389 | pyrimidine- and adenine-specific:sodium symporter activity(GO:0015389) |
| 0.4 | 2.0 | GO:0036122 | BMP binding(GO:0036122) |
| 0.4 | 3.2 | GO:0008494 | translation activator activity(GO:0008494) |
| 0.4 | 9.2 | GO:0005109 | frizzled binding(GO:0005109) |
| 0.4 | 1.6 | GO:0046923 | ER retention sequence binding(GO:0046923) |
| 0.4 | 2.0 | GO:0042030 | ATPase inhibitor activity(GO:0042030) |
| 0.4 | 1.5 | GO:0015272 | ATP-activated inward rectifier potassium channel activity(GO:0015272) |
| 0.4 | 7.0 | GO:0008199 | ferric iron binding(GO:0008199) |
| 0.4 | 5.1 | GO:0071617 | lysophospholipid acyltransferase activity(GO:0071617) |
| 0.4 | 5.4 | GO:0071933 | Arp2/3 complex binding(GO:0071933) |
| 0.3 | 2.4 | GO:0010521 | telomerase inhibitor activity(GO:0010521) |
| 0.3 | 1.4 | GO:0030942 | endoplasmic reticulum signal peptide binding(GO:0030942) |
| 0.3 | 5.0 | GO:0009982 | pseudouridine synthase activity(GO:0009982) |
| 0.3 | 7.8 | GO:0016891 | endoribonuclease activity, producing 5'-phosphomonoesters(GO:0016891) |
| 0.3 | 2.2 | GO:0047035 | testosterone dehydrogenase (NAD+) activity(GO:0047035) |
| 0.3 | 0.9 | GO:0051021 | GDP-dissociation inhibitor binding(GO:0051021) |
| 0.3 | 13.5 | GO:0019894 | kinesin binding(GO:0019894) |
| 0.3 | 6.8 | GO:0004190 | aspartic-type endopeptidase activity(GO:0004190) |
| 0.3 | 5.1 | GO:0008106 | alcohol dehydrogenase (NADP+) activity(GO:0008106) |
| 0.3 | 10.7 | GO:0070888 | E-box binding(GO:0070888) |
| 0.3 | 0.8 | GO:0008607 | phosphorylase kinase regulator activity(GO:0008607) |
| 0.3 | 1.6 | GO:0004468 | lysine N-acetyltransferase activity, acting on acetyl phosphate as donor(GO:0004468) |
| 0.3 | 20.9 | GO:0051082 | unfolded protein binding(GO:0051082) |
| 0.2 | 0.7 | GO:0004825 | methionine-tRNA ligase activity(GO:0004825) |
| 0.2 | 2.8 | GO:0001968 | fibronectin binding(GO:0001968) |
| 0.2 | 5.4 | GO:0005086 | ARF guanyl-nucleotide exchange factor activity(GO:0005086) |
| 0.2 | 3.3 | GO:0042166 | acetylcholine-gated cation channel activity(GO:0022848) acetylcholine binding(GO:0042166) |
| 0.2 | 20.2 | GO:0005249 | voltage-gated potassium channel activity(GO:0005249) |
| 0.2 | 2.6 | GO:0015194 | L-serine transmembrane transporter activity(GO:0015194) serine transmembrane transporter activity(GO:0022889) |
| 0.2 | 2.3 | GO:0051011 | microtubule minus-end binding(GO:0051011) |
| 0.2 | 5.5 | GO:0005520 | insulin-like growth factor binding(GO:0005520) |
| 0.2 | 1.4 | GO:0004983 | neuropeptide Y receptor activity(GO:0004983) |
| 0.2 | 1.4 | GO:0097322 | 7SK snRNA binding(GO:0097322) |
| 0.2 | 3.2 | GO:0008568 | microtubule-severing ATPase activity(GO:0008568) |
| 0.2 | 44.5 | GO:0005096 | GTPase activator activity(GO:0005096) |
| 0.2 | 3.4 | GO:0070840 | dynein complex binding(GO:0070840) |
| 0.2 | 5.0 | GO:0005184 | neuropeptide hormone activity(GO:0005184) |
| 0.2 | 3.1 | GO:0031418 | L-ascorbic acid binding(GO:0031418) |
| 0.2 | 2.7 | GO:0051428 | peptide hormone receptor binding(GO:0051428) |
| 0.2 | 6.6 | GO:0015144 | carbohydrate transmembrane transporter activity(GO:0015144) carbohydrate transporter activity(GO:1901476) |
| 0.2 | 0.9 | GO:0031727 | CCR2 chemokine receptor binding(GO:0031727) |
| 0.1 | 1.3 | GO:0000340 | RNA 7-methylguanosine cap binding(GO:0000340) |
| 0.1 | 2.8 | GO:0046961 | proton-transporting ATPase activity, rotational mechanism(GO:0046961) |
| 0.1 | 3.7 | GO:0051059 | NF-kappaB binding(GO:0051059) |
| 0.1 | 3.5 | GO:0031492 | nucleosomal DNA binding(GO:0031492) |
| 0.1 | 0.4 | GO:0008254 | 3'-nucleotidase activity(GO:0008254) |
| 0.1 | 1.2 | GO:0004143 | diacylglycerol kinase activity(GO:0004143) |
| 0.1 | 5.0 | GO:0030507 | spectrin binding(GO:0030507) |
| 0.1 | 3.4 | GO:1990841 | promoter-specific chromatin binding(GO:1990841) |
| 0.1 | 2.6 | GO:0001103 | RNA polymerase II repressing transcription factor binding(GO:0001103) |
| 0.1 | 5.2 | GO:0016875 | aminoacyl-tRNA ligase activity(GO:0004812) ligase activity, forming carbon-oxygen bonds(GO:0016875) ligase activity, forming aminoacyl-tRNA and related compounds(GO:0016876) |
| 0.1 | 16.4 | GO:0003714 | transcription corepressor activity(GO:0003714) |
| 0.1 | 2.3 | GO:0070577 | lysine-acetylated histone binding(GO:0070577) |
| 0.1 | 10.5 | GO:0004222 | metalloendopeptidase activity(GO:0004222) |
| 0.1 | 1.1 | GO:0102336 | fatty acid elongase activity(GO:0009922) 3-oxo-arachidoyl-CoA synthase activity(GO:0102336) 3-oxo-cerotoyl-CoA synthase activity(GO:0102337) 3-oxo-lignoceronyl-CoA synthase activity(GO:0102338) |
| 0.1 | 11.5 | GO:0001078 | transcriptional repressor activity, RNA polymerase II core promoter proximal region sequence-specific binding(GO:0001078) |
| 0.1 | 0.8 | GO:0008140 | cAMP response element binding protein binding(GO:0008140) |
| 0.1 | 1.7 | GO:0030332 | cyclin binding(GO:0030332) |
| 0.1 | 20.7 | GO:0000287 | magnesium ion binding(GO:0000287) |
| 0.1 | 6.2 | GO:0005200 | structural constituent of cytoskeleton(GO:0005200) |
| 0.1 | 3.3 | GO:0008237 | metallopeptidase activity(GO:0008237) |
| 0.1 | 1.0 | GO:0016290 | palmitoyl-CoA hydrolase activity(GO:0016290) |
| 0.1 | 1.6 | GO:0000993 | RNA polymerase II core binding(GO:0000993) |
| 0.1 | 7.3 | GO:0036459 | thiol-dependent ubiquitinyl hydrolase activity(GO:0036459) ubiquitinyl hydrolase activity(GO:0101005) |
| 0.1 | 3.0 | GO:0005484 | SNAP receptor activity(GO:0005484) |
| 0.1 | 2.3 | GO:0004693 | cyclin-dependent protein serine/threonine kinase activity(GO:0004693) |
| 0.1 | 32.8 | GO:0005549 | odorant binding(GO:0005549) |
| 0.1 | 8.4 | GO:0003774 | motor activity(GO:0003774) |
| 0.1 | 2.6 | GO:0016620 | oxidoreductase activity, acting on the aldehyde or oxo group of donors, NAD or NADP as acceptor(GO:0016620) |
| 0.1 | 9.2 | GO:0008017 | microtubule binding(GO:0008017) |
| 0.1 | 1.4 | GO:0008157 | protein phosphatase 1 binding(GO:0008157) |
| 0.1 | 6.4 | GO:0042626 | ATPase activity, coupled to transmembrane movement of substances(GO:0042626) ATPase activity, coupled to movement of substances(GO:0043492) |
| 0.1 | 4.0 | GO:0051015 | actin filament binding(GO:0051015) |
| 0.1 | 6.1 | GO:0005179 | hormone activity(GO:0005179) |
| 0.1 | 2.0 | GO:0005245 | voltage-gated calcium channel activity(GO:0005245) |
| 0.0 | 0.6 | GO:0008301 | DNA binding, bending(GO:0008301) |
| 0.0 | 2.7 | GO:0005178 | integrin binding(GO:0005178) |
| 0.0 | 0.4 | GO:0017075 | syntaxin-1 binding(GO:0017075) |
| 0.0 | 1.3 | GO:0005080 | protein kinase C binding(GO:0005080) |
| 0.0 | 1.9 | GO:0008013 | beta-catenin binding(GO:0008013) |
| 0.0 | 1.5 | GO:0004197 | cysteine-type endopeptidase activity(GO:0004197) |
| 0.0 | 1.0 | GO:0017112 | Rab guanyl-nucleotide exchange factor activity(GO:0017112) |
| 0.0 | 2.3 | GO:0008565 | protein transporter activity(GO:0008565) |
| 0.0 | 11.0 | GO:0004842 | ubiquitin-protein transferase activity(GO:0004842) |
| 0.0 | 0.9 | GO:0005244 | voltage-gated ion channel activity(GO:0005244) voltage-gated channel activity(GO:0022832) |
| 0.0 | 0.2 | GO:0043015 | gamma-tubulin binding(GO:0043015) |
Gene overrepresentation in curated gene sets: canonical pathways category:
| Log-likelihood per target | Total log-likelihood | Term | Description |
|---|---|---|---|
| 2.4 | 115.8 | NABA COLLAGENS | Genes encoding collagen proteins |
| 1.7 | 30.3 | PID CIRCADIAN PATHWAY | Circadian rhythm pathway |
| 1.3 | 27.7 | PID LPA4 PATHWAY | LPA4-mediated signaling events |
| 1.2 | 54.9 | PID INTEGRIN3 PATHWAY | Beta3 integrin cell surface interactions |
| 1.2 | 43.9 | ST WNT BETA CATENIN PATHWAY | Wnt/beta-catenin Pathway |
| 1.1 | 45.7 | NABA PROTEOGLYCANS | Genes encoding proteoglycans |
| 1.0 | 13.4 | PID P38 GAMMA DELTA PATHWAY | Signaling mediated by p38-gamma and p38-delta |
| 0.8 | 120.3 | NABA ECM AFFILIATED | Genes encoding proteins affiliated structurally or functionally to extracellular matrix proteins |
| 0.8 | 54.9 | PID AR PATHWAY | Coregulation of Androgen receptor activity |
| 0.7 | 32.9 | PID NETRIN PATHWAY | Netrin-mediated signaling events |
| 0.7 | 26.6 | PID FAK PATHWAY | Signaling events mediated by focal adhesion kinase |
| 0.7 | 28.2 | PID HNF3A PATHWAY | FOXA1 transcription factor network |
| 0.6 | 24.5 | PID EPHB FWD PATHWAY | EPHB forward signaling |
| 0.6 | 14.4 | PID INTEGRIN CS PATHWAY | Integrin family cell surface interactions |
| 0.6 | 15.1 | PID RAS PATHWAY | Regulation of Ras family activation |
| 0.6 | 5.2 | PID S1P S1P2 PATHWAY | S1P2 pathway |
| 0.5 | 15.3 | PID MYC PATHWAY | C-MYC pathway |
| 0.5 | 43.1 | PID CMYB PATHWAY | C-MYB transcription factor network |
| 0.5 | 24.1 | ST INTEGRIN SIGNALING PATHWAY | Integrin Signaling Pathway |
| 0.5 | 20.1 | PID HNF3B PATHWAY | FOXA2 and FOXA3 transcription factor networks |
| 0.5 | 5.8 | SIG REGULATION OF THE ACTIN CYTOSKELETON BY RHO GTPASES | Genes related to regulation of the actin cytoskeleton |
| 0.5 | 18.8 | PID TGFBR PATHWAY | TGF-beta receptor signaling |
| 0.4 | 7.6 | PID NEPHRIN NEPH1 PATHWAY | Nephrin/Neph1 signaling in the kidney podocyte |
| 0.4 | 12.2 | PID NCADHERIN PATHWAY | N-cadherin signaling events |
| 0.4 | 16.8 | PID BMP PATHWAY | BMP receptor signaling |
| 0.4 | 10.9 | PID LIS1 PATHWAY | Lissencephaly gene (LIS1) in neuronal migration and development |
| 0.4 | 3.5 | SA REG CASCADE OF CYCLIN EXPR | Expression of cyclins regulates progression through the cell cycle by activating cyclin-dependent kinases. |
| 0.4 | 15.3 | PID MET PATHWAY | Signaling events mediated by Hepatocyte Growth Factor Receptor (c-Met) |
| 0.3 | 9.9 | PID ERBB4 PATHWAY | ErbB4 signaling events |
| 0.3 | 9.5 | PID TNF PATHWAY | TNF receptor signaling pathway |
| 0.3 | 9.5 | PID HIV NEF PATHWAY | HIV-1 Nef: Negative effector of Fas and TNF-alpha |
| 0.3 | 13.0 | PID ATR PATHWAY | ATR signaling pathway |
| 0.3 | 9.2 | PID P53 REGULATION PATHWAY | p53 pathway |
| 0.3 | 3.7 | ST TYPE I INTERFERON PATHWAY | Type I Interferon (alpha/beta IFN) Pathway |
| 0.3 | 9.8 | PID RAC1 REG PATHWAY | Regulation of RAC1 activity |
| 0.3 | 3.8 | PID HEDGEHOG 2PATHWAY | Signaling events mediated by the Hedgehog family |
| 0.2 | 3.2 | PID ERB GENOMIC PATHWAY | Validated nuclear estrogen receptor beta network |
| 0.2 | 3.6 | ST INTERLEUKIN 4 PATHWAY | Interleukin 4 (IL-4) Pathway |
| 0.2 | 14.3 | PID MYC ACTIV PATHWAY | Validated targets of C-MYC transcriptional activation |
| 0.2 | 16.1 | WNT SIGNALING | Genes related to Wnt-mediated signal transduction |
| 0.2 | 0.6 | PID TCR JNK PATHWAY | JNK signaling in the CD4+ TCR pathway |
| 0.2 | 4.7 | PID HIF2PATHWAY | HIF-2-alpha transcription factor network |
| 0.2 | 9.9 | PID ERBB1 DOWNSTREAM PATHWAY | ErbB1 downstream signaling |
| 0.2 | 2.1 | PID AR NONGENOMIC PATHWAY | Nongenotropic Androgen signaling |
| 0.1 | 2.7 | PID CDC42 PATHWAY | CDC42 signaling events |
| 0.1 | 4.6 | PID AJDISS 2PATHWAY | Posttranslational regulation of adherens junction stability and dissassembly |
| 0.1 | 3.2 | PID ILK PATHWAY | Integrin-linked kinase signaling |
| 0.1 | 1.2 | PID ERBB2 ERBB3 PATHWAY | ErbB2/ErbB3 signaling events |
| 0.1 | 0.9 | PID GMCSF PATHWAY | GMCSF-mediated signaling events |
| 0.1 | 14.5 | NABA ECM GLYCOPROTEINS | Genes encoding structural ECM glycoproteins |
| 0.1 | 1.6 | PID ARF6 PATHWAY | Arf6 signaling events |
Gene overrepresentation in curated gene sets: REACTOME pathways category:
| Log-likelihood per target | Total log-likelihood | Term | Description |
|---|---|---|---|
| 3.4 | 47.0 | REACTOME KERATAN SULFATE DEGRADATION | Genes involved in Keratan sulfate degradation |
| 3.0 | 8.9 | REACTOME AUTODEGRADATION OF THE E3 UBIQUITIN LIGASE COP1 | Genes involved in Autodegradation of the E3 ubiquitin ligase COP1 |
| 2.5 | 7.6 | REACTOME NOREPINEPHRINE NEUROTRANSMITTER RELEASE CYCLE | Genes involved in Norepinephrine Neurotransmitter Release Cycle |
| 2.4 | 42.6 | REACTOME UNBLOCKING OF NMDA RECEPTOR GLUTAMATE BINDING AND ACTIVATION | Genes involved in Unblocking of NMDA receptor, glutamate binding and activation |
| 2.2 | 33.2 | REACTOME ADENYLATE CYCLASE ACTIVATING PATHWAY | Genes involved in Adenylate cyclase activating pathway |
| 2.1 | 8.4 | REACTOME REGULATION OF KIT SIGNALING | Genes involved in Regulation of KIT signaling |
| 2.0 | 119.2 | REACTOME COLLAGEN FORMATION | Genes involved in Collagen formation |
| 1.7 | 47.7 | REACTOME SIGNALING BY BMP | Genes involved in Signaling by BMP |
| 1.7 | 48.1 | REACTOME CASPASE MEDIATED CLEAVAGE OF CYTOSKELETAL PROTEINS | Genes involved in Caspase-mediated cleavage of cytoskeletal proteins |
| 1.6 | 25.8 | REACTOME ACETYLCHOLINE NEUROTRANSMITTER RELEASE CYCLE | Genes involved in Acetylcholine Neurotransmitter Release Cycle |
| 1.6 | 28.3 | REACTOME SYNTHESIS OF VERY LONG CHAIN FATTY ACYL COAS | Genes involved in Synthesis of very long-chain fatty acyl-CoAs |
| 1.6 | 17.1 | REACTOME HYALURONAN UPTAKE AND DEGRADATION | Genes involved in Hyaluronan uptake and degradation |
| 1.5 | 19.0 | REACTOME TRAFFICKING AND PROCESSING OF ENDOSOMAL TLR | Genes involved in Trafficking and processing of endosomal TLR |
| 1.4 | 22.8 | REACTOME HS GAG DEGRADATION | Genes involved in HS-GAG degradation |
| 1.3 | 23.3 | REACTOME OTHER SEMAPHORIN INTERACTIONS | Genes involved in Other semaphorin interactions |
| 1.0 | 39.8 | REACTOME REGULATION OF BETA CELL DEVELOPMENT | Genes involved in Regulation of beta-cell development |
| 1.0 | 37.4 | REACTOME STRIATED MUSCLE CONTRACTION | Genes involved in Striated Muscle Contraction |
| 1.0 | 10.0 | REACTOME OXYGEN DEPENDENT PROLINE HYDROXYLATION OF HYPOXIA INDUCIBLE FACTOR ALPHA | Genes involved in Oxygen-dependent Proline Hydroxylation of Hypoxia-inducible Factor Alpha |
| 1.0 | 24.9 | REACTOME DCC MEDIATED ATTRACTIVE SIGNALING | Genes involved in DCC mediated attractive signaling |
| 0.9 | 13.8 | REACTOME GABA SYNTHESIS RELEASE REUPTAKE AND DEGRADATION | Genes involved in GABA synthesis, release, reuptake and degradation |
| 0.9 | 15.5 | REACTOME N GLYCAN ANTENNAE ELONGATION | Genes involved in N-Glycan antennae elongation |
| 0.9 | 18.0 | REACTOME REGULATION OF INSULIN SECRETION | Genes involved in Regulation of Insulin Secretion |
| 0.9 | 10.6 | REACTOME NA CL DEPENDENT NEUROTRANSMITTER TRANSPORTERS | Genes involved in Na+/Cl- dependent neurotransmitter transporters |
| 0.9 | 16.7 | REACTOME GLUCONEOGENESIS | Genes involved in Gluconeogenesis |
| 0.8 | 10.1 | REACTOME CREB PHOSPHORYLATION THROUGH THE ACTIVATION OF RAS | Genes involved in CREB phosphorylation through the activation of Ras |
| 0.8 | 18.2 | REACTOME SIGNALING BY HIPPO | Genes involved in Signaling by Hippo |
| 0.8 | 21.1 | REACTOME CIRCADIAN REPRESSION OF EXPRESSION BY REV ERBA | Genes involved in Circadian Repression of Expression by REV-ERBA |
| 0.8 | 9.8 | REACTOME TANDEM PORE DOMAIN POTASSIUM CHANNELS | Genes involved in Tandem pore domain potassium channels |
| 0.7 | 32.9 | REACTOME NOTCH1 INTRACELLULAR DOMAIN REGULATES TRANSCRIPTION | Genes involved in NOTCH1 Intracellular Domain Regulates Transcription |
| 0.7 | 27.4 | REACTOME GLYCOLYSIS | Genes involved in Glycolysis |
| 0.7 | 10.3 | REACTOME RAP1 SIGNALLING | Genes involved in Rap1 signalling |
| 0.7 | 20.4 | REACTOME SEMA4D INDUCED CELL MIGRATION AND GROWTH CONE COLLAPSE | Genes involved in Sema4D induced cell migration and growth-cone collapse |
| 0.7 | 6.9 | REACTOME INTEGRATION OF ENERGY METABOLISM | Genes involved in Integration of energy metabolism |
| 0.7 | 12.7 | REACTOME ZINC TRANSPORTERS | Genes involved in Zinc transporters |
| 0.7 | 9.3 | REACTOME BMAL1 CLOCK NPAS2 ACTIVATES CIRCADIAN EXPRESSION | Genes involved in BMAL1:CLOCK/NPAS2 Activates Circadian Expression |
| 0.6 | 10.3 | REACTOME IONOTROPIC ACTIVITY OF KAINATE RECEPTORS | Genes involved in Ionotropic activity of Kainate Receptors |
| 0.6 | 44.6 | REACTOME TRANSCRIPTIONAL REGULATION OF WHITE ADIPOCYTE DIFFERENTIATION | Genes involved in Transcriptional Regulation of White Adipocyte Differentiation |
| 0.6 | 7.9 | REACTOME EICOSANOID LIGAND BINDING RECEPTORS | Genes involved in Eicosanoid ligand-binding receptors |
| 0.5 | 6.5 | REACTOME PASSIVE TRANSPORT BY AQUAPORINS | Genes involved in Passive Transport by Aquaporins |
| 0.5 | 15.3 | REACTOME GLUCAGON SIGNALING IN METABOLIC REGULATION | Genes involved in Glucagon signaling in metabolic regulation |
| 0.5 | 6.2 | REACTOME AKT PHOSPHORYLATES TARGETS IN THE CYTOSOL | Genes involved in AKT phosphorylates targets in the cytosol |
| 0.5 | 12.4 | REACTOME PLATELET CALCIUM HOMEOSTASIS | Genes involved in Platelet calcium homeostasis |
| 0.5 | 20.4 | REACTOME SIGNALING BY ROBO RECEPTOR | Genes involved in Signaling by Robo receptor |
| 0.5 | 1.9 | REACTOME CTNNB1 PHOSPHORYLATION CASCADE | Genes involved in Beta-catenin phosphorylation cascade |
| 0.5 | 6.1 | REACTOME BASE FREE SUGAR PHOSPHATE REMOVAL VIA THE SINGLE NUCLEOTIDE REPLACEMENT PATHWAY | Genes involved in Base-free sugar-phosphate removal via the single-nucleotide replacement pathway |
| 0.5 | 16.8 | REACTOME GLYCOSPHINGOLIPID METABOLISM | Genes involved in Glycosphingolipid metabolism |
| 0.5 | 7.8 | REACTOME ASSOCIATION OF LICENSING FACTORS WITH THE PRE REPLICATIVE COMPLEX | Genes involved in Association of licensing factors with the pre-replicative complex |
| 0.5 | 7.2 | REACTOME AMINE DERIVED HORMONES | Genes involved in Amine-derived hormones |
| 0.4 | 15.2 | REACTOME INTERACTIONS OF VPR WITH HOST CELLULAR PROTEINS | Genes involved in Interactions of Vpr with host cellular proteins |
| 0.4 | 27.3 | REACTOME RESPIRATORY ELECTRON TRANSPORT | Genes involved in Respiratory electron transport |
| 0.4 | 35.8 | REACTOME RESPONSE TO ELEVATED PLATELET CYTOSOLIC CA2 | Genes involved in Response to elevated platelet cytosolic Ca2+ |
| 0.4 | 4.4 | REACTOME SYNTHESIS SECRETION AND DEACYLATION OF GHRELIN | Genes involved in Synthesis, Secretion, and Deacylation of Ghrelin |
| 0.4 | 5.7 | REACTOME NEPHRIN INTERACTIONS | Genes involved in Nephrin interactions |
| 0.4 | 2.3 | REACTOME IRAK2 MEDIATED ACTIVATION OF TAK1 COMPLEX UPON TLR7 8 OR 9 STIMULATION | Genes involved in IRAK2 mediated activation of TAK1 complex upon TLR7/8 or 9 stimulation |
| 0.4 | 7.8 | REACTOME MITOCHONDRIAL TRNA AMINOACYLATION | Genes involved in Mitochondrial tRNA aminoacylation |
| 0.4 | 10.9 | REACTOME KINESINS | Genes involved in Kinesins |
| 0.3 | 4.5 | REACTOME CIRCADIAN CLOCK | Genes involved in Circadian Clock |
| 0.3 | 6.1 | REACTOME SYNTHESIS OF PIPS AT THE GOLGI MEMBRANE | Genes involved in Synthesis of PIPs at the Golgi membrane |
| 0.3 | 11.5 | REACTOME ABC FAMILY PROTEINS MEDIATED TRANSPORT | Genes involved in ABC-family proteins mediated transport |
| 0.3 | 8.9 | REACTOME ADHERENS JUNCTIONS INTERACTIONS | Genes involved in Adherens junctions interactions |
| 0.3 | 7.5 | REACTOME NETRIN1 SIGNALING | Genes involved in Netrin-1 signaling |
| 0.3 | 3.7 | REACTOME TRAF3 DEPENDENT IRF ACTIVATION PATHWAY | Genes involved in TRAF3-dependent IRF activation pathway |
| 0.3 | 14.3 | REACTOME DOWNSTREAM SIGNAL TRANSDUCTION | Genes involved in Downstream signal transduction |
| 0.3 | 5.1 | REACTOME ACYL CHAIN REMODELLING OF PI | Genes involved in Acyl chain remodelling of PI |
| 0.3 | 15.3 | REACTOME VOLTAGE GATED POTASSIUM CHANNELS | Genes involved in Voltage gated Potassium channels |
| 0.3 | 12.7 | REACTOME NUCLEAR SIGNALING BY ERBB4 | Genes involved in Nuclear signaling by ERBB4 |
| 0.3 | 15.8 | REACTOME MHC CLASS II ANTIGEN PRESENTATION | Genes involved in MHC class II antigen presentation |
| 0.3 | 6.7 | REACTOME CHONDROITIN SULFATE BIOSYNTHESIS | Genes involved in Chondroitin sulfate biosynthesis |
| 0.3 | 13.4 | REACTOME NRAGE SIGNALS DEATH THROUGH JNK | Genes involved in NRAGE signals death through JNK |
| 0.3 | 3.3 | REACTOME PRESYNAPTIC NICOTINIC ACETYLCHOLINE RECEPTORS | Genes involved in Presynaptic nicotinic acetylcholine receptors |
| 0.2 | 2.7 | REACTOME TGF BETA RECEPTOR SIGNALING IN EMT EPITHELIAL TO MESENCHYMAL TRANSITION | Genes involved in TGF-beta receptor signaling in EMT (epithelial to mesenchymal transition) |
| 0.2 | 24.4 | REACTOME TRANSPORT OF INORGANIC CATIONS ANIONS AND AMINO ACIDS OLIGOPEPTIDES | Genes involved in Transport of inorganic cations/anions and amino acids/oligopeptides |
| 0.2 | 3.0 | REACTOME PROTEOLYTIC CLEAVAGE OF SNARE COMPLEX PROTEINS | Genes involved in Proteolytic cleavage of SNARE complex proteins |
| 0.2 | 5.5 | REACTOME DEADENYLATION OF MRNA | Genes involved in Deadenylation of mRNA |
| 0.2 | 7.7 | REACTOME MEIOTIC SYNAPSIS | Genes involved in Meiotic Synapsis |
| 0.2 | 7.1 | REACTOME SPHINGOLIPID METABOLISM | Genes involved in Sphingolipid metabolism |
| 0.2 | 1.6 | REACTOME A TETRASACCHARIDE LINKER SEQUENCE IS REQUIRED FOR GAG SYNTHESIS | Genes involved in A tetrasaccharide linker sequence is required for GAG synthesis |
| 0.2 | 7.8 | REACTOME ACTIVATION OF CHAPERONE GENES BY XBP1S | Genes involved in Activation of Chaperone Genes by XBP1(S) |
| 0.2 | 3.3 | REACTOME SYNTHESIS OF PA | Genes involved in Synthesis of PA |
| 0.1 | 5.4 | REACTOME AMYLOIDS | Genes involved in Amyloids |
| 0.1 | 0.9 | REACTOME TIE2 SIGNALING | Genes involved in Tie2 Signaling |
| 0.1 | 2.1 | REACTOME SMAD2 SMAD3 SMAD4 HETEROTRIMER REGULATES TRANSCRIPTION | Genes involved in SMAD2/SMAD3:SMAD4 heterotrimer regulates transcription |
| 0.1 | 0.9 | REACTOME LYSOSOME VESICLE BIOGENESIS | Genes involved in Lysosome Vesicle Biogenesis |
| 0.1 | 1.3 | REACTOME MRNA DECAY BY 3 TO 5 EXORIBONUCLEASE | Genes involved in mRNA Decay by 3' to 5' Exoribonuclease |
| 0.1 | 0.8 | REACTOME REGULATION OF RHEB GTPASE ACTIVITY BY AMPK | Genes involved in Regulation of Rheb GTPase activity by AMPK |
| 0.1 | 1.4 | REACTOME PHOSPHORYLATION OF THE APC C | Genes involved in Phosphorylation of the APC/C |
| 0.1 | 3.2 | REACTOME POTASSIUM CHANNELS | Genes involved in Potassium Channels |
| 0.1 | 0.4 | REACTOME ROLE OF DCC IN REGULATING APOPTOSIS | Genes involved in Role of DCC in regulating apoptosis |
| 0.1 | 6.8 | REACTOME SIGNALING BY RHO GTPASES | Genes involved in Signaling by Rho GTPases |
| 0.1 | 1.4 | REACTOME GAP JUNCTION ASSEMBLY | Genes involved in Gap junction assembly |
| 0.1 | 4.4 | REACTOME L1CAM INTERACTIONS | Genes involved in L1CAM interactions |
| 0.1 | 0.9 | REACTOME ACTIVATION OF GENES BY ATF4 | Genes involved in Activation of Genes by ATF4 |
| 0.1 | 0.5 | REACTOME REGULATION OF INSULIN SECRETION BY ACETYLCHOLINE | Genes involved in Regulation of Insulin Secretion by Acetylcholine |
| 0.0 | 3.3 | REACTOME CLASS B 2 SECRETIN FAMILY RECEPTORS | Genes involved in Class B/2 (Secretin family receptors) |
| 0.0 | 0.6 | REACTOME EXTRACELLULAR MATRIX ORGANIZATION | Genes involved in Extracellular matrix organization |
| 0.0 | 0.5 | REACTOME EFFECTS OF PIP2 HYDROLYSIS | Genes involved in Effects of PIP2 hydrolysis |
| 0.0 | 0.6 | REACTOME INSULIN RECEPTOR RECYCLING | Genes involved in Insulin receptor recycling |
| 0.0 | 0.2 | REACTOME DARPP 32 EVENTS | Genes involved in DARPP-32 events |