Project
GSE53960: rat RNA-Seq transcriptomic Bodymap
Navigation
Downloads
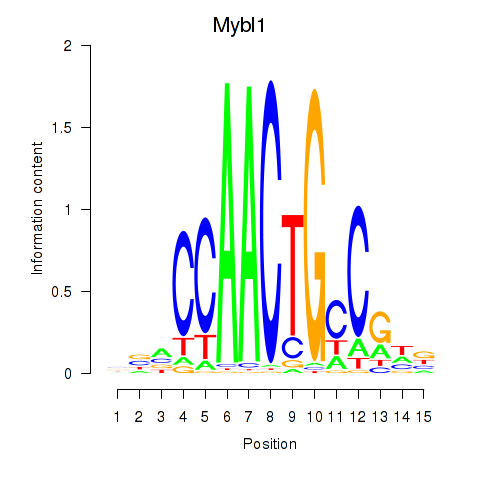
Results for Mybl1
Z-value: 1.89
Motif logo
Transcription factors associated with Mybl1
| Gene Symbol | Gene ID | Gene Info |
|---|---|---|
|
Mybl1
|
ENSRNOG00000021669 | myeloblastosis oncogene-like 1 |
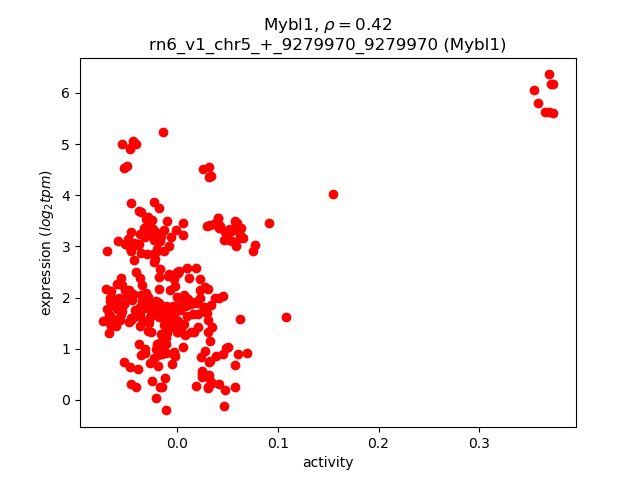
Activity-expression correlation:
| Gene | Promoter | Pearson corr. coef. | P-value | Plot |
|---|---|---|---|---|
| Mybl1 | rn6_v1_chr5_+_9279970_9279970 | 0.42 | 4.3e-15 | Click! |
Activity profile of Mybl1 motif
Sorted Z-values of Mybl1 motif
| Promoter | Log-likelihood | Transcript | Gene | Gene Info |
|---|---|---|---|---|
| chr19_-_62158327 | 63.26 |
ENSRNOT00000075053
|
Ccdc7
|
coiled-coil domain containing 7 |
| chr16_+_72086878 | 62.59 |
ENSRNOT00000023756
ENSRNOT00000078085 |
Adam3a
|
ADAM metallopeptidase domain 3A |
| chr8_-_115263484 | 61.91 |
ENSRNOT00000039696
ENSRNOT00000081138 |
Iqcf3
|
IQ motif containing F3 |
| chr2_-_187668677 | 61.76 |
ENSRNOT00000056898
ENSRNOT00000092563 |
Tsacc
|
TSSK6 activating co-chaperone |
| chr15_-_42751330 | 59.70 |
ENSRNOT00000066478
|
Adam2
|
ADAM metallopeptidase domain 2 |
| chr9_-_104467973 | 59.21 |
ENSRNOT00000026099
|
Slco6b1
|
solute carrier organic anion transporter family member 6B1 |
| chr1_-_81295442 | 59.02 |
ENSRNOT00000030900
|
Irgc
|
immunity related GTPase cinema |
| chr17_+_14469488 | 55.78 |
ENSRNOT00000060670
|
AABR07027111.1
|
|
| chr3_-_176144531 | 53.91 |
ENSRNOT00000082266
|
Tcfl5
|
transcription factor like 5 |
| chr3_+_108544931 | 50.35 |
ENSRNOT00000006809
|
Tmco5a
|
transmembrane and coiled-coil domains 5A |
| chr10_-_79097807 | 48.83 |
ENSRNOT00000003421
|
Kif2b
|
kinesin family member 2B |
| chr4_-_27638676 | 48.12 |
ENSRNOT00000011377
|
RGD1306626
|
similar to RIKEN cDNA 4930500J03 |
| chr1_-_247476827 | 47.93 |
ENSRNOT00000021298
|
Insl6
|
insulin-like 6 |
| chr9_-_65879521 | 46.19 |
ENSRNOT00000017517
|
Als2cr11
|
amyotrophic lateral sclerosis 2 chromosome region, candidate 11 |
| chr11_-_60251415 | 46.04 |
ENSRNOT00000080148
ENSRNOT00000086602 |
Slc9c1
|
solute carrier family 9 member C1 |
| chr17_-_44595323 | 45.48 |
ENSRNOT00000086767
|
Pom121l2
|
POM121 transmembrane nucleoporin-like 2 |
| chr14_+_13751231 | 45.40 |
ENSRNOT00000044244
|
Gk2
|
glycerol kinase 2 |
| chr4_+_45567573 | 45.38 |
ENSRNOT00000089824
|
Ankrd7
|
ankyrin repeat domain 7 |
| chr15_-_39606003 | 44.84 |
ENSRNOT00000059490
|
RGD1563302
|
RGD1563302 |
| chr10_-_82209459 | 43.79 |
ENSRNOT00000004377
|
Spata20
|
spermatogenesis associated 20 |
| chr16_-_82288022 | 43.02 |
ENSRNOT00000078609
|
Spaca7
|
sperm acrosome associated 7 |
| chr5_-_136053210 | 42.92 |
ENSRNOT00000025903
|
Kif2c
|
kinesin family member 2C |
| chr10_+_86514830 | 41.73 |
ENSRNOT00000048647
ENSRNOT00000009535 |
Zpbp2
|
zona pellucida binding protein 2 |
| chr2_+_92559929 | 41.26 |
ENSRNOT00000033404
|
tGap1
|
GTPase activating protein testicular GAP1 |
| chr17_+_78817529 | 40.76 |
ENSRNOT00000021918
|
Meig1
|
meiosis/spermiogenesis associated 1 |
| chr6_+_99433550 | 40.53 |
ENSRNOT00000079359
ENSRNOT00000008504 |
Hspa2
|
heat shock protein family A member 2 |
| chr16_+_71889235 | 40.39 |
ENSRNOT00000038266
|
Adam32
|
ADAM metallopeptidase domain 32 |
| chr2_-_84531192 | 40.16 |
ENSRNOT00000065312
ENSRNOT00000090540 |
Ropn1l
|
rhophilin associated tail protein 1-like |
| chr1_+_102915191 | 39.81 |
ENSRNOT00000017851
|
Ldhc
|
lactate dehydrogenase C |
| chr15_-_5417570 | 39.46 |
ENSRNOT00000061525
|
Spetex-2F
|
Spetex-2F protein |
| chr9_-_4393213 | 39.21 |
ENSRNOT00000072923
|
LOC301165
|
similar to hypothetical protein 4932415M13 |
| chr15_+_23553128 | 39.17 |
ENSRNOT00000012985
|
Cdkn3
|
cyclin-dependent kinase inhibitor 3 |
| chr5_+_131719922 | 39.12 |
ENSRNOT00000010524
|
Spata6
|
spermatogenesis associated 6 |
| chr9_-_9143189 | 38.52 |
ENSRNOT00000089904
|
MGC116197
|
similar to RIKEN cDNA 1700001E04 |
| chr1_-_220786615 | 38.33 |
ENSRNOT00000038198
|
Tsga10ip
|
testis specific 10 interacting protein |
| chr13_-_84452181 | 38.23 |
ENSRNOT00000005060
|
Mael
|
maelstrom spermatogenic transposon silencer |
| chr17_+_15194262 | 37.72 |
ENSRNOT00000073070
|
AABR07072539.1
|
|
| chr3_+_110618298 | 37.47 |
ENSRNOT00000012454
|
Knstrn
|
kinetochore-localized astrin/SPAG5 binding protein |
| chr3_+_149606940 | 36.65 |
ENSRNOT00000018512
|
Bpifa3
|
BPI fold containing family A, member 3 |
| chr2_+_127538659 | 35.80 |
ENSRNOT00000093483
ENSRNOT00000058476 |
Slc25a31
|
solute carrier family 25 member 31 |
| chr4_-_157798868 | 35.79 |
ENSRNOT00000044425
|
Tuba3b
|
tubulin, alpha 3B |
| chr7_+_13013541 | 35.71 |
ENSRNOT00000042792
ENSRNOT00000010549 |
Theg
|
theg spermatid protein |
| chr10_+_111031414 | 35.44 |
ENSRNOT00000074372
|
Ptchd3
|
patched domain containing 3 |
| chr3_-_103745236 | 35.22 |
ENSRNOT00000006876
|
Nutm1
|
NUT midline carcinoma, family member 1 |
| chr7_+_129595192 | 34.54 |
ENSRNOT00000071151
|
Zdhhc25
|
zinc finger, DHHC-type containing 25 |
| chr20_-_44220702 | 33.98 |
ENSRNOT00000036853
|
Fam229b
|
family with sequence similarity 229, member B |
| chr4_+_59365399 | 33.65 |
ENSRNOT00000034929
|
LOC689042
|
hypothetical protein LOC689042 |
| chr16_+_20121352 | 33.32 |
ENSRNOT00000025347
|
Insl3
|
insulin-like 3 |
| chr7_+_117420788 | 33.23 |
ENSRNOT00000049198
|
Wdr97
|
WD repeat domain 97 |
| chr10_+_31074251 | 33.22 |
ENSRNOT00000007978
|
Sox30
|
SRY box 30 |
| chr10_-_17721233 | 32.87 |
ENSRNOT00000031337
|
Smim23
|
small integral membrane protein 23 |
| chr10_+_88620655 | 32.41 |
ENSRNOT00000055248
|
Hspb9
|
heat shock protein family B (small) member 9 |
| chr2_+_92574038 | 32.35 |
ENSRNOT00000089422
|
tGap1
|
GTPase activating protein testicular GAP1 |
| chr19_+_880024 | 31.96 |
ENSRNOT00000061648
|
Cmtm2a
|
CKLF-like MARVEL transmembrane domain containing 2A |
| chr2_+_208323882 | 31.69 |
ENSRNOT00000085178
|
Tmigd3
|
transmembrane and immunoglobulin domain containing 3 |
| chr2_-_188689392 | 31.49 |
ENSRNOT00000027986
|
Dcst1
|
DC-STAMP domain containing 1 |
| chr2_-_127778202 | 31.37 |
ENSRNOT00000092191
ENSRNOT00000093683 |
LOC365778
|
similar to RIKEN cDNA 1700034I23 |
| chr16_+_72010106 | 31.30 |
ENSRNOT00000058330
|
Adam5
|
ADAM metallopeptidase domain 5 |
| chr5_+_135029955 | 31.01 |
ENSRNOT00000074860
|
LOC100911669
|
uncharacterized LOC100911669 |
| chr7_-_126701872 | 30.98 |
ENSRNOT00000041057
|
Pkdrej
|
polycystin (PKD) family receptor for egg jelly |
| chr14_-_77321977 | 30.94 |
ENSRNOT00000084093
|
Lyar
|
Ly1 antibody reactive |
| chr2_+_208541361 | 30.86 |
ENSRNOT00000021288
|
Tmigd3
|
transmembrane and immunoglobulin domain containing 3 |
| chr1_-_91526570 | 30.71 |
ENSRNOT00000056583
|
Wdr88
|
WD repeat domain 88 |
| chr8_-_62616828 | 30.50 |
ENSRNOT00000068340
|
Arid3b
|
AT-rich interaction domain 3B |
| chr7_+_91588458 | 30.49 |
ENSRNOT00000006257
|
Aard
|
alanine and arginine rich domain containing protein |
| chr1_-_89045586 | 30.20 |
ENSRNOT00000063808
|
Zbtb32
|
zinc finger and BTB domain containing 32 |
| chr10_-_84976170 | 29.95 |
ENSRNOT00000013542
|
Lrrc46
|
leucine rich repeat containing 46 |
| chr14_-_77321783 | 29.29 |
ENSRNOT00000007154
|
Lyar
|
Ly1 antibody reactive |
| chr1_-_222182721 | 28.91 |
ENSRNOT00000078008
|
Tex40
|
testis expressed 40 |
| chr14_+_85814824 | 28.79 |
ENSRNOT00000090046
ENSRNOT00000083756 |
Ankrd36
|
ankyrin repeat domain 36 |
| chr13_+_105408179 | 28.69 |
ENSRNOT00000003378
|
Ddx3y
|
DEAD (Asp-Glu-Ala-Asp) box helicase 3, Y-linked |
| chr6_+_84293402 | 28.52 |
ENSRNOT00000072657
|
LOC108351365
|
uncharacterized LOC108351365 |
| chr1_+_53531947 | 28.13 |
ENSRNOT00000077340
|
Tcp10b
|
t-complex protein 10b |
| chr4_-_155631856 | 28.04 |
ENSRNOT00000088270
|
Slc2a3
|
solute carrier family 2 member 3 |
| chr1_-_169321075 | 27.47 |
ENSRNOT00000055216
|
RGD1562433
|
similar to ubiquilin 1 isoform 2 |
| chr4_+_174181644 | 27.35 |
ENSRNOT00000011555
|
Capza3
|
capping actin protein of muscle Z-line alpha subunit 3 |
| chr8_-_96547568 | 27.22 |
ENSRNOT00000078343
|
RGD1560775
|
similar to RIKEN cDNA 4930579C12 gene |
| chrX_+_32495809 | 27.18 |
ENSRNOT00000020999
|
RGD1565844
|
similar to RIKEN cDNA 1700045I19 |
| chr1_+_243662823 | 27.16 |
ENSRNOT00000067372
|
Dmrt2
|
doublesex and mab-3 related transcription factor 2 |
| chr14_-_3359300 | 26.92 |
ENSRNOT00000080875
|
Lpcat2b
|
lysophosphatidylcholine acyltransferase 2b |
| chr5_-_142933526 | 26.86 |
ENSRNOT00000048293
|
Cdca8
|
cell division cycle associated 8 |
| chr9_-_114282799 | 26.77 |
ENSRNOT00000090539
|
LOC102555328
|
uncharacterized LOC102555328 |
| chr1_-_169344306 | 26.48 |
ENSRNOT00000022852
|
Ubqlnl
|
ubiquilin-like |
| chr9_+_64898459 | 26.30 |
ENSRNOT00000029526
|
Sgo2
|
shugoshin 2 |
| chr14_+_85871597 | 26.23 |
ENSRNOT00000079671
|
Ankrd36
|
ankyrin repeat domain 36 |
| chr7_-_20118466 | 26.02 |
ENSRNOT00000080523
|
RGD1565071
|
similar to hypothetical protein 4930509O22 |
| chr10_-_36716601 | 26.02 |
ENSRNOT00000038838
|
LOC497899
|
similar to hypothetical protein 4930503F14 |
| chrX_+_13989401 | 26.00 |
ENSRNOT00000004790
|
Hypm
|
huntingtin interacting protein M |
| chr5_+_122508388 | 25.95 |
ENSRNOT00000038410
|
Tctex1d1
|
Tctex1 domain containing 1 |
| chrX_-_61029298 | 25.91 |
ENSRNOT00000043817
|
MGC114483
|
similar to MAGEB3 |
| chr16_-_21338771 | 25.78 |
ENSRNOT00000014265
|
Pbx4
|
PBX homeobox 4 |
| chr1_+_99447561 | 25.73 |
ENSRNOT00000070899
ENSRNOT00000073798 |
Izumo2
|
IZUMO family member 2 |
| chr4_-_23718047 | 25.68 |
ENSRNOT00000011359
|
RGD1564345
|
similar to RIKEN cDNA 4921511H03 |
| chr8_-_117353672 | 25.67 |
ENSRNOT00000027262
|
Ndufaf3
|
NADH:ubiquinone oxidoreductase complex assembly factor 3 |
| chr4_+_96831880 | 25.63 |
ENSRNOT00000068400
|
RSA-14-44
|
RSA-14-44 protein |
| chr7_+_129973480 | 25.61 |
ENSRNOT00000050620
ENSRNOT00000042686 |
Mov10l1
|
Mov10 RISC complex RNA helicase like 1 |
| chr15_-_44411004 | 25.54 |
ENSRNOT00000031163
|
Cdca2
|
cell division cycle associated 2 |
| chr3_-_151548995 | 25.38 |
ENSRNOT00000071825
|
LOC102550306
|
uncharacterized LOC102550306 |
| chr3_+_81294275 | 25.25 |
ENSRNOT00000009068
|
RGD1563263
|
similar to RIKEN cDNA 1700029I15 |
| chr1_-_205630073 | 25.22 |
ENSRNOT00000037064
|
Tex36
|
testis expressed 36 |
| chrX_+_16337102 | 25.15 |
ENSRNOT00000003954
|
Ccnb3
|
cyclin B3 |
| chr18_-_40452456 | 24.89 |
ENSRNOT00000004747
|
Mospd4
|
motile sperm domain containing 4 |
| chr10_+_68232094 | 24.81 |
ENSRNOT00000009172
|
Spaca3
|
sperm acrosome associated 3 |
| chr18_+_45023932 | 24.67 |
ENSRNOT00000039379
|
Fam170a
|
family with sequence similarity 170, member A |
| chr8_+_117170620 | 24.58 |
ENSRNOT00000075271
|
LOC498675
|
hypothetical LOC498675 |
| chr1_+_267689328 | 24.57 |
ENSRNOT00000077738
|
Cfap58
|
cilia and flagella associated protein 58 |
| chr1_-_205669760 | 24.57 |
ENSRNOT00000086703
|
Tex36
|
testis expressed 36 |
| chr1_+_146976975 | 24.53 |
ENSRNOT00000071895
|
LOC100366231
|
X-linked lymphocyte-regulated 5C-like |
| chr4_+_157348020 | 24.39 |
ENSRNOT00000020803
|
Cdca3
|
cell division cycle associated 3 |
| chr2_+_92549479 | 24.24 |
ENSRNOT00000082912
|
tGap1
|
GTPase activating protein testicular GAP1 |
| chr6_-_26281300 | 24.06 |
ENSRNOT00000078750
|
RGD1560110
|
similar to RIKEN cDNA 4930548H24 |
| chr17_+_14516566 | 23.96 |
ENSRNOT00000060660
ENSRNOT00000071469 |
LOC689569
|
similar to vitamin A-deficient testicular protein 11-like |
| chr16_+_51730452 | 23.94 |
ENSRNOT00000078614
|
Adam34l
|
a disintegrin and metalloprotease domain 34-like |
| chr7_-_75098331 | 23.79 |
ENSRNOT00000013344
|
Rnf19a
|
ring finger protein 19A, RBR E3 ubiquitin protein ligase |
| chr2_-_173542284 | 23.61 |
ENSRNOT00000013111
|
Zbbx
|
zinc finger, B-box domain containing |
| chr9_-_32868371 | 23.47 |
ENSRNOT00000038369
|
LOC689725
|
similar to chromosome 9 open reading frame 79 |
| chr2_-_137404996 | 23.45 |
ENSRNOT00000090907
|
LOC365791
|
similar to T-cell activation Rho GTPase-activating protein isoform b |
| chr7_+_130542202 | 23.30 |
ENSRNOT00000079501
ENSRNOT00000045647 |
Acr
|
acrosin |
| chr20_-_36061477 | 23.13 |
ENSRNOT00000038249
|
RGD1559810
|
similar to hypothetical protein |
| chr1_+_189969336 | 23.01 |
ENSRNOT00000073255
ENSRNOT00000071302 ENSRNOT00000055063 |
Abca14
|
ATP-binding cassette, subfamily A (ABC1), member 14 |
| chr3_+_176985900 | 22.99 |
ENSRNOT00000020210
|
Abhd16b
|
abhydrolase domain containing 16B |
| chr8_-_50608363 | 22.90 |
ENSRNOT00000059386
|
LOC500990
|
similar to RIKEN cDNA 4931429L15 |
| chr1_-_87155118 | 22.83 |
ENSRNOT00000072441
|
AABR07002854.1
|
|
| chrX_+_45965301 | 22.60 |
ENSRNOT00000005141
|
Fam47a
|
family with sequence similarity 47, member A |
| chr16_+_39145230 | 22.58 |
ENSRNOT00000092942
|
Adam21
|
ADAM metallopeptidase domain 21 |
| chr13_+_51936954 | 22.51 |
ENSRNOT00000087794
|
AABR07020994.1
|
|
| chr1_-_54854353 | 22.49 |
ENSRNOT00000072895
|
Smok2a
|
sperm motility kinase 2A |
| chr9_-_104718978 | 22.47 |
ENSRNOT00000077480
ENSRNOT00000077596 |
Slco6c1
|
solute carrier organic anion transporter family, member 6c1 |
| chr7_+_40316639 | 22.30 |
ENSRNOT00000080150
|
LOC500827
|
similar to hypothetical protein FLJ35821 |
| chr5_+_121308240 | 22.21 |
ENSRNOT00000072148
|
AABR07049437.1
|
|
| chr8_-_25829569 | 22.12 |
ENSRNOT00000071884
|
Dpy19l2
|
dpy-19 like 2 |
| chr2_+_112281376 | 22.02 |
ENSRNOT00000035263
|
Spata16
|
spermatogenesis associated 16 |
| chr4_-_27426179 | 21.72 |
ENSRNOT00000032529
|
Lrrd1
|
leucine-rich repeats and death domain containing 1 |
| chr5_+_69809495 | 21.69 |
ENSRNOT00000059828
|
Nipsnap3a
|
nipsnap homolog 3A (C. elegans) |
| chr1_+_141488272 | 21.36 |
ENSRNOT00000034042
|
Wdr93
|
WD repeat domain 93 |
| chr10_-_56530842 | 21.23 |
ENSRNOT00000077451
|
AABR07029863.3
|
|
| chr9_-_104700609 | 21.23 |
ENSRNOT00000081815
ENSRNOT00000018503 |
Slco6c1
|
solute carrier organic anion transporter family, member 6c1 |
| chr8_+_48422036 | 21.10 |
ENSRNOT00000036051
|
Usp2
|
ubiquitin specific peptidase 2 |
| chr16_-_7336335 | 21.06 |
ENSRNOT00000044991
|
Phf7
|
PHD finger protein 7 |
| chr9_-_10427746 | 20.73 |
ENSRNOT00000071207
|
Catsperd
|
cation channel sperm associated auxiliary subunit delta |
| chr7_-_100382897 | 20.65 |
ENSRNOT00000006510
|
LOC500876
|
LOC500876 |
| chr4_+_121612332 | 20.49 |
ENSRNOT00000077374
ENSRNOT00000084494 |
Txnrd3
|
thioredoxin reductase 3 |
| chr9_+_14883296 | 20.34 |
ENSRNOT00000065800
|
RGD1565959
|
RGD1565959 |
| chrX_+_83570346 | 20.29 |
ENSRNOT00000045603
|
Ube2d4l1
|
ubiquitin-conjugating enzyme E2D 4 like 1 |
| chr2_-_30791221 | 20.27 |
ENSRNOT00000082846
|
Ccnb1
|
cyclin B1 |
| chr5_-_137265015 | 20.23 |
ENSRNOT00000036151
|
Cdc20
|
cell division cycle 20 |
| chr9_+_70310932 | 20.23 |
ENSRNOT00000088268
|
LOC103690541
|
uncharacterized LOC103690541 |
| chrX_-_51792597 | 20.22 |
ENSRNOT00000072727
|
LOC102549011
|
titin-like |
| chr1_+_82452469 | 20.19 |
ENSRNOT00000028026
|
Exosc5
|
exosome component 5 |
| chr1_-_82952936 | 20.15 |
ENSRNOT00000075546
|
RGD1565655
|
similar to BC049730 protein |
| chr1_-_47213749 | 20.10 |
ENSRNOT00000024656
|
Dynlt1
|
dynein light chain Tctex-type 1 |
| chr6_-_111267734 | 20.06 |
ENSRNOT00000074037
|
Noxred1
|
NADP-dependent oxidoreductase domain containing 1 |
| chr5_-_32956159 | 19.82 |
ENSRNOT00000078264
|
Cnbd1
|
cyclic nucleotide binding domain containing 1 |
| chr7_+_25832521 | 19.81 |
ENSRNOT00000084955
|
Rfx4
|
regulatory factor X4 |
| chr1_-_263959318 | 19.72 |
ENSRNOT00000068007
|
Pkd2l1
|
polycystin 2 like 1, transient receptor potential cation channel |
| chr17_-_89683480 | 19.71 |
ENSRNOT00000052342
|
Potec
|
POTE ankyrin domain family, member C |
| chr17_-_89780691 | 19.50 |
ENSRNOT00000091830
|
LOC108348042
|
ankyrin repeat domain-containing protein 7-like |
| chr7_+_143092511 | 19.49 |
ENSRNOT00000084223
|
RGD1305207
|
similar to RIKEN cDNA 1700011A15 |
| chr3_+_124545364 | 19.48 |
ENSRNOT00000050900
|
Prnd
|
prion protein 2 (dublet) |
| chr15_+_5319916 | 19.40 |
ENSRNOT00000046644
|
LOC102546495
|
disks large homolog 5-like |
| chr11_+_64488194 | 19.27 |
ENSRNOT00000030268
|
RGD1306995
|
similar to hypothetical protein FLJ32859 |
| chr2_-_155176260 | 19.11 |
ENSRNOT00000071864
|
AABR07010919.1
|
|
| chr7_+_20462081 | 19.09 |
ENSRNOT00000088383
|
AABR07056131.1
|
|
| chr9_+_12472372 | 19.08 |
ENSRNOT00000061476
ENSRNOT00000050485 |
LOC100912293
|
uncharacterized LOC100912293 |
| chrX_+_23414354 | 19.08 |
ENSRNOT00000031235
|
Cldn34a
|
claudin 34A |
| chr7_-_136853957 | 19.08 |
ENSRNOT00000008985
|
Nell2
|
neural EGFL like 2 |
| chr9_-_464390 | 19.05 |
ENSRNOT00000051066
|
LOC302192
|
similar to RIKEN cDNA 1700001E04 |
| chr9_-_78369031 | 18.98 |
ENSRNOT00000087870
|
Bard1
|
BRCA1 associated RING domain 1 |
| chr1_-_67284864 | 18.87 |
ENSRNOT00000082908
|
LOC691661
|
similar to zinc finger and SCAN domain containing 4 |
| chr20_+_4188766 | 18.80 |
ENSRNOT00000081438
ENSRNOT00000060378 |
Tesb
|
testis specific basic protein |
| chr1_+_85112247 | 18.73 |
ENSRNOT00000087157
|
Dyrk1b
|
dual specificity tyrosine phosphorylation regulated kinase 1B |
| chr4_-_45414177 | 18.73 |
ENSRNOT00000091311
|
Asz1
|
ankyrin repeat, SAM and basic leucine zipper domain containing 1 |
| chr1_-_101664436 | 18.63 |
ENSRNOT00000028522
|
Sec1
|
secretory blood group 1 |
| chr1_+_248195797 | 18.57 |
ENSRNOT00000066891
|
LOC103690131
|
tumor protein D55-like |
| chrX_-_135761025 | 18.56 |
ENSRNOT00000033044
|
RGD1564955
|
similar to fibrous sheath interacting protein 2 |
| chr1_-_84834039 | 18.53 |
ENSRNOT00000088960
|
AABR07002782.1
|
|
| chr2_+_195665454 | 18.32 |
ENSRNOT00000081335
|
Tdrkh
|
tudor and KH domain containing |
| chr4_-_145555748 | 18.21 |
ENSRNOT00000013503
|
Fancd2os
|
FANCD2 opposite strand |
| chr1_-_264294630 | 18.18 |
ENSRNOT00000035758
|
Sec31b
|
SEC31 homolog B, COPII coat complex component |
| chr8_+_117660964 | 18.17 |
ENSRNOT00000049240
|
Tmem89
|
transmembrane protein 89 |
| chr9_-_63291350 | 18.15 |
ENSRNOT00000058831
|
Hsfy2
|
heat shock transcription factor, Y linked 2 |
| chr14_-_43143973 | 17.98 |
ENSRNOT00000003248
|
Uchl1
|
ubiquitin C-terminal hydrolase L1 |
| chr4_-_26255639 | 17.71 |
ENSRNOT00000031118
|
AC126960.1
|
|
| chr10_+_39666991 | 17.70 |
ENSRNOT00000030760
|
Acsl6
|
acyl-CoA synthetase long-chain family member 6 |
| chr9_-_50820290 | 17.69 |
ENSRNOT00000050748
|
LOC102548013
|
uncharacterized LOC102548013 |
| chr10_+_83954279 | 17.51 |
ENSRNOT00000006594
|
Ttll6
|
tubulin tyrosine ligase like 6 |
| chrX_+_105239620 | 17.39 |
ENSRNOT00000085693
|
Drp2
|
dystrophin related protein 2 |
| chr16_+_12510827 | 17.37 |
ENSRNOT00000077763
|
AABR07024716.1
|
|
| chr1_-_271275989 | 17.31 |
ENSRNOT00000075570
|
LOC100912218
|
inositol 1,4,5-trisphosphate receptor-interacting protein-like |
| chr14_-_3462629 | 17.25 |
ENSRNOT00000061538
|
Brdt
|
bromodomain testis associated |
| chr5_-_152406447 | 17.23 |
ENSRNOT00000065983
ENSRNOT00000078063 |
Cep85
|
centrosomal protein 85 |
| chr9_-_70450170 | 17.22 |
ENSRNOT00000017207
|
Mdh1b
|
malate dehydrogenase 1B |
| chr1_+_171274305 | 16.97 |
ENSRNOT00000051038
|
Olr234
|
olfactory receptor 234 |
| chr1_+_220096422 | 16.78 |
ENSRNOT00000034771
|
Ccdc87
|
coiled-coil domain containing 87 |
| chr3_+_148327965 | 16.71 |
ENSRNOT00000010851
ENSRNOT00000088481 |
Tpx2
|
TPX2, microtubule nucleation factor |
| chr5_-_24926904 | 16.64 |
ENSRNOT00000075288
|
AABR07047232.1
|
|
| chr2_+_242882306 | 16.58 |
ENSRNOT00000013661
|
Ddit4l
|
DNA-damage-inducible transcript 4-like |
| chrX_-_107614632 | 16.52 |
ENSRNOT00000057140
|
Tmsbl1
|
thymosin beta-like protein 1 |
| chr8_+_116715755 | 16.45 |
ENSRNOT00000090239
|
Camkv
|
CaM kinase-like vesicle-associated |
| chr2_+_127845034 | 16.43 |
ENSRNOT00000044804
|
Larp1b
|
La ribonucleoprotein domain family, member 1B |
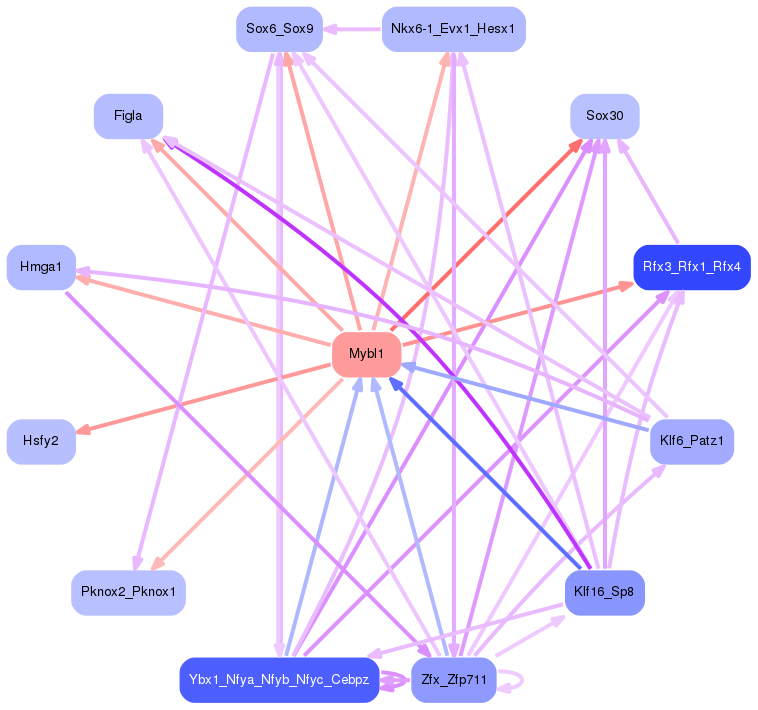
Network of associatons between targets according to the STRING database.

First level regulatory network of Mybl1
Gene Ontology Analysis
Gene overrepresentation in biological process category:
| Log-likelihood per target | Total log-likelihood | Term | Description |
|---|---|---|---|
| 15.1 | 45.4 | GO:0046167 | glycerol-3-phosphate biosynthetic process(GO:0046167) |
| 13.3 | 39.8 | GO:0019244 | lactate biosynthetic process from pyruvate(GO:0019244) |
| 12.0 | 12.0 | GO:1900195 | positive regulation of oocyte maturation(GO:1900195) |
| 10.1 | 40.5 | GO:1901896 | positive regulation of calcium-transporting ATPase activity(GO:1901896) |
| 8.8 | 26.3 | GO:0070602 | regulation of centromeric sister chromatid cohesion(GO:0070602) |
| 8.5 | 25.6 | GO:0097498 | endothelial tube lumen extension(GO:0097498) |
| 8.0 | 32.0 | GO:2000224 | regulation of testosterone biosynthetic process(GO:2000224) |
| 8.0 | 8.0 | GO:2000195 | negative regulation of female gonad development(GO:2000195) |
| 7.3 | 123.5 | GO:0034587 | piRNA metabolic process(GO:0034587) |
| 7.2 | 42.9 | GO:0030951 | establishment or maintenance of microtubule cytoskeleton polarity(GO:0030951) |
| 6.8 | 27.2 | GO:0061055 | myotome development(GO:0061055) |
| 5.9 | 17.7 | GO:0010747 | positive regulation of plasma membrane long-chain fatty acid transport(GO:0010747) |
| 5.7 | 17.2 | GO:0051037 | regulation of transcription involved in meiotic cell cycle(GO:0051037) |
| 5.3 | 32.0 | GO:0051987 | positive regulation of attachment of spindle microtubules to kinetochore(GO:0051987) |
| 5.3 | 21.1 | GO:0036353 | histone H2A-K119 monoubiquitination(GO:0036353) |
| 5.0 | 20.1 | GO:0019060 | intracellular transport of viral protein in host cell(GO:0019060) symbiont intracellular protein transport in host(GO:0030581) intracellular protein transport in other organism involved in symbiotic interaction(GO:0051708) |
| 4.9 | 14.8 | GO:1904882 | telomerase catalytic core complex assembly(GO:1904868) regulation of telomerase catalytic core complex assembly(GO:1904882) positive regulation of telomerase catalytic core complex assembly(GO:1904884) |
| 4.9 | 14.7 | GO:0009751 | response to salicylic acid(GO:0009751) |
| 4.8 | 28.7 | GO:0045006 | DNA deamination(GO:0045006) |
| 4.7 | 14.1 | GO:1990167 | protein K27-linked deubiquitination(GO:1990167) protein K33-linked deubiquitination(GO:1990168) |
| 4.5 | 18.0 | GO:2000124 | regulation of endocannabinoid signaling pathway(GO:2000124) |
| 4.4 | 8.9 | GO:0042197 | chlorinated hydrocarbon metabolic process(GO:0042196) halogenated hydrocarbon metabolic process(GO:0042197) |
| 4.4 | 17.6 | GO:0018317 | protein C-linked glycosylation(GO:0018103) peptidyl-tryptophan modification(GO:0018211) protein C-linked glycosylation via tryptophan(GO:0018317) protein C-linked glycosylation via 2'-alpha-mannosyl-L-tryptophan(GO:0018406) |
| 4.1 | 73.3 | GO:0035404 | histone-serine phosphorylation(GO:0035404) |
| 4.0 | 12.1 | GO:0001545 | primary ovarian follicle growth(GO:0001545) |
| 4.0 | 157.0 | GO:0035036 | sperm-egg recognition(GO:0035036) |
| 4.0 | 19.8 | GO:0021914 | negative regulation of smoothened signaling pathway involved in ventral spinal cord patterning(GO:0021914) |
| 3.9 | 11.8 | GO:0002149 | hypochlorous acid metabolic process(GO:0002148) hypochlorous acid biosynthetic process(GO:0002149) |
| 3.8 | 15.4 | GO:0035519 | protein K29-linked ubiquitination(GO:0035519) |
| 3.7 | 37.5 | GO:0051988 | regulation of attachment of spindle microtubules to kinetochore(GO:0051988) |
| 3.7 | 11.2 | GO:0090579 | transcriptional activation by promoter-enhancer looping(GO:0071733) regulation of estrogen receptor binding(GO:0071898) negative regulation of estrogen receptor binding(GO:0071899) gene looping(GO:0090202) dsDNA loop formation(GO:0090579) |
| 3.6 | 14.6 | GO:0051106 | regulation of DNA ligation(GO:0051105) positive regulation of DNA ligation(GO:0051106) |
| 3.6 | 10.8 | GO:0030382 | sperm mitochondrion organization(GO:0030382) |
| 3.5 | 3.5 | GO:0090666 | scaRNA localization to Cajal body(GO:0090666) |
| 3.5 | 46.0 | GO:0098719 | sodium ion import across plasma membrane(GO:0098719) sodium ion import into cell(GO:1990118) |
| 3.5 | 10.6 | GO:0035986 | senescence-associated heterochromatin focus assembly(GO:0035986) |
| 3.4 | 13.7 | GO:0009223 | pyrimidine deoxyribonucleotide catabolic process(GO:0009223) |
| 3.4 | 23.9 | GO:0098535 | de novo centriole assembly(GO:0098535) |
| 3.4 | 20.2 | GO:1904668 | positive regulation of ubiquitin protein ligase activity(GO:1904668) |
| 3.2 | 6.4 | GO:0046601 | positive regulation of centriole replication(GO:0046601) |
| 3.2 | 12.6 | GO:2000525 | regulation of T cell costimulation(GO:2000523) positive regulation of T cell costimulation(GO:2000525) |
| 3.1 | 28.2 | GO:0048387 | negative regulation of retinoic acid receptor signaling pathway(GO:0048387) |
| 3.1 | 15.6 | GO:0046602 | regulation of mitotic centrosome separation(GO:0046602) |
| 2.9 | 5.9 | GO:0061184 | positive regulation of dermatome development(GO:0061184) |
| 2.9 | 37.4 | GO:0045199 | maintenance of epithelial cell apical/basal polarity(GO:0045199) |
| 2.8 | 19.7 | GO:0050915 | sensory perception of sour taste(GO:0050915) |
| 2.8 | 28.0 | GO:0070837 | dehydroascorbic acid transport(GO:0070837) |
| 2.8 | 33.3 | GO:2000018 | regulation of male gonad development(GO:2000018) |
| 2.7 | 68.4 | GO:0048240 | sperm capacitation(GO:0048240) |
| 2.7 | 8.2 | GO:0036112 | medium-chain fatty-acyl-CoA metabolic process(GO:0036112) fatty-acyl-CoA catabolic process(GO:0036115) |
| 2.7 | 8.2 | GO:0032053 | ciliary basal body organization(GO:0032053) |
| 2.7 | 13.4 | GO:2000741 | positive regulation of mesenchymal stem cell differentiation(GO:2000741) |
| 2.6 | 29.0 | GO:1902570 | protein localization to nucleolus(GO:1902570) |
| 2.6 | 12.9 | GO:0031536 | positive regulation of exit from mitosis(GO:0031536) response to stem cell factor(GO:0036215) cellular response to stem cell factor stimulus(GO:0036216) |
| 2.5 | 10.1 | GO:0021730 | trigeminal sensory nucleus development(GO:0021730) principal sensory nucleus of trigeminal nerve development(GO:0021740) |
| 2.5 | 10.1 | GO:0090521 | glomerular visceral epithelial cell migration(GO:0090521) |
| 2.5 | 7.6 | GO:0007181 | transforming growth factor beta receptor complex assembly(GO:0007181) |
| 2.5 | 7.4 | GO:0002143 | tRNA wobble position uridine thiolation(GO:0002143) |
| 2.4 | 7.2 | GO:1904100 | regulation of protein O-linked glycosylation(GO:1904098) positive regulation of protein O-linked glycosylation(GO:1904100) |
| 2.4 | 16.6 | GO:0019896 | axonal transport of mitochondrion(GO:0019896) |
| 2.4 | 19.0 | GO:0085020 | protein K6-linked ubiquitination(GO:0085020) |
| 2.3 | 6.9 | GO:1902303 | negative regulation of potassium ion export(GO:1902303) |
| 2.2 | 29.1 | GO:0051013 | microtubule severing(GO:0051013) |
| 2.2 | 8.9 | GO:0070537 | histone H2A K63-linked deubiquitination(GO:0070537) |
| 2.2 | 8.8 | GO:1903288 | positive regulation of potassium ion import(GO:1903288) |
| 2.1 | 6.4 | GO:0060060 | photoreceptor cell morphogenesis(GO:0008594) post-embryonic retina morphogenesis in camera-type eye(GO:0060060) |
| 2.1 | 10.6 | GO:0035617 | stress granule disassembly(GO:0035617) |
| 2.1 | 2.1 | GO:0000973 | posttranscriptional tethering of RNA polymerase II gene DNA at nuclear periphery(GO:0000973) |
| 2.1 | 10.6 | GO:0070318 | positive regulation of G0 to G1 transition(GO:0070318) |
| 2.1 | 4.2 | GO:0010993 | regulation of ubiquitin homeostasis(GO:0010993) free ubiquitin chain polymerization(GO:0010994) |
| 2.1 | 8.4 | GO:0044211 | CTP salvage(GO:0044211) |
| 2.1 | 6.3 | GO:0006059 | hexitol metabolic process(GO:0006059) |
| 2.1 | 16.5 | GO:0042989 | sequestering of actin monomers(GO:0042989) |
| 2.1 | 59.5 | GO:0044458 | motile cilium assembly(GO:0044458) |
| 1.8 | 5.5 | GO:0090427 | activation of meiosis(GO:0090427) |
| 1.8 | 5.3 | GO:0045065 | cytotoxic T cell differentiation(GO:0045065) |
| 1.7 | 8.6 | GO:0001552 | ovarian follicle atresia(GO:0001552) |
| 1.7 | 8.5 | GO:0016557 | peroxisome membrane biogenesis(GO:0016557) |
| 1.7 | 6.8 | GO:0097680 | double-strand break repair via classical nonhomologous end joining(GO:0097680) |
| 1.7 | 10.1 | GO:0010792 | DNA double-strand break processing involved in repair via single-strand annealing(GO:0010792) |
| 1.7 | 16.7 | GO:0060236 | regulation of mitotic spindle organization(GO:0060236) |
| 1.7 | 10.0 | GO:2000623 | regulation of nuclear-transcribed mRNA catabolic process, nonsense-mediated decay(GO:2000622) negative regulation of nuclear-transcribed mRNA catabolic process, nonsense-mediated decay(GO:2000623) |
| 1.6 | 4.9 | GO:1903378 | positive regulation of oxidative stress-induced neuron intrinsic apoptotic signaling pathway(GO:1903378) |
| 1.6 | 4.9 | GO:0032916 | positive regulation of transforming growth factor beta3 production(GO:0032916) |
| 1.6 | 71.8 | GO:0051310 | metaphase plate congression(GO:0051310) |
| 1.6 | 11.3 | GO:0006868 | glutamine transport(GO:0006868) |
| 1.6 | 4.8 | GO:0046833 | positive regulation of RNA export from nucleus(GO:0046833) |
| 1.6 | 4.8 | GO:0071922 | establishment of sister chromatid cohesion(GO:0034085) cohesin loading(GO:0071921) regulation of cohesin loading(GO:0071922) |
| 1.6 | 17.3 | GO:0033523 | histone H2B ubiquitination(GO:0033523) |
| 1.6 | 4.7 | GO:0072137 | condensed mesenchymal cell proliferation(GO:0072137) |
| 1.5 | 12.4 | GO:0017062 | respiratory chain complex III assembly(GO:0017062) mitochondrial respiratory chain complex III assembly(GO:0034551) |
| 1.5 | 12.2 | GO:0008635 | activation of cysteine-type endopeptidase activity involved in apoptotic process by cytochrome c(GO:0008635) |
| 1.5 | 7.6 | GO:0009115 | xanthine catabolic process(GO:0009115) |
| 1.5 | 4.5 | GO:0061197 | fungiform papilla morphogenesis(GO:0061197) fungiform papilla formation(GO:0061198) |
| 1.5 | 31.0 | GO:0060046 | regulation of acrosome reaction(GO:0060046) |
| 1.5 | 7.4 | GO:0050955 | thermoception(GO:0050955) |
| 1.4 | 14.4 | GO:0051292 | nuclear pore complex assembly(GO:0051292) |
| 1.4 | 7.2 | GO:1901509 | regulation of endothelial tube morphogenesis(GO:1901509) |
| 1.4 | 17.2 | GO:0006108 | malate metabolic process(GO:0006108) |
| 1.4 | 15.6 | GO:0006013 | mannose metabolic process(GO:0006013) |
| 1.4 | 4.2 | GO:0042539 | hypotonic salinity response(GO:0042539) cellular hypotonic salinity response(GO:0071477) |
| 1.4 | 6.9 | GO:0048386 | positive regulation of retinoic acid receptor signaling pathway(GO:0048386) |
| 1.4 | 5.5 | GO:1902534 | single-organism membrane invagination(GO:1902534) |
| 1.3 | 21.1 | GO:0048642 | negative regulation of skeletal muscle tissue development(GO:0048642) |
| 1.3 | 11.8 | GO:0045136 | development of secondary sexual characteristics(GO:0045136) |
| 1.3 | 24.5 | GO:0097031 | NADH dehydrogenase complex assembly(GO:0010257) mitochondrial respiratory chain complex I assembly(GO:0032981) mitochondrial respiratory chain complex I biogenesis(GO:0097031) |
| 1.3 | 8.9 | GO:0046599 | regulation of centriole replication(GO:0046599) |
| 1.3 | 7.5 | GO:2000819 | regulation of nucleotide-excision repair(GO:2000819) |
| 1.2 | 7.4 | GO:0006681 | galactosylceramide metabolic process(GO:0006681) |
| 1.2 | 6.0 | GO:0035063 | nuclear speck organization(GO:0035063) |
| 1.2 | 8.5 | GO:0071787 | endoplasmic reticulum tubular network assembly(GO:0071787) |
| 1.2 | 8.4 | GO:0090084 | negative regulation of inclusion body assembly(GO:0090084) |
| 1.2 | 14.3 | GO:0010824 | regulation of centrosome duplication(GO:0010824) |
| 1.2 | 5.9 | GO:0018243 | protein O-linked glycosylation via serine(GO:0018242) protein O-linked glycosylation via threonine(GO:0018243) |
| 1.2 | 10.4 | GO:0075522 | IRES-dependent viral translational initiation(GO:0075522) |
| 1.2 | 16.2 | GO:0036065 | fucosylation(GO:0036065) |
| 1.1 | 8.0 | GO:0097428 | protein maturation by iron-sulfur cluster transfer(GO:0097428) |
| 1.1 | 3.4 | GO:0006788 | heme oxidation(GO:0006788) |
| 1.1 | 8.8 | GO:0006269 | DNA replication, synthesis of RNA primer(GO:0006269) |
| 1.1 | 2.1 | GO:0061153 | trachea submucosa development(GO:0061152) trachea gland development(GO:0061153) |
| 1.1 | 6.4 | GO:0043313 | regulation of neutrophil degranulation(GO:0043313) |
| 1.1 | 3.2 | GO:0009182 | purine deoxyribonucleoside diphosphate metabolic process(GO:0009182) dGDP metabolic process(GO:0046066) |
| 1.0 | 22.9 | GO:0051016 | barbed-end actin filament capping(GO:0051016) |
| 1.0 | 3.1 | GO:0060816 | random inactivation of X chromosome(GO:0060816) regulation of dosage compensation by inactivation of X chromosome(GO:1900095) |
| 1.0 | 2.1 | GO:0060830 | ciliary receptor clustering involved in smoothened signaling pathway(GO:0060830) |
| 1.0 | 5.1 | GO:0030309 | poly-N-acetyllactosamine metabolic process(GO:0030309) poly-N-acetyllactosamine biosynthetic process(GO:0030311) |
| 1.0 | 6.0 | GO:0006297 | base-excision repair, gap-filling(GO:0006287) nucleotide-excision repair, DNA gap filling(GO:0006297) |
| 1.0 | 4.0 | GO:1901911 | diadenosine polyphosphate catabolic process(GO:0015961) diphosphoinositol polyphosphate metabolic process(GO:0071543) diadenosine pentaphosphate metabolic process(GO:1901906) diadenosine pentaphosphate catabolic process(GO:1901907) diadenosine hexaphosphate metabolic process(GO:1901908) diadenosine hexaphosphate catabolic process(GO:1901909) adenosine 5'-(hexahydrogen pentaphosphate) metabolic process(GO:1901910) adenosine 5'-(hexahydrogen pentaphosphate) catabolic process(GO:1901911) |
| 1.0 | 3.0 | GO:0030091 | protein repair(GO:0030091) |
| 1.0 | 8.7 | GO:0031274 | positive regulation of pseudopodium assembly(GO:0031274) |
| 1.0 | 6.7 | GO:0070782 | phosphatidylserine exposure on apoptotic cell surface(GO:0070782) |
| 0.9 | 2.8 | GO:0071630 | nucleus-associated proteasomal ubiquitin-dependent protein catabolic process(GO:0071630) |
| 0.9 | 18.9 | GO:0032515 | negative regulation of phosphoprotein phosphatase activity(GO:0032515) |
| 0.9 | 12.2 | GO:0048630 | skeletal muscle tissue growth(GO:0048630) |
| 0.9 | 5.6 | GO:0070601 | centromeric sister chromatid cohesion(GO:0070601) |
| 0.9 | 8.4 | GO:0050957 | equilibrioception(GO:0050957) |
| 0.9 | 2.8 | GO:2000660 | negative regulation of chemokine biosynthetic process(GO:0045079) negative regulation of interleukin-1-mediated signaling pathway(GO:2000660) |
| 0.9 | 7.4 | GO:0010452 | histone H3-K36 methylation(GO:0010452) |
| 0.9 | 3.7 | GO:2000002 | negative regulation of DNA damage checkpoint(GO:2000002) |
| 0.9 | 6.4 | GO:0061086 | negative regulation of histone H3-K27 methylation(GO:0061086) |
| 0.9 | 12.8 | GO:0071157 | negative regulation of cell cycle arrest(GO:0071157) |
| 0.9 | 1.8 | GO:0048296 | isotype switching to IgA isotypes(GO:0048290) regulation of isotype switching to IgA isotypes(GO:0048296) positive regulation of isotype switching to IgA isotypes(GO:0048298) |
| 0.9 | 2.7 | GO:0002032 | desensitization of G-protein coupled receptor protein signaling pathway by arrestin(GO:0002032) |
| 0.9 | 4.5 | GO:1901026 | ripoptosome assembly(GO:0097343) ripoptosome assembly involved in necroptotic process(GO:1901026) |
| 0.9 | 12.6 | GO:0045820 | negative regulation of glycolytic process(GO:0045820) |
| 0.9 | 5.1 | GO:0030916 | otic vesicle formation(GO:0030916) |
| 0.8 | 2.5 | GO:0070946 | neutrophil mediated killing of gram-positive bacterium(GO:0070946) |
| 0.8 | 57.2 | GO:0006405 | RNA export from nucleus(GO:0006405) |
| 0.8 | 10.9 | GO:0009396 | folic acid-containing compound biosynthetic process(GO:0009396) |
| 0.8 | 12.5 | GO:0003376 | sphingosine-1-phosphate signaling pathway(GO:0003376) |
| 0.8 | 15.7 | GO:0046827 | positive regulation of protein export from nucleus(GO:0046827) |
| 0.8 | 5.8 | GO:0090650 | response to oxygen-glucose deprivation(GO:0090649) cellular response to oxygen-glucose deprivation(GO:0090650) |
| 0.8 | 10.5 | GO:0001675 | acrosome assembly(GO:0001675) |
| 0.8 | 8.0 | GO:0046958 | nonassociative learning(GO:0046958) |
| 0.8 | 6.4 | GO:0044828 | negative regulation by host of viral genome replication(GO:0044828) |
| 0.8 | 10.3 | GO:0048312 | intracellular distribution of mitochondria(GO:0048312) |
| 0.8 | 3.8 | GO:0034486 | vacuolar transmembrane transport(GO:0034486) chaperone-mediated protein transport involved in chaperone-mediated autophagy(GO:0061741) |
| 0.8 | 3.8 | GO:0072181 | mesonephric duct formation(GO:0072181) |
| 0.8 | 1.5 | GO:1903774 | positive regulation of viral budding via host ESCRT complex(GO:1903774) |
| 0.8 | 13.7 | GO:0071539 | protein localization to centrosome(GO:0071539) |
| 0.8 | 97.8 | GO:0009566 | fertilization(GO:0009566) |
| 0.8 | 5.3 | GO:0060770 | negative regulation of epithelial cell proliferation involved in prostate gland development(GO:0060770) |
| 0.7 | 2.2 | GO:0002380 | immunoglobulin secretion involved in immune response(GO:0002380) |
| 0.7 | 0.7 | GO:0006680 | glucosylceramide catabolic process(GO:0006680) |
| 0.7 | 4.3 | GO:0045003 | DNA recombinase assembly(GO:0000730) double-strand break repair via synthesis-dependent strand annealing(GO:0045003) |
| 0.7 | 9.4 | GO:0006003 | fructose 2,6-bisphosphate metabolic process(GO:0006003) |
| 0.7 | 2.2 | GO:0035022 | positive regulation of Rac protein signal transduction(GO:0035022) |
| 0.7 | 28.1 | GO:0010501 | RNA secondary structure unwinding(GO:0010501) |
| 0.7 | 9.1 | GO:0043374 | CD8-positive, alpha-beta T cell differentiation(GO:0043374) |
| 0.7 | 11.9 | GO:0007635 | chemosensory behavior(GO:0007635) |
| 0.7 | 7.6 | GO:0035562 | negative regulation of chromatin binding(GO:0035562) |
| 0.7 | 9.5 | GO:0036297 | interstrand cross-link repair(GO:0036297) |
| 0.7 | 2.0 | GO:0002465 | peripheral T cell tolerance induction(GO:0002458) peripheral tolerance induction(GO:0002465) negative regulation of interferon-gamma biosynthetic process(GO:0045077) |
| 0.7 | 1.3 | GO:0072076 | nephrogenic mesenchyme development(GO:0072076) |
| 0.7 | 6.5 | GO:0048280 | vesicle fusion with Golgi apparatus(GO:0048280) |
| 0.7 | 2.6 | GO:0010510 | regulation of acetyl-CoA biosynthetic process from pyruvate(GO:0010510) |
| 0.6 | 4.4 | GO:0048304 | positive regulation of isotype switching to IgG isotypes(GO:0048304) |
| 0.6 | 2.5 | GO:0000957 | mitochondrial RNA catabolic process(GO:0000957) regulation of mitochondrial RNA catabolic process(GO:0000960) |
| 0.6 | 1.8 | GO:0010070 | zygote asymmetric cell division(GO:0010070) |
| 0.6 | 3.6 | GO:0006398 | mRNA 3'-end processing by stem-loop binding and cleavage(GO:0006398) |
| 0.6 | 3.6 | GO:0035609 | C-terminal protein deglutamylation(GO:0035609) |
| 0.6 | 7.7 | GO:0001778 | plasma membrane repair(GO:0001778) |
| 0.6 | 3.5 | GO:0006751 | glutathione catabolic process(GO:0006751) |
| 0.6 | 15.5 | GO:0034723 | DNA replication-dependent nucleosome assembly(GO:0006335) DNA replication-dependent nucleosome organization(GO:0034723) |
| 0.6 | 246.4 | GO:0007283 | spermatogenesis(GO:0007283) |
| 0.6 | 2.8 | GO:0071104 | response to interleukin-9(GO:0071104) |
| 0.6 | 43.7 | GO:0006342 | chromatin silencing(GO:0006342) |
| 0.5 | 2.1 | GO:0002101 | tRNA wobble cytosine modification(GO:0002101) |
| 0.5 | 7.3 | GO:0034453 | microtubule anchoring(GO:0034453) |
| 0.5 | 1.6 | GO:0034696 | response to prostaglandin F(GO:0034696) |
| 0.5 | 30.7 | GO:0010389 | regulation of G2/M transition of mitotic cell cycle(GO:0010389) |
| 0.5 | 9.7 | GO:0000289 | nuclear-transcribed mRNA poly(A) tail shortening(GO:0000289) |
| 0.5 | 4.5 | GO:1901223 | negative regulation of NIK/NF-kappaB signaling(GO:1901223) |
| 0.5 | 21.9 | GO:0060612 | adipose tissue development(GO:0060612) |
| 0.5 | 15.1 | GO:0006611 | protein export from nucleus(GO:0006611) |
| 0.5 | 5.2 | GO:0006465 | signal peptide processing(GO:0006465) |
| 0.5 | 9.1 | GO:0099514 | anterograde synaptic vesicle transport(GO:0048490) synaptic vesicle cytoskeletal transport(GO:0099514) synaptic vesicle transport along microtubule(GO:0099517) |
| 0.4 | 2.7 | GO:1902902 | negative regulation of autophagosome assembly(GO:1902902) |
| 0.4 | 2.7 | GO:2000551 | negative regulation of T cell cytokine production(GO:0002725) regulation of T-helper 2 cell cytokine production(GO:2000551) |
| 0.4 | 16.9 | GO:0031023 | microtubule organizing center organization(GO:0031023) |
| 0.4 | 1.8 | GO:0060050 | positive regulation of protein glycosylation(GO:0060050) |
| 0.4 | 4.4 | GO:0048853 | forebrain morphogenesis(GO:0048853) |
| 0.4 | 1.3 | GO:0007468 | regulation of rhodopsin gene expression(GO:0007468) |
| 0.4 | 6.2 | GO:0031163 | iron-sulfur cluster assembly(GO:0016226) metallo-sulfur cluster assembly(GO:0031163) |
| 0.4 | 5.7 | GO:1900017 | positive regulation of cytokine production involved in inflammatory response(GO:1900017) |
| 0.4 | 6.1 | GO:0042407 | cristae formation(GO:0042407) |
| 0.4 | 5.6 | GO:0006880 | intracellular sequestering of iron ion(GO:0006880) sequestering of iron ion(GO:0097577) |
| 0.4 | 21.3 | GO:0035307 | positive regulation of protein dephosphorylation(GO:0035307) |
| 0.4 | 3.3 | GO:0061303 | cornea development in camera-type eye(GO:0061303) |
| 0.4 | 2.8 | GO:1900264 | regulation of DNA-directed DNA polymerase activity(GO:1900262) positive regulation of DNA-directed DNA polymerase activity(GO:1900264) |
| 0.4 | 8.4 | GO:0045662 | negative regulation of myoblast differentiation(GO:0045662) |
| 0.4 | 9.8 | GO:0042073 | intraciliary transport(GO:0042073) |
| 0.4 | 5.9 | GO:0002827 | positive regulation of T-helper 1 type immune response(GO:0002827) |
| 0.3 | 4.9 | GO:0006298 | mismatch repair(GO:0006298) |
| 0.3 | 4.5 | GO:0046069 | cGMP catabolic process(GO:0046069) |
| 0.3 | 6.6 | GO:0046597 | negative regulation of viral entry into host cell(GO:0046597) |
| 0.3 | 2.8 | GO:0018231 | peptidyl-L-cysteine S-palmitoylation(GO:0018230) peptidyl-S-diacylglycerol-L-cysteine biosynthetic process from peptidyl-cysteine(GO:0018231) |
| 0.3 | 1.6 | GO:0000454 | snoRNA guided rRNA pseudouridine synthesis(GO:0000454) |
| 0.3 | 5.2 | GO:0089711 | L-glutamate transmembrane transport(GO:0089711) |
| 0.3 | 2.2 | GO:0032525 | somite rostral/caudal axis specification(GO:0032525) |
| 0.3 | 0.9 | GO:0018924 | mandelate metabolic process(GO:0018924) |
| 0.3 | 1.2 | GO:0009449 | gamma-aminobutyric acid biosynthetic process(GO:0009449) |
| 0.3 | 13.0 | GO:0070972 | protein localization to endoplasmic reticulum(GO:0070972) |
| 0.3 | 5.2 | GO:0007398 | ectoderm development(GO:0007398) |
| 0.3 | 1.4 | GO:0043486 | histone exchange(GO:0043486) |
| 0.3 | 1.4 | GO:0060023 | hard palate development(GO:0060022) soft palate development(GO:0060023) |
| 0.3 | 3.0 | GO:0048711 | positive regulation of astrocyte differentiation(GO:0048711) |
| 0.3 | 1.4 | GO:0000733 | DNA strand renaturation(GO:0000733) |
| 0.3 | 1.4 | GO:0006222 | UMP biosynthetic process(GO:0006222) pyrimidine ribonucleoside monophosphate metabolic process(GO:0009173) pyrimidine ribonucleoside monophosphate biosynthetic process(GO:0009174) UMP metabolic process(GO:0046049) |
| 0.3 | 11.2 | GO:0051225 | spindle assembly(GO:0051225) |
| 0.3 | 0.5 | GO:0051792 | medium-chain fatty acid biosynthetic process(GO:0051792) |
| 0.3 | 1.0 | GO:1903003 | positive regulation of protein deubiquitination(GO:1903003) |
| 0.3 | 4.1 | GO:0007064 | mitotic sister chromatid cohesion(GO:0007064) |
| 0.3 | 1.3 | GO:1904528 | positive regulation of microtubule binding(GO:1904528) |
| 0.3 | 7.8 | GO:0000305 | response to oxygen radical(GO:0000305) |
| 0.2 | 0.7 | GO:1903070 | negative regulation of ER-associated ubiquitin-dependent protein catabolic process(GO:1903070) |
| 0.2 | 15.3 | GO:0006367 | transcription initiation from RNA polymerase II promoter(GO:0006367) |
| 0.2 | 2.1 | GO:0035865 | cellular response to potassium ion(GO:0035865) mitochondrial fragmentation involved in apoptotic process(GO:0043653) |
| 0.2 | 2.3 | GO:0060040 | retinal bipolar neuron differentiation(GO:0060040) |
| 0.2 | 3.0 | GO:0050832 | defense response to fungus(GO:0050832) |
| 0.2 | 8.9 | GO:2000401 | regulation of lymphocyte migration(GO:2000401) |
| 0.2 | 4.9 | GO:0032967 | positive regulation of collagen biosynthetic process(GO:0032967) |
| 0.2 | 3.9 | GO:0014870 | response to muscle inactivity(GO:0014870) |
| 0.2 | 7.9 | GO:0002548 | monocyte chemotaxis(GO:0002548) |
| 0.2 | 2.2 | GO:0090043 | tubulin deacetylation(GO:0090042) regulation of tubulin deacetylation(GO:0090043) |
| 0.2 | 3.5 | GO:0006878 | cellular copper ion homeostasis(GO:0006878) |
| 0.2 | 6.3 | GO:0033119 | negative regulation of RNA splicing(GO:0033119) |
| 0.2 | 3.2 | GO:0042149 | cellular response to glucose starvation(GO:0042149) |
| 0.2 | 1.2 | GO:2000609 | regulation of thyroid hormone generation(GO:2000609) |
| 0.2 | 3.1 | GO:0032958 | inositol phosphate biosynthetic process(GO:0032958) |
| 0.2 | 4.4 | GO:0045956 | positive regulation of calcium ion-dependent exocytosis(GO:0045956) |
| 0.2 | 11.6 | GO:0050852 | T cell receptor signaling pathway(GO:0050852) |
| 0.2 | 2.7 | GO:0051443 | positive regulation of ubiquitin-protein transferase activity(GO:0051443) |
| 0.2 | 0.6 | GO:0031053 | primary miRNA processing(GO:0031053) |
| 0.2 | 0.6 | GO:0032218 | riboflavin transport(GO:0032218) |
| 0.2 | 0.6 | GO:0055129 | L-proline biosynthetic process(GO:0055129) |
| 0.2 | 4.3 | GO:0006270 | DNA replication initiation(GO:0006270) |
| 0.2 | 3.2 | GO:0045475 | locomotor rhythm(GO:0045475) |
| 0.2 | 10.4 | GO:0032436 | positive regulation of proteasomal ubiquitin-dependent protein catabolic process(GO:0032436) |
| 0.2 | 10.1 | GO:0006334 | nucleosome assembly(GO:0006334) |
| 0.2 | 2.4 | GO:0090140 | regulation of mitochondrial fission(GO:0090140) |
| 0.2 | 5.4 | GO:0048741 | skeletal muscle fiber development(GO:0048741) |
| 0.2 | 1.5 | GO:1904321 | response to forskolin(GO:1904321) cellular response to forskolin(GO:1904322) |
| 0.2 | 1.8 | GO:0051639 | actin filament network formation(GO:0051639) |
| 0.2 | 0.9 | GO:0050917 | sensory perception of umami taste(GO:0050917) |
| 0.2 | 2.3 | GO:0060576 | intestinal epithelial cell development(GO:0060576) |
| 0.2 | 3.8 | GO:0006368 | transcription elongation from RNA polymerase II promoter(GO:0006368) |
| 0.2 | 0.8 | GO:0031119 | tRNA pseudouridine synthesis(GO:0031119) |
| 0.1 | 3.4 | GO:0051028 | mRNA transport(GO:0051028) |
| 0.1 | 15.8 | GO:0035335 | peptidyl-tyrosine dephosphorylation(GO:0035335) |
| 0.1 | 0.7 | GO:0035948 | positive regulation of gluconeogenesis by positive regulation of transcription from RNA polymerase II promoter(GO:0035948) |
| 0.1 | 1.0 | GO:0016199 | axon midline choice point recognition(GO:0016199) |
| 0.1 | 2.9 | GO:1902475 | L-alpha-amino acid transmembrane transport(GO:1902475) |
| 0.1 | 3.1 | GO:0006378 | mRNA polyadenylation(GO:0006378) |
| 0.1 | 0.4 | GO:0051103 | DNA ligation involved in DNA repair(GO:0051103) |
| 0.1 | 7.2 | GO:0002437 | inflammatory response to antigenic stimulus(GO:0002437) |
| 0.1 | 1.4 | GO:0014883 | transition between fast and slow fiber(GO:0014883) |
| 0.1 | 2.0 | GO:2001241 | positive regulation of extrinsic apoptotic signaling pathway in absence of ligand(GO:2001241) |
| 0.1 | 0.5 | GO:0070862 | negative regulation of protein exit from endoplasmic reticulum(GO:0070862) negative regulation of retrograde protein transport, ER to cytosol(GO:1904153) |
| 0.1 | 0.7 | GO:0090083 | regulation of inclusion body assembly(GO:0090083) |
| 0.1 | 12.8 | GO:0042098 | T cell proliferation(GO:0042098) |
| 0.1 | 3.1 | GO:0006284 | base-excision repair(GO:0006284) |
| 0.1 | 20.4 | GO:0060271 | cilium morphogenesis(GO:0060271) |
| 0.1 | 2.2 | GO:0048747 | muscle fiber development(GO:0048747) |
| 0.1 | 1.1 | GO:0051985 | mitotic spindle assembly checkpoint(GO:0007094) spindle checkpoint(GO:0031577) negative regulation of sister chromatid segregation(GO:0033046) negative regulation of mitotic sister chromatid segregation(GO:0033048) negative regulation of mitotic metaphase/anaphase transition(GO:0045841) negative regulation of chromosome segregation(GO:0051985) spindle assembly checkpoint(GO:0071173) mitotic spindle checkpoint(GO:0071174) negative regulation of metaphase/anaphase transition of cell cycle(GO:1902100) negative regulation of mitotic sister chromatid separation(GO:2000816) |
| 0.1 | 3.8 | GO:0048791 | calcium ion-regulated exocytosis of neurotransmitter(GO:0048791) |
| 0.1 | 1.0 | GO:0035457 | cellular response to interferon-alpha(GO:0035457) |
| 0.1 | 1.4 | GO:0045760 | positive regulation of action potential(GO:0045760) |
| 0.1 | 4.0 | GO:2000649 | regulation of sodium ion transmembrane transporter activity(GO:2000649) |
| 0.1 | 1.8 | GO:0043276 | anoikis(GO:0043276) |
| 0.1 | 0.5 | GO:0035338 | long-chain fatty-acyl-CoA biosynthetic process(GO:0035338) |
| 0.1 | 0.9 | GO:2000772 | regulation of cellular senescence(GO:2000772) |
| 0.1 | 2.7 | GO:0000413 | protein peptidyl-prolyl isomerization(GO:0000413) |
| 0.1 | 8.6 | GO:0043524 | negative regulation of neuron apoptotic process(GO:0043524) |
| 0.1 | 1.0 | GO:0015671 | oxygen transport(GO:0015671) |
| 0.1 | 1.2 | GO:0060216 | definitive hemopoiesis(GO:0060216) |
| 0.1 | 1.3 | GO:0006450 | regulation of translational fidelity(GO:0006450) |
| 0.1 | 0.3 | GO:0002943 | tRNA dihydrouridine synthesis(GO:0002943) |
| 0.1 | 1.1 | GO:0010738 | regulation of protein kinase A signaling(GO:0010738) |
| 0.1 | 2.4 | GO:0048024 | regulation of mRNA splicing, via spliceosome(GO:0048024) |
| 0.1 | 2.1 | GO:0038083 | peptidyl-tyrosine autophosphorylation(GO:0038083) |
| 0.0 | 10.7 | GO:0006839 | mitochondrial transport(GO:0006839) |
| 0.0 | 0.6 | GO:0033522 | histone H2A ubiquitination(GO:0033522) |
| 0.0 | 1.0 | GO:0045687 | positive regulation of glial cell differentiation(GO:0045687) |
| 0.0 | 0.5 | GO:0045840 | positive regulation of mitotic nuclear division(GO:0045840) |
| 0.0 | 0.2 | GO:0051694 | pointed-end actin filament capping(GO:0051694) |
| 0.0 | 0.8 | GO:1902042 | negative regulation of extrinsic apoptotic signaling pathway via death domain receptors(GO:1902042) |
| 0.0 | 0.7 | GO:0072384 | organelle transport along microtubule(GO:0072384) |
| 0.0 | 0.5 | GO:0030514 | negative regulation of BMP signaling pathway(GO:0030514) |
| 0.0 | 0.3 | GO:0050910 | detection of mechanical stimulus involved in sensory perception of sound(GO:0050910) |
| 0.0 | 0.2 | GO:0010960 | magnesium ion homeostasis(GO:0010960) |
| 0.0 | 0.5 | GO:0000387 | spliceosomal snRNP assembly(GO:0000387) |
| 0.0 | 0.2 | GO:0009312 | oligosaccharide biosynthetic process(GO:0009312) |
| 0.0 | 0.2 | GO:0060259 | regulation of feeding behavior(GO:0060259) |
Gene overrepresentation in cellular component category:
| Log-likelihood per target | Total log-likelihood | Term | Description |
|---|---|---|---|
| 9.4 | 56.5 | GO:0071547 | piP-body(GO:0071547) |
| 8.8 | 61.3 | GO:0036128 | CatSper complex(GO:0036128) |
| 8.6 | 51.8 | GO:0032133 | chromosome passenger complex(GO:0032133) |
| 7.4 | 44.3 | GO:0071546 | pi-body(GO:0071546) |
| 6.8 | 20.3 | GO:0097125 | cyclin B1-CDK1 complex(GO:0097125) |
| 5.4 | 53.8 | GO:0044613 | nuclear pore central transport channel(GO:0044613) |
| 5.0 | 24.9 | GO:0098536 | deuterosome(GO:0098536) |
| 4.7 | 19.0 | GO:0031436 | BRCA1-BARD1 complex(GO:0031436) |
| 4.7 | 23.3 | GO:0043159 | acrosomal matrix(GO:0043159) |
| 4.1 | 73.3 | GO:0031588 | nucleotide-activated protein kinase complex(GO:0031588) |
| 3.9 | 46.3 | GO:0002199 | zona pellucida receptor complex(GO:0002199) |
| 3.6 | 64.0 | GO:0001741 | XY body(GO:0001741) |
| 3.0 | 3.0 | GO:0005642 | annulate lamellae(GO:0005642) |
| 2.8 | 31.1 | GO:0008278 | cohesin complex(GO:0008278) |
| 2.8 | 14.1 | GO:0030015 | CCR4-NOT core complex(GO:0030015) |
| 2.8 | 16.7 | GO:0043203 | axon hillock(GO:0043203) |
| 2.7 | 27.3 | GO:0008290 | F-actin capping protein complex(GO:0008290) |
| 2.7 | 58.8 | GO:0001673 | male germ cell nucleus(GO:0001673) |
| 2.5 | 163.4 | GO:0000777 | condensed chromosome kinetochore(GO:0000777) |
| 2.1 | 10.6 | GO:0035985 | senescence-associated heterochromatin focus(GO:0035985) |
| 2.1 | 8.4 | GO:0099524 | region of cytosol(GO:0099522) postsynaptic cytosol(GO:0099524) |
| 2.1 | 10.3 | GO:0031315 | extrinsic component of mitochondrial outer membrane(GO:0031315) |
| 2.0 | 18.1 | GO:0005826 | actomyosin contractile ring(GO:0005826) |
| 1.9 | 5.7 | GO:0044214 | spanning component of plasma membrane(GO:0044214) spanning component of membrane(GO:0089717) |
| 1.8 | 11.1 | GO:0097255 | R2TP complex(GO:0097255) |
| 1.8 | 20.2 | GO:0000176 | nuclear exosome (RNase complex)(GO:0000176) |
| 1.7 | 6.8 | GO:0043564 | Ku70:Ku80 complex(GO:0043564) |
| 1.6 | 4.9 | GO:1990589 | ATF4-CREB1 transcription factor complex(GO:1990589) |
| 1.6 | 14.6 | GO:0000800 | lateral element(GO:0000800) |
| 1.6 | 11.1 | GO:0016593 | Cdc73/Paf1 complex(GO:0016593) |
| 1.5 | 5.8 | GO:0097413 | Lewy body(GO:0097413) |
| 1.4 | 4.3 | GO:0032798 | Swi5-Sfr1 complex(GO:0032798) |
| 1.4 | 24.3 | GO:0000242 | pericentriolar material(GO:0000242) |
| 1.3 | 35.1 | GO:0097225 | sperm midpiece(GO:0097225) |
| 1.3 | 151.5 | GO:0001669 | acrosomal vesicle(GO:0001669) |
| 1.3 | 5.3 | GO:0036398 | TCR signalosome(GO:0036398) |
| 1.3 | 13.0 | GO:0070652 | HAUS complex(GO:0070652) |
| 1.3 | 36.9 | GO:0034451 | centriolar satellite(GO:0034451) |
| 1.3 | 20.1 | GO:0018995 | host(GO:0018995) host cell(GO:0043657) |
| 1.2 | 6.0 | GO:0043625 | delta DNA polymerase complex(GO:0043625) |
| 1.2 | 178.1 | GO:0031514 | motile cilium(GO:0031514) |
| 1.2 | 8.2 | GO:0070449 | elongin complex(GO:0070449) |
| 1.1 | 17.9 | GO:0005845 | mRNA cap binding complex(GO:0005845) |
| 1.1 | 12.2 | GO:0035631 | CD40 receptor complex(GO:0035631) |
| 1.1 | 8.8 | GO:0005658 | alpha DNA polymerase:primase complex(GO:0005658) |
| 1.1 | 9.9 | GO:0019773 | proteasome core complex, alpha-subunit complex(GO:0019773) |
| 1.0 | 3.0 | GO:1990015 | mesaxon(GO:0097453) ensheathing process(GO:1990015) |
| 1.0 | 11.1 | GO:0005750 | mitochondrial respiratory chain complex III(GO:0005750) |
| 1.0 | 7.9 | GO:0042105 | alpha-beta T cell receptor complex(GO:0042105) |
| 1.0 | 4.9 | GO:1990452 | Parkin-FBXW7-Cul1 ubiquitin ligase complex(GO:1990452) |
| 0.9 | 18.0 | GO:0043196 | varicosity(GO:0043196) |
| 0.9 | 2.8 | GO:0005896 | interleukin-6 receptor complex(GO:0005896) |
| 0.9 | 84.4 | GO:0036064 | ciliary basal body(GO:0036064) |
| 0.9 | 4.5 | GO:0097539 | ciliary transition fiber(GO:0097539) |
| 0.9 | 4.4 | GO:0044614 | nuclear pore cytoplasmic filaments(GO:0044614) |
| 0.9 | 17.4 | GO:0005892 | acetylcholine-gated channel complex(GO:0005892) |
| 0.9 | 6.1 | GO:0061617 | MICOS complex(GO:0061617) |
| 0.9 | 5.2 | GO:0005787 | signal peptidase complex(GO:0005787) |
| 0.9 | 6.0 | GO:0001739 | sex chromatin(GO:0001739) |
| 0.8 | 5.0 | GO:0060091 | kinocilium(GO:0060091) |
| 0.8 | 5.6 | GO:0031415 | NatA complex(GO:0031415) |
| 0.8 | 6.1 | GO:0005664 | origin recognition complex(GO:0000808) nuclear origin of replication recognition complex(GO:0005664) |
| 0.8 | 8.3 | GO:0030992 | intraciliary transport particle B(GO:0030992) |
| 0.8 | 7.5 | GO:0031464 | Cul4A-RING E3 ubiquitin ligase complex(GO:0031464) |
| 0.7 | 15.0 | GO:0005680 | anaphase-promoting complex(GO:0005680) |
| 0.7 | 9.9 | GO:0033276 | transcription factor TFTC complex(GO:0033276) |
| 0.7 | 12.0 | GO:0042582 | primary lysosome(GO:0005766) azurophil granule(GO:0042582) |
| 0.7 | 25.3 | GO:0032154 | cleavage furrow(GO:0032154) cell surface furrow(GO:0097610) |
| 0.7 | 8.0 | GO:0005890 | sodium:potassium-exchanging ATPase complex(GO:0005890) |
| 0.7 | 9.1 | GO:0030123 | AP-3 adaptor complex(GO:0030123) |
| 0.6 | 5.0 | GO:0016600 | flotillin complex(GO:0016600) |
| 0.6 | 9.1 | GO:0005839 | proteasome core complex(GO:0005839) |
| 0.6 | 1.8 | GO:0032301 | MutSalpha complex(GO:0032301) |
| 0.6 | 55.3 | GO:0000786 | nucleosome(GO:0000786) |
| 0.6 | 34.0 | GO:0005814 | centriole(GO:0005814) |
| 0.6 | 3.4 | GO:0034715 | pICln-Sm protein complex(GO:0034715) |
| 0.5 | 25.4 | GO:0010494 | cytoplasmic stress granule(GO:0010494) |
| 0.5 | 16.6 | GO:1904115 | axon cytoplasm(GO:1904115) |
| 0.5 | 10.1 | GO:0000346 | transcription export complex(GO:0000346) |
| 0.5 | 11.0 | GO:0031233 | intrinsic component of external side of plasma membrane(GO:0031233) |
| 0.5 | 9.0 | GO:0005868 | cytoplasmic dynein complex(GO:0005868) |
| 0.5 | 16.3 | GO:0097440 | apical dendrite(GO:0097440) |
| 0.5 | 5.9 | GO:0044666 | MLL3/4 complex(GO:0044666) |
| 0.5 | 2.8 | GO:0005663 | DNA replication factor C complex(GO:0005663) |
| 0.5 | 3.7 | GO:0008024 | cyclin/CDK positive transcription elongation factor complex(GO:0008024) |
| 0.4 | 12.0 | GO:0000159 | protein phosphatase type 2A complex(GO:0000159) |
| 0.4 | 6.4 | GO:0035098 | ESC/E(Z) complex(GO:0035098) |
| 0.4 | 3.4 | GO:0010369 | chromocenter(GO:0010369) |
| 0.4 | 7.1 | GO:0080008 | Cul4-RING E3 ubiquitin ligase complex(GO:0080008) |
| 0.4 | 1.7 | GO:0032299 | ribonuclease H2 complex(GO:0032299) |
| 0.4 | 4.9 | GO:0030014 | CCR4-NOT complex(GO:0030014) |
| 0.4 | 1.9 | GO:0031595 | nuclear proteasome complex(GO:0031595) |
| 0.4 | 13.4 | GO:0016235 | aggresome(GO:0016235) |
| 0.4 | 10.8 | GO:0016234 | inclusion body(GO:0016234) |
| 0.4 | 4.9 | GO:0017119 | Golgi transport complex(GO:0017119) |
| 0.4 | 13.0 | GO:0008287 | protein serine/threonine phosphatase complex(GO:0008287) |
| 0.3 | 4.2 | GO:0032433 | filopodium tip(GO:0032433) |
| 0.3 | 1.0 | GO:0071001 | U4/U6 snRNP(GO:0071001) |
| 0.3 | 10.2 | GO:0001772 | immunological synapse(GO:0001772) |
| 0.3 | 23.3 | GO:0000118 | histone deacetylase complex(GO:0000118) |
| 0.3 | 1.6 | GO:0090661 | box H/ACA telomerase RNP complex(GO:0090661) |
| 0.3 | 2.0 | GO:0070847 | core mediator complex(GO:0070847) |
| 0.3 | 4.6 | GO:0031045 | dense core granule(GO:0031045) |
| 0.3 | 5.3 | GO:0030286 | dynein complex(GO:0030286) |
| 0.3 | 1.1 | GO:0005971 | ribonucleoside-diphosphate reductase complex(GO:0005971) |
| 0.3 | 1.9 | GO:0071141 | SMAD protein complex(GO:0071141) |
| 0.3 | 1.3 | GO:0030981 | cortical microtubule cytoskeleton(GO:0030981) |
| 0.3 | 4.8 | GO:0035267 | NuA4 histone acetyltransferase complex(GO:0035267) H4/H2A histone acetyltransferase complex(GO:0043189) H4 histone acetyltransferase complex(GO:1902562) |
| 0.2 | 6.4 | GO:0035861 | site of double-strand break(GO:0035861) |
| 0.2 | 5.5 | GO:0051233 | spindle midzone(GO:0051233) |
| 0.2 | 0.6 | GO:0034457 | Mpp10 complex(GO:0034457) |
| 0.2 | 22.4 | GO:0005791 | rough endoplasmic reticulum(GO:0005791) |
| 0.2 | 3.2 | GO:0032045 | guanyl-nucleotide exchange factor complex(GO:0032045) |
| 0.2 | 5.7 | GO:0000407 | pre-autophagosomal structure(GO:0000407) |
| 0.2 | 21.6 | GO:0036464 | cytoplasmic ribonucleoprotein granule(GO:0036464) |
| 0.2 | 16.5 | GO:0030496 | midbody(GO:0030496) |
| 0.2 | 1.0 | GO:0031314 | extrinsic component of mitochondrial inner membrane(GO:0031314) |
| 0.2 | 6.5 | GO:0031201 | SNARE complex(GO:0031201) |
| 0.2 | 5.9 | GO:0031941 | filamentous actin(GO:0031941) |
| 0.2 | 0.5 | GO:0045025 | mitochondrial degradosome(GO:0045025) |
| 0.2 | 1.1 | GO:0071204 | histone pre-mRNA 3'end processing complex(GO:0071204) |
| 0.1 | 8.7 | GO:0016605 | PML body(GO:0016605) |
| 0.1 | 1.5 | GO:0030688 | preribosome, small subunit precursor(GO:0030688) |
| 0.1 | 0.7 | GO:0033063 | Rad51B-Rad51C-Rad51D-XRCC2 complex(GO:0033063) |
| 0.1 | 8.5 | GO:0005758 | mitochondrial intermembrane space(GO:0005758) |
| 0.1 | 32.4 | GO:0005813 | centrosome(GO:0005813) |
| 0.1 | 16.9 | GO:0043204 | perikaryon(GO:0043204) |
| 0.1 | 14.1 | GO:0005882 | intermediate filament(GO:0005882) |
| 0.1 | 5.5 | GO:0017053 | transcriptional repressor complex(GO:0017053) |
| 0.1 | 1.5 | GO:0071011 | precatalytic spliceosome(GO:0071011) |
| 0.1 | 1.0 | GO:0005833 | hemoglobin complex(GO:0005833) |
| 0.1 | 1.4 | GO:0005665 | DNA-directed RNA polymerase II, core complex(GO:0005665) |
| 0.1 | 11.2 | GO:0005741 | mitochondrial outer membrane(GO:0005741) |
| 0.1 | 10.6 | GO:0031234 | extrinsic component of cytoplasmic side of plasma membrane(GO:0031234) |
| 0.1 | 0.5 | GO:1990712 | HFE-transferrin receptor complex(GO:1990712) |
| 0.1 | 3.6 | GO:0005643 | nuclear pore(GO:0005643) |
| 0.1 | 0.5 | GO:0042382 | paraspeckles(GO:0042382) |
| 0.0 | 6.3 | GO:0070382 | exocytic vesicle(GO:0070382) |
| 0.0 | 0.6 | GO:0031229 | integral component of nuclear inner membrane(GO:0005639) intrinsic component of nuclear inner membrane(GO:0031229) |
| 0.0 | 12.3 | GO:0016607 | nuclear speck(GO:0016607) |
| 0.0 | 0.6 | GO:1902555 | endoribonuclease complex(GO:1902555) |
| 0.0 | 0.1 | GO:0005827 | polar microtubule(GO:0005827) |
| 0.0 | 0.5 | GO:0005697 | telomerase holoenzyme complex(GO:0005697) |
| 0.0 | 1.3 | GO:0005905 | clathrin-coated pit(GO:0005905) |
| 0.0 | 9.5 | GO:0005694 | chromosome(GO:0005694) |
| 0.0 | 0.8 | GO:0000502 | proteasome complex(GO:0000502) |
| 0.0 | 0.0 | GO:0000974 | Prp19 complex(GO:0000974) |
| 0.0 | 0.8 | GO:0043198 | dendritic shaft(GO:0043198) |
Gene overrepresentation in molecular function category:
| Log-likelihood per target | Total log-likelihood | Term | Description |
|---|---|---|---|
| 15.1 | 45.4 | GO:0004370 | glycerol kinase activity(GO:0004370) |
| 10.0 | 39.8 | GO:0004459 | L-lactate dehydrogenase activity(GO:0004459) |
| 9.3 | 28.0 | GO:0033222 | xylose binding(GO:0033222) |
| 8.9 | 35.4 | GO:0034584 | piRNA binding(GO:0034584) |
| 7.8 | 31.3 | GO:0033149 | FFAT motif binding(GO:0033149) |
| 7.8 | 23.3 | GO:0004040 | amidase activity(GO:0004040) |
| 6.9 | 20.6 | GO:0004735 | pyrroline-5-carboxylate reductase activity(GO:0004735) |
| 6.5 | 39.1 | GO:0032027 | myosin light chain binding(GO:0032027) |
| 6.2 | 18.6 | GO:0008107 | galactoside 2-alpha-L-fucosyltransferase activity(GO:0008107) alpha-(1,2)-fucosyltransferase activity(GO:0031127) |
| 5.3 | 85.3 | GO:0035174 | histone serine kinase activity(GO:0035174) |
| 5.1 | 20.3 | GO:0061575 | cyclin-dependent protein serine/threonine kinase activator activity(GO:0061575) |
| 4.6 | 46.0 | GO:0015386 | potassium:proton antiporter activity(GO:0015386) |
| 4.5 | 18.0 | GO:0031694 | alpha-2A adrenergic receptor binding(GO:0031694) |
| 4.3 | 17.2 | GO:0030060 | L-malate dehydrogenase activity(GO:0030060) |
| 4.0 | 20.2 | GO:0010997 | anaphase-promoting complex binding(GO:0010997) |
| 3.1 | 62.8 | GO:0017056 | structural constituent of nuclear pore(GO:0017056) |
| 3.0 | 12.1 | GO:0004963 | follicle-stimulating hormone receptor activity(GO:0004963) |
| 2.8 | 8.5 | GO:0042015 | interleukin-20 binding(GO:0042015) |
| 2.8 | 16.6 | GO:0032405 | MutLalpha complex binding(GO:0032405) |
| 2.7 | 10.7 | GO:0004487 | methylenetetrahydrofolate dehydrogenase (NAD+) activity(GO:0004487) |
| 2.6 | 10.6 | GO:0015186 | L-glutamine transmembrane transporter activity(GO:0015186) |
| 2.5 | 15.2 | GO:0000150 | recombinase activity(GO:0000150) |
| 2.5 | 22.6 | GO:0032052 | bile acid binding(GO:0032052) |
| 2.5 | 15.0 | GO:0005049 | nuclear export signal receptor activity(GO:0005049) |
| 2.5 | 17.4 | GO:0051575 | 5'-deoxyribose-5-phosphate lyase activity(GO:0051575) |
| 2.3 | 11.5 | GO:0043515 | kinetochore binding(GO:0043515) |
| 2.3 | 11.4 | GO:0051373 | FATZ binding(GO:0051373) |
| 2.1 | 8.5 | GO:0004948 | calcitonin receptor activity(GO:0004948) |
| 2.1 | 12.5 | GO:0046624 | sphingolipid transporter activity(GO:0046624) |
| 2.1 | 6.2 | GO:0042296 | ISG15 transferase activity(GO:0042296) |
| 2.0 | 44.2 | GO:0051010 | microtubule plus-end binding(GO:0051010) |
| 2.0 | 10.0 | GO:0061676 | importin-alpha family protein binding(GO:0061676) |
| 2.0 | 17.6 | GO:0032552 | deoxyribonucleotide binding(GO:0032552) |
| 1.9 | 15.4 | GO:0032184 | SUMO polymer binding(GO:0032184) |
| 1.9 | 24.8 | GO:0003796 | lysozyme activity(GO:0003796) |
| 1.7 | 8.7 | GO:0097016 | L27 domain binding(GO:0097016) |
| 1.7 | 35.2 | GO:0008266 | poly(U) RNA binding(GO:0008266) |
| 1.7 | 8.4 | GO:0004849 | uridine kinase activity(GO:0004849) |
| 1.7 | 10.0 | GO:0043141 | ATP-dependent 5'-3' DNA helicase activity(GO:0043141) |
| 1.6 | 4.9 | GO:1990763 | arrestin family protein binding(GO:1990763) |
| 1.5 | 190.2 | GO:0004222 | metalloendopeptidase activity(GO:0004222) |
| 1.5 | 7.6 | GO:0016726 | aldehyde oxidase activity(GO:0004031) xanthine dehydrogenase activity(GO:0004854) oxidoreductase activity, acting on the aldehyde or oxo group of donors, oxygen as acceptor(GO:0016623) oxidoreductase activity, acting on CH or CH2 groups, NAD or NADP as acceptor(GO:0016726) |
| 1.5 | 4.5 | GO:0035851 | Krueppel-associated box domain binding(GO:0035851) |
| 1.5 | 15.0 | GO:0070016 | armadillo repeat domain binding(GO:0070016) |
| 1.5 | 11.9 | GO:0044323 | retinoic acid-responsive element binding(GO:0044323) |
| 1.5 | 6.0 | GO:0071535 | RING-like zinc finger domain binding(GO:0071535) |
| 1.5 | 5.9 | GO:0005143 | interleukin-12 receptor binding(GO:0005143) |
| 1.5 | 20.5 | GO:0004791 | thioredoxin-disulfide reductase activity(GO:0004791) |
| 1.4 | 7.2 | GO:0004169 | dolichyl-phosphate-mannose-protein mannosyltransferase activity(GO:0004169) |
| 1.4 | 7.2 | GO:0048248 | CXCR3 chemokine receptor binding(GO:0048248) |
| 1.4 | 24.3 | GO:0001594 | trace-amine receptor activity(GO:0001594) |
| 1.4 | 7.1 | GO:0070739 | protein-glutamic acid ligase activity(GO:0070739) |
| 1.4 | 8.5 | GO:0004126 | cytidine deaminase activity(GO:0004126) |
| 1.4 | 12.6 | GO:0019957 | C-C chemokine binding(GO:0019957) |
| 1.4 | 15.2 | GO:0051011 | microtubule minus-end binding(GO:0051011) |
| 1.4 | 12.2 | GO:0031702 | type 1 angiotensin receptor binding(GO:0031702) |
| 1.3 | 5.3 | GO:0000822 | inositol hexakisphosphate binding(GO:0000822) |
| 1.3 | 10.3 | GO:0004439 | phosphatidylinositol-4,5-bisphosphate 5-phosphatase activity(GO:0004439) |
| 1.3 | 16.6 | GO:0047372 | acylglycerol lipase activity(GO:0047372) |
| 1.3 | 25.3 | GO:0051537 | 2 iron, 2 sulfur cluster binding(GO:0051537) |
| 1.3 | 8.8 | GO:0003896 | DNA primase activity(GO:0003896) |
| 1.2 | 19.7 | GO:0051371 | muscle alpha-actinin binding(GO:0051371) |
| 1.2 | 3.7 | GO:0034211 | GTP-dependent protein kinase activity(GO:0034211) |
| 1.2 | 6.0 | GO:0002151 | G-quadruplex RNA binding(GO:0002151) |
| 1.2 | 25.6 | GO:0051861 | glycolipid binding(GO:0051861) |
| 1.1 | 6.9 | GO:0000405 | bubble DNA binding(GO:0000405) |
| 1.1 | 3.4 | GO:0004392 | heme oxygenase (decyclizing) activity(GO:0004392) |
| 1.1 | 5.7 | GO:0070891 | lipoteichoic acid binding(GO:0070891) |
| 1.1 | 37.3 | GO:0019707 | protein-cysteine S-palmitoyltransferase activity(GO:0019706) protein-cysteine S-acyltransferase activity(GO:0019707) |
| 1.1 | 37.7 | GO:0004683 | calmodulin-dependent protein kinase activity(GO:0004683) |
| 1.1 | 36.1 | GO:0001106 | RNA polymerase II transcription corepressor activity(GO:0001106) |
| 1.1 | 3.2 | GO:0044715 | 8-oxo-dGDP phosphatase activity(GO:0044715) |
| 1.0 | 5.2 | GO:0005314 | high-affinity glutamate transmembrane transporter activity(GO:0005314) |
| 1.0 | 4.2 | GO:0035827 | rubidium ion transmembrane transporter activity(GO:0035827) |
| 1.0 | 4.1 | GO:0008158 | hedgehog receptor activity(GO:0008158) |
| 1.0 | 22.6 | GO:0070577 | lysine-acetylated histone binding(GO:0070577) |
| 1.0 | 39.0 | GO:0031624 | ubiquitin conjugating enzyme binding(GO:0031624) |
| 1.0 | 5.1 | GO:0016262 | protein N-acetylglucosaminyltransferase activity(GO:0016262) |
| 1.0 | 17.4 | GO:0022848 | acetylcholine-gated cation channel activity(GO:0022848) |
| 1.0 | 30.0 | GO:0030332 | cyclin binding(GO:0030332) |
| 1.0 | 84.3 | GO:0051087 | chaperone binding(GO:0051087) |
| 1.0 | 9.9 | GO:1903136 | cuprous ion binding(GO:1903136) |
| 1.0 | 4.0 | GO:0008486 | endopolyphosphatase activity(GO:0000298) diphosphoinositol-polyphosphate diphosphatase activity(GO:0008486) bis(5'-adenosyl)-hexaphosphatase activity(GO:0034431) bis(5'-adenosyl)-pentaphosphatase activity(GO:0034432) |
| 1.0 | 8.9 | GO:0045505 | dynein intermediate chain binding(GO:0045505) |
| 1.0 | 6.9 | GO:0000155 | phosphorelay sensor kinase activity(GO:0000155) C3HC4-type RING finger domain binding(GO:0055131) |
| 1.0 | 3.9 | GO:0004743 | pyruvate kinase activity(GO:0004743) |
| 1.0 | 14.3 | GO:0019531 | oxalate transmembrane transporter activity(GO:0019531) |
| 0.9 | 3.8 | GO:0050252 | retinol O-fatty-acyltransferase activity(GO:0050252) |
| 0.9 | 7.5 | GO:0004035 | alkaline phosphatase activity(GO:0004035) |
| 0.9 | 6.6 | GO:0072542 | protein phosphatase activator activity(GO:0072542) |
| 0.9 | 8.3 | GO:0046975 | histone methyltransferase activity (H3-K36 specific)(GO:0046975) |
| 0.9 | 7.3 | GO:0030292 | protein tyrosine kinase inhibitor activity(GO:0030292) |
| 0.9 | 3.6 | GO:0036042 | long-chain fatty acyl-CoA binding(GO:0036042) |
| 0.9 | 3.5 | GO:0003839 | gamma-glutamylcyclotransferase activity(GO:0003839) |
| 0.9 | 16.4 | GO:0000030 | mannosyltransferase activity(GO:0000030) |
| 0.9 | 9.4 | GO:0003873 | 6-phosphofructo-2-kinase activity(GO:0003873) fructose-2,6-bisphosphate 2-phosphatase activity(GO:0004331) |
| 0.8 | 10.8 | GO:0030215 | semaphorin receptor binding(GO:0030215) |
| 0.8 | 6.4 | GO:0004703 | G-protein coupled receptor kinase activity(GO:0004703) |
| 0.8 | 8.8 | GO:0005391 | sodium:potassium-exchanging ATPase activity(GO:0005391) |
| 0.8 | 3.9 | GO:0019862 | IgA binding(GO:0019862) |
| 0.8 | 3.1 | GO:0000829 | inositol heptakisphosphate kinase activity(GO:0000829) |
| 0.7 | 39.6 | GO:0008138 | protein tyrosine/serine/threonine phosphatase activity(GO:0008138) |
| 0.7 | 8.9 | GO:0008327 | methyl-CpG binding(GO:0008327) |
| 0.7 | 3.0 | GO:0033743 | peptide-methionine (R)-S-oxide reductase activity(GO:0033743) |
| 0.7 | 11.6 | GO:0008568 | microtubule-severing ATPase activity(GO:0008568) |
| 0.7 | 10.8 | GO:0003993 | acid phosphatase activity(GO:0003993) |
| 0.7 | 19.0 | GO:0070003 | threonine-type endopeptidase activity(GO:0004298) threonine-type peptidase activity(GO:0070003) |
| 0.7 | 11.9 | GO:0050811 | GABA receptor binding(GO:0050811) |
| 0.7 | 3.4 | GO:0051032 | nucleic acid transmembrane transporter activity(GO:0051032) RNA transmembrane transporter activity(GO:0051033) |
| 0.7 | 7.4 | GO:0016783 | sulfurtransferase activity(GO:0016783) |
| 0.7 | 11.1 | GO:0000993 | RNA polymerase II core binding(GO:0000993) |
| 0.7 | 2.6 | GO:0004740 | pyruvate dehydrogenase (acetyl-transferring) kinase activity(GO:0004740) |
| 0.6 | 4.5 | GO:0004118 | cGMP-stimulated cyclic-nucleotide phosphodiesterase activity(GO:0004118) |
| 0.6 | 50.9 | GO:0003777 | microtubule motor activity(GO:0003777) |
| 0.6 | 6.0 | GO:0008296 | 3'-5'-exodeoxyribonuclease activity(GO:0008296) |
| 0.5 | 15.2 | GO:0008376 | acetylgalactosaminyltransferase activity(GO:0008376) |
| 0.5 | 2.2 | GO:0019002 | GMP binding(GO:0019002) |
| 0.5 | 78.2 | GO:0005179 | hormone activity(GO:0005179) |
| 0.5 | 10.1 | GO:0004559 | alpha-mannosidase activity(GO:0004559) |
| 0.5 | 13.2 | GO:0003774 | motor activity(GO:0003774) |
| 0.5 | 4.3 | GO:0035613 | RNA stem-loop binding(GO:0035613) |
| 0.5 | 8.5 | GO:0017160 | Ral GTPase binding(GO:0017160) |
| 0.5 | 2.8 | GO:0005138 | interleukin-6 receptor binding(GO:0005138) |
| 0.5 | 10.2 | GO:0043539 | protein serine/threonine kinase activator activity(GO:0043539) |
| 0.5 | 11.3 | GO:0030371 | translation repressor activity(GO:0030371) |
| 0.4 | 2.7 | GO:0097027 | ubiquitin-protein transferase activator activity(GO:0097027) |
| 0.4 | 3.1 | GO:0004652 | polynucleotide adenylyltransferase activity(GO:0004652) |
| 0.4 | 8.7 | GO:0017049 | GTP-Rho binding(GO:0017049) |
| 0.4 | 3.4 | GO:1990446 | U1 snRNP binding(GO:1990446) |
| 0.4 | 59.5 | GO:0003714 | transcription corepressor activity(GO:0003714) |
| 0.4 | 26.6 | GO:0003724 | RNA helicase activity(GO:0003724) ATP-dependent RNA helicase activity(GO:0004004) |
| 0.4 | 13.7 | GO:0004532 | exoribonuclease activity(GO:0004532) |
| 0.4 | 8.0 | GO:0048018 | receptor agonist activity(GO:0048018) |
| 0.4 | 5.6 | GO:0004596 | peptide alpha-N-acetyltransferase activity(GO:0004596) |
| 0.4 | 13.2 | GO:0031369 | translation initiation factor binding(GO:0031369) |
| 0.4 | 11.9 | GO:0003785 | actin monomer binding(GO:0003785) |
| 0.4 | 4.7 | GO:0016846 | carbon-sulfur lyase activity(GO:0016846) |
| 0.4 | 3.8 | GO:0039706 | co-receptor binding(GO:0039706) |
| 0.4 | 4.2 | GO:0034450 | ubiquitin-ubiquitin ligase activity(GO:0034450) |
| 0.4 | 1.8 | GO:0030229 | very-low-density lipoprotein particle receptor activity(GO:0030229) |
| 0.4 | 2.8 | GO:0030375 | thyroid hormone receptor coactivator activity(GO:0030375) |
| 0.3 | 1.0 | GO:0019961 | interferon binding(GO:0019961) |
| 0.3 | 1.0 | GO:0031721 | hemoglobin alpha binding(GO:0031721) |
| 0.3 | 2.7 | GO:0016413 | O-acetyltransferase activity(GO:0016413) |
| 0.3 | 1.7 | GO:0030283 | testosterone dehydrogenase [NAD(P)] activity(GO:0030283) |
| 0.3 | 15.6 | GO:0019894 | kinesin binding(GO:0019894) |
| 0.3 | 7.9 | GO:0048020 | CCR chemokine receptor binding(GO:0048020) |
| 0.3 | 5.6 | GO:0008199 | ferric iron binding(GO:0008199) |
| 0.3 | 1.3 | GO:0055077 | gap junction hemi-channel activity(GO:0055077) |
| 0.3 | 9.7 | GO:0061631 | ubiquitin conjugating enzyme activity(GO:0061631) ubiquitin-like protein conjugating enzyme activity(GO:0061650) |
| 0.3 | 3.6 | GO:0017162 | aryl hydrocarbon receptor binding(GO:0017162) |
| 0.3 | 1.9 | GO:0036402 | proteasome-activating ATPase activity(GO:0036402) |
| 0.3 | 2.3 | GO:0019203 | carbohydrate phosphatase activity(GO:0019203) |
| 0.3 | 0.6 | GO:0042134 | rRNA primary transcript binding(GO:0042134) |
| 0.3 | 11.2 | GO:0003690 | double-stranded DNA binding(GO:0003690) |
| 0.3 | 0.9 | GO:0052852 | very-long-chain-(S)-2-hydroxy-acid oxidase activity(GO:0052852) long-chain-(S)-2-hydroxy-long-chain-acid oxidase activity(GO:0052853) medium-chain-(S)-2-hydroxy-acid oxidase activity(GO:0052854) |
| 0.3 | 4.4 | GO:0070034 | telomerase RNA binding(GO:0070034) |
| 0.3 | 9.8 | GO:0004712 | protein serine/threonine/tyrosine kinase activity(GO:0004712) |
| 0.3 | 3.5 | GO:0102391 | decanoate--CoA ligase activity(GO:0102391) |
| 0.3 | 11.8 | GO:0004601 | peroxidase activity(GO:0004601) |
| 0.3 | 2.8 | GO:0003689 | DNA clamp loader activity(GO:0003689) protein-DNA loading ATPase activity(GO:0033170) |
| 0.3 | 4.6 | GO:0016595 | glutamate binding(GO:0016595) |
| 0.3 | 3.0 | GO:0033691 | sialic acid binding(GO:0033691) |
| 0.3 | 5.0 | GO:0042800 | histone methyltransferase activity (H3-K4 specific)(GO:0042800) |
| 0.2 | 39.9 | GO:0042393 | histone binding(GO:0042393) |
| 0.2 | 2.0 | GO:0005381 | iron ion transmembrane transporter activity(GO:0005381) ferrous iron transmembrane transporter activity(GO:0015093) |
| 0.2 | 1.1 | GO:0016728 | ribonucleoside-diphosphate reductase activity, thioredoxin disulfide as acceptor(GO:0004748) oxidoreductase activity, acting on CH or CH2 groups, disulfide as acceptor(GO:0016728) ribonucleoside-diphosphate reductase activity(GO:0061731) |
| 0.2 | 0.6 | GO:0019237 | centromeric DNA binding(GO:0019237) |
| 0.2 | 16.3 | GO:0008080 | N-acetyltransferase activity(GO:0008080) |
| 0.2 | 0.6 | GO:0032217 | riboflavin transporter activity(GO:0032217) |
| 0.2 | 4.6 | GO:0044183 | protein binding involved in protein folding(GO:0044183) |
| 0.2 | 1.4 | GO:0001055 | RNA polymerase II activity(GO:0001055) |
| 0.2 | 0.5 | GO:0004315 | 3-oxoacyl-[acyl-carrier-protein] synthase activity(GO:0004315) |
| 0.2 | 1.4 | GO:0036310 | annealing helicase activity(GO:0036310) |
| 0.2 | 7.4 | GO:0003743 | translation initiation factor activity(GO:0003743) |
| 0.2 | 45.7 | GO:0003924 | GTPase activity(GO:0003924) |
| 0.2 | 11.0 | GO:0003682 | chromatin binding(GO:0003682) |
| 0.2 | 1.2 | GO:0090079 | translation activator activity(GO:0008494) translation regulator activity, nucleic acid binding(GO:0090079) |
| 0.1 | 8.7 | GO:0004843 | thiol-dependent ubiquitin-specific protease activity(GO:0004843) |
| 0.1 | 1.3 | GO:0043522 | leucine zipper domain binding(GO:0043522) |
| 0.1 | 4.4 | GO:0036002 | pre-mRNA binding(GO:0036002) |
| 0.1 | 0.6 | GO:0032296 | ribonuclease III activity(GO:0004525) double-stranded RNA-specific ribonuclease activity(GO:0032296) |
| 0.1 | 10.5 | GO:0019905 | syntaxin binding(GO:0019905) |
| 0.1 | 6.8 | GO:0005080 | protein kinase C binding(GO:0005080) |
| 0.1 | 1.3 | GO:0032794 | GTPase activating protein binding(GO:0032794) |
| 0.1 | 4.8 | GO:0001205 | transcriptional activator activity, RNA polymerase II distal enhancer sequence-specific binding(GO:0001205) |
| 0.1 | 2.2 | GO:0070410 | co-SMAD binding(GO:0070410) |
| 0.1 | 2.4 | GO:0036312 | phosphatidylinositol 3-kinase regulatory subunit binding(GO:0036312) |
| 0.1 | 32.2 | GO:0005096 | GTPase activator activity(GO:0005096) |
| 0.1 | 2.0 | GO:0046966 | thyroid hormone receptor binding(GO:0046966) |
| 0.1 | 19.6 | GO:0003713 | transcription coactivator activity(GO:0003713) |
| 0.1 | 4.8 | GO:0005484 | SNAP receptor activity(GO:0005484) |
| 0.1 | 0.7 | GO:0008422 | beta-glucosidase activity(GO:0008422) |
| 0.1 | 1.3 | GO:0008301 | DNA binding, bending(GO:0008301) |
| 0.1 | 0.2 | GO:0042030 | ATPase inhibitor activity(GO:0042030) |
| 0.1 | 13.4 | GO:0005516 | calmodulin binding(GO:0005516) |
| 0.1 | 1.3 | GO:0002161 | aminoacyl-tRNA editing activity(GO:0002161) |
| 0.1 | 1.9 | GO:0003899 | DNA-directed RNA polymerase activity(GO:0003899) RNA polymerase activity(GO:0034062) |
| 0.1 | 0.5 | GO:1990459 | transferrin receptor binding(GO:1990459) |
| 0.1 | 3.2 | GO:0017112 | Rab guanyl-nucleotide exchange factor activity(GO:0017112) |
| 0.1 | 7.2 | GO:0001078 | transcriptional repressor activity, RNA polymerase II core promoter proximal region sequence-specific binding(GO:0001078) |
| 0.1 | 1.1 | GO:0034237 | protein kinase A catalytic subunit binding(GO:0034236) protein kinase A regulatory subunit binding(GO:0034237) |
| 0.1 | 0.7 | GO:0070628 | proteasome binding(GO:0070628) |
| 0.1 | 0.3 | GO:0017150 | tRNA dihydrouridine synthase activity(GO:0017150) |
| 0.1 | 2.4 | GO:0004715 | non-membrane spanning protein tyrosine kinase activity(GO:0004715) |
| 0.0 | 2.0 | GO:0003755 | peptidyl-prolyl cis-trans isomerase activity(GO:0003755) |
| 0.0 | 41.0 | GO:0001071 | nucleic acid binding transcription factor activity(GO:0001071) transcription factor activity, sequence-specific DNA binding(GO:0003700) |
| 0.0 | 2.9 | GO:0015179 | L-amino acid transmembrane transporter activity(GO:0015179) |
| 0.0 | 0.4 | GO:0003909 | DNA ligase activity(GO:0003909) DNA ligase (ATP) activity(GO:0003910) |
| 0.0 | 0.5 | GO:0004312 | fatty acid synthase activity(GO:0004312) |
| 0.0 | 9.2 | GO:0043565 | sequence-specific DNA binding(GO:0043565) |
| 0.0 | 1.5 | GO:1990782 | protein tyrosine kinase binding(GO:1990782) |
| 0.0 | 13.6 | GO:0003677 | DNA binding(GO:0003677) |
| 0.0 | 0.6 | GO:0015288 | porin activity(GO:0015288) |
| 0.0 | 0.6 | GO:0031490 | chromatin DNA binding(GO:0031490) |
| 0.0 | 1.1 | GO:0003684 | damaged DNA binding(GO:0003684) |
| 0.0 | 20.8 | GO:0008270 | zinc ion binding(GO:0008270) |
| 0.0 | 0.9 | GO:0005507 | copper ion binding(GO:0005507) |
| 0.0 | 0.8 | GO:0005160 | transforming growth factor beta receptor binding(GO:0005160) |
| 0.0 | 0.1 | GO:0045159 | myosin II binding(GO:0045159) |
Gene overrepresentation in curated gene sets: canonical pathways category:
| Log-likelihood per target | Total log-likelihood | Term | Description |
|---|---|---|---|
| 2.9 | 5.9 | PID IL23 PATHWAY | IL23-mediated signaling events |
| 2.3 | 110.0 | PID AURORA B PATHWAY | Aurora B signaling |
| 1.7 | 53.2 | PID INTEGRIN A9B1 PATHWAY | Alpha9 beta1 integrin signaling events |
| 1.5 | 71.8 | PID PLK1 PATHWAY | PLK1 signaling events |
| 1.5 | 55.3 | PID BARD1 PATHWAY | BARD1 signaling events |
| 1.1 | 4.2 | PID IL3 PATHWAY | IL3-mediated signaling events |
| 0.8 | 25.5 | PID MYC PATHWAY | C-MYC pathway |
| 0.7 | 8.8 | PID RANBP2 PATHWAY | Sumoylation by RanBP2 regulates transcriptional repression |
| 0.5 | 22.8 | PID PI3K PLC TRK PATHWAY | Trk receptor signaling mediated by PI3K and PLC-gamma |
| 0.5 | 19.0 | PID ALPHA SYNUCLEIN PATHWAY | Alpha-synuclein signaling |
| 0.5 | 15.7 | PID LIS1 PATHWAY | Lissencephaly gene (LIS1) in neuronal migration and development |
| 0.3 | 6.2 | PID SMAD2 3PATHWAY | Regulation of cytoplasmic and nuclear SMAD2/3 signaling |
| 0.3 | 2.7 | PID NFKAPPAB ATYPICAL PATHWAY | Atypical NF-kappaB pathway |
| 0.3 | 5.1 | PID EPHA2 FWD PATHWAY | EPHA2 forward signaling |
| 0.3 | 8.4 | PID CD40 PATHWAY | CD40/CD40L signaling |
| 0.3 | 2.8 | ST STAT3 PATHWAY | STAT3 Pathway |
| 0.3 | 7.5 | PID ATR PATHWAY | ATR signaling pathway |
| 0.3 | 18.6 | ST FAS SIGNALING PATHWAY | Fas Signaling Pathway |
| 0.3 | 5.5 | PID P38 MKK3 6PATHWAY | p38 MAPK signaling pathway |
| 0.2 | 6.4 | PID RHODOPSIN PATHWAY | Visual signal transduction: Rods |
| 0.2 | 3.8 | PID HIF1A PATHWAY | Hypoxic and oxygen homeostasis regulation of HIF-1-alpha |
| 0.2 | 3.7 | SIG INSULIN RECEPTOR PATHWAY IN CARDIAC MYOCYTES | Genes related to the insulin receptor pathway |
| 0.2 | 6.2 | PID IL12 STAT4 PATHWAY | IL12 signaling mediated by STAT4 |
| 0.2 | 9.9 | PID AR PATHWAY | Coregulation of Androgen receptor activity |
| 0.2 | 6.9 | PID AR TF PATHWAY | Regulation of Androgen receptor activity |
| 0.1 | 3.9 | PID CXCR3 PATHWAY | CXCR3-mediated signaling events |
| 0.1 | 2.5 | ST WNT BETA CATENIN PATHWAY | Wnt/beta-catenin Pathway |
| 0.1 | 4.2 | PID LKB1 PATHWAY | LKB1 signaling events |
| 0.1 | 1.6 | PID FOXO PATHWAY | FoxO family signaling |
| 0.1 | 3.5 | PID TELOMERASE PATHWAY | Regulation of Telomerase |
| 0.1 | 4.2 | PID TRKR PATHWAY | Neurotrophic factor-mediated Trk receptor signaling |
| 0.1 | 1.3 | PID INTEGRIN A4B1 PATHWAY | Alpha4 beta1 integrin signaling events |
| 0.1 | 1.2 | PID ATF2 PATHWAY | ATF-2 transcription factor network |
| 0.1 | 1.9 | PID PS1 PATHWAY | Presenilin action in Notch and Wnt signaling |
| 0.1 | 2.9 | PID E2F PATHWAY | E2F transcription factor network |
| 0.1 | 2.1 | PID P53 REGULATION PATHWAY | p53 pathway |
| 0.0 | 2.0 | PID NFAT TFPATHWAY | Calcineurin-regulated NFAT-dependent transcription in lymphocytes |
| 0.0 | 0.7 | PID FANCONI PATHWAY | Fanconi anemia pathway |
| 0.0 | 4.2 | NABA ECM AFFILIATED | Genes encoding proteins affiliated structurally or functionally to extracellular matrix proteins |
Gene overrepresentation in curated gene sets: REACTOME pathways category:
| Log-likelihood per target | Total log-likelihood | Term | Description |
|---|---|---|---|
| 4.4 | 44.3 | REACTOME REGULATION OF THE FANCONI ANEMIA PATHWAY | Genes involved in Regulation of the Fanconi anemia pathway |
| 2.8 | 88.0 | REACTOME KINESINS | Genes involved in Kinesins |
| 2.3 | 27.3 | REACTOME RECRUITMENT OF NUMA TO MITOTIC CENTROSOMES | Genes involved in Recruitment of NuMA to mitotic centrosomes |
| 1.6 | 28.0 | REACTOME FACILITATIVE NA INDEPENDENT GLUCOSE TRANSPORTERS | Genes involved in Facilitative Na+-independent glucose transporters |
| 1.6 | 20.2 | REACTOME MRNA DECAY BY 3 TO 5 EXORIBONUCLEASE | Genes involved in mRNA Decay by 3' to 5' Exoribonuclease |
| 1.3 | 19.1 | REACTOME APC C CDC20 MEDIATED DEGRADATION OF CYCLIN B | Genes involved in APC/C:Cdc20 mediated degradation of Cyclin B |
| 1.2 | 12.4 | REACTOME INTEGRATION OF PROVIRUS | Genes involved in Integration of provirus |
| 1.2 | 18.0 | REACTOME HORMONE SENSITIVE LIPASE HSL MEDIATED TRIACYLGLYCEROL HYDROLYSIS | Genes involved in Hormone-sensitive lipase (HSL)-mediated triacylglycerol hydrolysis |
| 1.1 | 12.1 | REACTOME HORMONE LIGAND BINDING RECEPTORS | Genes involved in Hormone ligand-binding receptors |
| 1.1 | 14.9 | REACTOME PROCESSIVE SYNTHESIS ON THE LAGGING STRAND | Genes involved in Processive synthesis on the lagging strand |
| 1.0 | 18.9 | REACTOME HOMOLOGOUS RECOMBINATION REPAIR OF REPLICATION INDEPENDENT DOUBLE STRAND BREAKS | Genes involved in Homologous recombination repair of replication-independent double-strand breaks |
| 1.0 | 56.0 | REACTOME MEIOTIC SYNAPSIS | Genes involved in Meiotic Synapsis |
| 1.0 | 12.2 | REACTOME PRESYNAPTIC NICOTINIC ACETYLCHOLINE RECEPTORS | Genes involved in Presynaptic nicotinic acetylcholine receptors |
| 1.0 | 13.9 | REACTOME EXTENSION OF TELOMERES | Genes involved in Extension of Telomeres |
| 1.0 | 63.5 | REACTOME LOSS OF NLP FROM MITOTIC CENTROSOMES | Genes involved in Loss of Nlp from mitotic centrosomes |
| 1.0 | 17.7 | REACTOME SYNTHESIS OF VERY LONG CHAIN FATTY ACYL COAS | Genes involved in Synthesis of very long-chain fatty acyl-CoAs |
| 1.0 | 2.9 | REACTOME HIGHLY CALCIUM PERMEABLE POSTSYNAPTIC NICOTINIC ACETYLCHOLINE RECEPTORS | Genes involved in Highly calcium permeable postsynaptic nicotinic acetylcholine receptors |
| 0.9 | 69.2 | REACTOME MITOTIC PROMETAPHASE | Genes involved in Mitotic Prometaphase |
| 0.8 | 6.2 | REACTOME TRANSLOCATION OF ZAP 70 TO IMMUNOLOGICAL SYNAPSE | Genes involved in Translocation of ZAP-70 to Immunological synapse |
| 0.8 | 7.0 | REACTOME E2F ENABLED INHIBITION OF PRE REPLICATION COMPLEX FORMATION | Genes involved in E2F-enabled inhibition of pre-replication complex formation |
| 0.7 | 6.9 | REACTOME DEPOSITION OF NEW CENPA CONTAINING NUCLEOSOMES AT THE CENTROMERE | Genes involved in Deposition of New CENPA-containing Nucleosomes at the Centromere |
| 0.7 | 16.1 | REACTOME DEADENYLATION OF MRNA | Genes involved in Deadenylation of mRNA |
| 0.7 | 7.8 | REACTOME RECYCLING OF BILE ACIDS AND SALTS | Genes involved in Recycling of bile acids and salts |
| 0.6 | 5.8 | REACTOME SPRY REGULATION OF FGF SIGNALING | Genes involved in Spry regulation of FGF signaling |
| 0.6 | 12.5 | REACTOME NEP NS2 INTERACTS WITH THE CELLULAR EXPORT MACHINERY | Genes involved in NEP/NS2 Interacts with the Cellular Export Machinery |
| 0.6 | 19.9 | REACTOME POST NMDA RECEPTOR ACTIVATION EVENTS | Genes involved in Post NMDA receptor activation events |
| 0.5 | 23.5 | REACTOME APC C CDH1 MEDIATED DEGRADATION OF CDC20 AND OTHER APC C CDH1 TARGETED PROTEINS IN LATE MITOSIS EARLY G1 | Genes involved in APC/C:Cdh1 mediated degradation of Cdc20 and other APC/C:Cdh1 targeted proteins in late mitosis/early G1 |
| 0.5 | 2.8 | REACTOME IL 6 SIGNALING | Genes involved in Interleukin-6 signaling |
| 0.4 | 9.5 | REACTOME G BETA GAMMA SIGNALLING THROUGH PLC BETA | Genes involved in G beta:gamma signalling through PLC beta |
| 0.4 | 2.2 | REACTOME RAF MAP KINASE CASCADE | Genes involved in RAF/MAP kinase cascade |
| 0.3 | 3.6 | REACTOME SLBP DEPENDENT PROCESSING OF REPLICATION DEPENDENT HISTONE PRE MRNAS | Genes involved in SLBP Dependent Processing of Replication-Dependent Histone Pre-mRNAs |
| 0.3 | 6.7 | REACTOME DOWNREGULATION OF SMAD2 3 SMAD4 TRANSCRIPTIONAL ACTIVITY | Genes involved in Downregulation of SMAD2/3:SMAD4 transcriptional activity |
| 0.3 | 3.7 | REACTOME REGULATION OF IFNA SIGNALING | Genes involved in Regulation of IFNA signaling |
| 0.3 | 1.8 | REACTOME INHIBITION OF REPLICATION INITIATION OF DAMAGED DNA BY RB1 E2F1 | Genes involved in Inhibition of replication initiation of damaged DNA by RB1/E2F1 |
| 0.3 | 32.8 | REACTOME G ALPHA S SIGNALLING EVENTS | Genes involved in G alpha (s) signalling events |
| 0.3 | 4.2 | REACTOME REGULATION OF AMPK ACTIVITY VIA LKB1 | Genes involved in Regulation of AMPK activity via LKB1 |
| 0.3 | 44.1 | REACTOME ANTIGEN PROCESSING UBIQUITINATION PROTEASOME DEGRADATION | Genes involved in Antigen processing: Ubiquitination & Proteasome degradation |
| 0.3 | 5.3 | REACTOME RNA POL III TRANSCRIPTION INITIATION FROM TYPE 3 PROMOTER | Genes involved in RNA Polymerase III Transcription Initiation From Type 3 Promoter |
| 0.2 | 8.1 | REACTOME PHOSPHOLIPID METABOLISM | Genes involved in Phospholipid metabolism |
| 0.2 | 9.1 | REACTOME RNA POL II TRANSCRIPTION PRE INITIATION AND PROMOTER OPENING | Genes involved in RNA Polymerase II Transcription Pre-Initiation And Promoter Opening |
| 0.2 | 3.9 | REACTOME PROTEOLYTIC CLEAVAGE OF SNARE COMPLEX PROTEINS | Genes involved in Proteolytic cleavage of SNARE complex proteins |
| 0.2 | 1.4 | REACTOME RNA POL I PROMOTER OPENING | Genes involved in RNA Polymerase I Promoter Opening |
| 0.2 | 1.9 | REACTOME ER PHAGOSOME PATHWAY | Genes involved in ER-Phagosome pathway |
| 0.2 | 7.1 | REACTOME STRIATED MUSCLE CONTRACTION | Genes involved in Striated Muscle Contraction |
| 0.2 | 5.9 | REACTOME INTRINSIC PATHWAY FOR APOPTOSIS | Genes involved in Intrinsic Pathway for Apoptosis |
| 0.2 | 6.9 | REACTOME ANTIVIRAL MECHANISM BY IFN STIMULATED GENES | Genes involved in Antiviral mechanism by IFN-stimulated genes |
| 0.2 | 8.8 | REACTOME O LINKED GLYCOSYLATION OF MUCINS | Genes involved in O-linked glycosylation of mucins |
| 0.2 | 3.9 | REACTOME G1 PHASE | Genes involved in G1 Phase |
| 0.2 | 7.8 | REACTOME CHEMOKINE RECEPTORS BIND CHEMOKINES | Genes involved in Chemokine receptors bind chemokines |
| 0.1 | 4.5 | REACTOME NOD1 2 SIGNALING PATHWAY | Genes involved in NOD1/2 Signaling Pathway |
| 0.1 | 2.5 | REACTOME NEPHRIN INTERACTIONS | Genes involved in Nephrin interactions |
| 0.1 | 1.5 | REACTOME REGULATION OF PYRUVATE DEHYDROGENASE PDH COMPLEX | Genes involved in Regulation of pyruvate dehydrogenase (PDH) complex |
| 0.1 | 1.6 | REACTOME KERATAN SULFATE BIOSYNTHESIS | Genes involved in Keratan sulfate biosynthesis |
| 0.1 | 0.7 | REACTOME GENERATION OF SECOND MESSENGER MOLECULES | Genes involved in Generation of second messenger molecules |
| 0.1 | 1.2 | REACTOME GABA SYNTHESIS RELEASE REUPTAKE AND DEGRADATION | Genes involved in GABA synthesis, release, reuptake and degradation |
| 0.0 | 2.3 | REACTOME VOLTAGE GATED POTASSIUM CHANNELS | Genes involved in Voltage gated Potassium channels |
| 0.0 | 0.6 | REACTOME AMINO ACID SYNTHESIS AND INTERCONVERSION TRANSAMINATION | Genes involved in Amino acid synthesis and interconversion (transamination) |
| 0.0 | 2.4 | REACTOME FACTORS INVOLVED IN MEGAKARYOCYTE DEVELOPMENT AND PLATELET PRODUCTION | Genes involved in Factors involved in megakaryocyte development and platelet production |