Project
GSE53960: rat RNA-Seq transcriptomic Bodymap
Navigation
Downloads
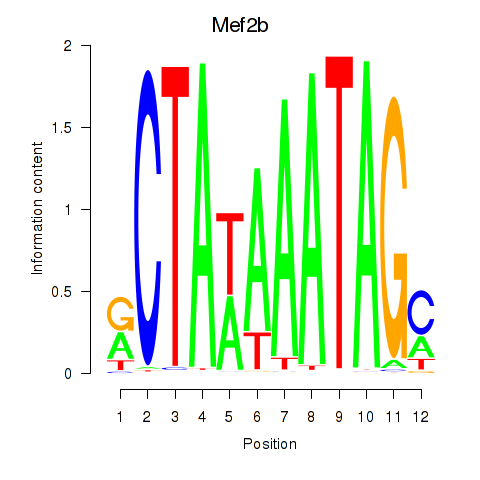
Results for Mef2b
Z-value: 1.96
Motif logo
Transcription factors associated with Mef2b
| Gene Symbol | Gene ID | Gene Info |
|---|---|---|
|
Mef2b
|
ENSRNOG00000020400 | myocyte enhancer factor 2B |
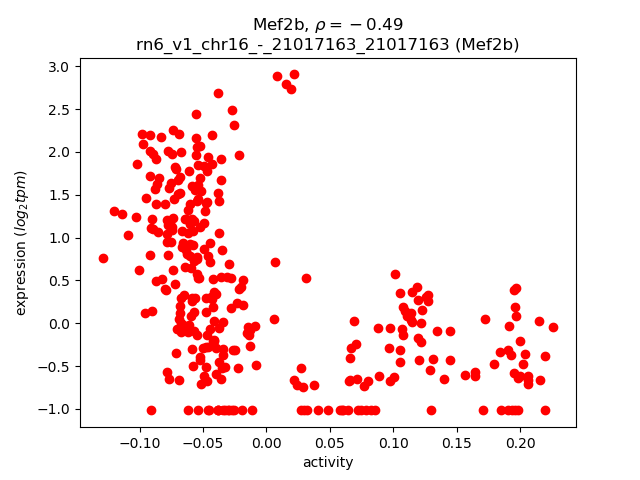
Activity-expression correlation:
| Gene | Promoter | Pearson corr. coef. | P-value | Plot |
|---|---|---|---|---|
| Mef2b | rn6_v1_chr16_-_21017163_21017163 | -0.49 | 3.7e-21 | Click! |
Activity profile of Mef2b motif
Sorted Z-values of Mef2b motif
| Promoter | Log-likelihood | Transcript | Gene | Gene Info |
|---|---|---|---|---|
| chr2_-_227207584 | 117.86 |
ENSRNOT00000065361
ENSRNOT00000080215 |
Myoz2
|
myozenin 2 |
| chr9_+_37727942 | 111.61 |
ENSRNOT00000016511
ENSRNOT00000074276 |
LOC100912306
|
myotilin-like |
| chr1_+_199449973 | 107.89 |
ENSRNOT00000029994
|
Trim72
|
tripartite motif containing 72 |
| chr10_+_54352270 | 103.08 |
ENSRNOT00000036752
|
Dhrs7c
|
dehydrogenase/reductase 7C |
| chr18_+_35574002 | 98.96 |
ENSRNOT00000093442
ENSRNOT00000070817 ENSRNOT00000093356 |
Myot
|
myotilin |
| chr6_-_60124274 | 98.16 |
ENSRNOT00000059823
|
Lsmem1
|
leucine-rich single-pass membrane protein 1 |
| chr1_-_199624783 | 91.41 |
ENSRNOT00000026908
|
Cox6a2
|
cytochrome c oxidase subunit 6A2 |
| chr1_-_104166367 | 90.92 |
ENSRNOT00000092211
|
Csrp3
|
cysteine and glycine rich protein 3 |
| chr3_+_55910177 | 88.49 |
ENSRNOT00000009969
|
Klhl41
|
kelch-like family member 41 |
| chr9_-_73948583 | 88.09 |
ENSRNOT00000018097
|
Myl1
|
myosin, light chain 1 |
| chrX_-_31780425 | 85.15 |
ENSRNOT00000004693
|
Asb9
|
ankyrin repeat and SOCS box-containing 9 |
| chr1_+_215609645 | 81.97 |
ENSRNOT00000076140
ENSRNOT00000027487 |
Tnni2
|
troponin I2, fast skeletal type |
| chr3_+_53563194 | 80.39 |
ENSRNOT00000048300
|
Xirp2
|
xin actin-binding repeat containing 2 |
| chrX_-_64726210 | 79.27 |
ENSRNOT00000076012
ENSRNOT00000086265 |
Asb12
|
ankyrin repeat and SOCS box-containing 12 |
| chr5_+_90338795 | 79.14 |
ENSRNOT00000077864
ENSRNOT00000058882 |
LOC298139
|
similar to RIKEN cDNA 2310003M01 |
| chrX_-_40086870 | 77.67 |
ENSRNOT00000010027
|
Smpx
|
small muscle protein, X-linked |
| chr1_+_142883040 | 76.60 |
ENSRNOT00000015898
|
Alpk3
|
alpha-kinase 3 |
| chr15_-_27819376 | 75.94 |
ENSRNOT00000067400
|
A930018M24Rik
|
RIKEN cDNA A930018M24 gene |
| chr10_+_53781239 | 74.86 |
ENSRNOT00000082871
|
Myh2
|
myosin heavy chain 2 |
| chr1_+_101324652 | 73.71 |
ENSRNOT00000028116
|
Hrc
|
histidine rich calcium binding protein |
| chr2_-_45518502 | 72.92 |
ENSRNOT00000014627
|
Hspb3
|
heat shock protein family B (small) member 3 |
| chr8_+_110982777 | 72.48 |
ENSRNOT00000010992
|
Ky
|
kyphoscoliosis peptidase |
| chr12_+_45905371 | 71.90 |
ENSRNOT00000039275
|
Hspb8
|
heat shock protein family B (small) member 8 |
| chr1_+_215609036 | 66.12 |
ENSRNOT00000076187
|
Tnni2
|
troponin I2, fast skeletal type |
| chr15_+_4077091 | 65.54 |
ENSRNOT00000011554
|
Myoz1
|
myozenin 1 |
| chr3_-_37854561 | 63.96 |
ENSRNOT00000076095
|
Neb
|
nebulin |
| chr2_+_204512302 | 63.55 |
ENSRNOT00000021846
|
Casq2
|
calsequestrin 2 |
| chr5_+_154598758 | 61.58 |
ENSRNOT00000015776
|
Tcea3
|
transcription elongation factor A3 |
| chr16_+_2537248 | 61.37 |
ENSRNOT00000017995
|
Asb14
|
ankyrin repeat and SOCS box-containing 14 |
| chr5_+_152533349 | 58.45 |
ENSRNOT00000067524
|
Trim63
|
tripartite motif containing 63 |
| chr15_-_28314459 | 56.53 |
ENSRNOT00000042055
ENSRNOT00000040540 |
Ndrg2
|
NDRG family member 2 |
| chr16_+_49266903 | 54.92 |
ENSRNOT00000014704
|
Slc25a4
|
solute carrier family 25 member 4 |
| chr8_+_130416355 | 54.04 |
ENSRNOT00000026234
|
Klhl40
|
kelch-like family member 40 |
| chrM_-_14061 | 53.96 |
ENSRNOT00000051268
|
Mt-nd6
|
mitochondrially encoded NADH dehydrogenase 6 |
| chr5_-_22769907 | 53.17 |
ENSRNOT00000047805
ENSRNOT00000076167 ENSRNOT00000076507 ENSRNOT00000076113 ENSRNOT00000083779 |
Asph
|
aspartate-beta-hydroxylase |
| chr10_-_82785142 | 53.00 |
ENSRNOT00000005381
|
Sgca
|
sarcoglycan, alpha |
| chr14_-_17171580 | 51.32 |
ENSRNOT00000085525
|
Art3
|
ADP-ribosyltransferase 3 |
| chr9_+_98490608 | 49.11 |
ENSRNOT00000027232
|
Klhl30
|
kelch-like family member 30 |
| chr10_-_62699723 | 47.79 |
ENSRNOT00000086706
|
Coro6
|
coronin 6 |
| chr17_-_389967 | 45.96 |
ENSRNOT00000023865
|
Fbp2
|
fructose-bisphosphatase 2 |
| chr2_+_119197239 | 45.64 |
ENSRNOT00000048030
|
Usp13
|
ubiquitin specific peptidase 13 |
| chr15_+_4064706 | 45.09 |
ENSRNOT00000011956
|
Synpo2l
|
synaptopodin 2-like |
| chr4_+_71675383 | 45.07 |
ENSRNOT00000051265
|
Clcn1
|
chloride voltage-gated channel 1 |
| chr2_+_198655437 | 42.29 |
ENSRNOT00000028781
|
Hfe2
|
hemochromatosis type 2 (juvenile) |
| chr3_+_112228919 | 42.07 |
ENSRNOT00000011761
|
Capn3
|
calpain 3 |
| chr13_-_90602365 | 41.58 |
ENSRNOT00000009344
|
Casq1
|
calsequestrin 1 |
| chr2_-_216443518 | 39.79 |
ENSRNOT00000022496
|
Amy1a
|
amylase, alpha 1A |
| chr1_-_76722965 | 39.13 |
ENSRNOT00000052129
|
LOC100912485
|
alcohol sulfotransferase-like |
| chr10_-_109729019 | 36.34 |
ENSRNOT00000054959
|
Ppp1r27
|
protein phosphatase 1, regulatory subunit 27 |
| chr6_+_73553210 | 36.31 |
ENSRNOT00000006562
|
Akap6
|
A-kinase anchoring protein 6 |
| chr15_-_37325178 | 36.30 |
ENSRNOT00000011699
|
Gja3
|
gap junction protein, alpha 3 |
| chr3_+_112228720 | 36.12 |
ENSRNOT00000079079
|
Capn3
|
calpain 3 |
| chr2_-_53185926 | 36.02 |
ENSRNOT00000081558
|
Ghr
|
growth hormone receptor |
| chr10_+_39655455 | 35.58 |
ENSRNOT00000058817
|
Acsl6
|
acyl-CoA synthetase long-chain family member 6 |
| chr16_+_31734944 | 35.40 |
ENSRNOT00000059673
|
Palld
|
palladin, cytoskeletal associated protein |
| chrX_+_71342775 | 34.19 |
ENSRNOT00000004888
|
Itgb1bp2
|
integrin subunit beta 1 binding protein 2 |
| chr7_-_98197087 | 33.75 |
ENSRNOT00000010484
ENSRNOT00000079961 |
Klhl38
|
kelch-like family member 38 |
| chrM_+_14136 | 33.05 |
ENSRNOT00000042098
|
Mt-cyb
|
mitochondrially encoded cytochrome b |
| chr1_-_76614279 | 32.61 |
ENSRNOT00000041367
ENSRNOT00000089371 |
LOC100912485
|
alcohol sulfotransferase-like |
| chr17_+_72218769 | 32.17 |
ENSRNOT00000041346
|
Atp5c1
|
ATP synthase, H+ transporting, mitochondrial F1 complex, gamma polypeptide 1 |
| chr1_-_48563776 | 31.21 |
ENSRNOT00000023368
|
Plg
|
plasminogen |
| chr1_+_31531143 | 27.77 |
ENSRNOT00000034704
|
Lrrc14b
|
leucine rich repeat containing 14B |
| chr5_+_147476221 | 25.20 |
ENSRNOT00000010730
|
Sync
|
syncoilin, intermediate filament protein |
| chr17_+_76002275 | 25.11 |
ENSRNOT00000092665
ENSRNOT00000086701 |
Echdc3
|
enoyl CoA hydratase domain containing 3 |
| chr3_+_79940561 | 24.56 |
ENSRNOT00000016652
|
Mybpc3
|
myosin binding protein C, cardiac |
| chr2_+_11658568 | 24.45 |
ENSRNOT00000076408
ENSRNOT00000076416 ENSRNOT00000076992 ENSRNOT00000075931 ENSRNOT00000076136 ENSRNOT00000076481 ENSRNOT00000076084 ENSRNOT00000076230 ENSRNOT00000076710 ENSRNOT00000076239 |
Mef2c
|
myocyte enhancer factor 2C |
| chr16_+_54386513 | 20.98 |
ENSRNOT00000080696
|
AABR07025896.1
|
|
| chr16_-_73827488 | 20.96 |
ENSRNOT00000064070
|
Ank1
|
ankyrin 1 |
| chr1_-_259287684 | 20.71 |
ENSRNOT00000054724
|
Cyp2c22
|
cytochrome P450, family 2, subfamily c, polypeptide 22 |
| chr9_+_82571269 | 20.41 |
ENSRNOT00000026941
|
Speg
|
SPEG complex locus |
| chr11_-_61470348 | 19.77 |
ENSRNOT00000083841
|
LOC102553099
|
N-alpha-acetyltransferase 50-like |
| chr4_+_144192989 | 19.20 |
ENSRNOT00000007523
|
Lmcd1
|
LIM and cysteine-rich domains 1 |
| chr1_-_251365385 | 19.01 |
ENSRNOT00000031923
|
LOC103691072
|
cytochrome P450 2B15-like |
| chr15_+_19603288 | 18.96 |
ENSRNOT00000035491
|
LOC102552640
|
REST corepressor 2-like |
| chr5_-_17061361 | 18.52 |
ENSRNOT00000089318
|
Penk
|
proenkephalin |
| chr5_+_8876044 | 18.50 |
ENSRNOT00000008877
|
Cops5
|
COP9 signalosome subunit 5 |
| chr3_+_112173907 | 18.33 |
ENSRNOT00000011369
|
Ganc
|
glucosidase, alpha; neutral C |
| chr6_-_107461041 | 18.18 |
ENSRNOT00000058127
|
Heatr4
|
HEAT repeat containing 4 |
| chr15_+_41448064 | 17.84 |
ENSRNOT00000019551
|
Sacs
|
sacsin molecular chaperone |
| chr5_+_151776004 | 17.60 |
ENSRNOT00000009683
|
Nr0b2
|
nuclear receptor subfamily 0, group B, member 2 |
| chr19_+_52313795 | 17.38 |
ENSRNOT00000021630
|
Wfdc1
|
WAP four-disulfide core domain 1 |
| chr9_-_50762082 | 16.65 |
ENSRNOT00000015492
|
Mettl21c
|
methyltransferase like 21C |
| chr1_+_83573032 | 16.61 |
ENSRNOT00000083650
|
AC142154.2
|
|
| chr5_+_15043955 | 16.27 |
ENSRNOT00000047093
|
Rp1
|
retinitis pigmentosa 1 |
| chr1_-_251338358 | 16.23 |
ENSRNOT00000002054
|
Cyp2b15
|
cytochrome P450, family 2, subfamily b, polypeptide 15 |
| chr15_+_42653148 | 15.52 |
ENSRNOT00000022095
|
Clu
|
clusterin |
| chr5_-_39611053 | 15.00 |
ENSRNOT00000046595
|
Fhl5
|
four and a half LIM domains 5 |
| chr3_+_56056925 | 14.31 |
ENSRNOT00000088351
ENSRNOT00000010508 |
Klhl23
|
kelch-like family member 23 |
| chr14_-_44524252 | 13.56 |
ENSRNOT00000003779
|
Lias
|
lipoic acid synthetase |
| chr2_+_196334626 | 12.88 |
ENSRNOT00000050914
ENSRNOT00000028645 ENSRNOT00000090729 |
Sema6c
|
semaphorin 6C |
| chr5_-_17061837 | 12.86 |
ENSRNOT00000011892
|
Penk
|
proenkephalin |
| chr2_-_216382244 | 12.76 |
ENSRNOT00000086695
ENSRNOT00000087259 |
LOC103689940
|
pancreatic alpha-amylase-like |
| chr1_+_247110216 | 12.34 |
ENSRNOT00000016000
|
Cdc37l1
|
cell division cycle 37-like 1 |
| chr6_+_91532467 | 12.08 |
ENSRNOT00000082500
ENSRNOT00000064668 |
Klhdc1
|
kelch domain containing 1 |
| chr2_-_261337163 | 12.07 |
ENSRNOT00000030341
|
Tnni3k
|
TNNI3 interacting kinase |
| chr3_+_147358858 | 11.77 |
ENSRNOT00000012951
|
Rspo4
|
R-spondin 4 |
| chr17_-_47394231 | 11.27 |
ENSRNOT00000079368
ENSRNOT00000079216 |
Sfrp4
|
secreted frizzled-related protein 4 |
| chr4_+_148782479 | 10.76 |
ENSRNOT00000018133
|
LOC500300
|
similar to hypothetical protein MGC6835 |
| chr3_+_2894702 | 10.36 |
ENSRNOT00000028997
|
Lcn10
|
lipocalin 10 |
| chr9_-_15274917 | 10.28 |
ENSRNOT00000019650
|
Pgc
|
progastricsin |
| chr6_+_107460668 | 10.19 |
ENSRNOT00000013515
|
Acot2
|
acyl-CoA thioesterase 2 |
| chr13_+_109909053 | 10.15 |
ENSRNOT00000090541
|
AC125873.1
|
|
| chr17_+_18031228 | 10.06 |
ENSRNOT00000081708
|
Tpmt
|
thiopurine S-methyltransferase |
| chr1_+_218945508 | 9.96 |
ENSRNOT00000034240
|
RGD1311946
|
similar to RIKEN cDNA 1810055G02 |
| chr17_-_10559627 | 9.88 |
ENSRNOT00000023515
|
Higd2a
|
HIG1 hypoxia inducible domain family, member 2A |
| chr3_+_134440195 | 9.83 |
ENSRNOT00000072928
|
AABR07054000.1
|
|
| chr15_-_49505553 | 9.81 |
ENSRNOT00000028974
|
Adamdec1
|
ADAM-like, decysin 1 |
| chr1_-_153752541 | 9.64 |
ENSRNOT00000080927
|
Prss23
|
protease, serine, 23 |
| chr10_-_51576376 | 9.60 |
ENSRNOT00000004829
|
Arhgap44
|
Rho GTPase activating protein 44 |
| chr1_+_84411726 | 9.39 |
ENSRNOT00000025303
|
Akt2
|
AKT serine/threonine kinase 2 |
| chr1_-_56683731 | 8.93 |
ENSRNOT00000014552
|
Thbs2
|
thrombospondin 2 |
| chr14_-_21810314 | 8.91 |
ENSRNOT00000002671
|
Csn3
|
casein kappa |
| chr1_+_80279706 | 8.88 |
ENSRNOT00000047105
|
Ppp1r13l
|
protein phosphatase 1, regulatory subunit 13 like |
| chr1_+_168224275 | 8.87 |
ENSRNOT00000049645
|
Olr77
|
olfactory receptor 77 |
| chr10_-_31712924 | 8.85 |
ENSRNOT00000067312
|
Dppa1
|
developmental pluripotency associated 1 |
| chr3_+_103657115 | 8.71 |
ENSRNOT00000075514
|
Olr796
|
olfactory receptor 796 |
| chr4_+_39747447 | 8.67 |
ENSRNOT00000028952
|
Tas2r7l
|
taste receptor type 2 member 7-like |
| chr2_-_172361779 | 8.65 |
ENSRNOT00000085876
|
Schip1
|
schwannomin interacting protein 1 |
| chr4_-_157486844 | 8.39 |
ENSRNOT00000038281
ENSRNOT00000022874 |
Cops7a
|
COP9 signalosome subunit 7A |
| chr5_-_64818813 | 8.22 |
ENSRNOT00000009111
ENSRNOT00000086505 |
Aldob
|
aldolase, fructose-bisphosphate B |
| chr14_-_21960871 | 8.09 |
ENSRNOT00000085234
|
Stath
|
statherin |
| chr20_+_13778178 | 8.08 |
ENSRNOT00000058314
|
Gstt4
|
glutathione S-transferase, theta 4 |
| chr9_-_24509761 | 7.95 |
ENSRNOT00000060793
|
Defb17
|
defensin beta 17 |
| chr10_-_62393673 | 7.92 |
ENSRNOT00000070956
|
LOC100909578
|
olfactory receptor 1496-like |
| chr15_+_27279819 | 7.57 |
ENSRNOT00000040603
|
Olr1617
|
olfactory receptor 1617 |
| chr8_-_43283766 | 7.54 |
ENSRNOT00000060093
|
Olr1306
|
olfactory receptor 1306 |
| chrX_-_70946565 | 7.46 |
ENSRNOT00000076819
|
Tex11
|
testis expressed 11 |
| chr4_-_164253109 | 7.32 |
ENSRNOT00000085454
|
AABR07062185.2
|
|
| chr1_-_171045419 | 7.09 |
ENSRNOT00000047239
|
Olr224
|
olfactory receptor 224 |
| chr1_-_67134827 | 7.07 |
ENSRNOT00000045214
|
Vom1r45
|
vomeronasal 1 receptor 45 |
| chr14_-_43072843 | 6.90 |
ENSRNOT00000064263
|
Limch1
|
LIM and calponin homology domains 1 |
| chr15_+_61673560 | 6.83 |
ENSRNOT00000093661
|
Mtrf1
|
mitochondrial translation release factor 1 |
| chr1_+_168204985 | 6.78 |
ENSRNOT00000049036
|
Olr75
|
olfactory receptor 75 |
| chr7_+_40316639 | 6.78 |
ENSRNOT00000080150
|
LOC500827
|
similar to hypothetical protein FLJ35821 |
| chrX_+_73475049 | 6.64 |
ENSRNOT00000050601
|
Zfp36l3
|
zinc finger protein 36, C3H type-like 3 |
| chr4_+_7258176 | 6.60 |
ENSRNOT00000061992
|
Tmub1
|
transmembrane and ubiquitin-like domain containing 1 |
| chr1_-_263718745 | 6.55 |
ENSRNOT00000074810
|
Dnmbp
|
dynamin binding protein |
| chr16_+_51748970 | 6.54 |
ENSRNOT00000059182
|
Adam26a
|
a disintegrin and metallopeptidase domain 26A |
| chr8_+_117062884 | 6.53 |
ENSRNOT00000082452
ENSRNOT00000071540 |
Nicn1
|
nicolin 1 |
| chr1_+_168136959 | 6.33 |
ENSRNOT00000020953
|
Olr68
|
olfactory receptor 68 |
| chr15_-_28044210 | 6.29 |
ENSRNOT00000033809
|
Rnase1l1
|
ribonuclease, RNase A family, 1-like 1 (pancreatic) |
| chr10_-_44376221 | 6.10 |
ENSRNOT00000071834
|
Olr1436
|
olfactory receptor 1436 |
| chr4_-_62840357 | 6.08 |
ENSRNOT00000059892
|
Slc13a4
|
solute carrier family 13 member 4 |
| chr15_+_80040842 | 6.05 |
ENSRNOT00000043065
|
RGD1306441
|
similar to RIKEN cDNA 4921530L21 |
| chr20_+_27975549 | 6.04 |
ENSRNOT00000092075
|
Lims1
|
LIM zinc finger domain containing 1 |
| chr8_-_43908914 | 5.99 |
ENSRNOT00000072247
|
Olr1338
|
olfactory receptor 1338 |
| chr3_-_30930141 | 5.92 |
ENSRNOT00000037001
|
AABR07051982.1
|
|
| chr2_+_188784222 | 5.91 |
ENSRNOT00000028095
|
Pmvk
|
phosphomevalonate kinase |
| chr1_+_83511167 | 5.86 |
ENSRNOT00000041580
ENSRNOT00000084936 |
Cyp2b12
|
cytochrome P450, family 2, subfamily b, polypeptide 12 |
| chr20_+_1185111 | 5.82 |
ENSRNOT00000044130
|
Olr1709
|
olfactory receptor 1709 |
| chr2_-_35485401 | 5.79 |
ENSRNOT00000072751
|
AABR07007931.1
|
|
| chr11_-_1437732 | 5.60 |
ENSRNOT00000037345
|
Csnka2ip
|
casein kinase 2, alpha prime interacting protein |
| chr5_+_99009273 | 5.60 |
ENSRNOT00000033718
|
RGD1306186
|
similar to RIKEN cDNA 4930569K13 |
| chr18_-_31749647 | 5.57 |
ENSRNOT00000044287
|
Nr3c1
|
nuclear receptor subfamily 3, group C, member 1 |
| chr10_-_38969501 | 5.55 |
ENSRNOT00000090691
ENSRNOT00000081309 ENSRNOT00000010029 |
Il4
|
interleukin 4 |
| chr2_-_189903219 | 5.53 |
ENSRNOT00000017000
|
S100a1
|
S100 calcium binding protein A1 |
| chr1_-_167992529 | 5.50 |
ENSRNOT00000067344
|
LOC684170
|
similar to olfactory receptor 566 |
| chr15_+_27421954 | 5.43 |
ENSRNOT00000011632
|
Olr1621
|
olfactory receptor 1621 |
| chr1_-_168819946 | 5.39 |
ENSRNOT00000048499
|
Olr121
|
olfactory receptor 121 |
| chr13_+_92358280 | 5.20 |
ENSRNOT00000048222
|
Olr1598
|
olfactory receptor 1598 |
| chr15_+_35586351 | 5.11 |
ENSRNOT00000045736
|
Olr1292
|
olfactory receptor 1292 |
| chr3_-_73755510 | 5.04 |
ENSRNOT00000083628
|
Olr502
|
olfactory receptor 502 |
| chr10_-_44877626 | 4.98 |
ENSRNOT00000075204
|
LOC100910837
|
olfactory receptor 2AK2-like |
| chr1_-_172486268 | 4.95 |
ENSRNOT00000083135
|
Olr255
|
olfactory receptor 255 |
| chr1_-_101323960 | 4.90 |
ENSRNOT00000041513
|
Trpm4
|
transient receptor potential cation channel, subfamily M, member 4 |
| chr1_+_230268991 | 4.90 |
ENSRNOT00000083727
|
Olr363
|
olfactory receptor 363 |
| chr10_+_34383396 | 4.90 |
ENSRNOT00000047186
|
Olr1386
|
olfactory receptor 1386 |
| chr20_+_572454 | 4.88 |
ENSRNOT00000061839
|
Olr1684
|
olfactory receptor 1684 |
| chr18_+_35291685 | 4.87 |
ENSRNOT00000060114
|
Spink9
|
serine peptidase inhibitor, Kazal type 9 |
| chr19_+_56272162 | 4.84 |
ENSRNOT00000030399
|
Afg3l1
|
AFG3(ATPase family gene 3)-like 1 (S. cerevisiae) |
| chr1_+_169669528 | 4.81 |
ENSRNOT00000073194
|
Olr161
|
olfactory receptor 161 |
| chr1_+_74251167 | 4.76 |
ENSRNOT00000040441
|
Vom2r29
|
vomeronasal 2 receptor, 29 |
| chrX_-_152367861 | 4.67 |
ENSRNOT00000089414
|
LOC103690371
|
melanoma-associated antigen 10-like |
| chr17_+_39156840 | 4.65 |
ENSRNOT00000022447
|
Prl7b1
|
prolactin family 7, subfamily b, member 1 |
| chr9_+_24170858 | 4.60 |
ENSRNOT00000081915
|
AC130064.1
|
|
| chr15_+_35952860 | 4.54 |
ENSRNOT00000077992
|
AC114070.1
|
|
| chr10_-_60504467 | 4.43 |
ENSRNOT00000087783
|
Olr1496
|
olfactory receptor 1496 |
| chr20_+_3830164 | 4.41 |
ENSRNOT00000045533
ENSRNOT00000084117 |
Col11a2
|
collagen type XI alpha 2 chain |
| chr10_+_103543895 | 4.40 |
ENSRNOT00000077882
|
Cd300ld
|
Cd300 molecule-like family member D |
| chr1_-_90149991 | 4.40 |
ENSRNOT00000076987
|
RGD1308428
|
similar to RIKEN cDNA 4931406P16 |
| chr8_+_79781983 | 4.37 |
ENSRNOT00000079458
|
Khdc3
|
KH domain containing 3, subcortical maternal complex member |
| chr4_+_1566448 | 4.36 |
ENSRNOT00000088227
|
Olr1243
|
olfactory receptor 1243 |
| chr3_-_74371385 | 4.36 |
ENSRNOT00000041668
|
Olr518
|
olfactory receptor 518 |
| chr14_-_21758788 | 4.29 |
ENSRNOT00000038520
|
2310003L06Rik
|
RIKEN cDNA 2310003L06 gene |
| chr3_-_14112851 | 4.23 |
ENSRNOT00000092736
|
C5
|
complement C5 |
| chr3_+_102841615 | 4.19 |
ENSRNOT00000075178
|
Olr770
|
olfactory receptor 770 |
| chr3_-_173944396 | 4.11 |
ENSRNOT00000079019
|
Sycp2
|
synaptonemal complex protein 2 |
| chr1_+_169683311 | 4.00 |
ENSRNOT00000075826
|
Olr162
|
olfactory receptor 162 |
| chr10_-_62366044 | 3.92 |
ENSRNOT00000045673
|
Olr1474
|
olfactory receptor 1474 |
| chr13_+_67545430 | 3.89 |
ENSRNOT00000003405
|
Pdc
|
phosducin |
| chr1_+_55219773 | 3.89 |
ENSRNOT00000041610
|
RGD1561667
|
similar to putative protein kinase |
| chr4_-_121811539 | 3.86 |
ENSRNOT00000049591
|
Vom1r94
|
vomeronasal 1 receptor 94 |
| chr3_+_102683148 | 3.80 |
ENSRNOT00000046220
|
RGD1566059
|
similar to olfactory receptor Olfr1289 |
| chr14_-_21748356 | 3.79 |
ENSRNOT00000002670
|
Cabs1
|
calcium binding protein, spermatid associated 1 |
| chr1_+_79396578 | 3.67 |
ENSRNOT00000023686
|
Ceacam11
|
carcinoembryonic antigen-related cell adhesion molecule 11 |
| chr13_+_93751759 | 3.65 |
ENSRNOT00000065706
|
Wdr64
|
WD repeat domain 64 |
| chr14_-_19072677 | 3.63 |
ENSRNOT00000060548
|
LOC360919
|
similar to alpha-fetoprotein |
| chr2_+_150106292 | 3.62 |
ENSRNOT00000073078
|
LOC100910567
|
arylacetamide deacetylase-like 2-like |
| chr1_+_213511874 | 3.56 |
ENSRNOT00000078080
ENSRNOT00000016883 |
Cyp2e1
|
cytochrome P450, family 2, subfamily e, polypeptide 1 |
| chr13_-_80819218 | 3.56 |
ENSRNOT00000072922
|
Fmo6
|
flavin containing monooxygenase 6 |
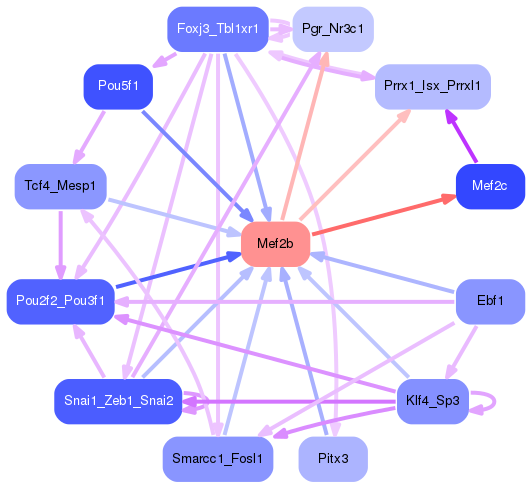
Network of associatons between targets according to the STRING database.

First level regulatory network of Mef2b
Gene Ontology Analysis
Gene overrepresentation in biological process category:
| Log-likelihood per target | Total log-likelihood | Term | Description |
|---|---|---|---|
| 30.3 | 90.9 | GO:1903918 | regulation of actin filament severing(GO:1903918) negative regulation of actin filament severing(GO:1903919) |
| 26.1 | 78.2 | GO:1990091 | sodium-dependent self proteolysis(GO:1990091) |
| 24.6 | 73.7 | GO:1990036 | calcium ion import into sarcoplasmic reticulum(GO:1990036) |
| 14.1 | 56.5 | GO:0090361 | platelet-derived growth factor production(GO:0090360) regulation of platelet-derived growth factor production(GO:0090361) |
| 14.1 | 182.8 | GO:0001778 | plasma membrane repair(GO:0001778) |
| 13.7 | 54.9 | GO:2000277 | positive regulation of oxidative phosphorylation uncoupler activity(GO:2000277) |
| 11.9 | 35.6 | GO:0010747 | positive regulation of plasma membrane long-chain fatty acid transport(GO:0010747) |
| 11.7 | 58.5 | GO:0014878 | response to electrical stimulus involved in regulation of muscle adaptation(GO:0014878) |
| 11.5 | 46.0 | GO:0046351 | disaccharide biosynthetic process(GO:0046351) |
| 11.4 | 45.6 | GO:0036506 | protein K29-linked deubiquitination(GO:0035523) maintenance of unfolded protein(GO:0036506) protein K6-linked deubiquitination(GO:0044313) maintenance of unfolded protein involved in ERAD pathway(GO:1904378) |
| 10.8 | 54.0 | GO:0098528 | skeletal muscle fiber differentiation(GO:0098528) |
| 10.6 | 53.2 | GO:0042264 | peptidyl-aspartic acid hydroxylation(GO:0042264) |
| 10.6 | 63.5 | GO:0071313 | cellular response to caffeine(GO:0071313) |
| 10.5 | 31.4 | GO:0051867 | general adaptation syndrome, behavioral process(GO:0051867) |
| 10.4 | 31.2 | GO:0052047 | interaction with other organism via secreted substance involved in symbiotic interaction(GO:0052047) |
| 10.4 | 41.6 | GO:0014809 | regulation of skeletal muscle contraction by regulation of release of sequestered calcium ion(GO:0014809) |
| 9.1 | 36.3 | GO:1902261 | positive regulation of delayed rectifier potassium channel activity(GO:1902261) |
| 8.1 | 24.4 | GO:2001016 | positive regulation of skeletal muscle cell differentiation(GO:2001016) |
| 7.6 | 91.4 | GO:0006123 | mitochondrial electron transport, cytochrome c to oxygen(GO:0006123) |
| 6.3 | 88.5 | GO:2001014 | regulation of skeletal muscle cell differentiation(GO:2001014) |
| 5.2 | 15.5 | GO:1902996 | regulation of neuronal signal transduction(GO:1902847) positive regulation of tau-protein kinase activity(GO:1902949) neurofibrillary tangle assembly(GO:1902988) regulation of neurofibrillary tangle assembly(GO:1902996) positive regulation of neurofibrillary tangle assembly(GO:1902998) |
| 5.0 | 94.1 | GO:0010880 | regulation of release of sequestered calcium ion into cytosol by sarcoplasmic reticulum(GO:0010880) |
| 4.9 | 4.9 | GO:0086047 | membrane depolarization during Purkinje myocyte cell action potential(GO:0086047) |
| 4.5 | 13.6 | GO:0009106 | lipoate metabolic process(GO:0009106) |
| 4.4 | 53.0 | GO:0014877 | response to muscle inactivity involved in regulation of muscle adaptation(GO:0014877) response to denervation involved in regulation of muscle adaptation(GO:0014894) |
| 4.1 | 33.0 | GO:0033590 | response to cobalamin(GO:0033590) |
| 4.0 | 36.0 | GO:0046449 | allantoin metabolic process(GO:0000255) isoleucine metabolic process(GO:0006549) creatine metabolic process(GO:0006600) creatinine metabolic process(GO:0046449) |
| 3.8 | 11.3 | GO:2000118 | regulation of sodium-dependent phosphate transport(GO:2000118) |
| 3.8 | 45.1 | GO:0098870 | neuronal action potential propagation(GO:0019227) action potential propagation(GO:0098870) |
| 3.3 | 148.1 | GO:0003009 | skeletal muscle contraction(GO:0003009) |
| 3.3 | 193.5 | GO:0030239 | myofibril assembly(GO:0030239) |
| 3.1 | 9.4 | GO:1990009 | response to high light intensity(GO:0009644) retinal cell apoptotic process(GO:1990009) |
| 2.8 | 5.5 | GO:1901387 | positive regulation of voltage-gated calcium channel activity(GO:1901387) |
| 2.7 | 8.2 | GO:0006116 | NADH oxidation(GO:0006116) |
| 2.6 | 42.3 | GO:0016540 | protein autoprocessing(GO:0016540) |
| 2.4 | 26.9 | GO:0000338 | protein deneddylation(GO:0000338) |
| 2.4 | 9.6 | GO:0098886 | modification of dendritic spine(GO:0098886) |
| 2.1 | 35.4 | GO:0003334 | keratinocyte development(GO:0003334) |
| 2.1 | 10.3 | GO:0002803 | positive regulation of antimicrobial peptide production(GO:0002225) positive regulation of antibacterial peptide production(GO:0002803) |
| 2.0 | 5.9 | GO:0019287 | isopentenyl diphosphate biosynthetic process, mevalonate pathway(GO:0019287) |
| 1.8 | 5.5 | GO:2000424 | T-helper 1 cell lineage commitment(GO:0002296) cellular response to mercury ion(GO:0071288) negative regulation of complement-dependent cytotoxicity(GO:1903660) regulation of eosinophil chemotaxis(GO:2000422) positive regulation of eosinophil chemotaxis(GO:2000424) |
| 1.7 | 3.4 | GO:0090118 | receptor-mediated endocytosis of low-density lipoprotein particle involved in cholesterol transport(GO:0090118) |
| 1.6 | 17.8 | GO:0090084 | negative regulation of inclusion body assembly(GO:0090084) |
| 1.6 | 19.2 | GO:0070886 | positive regulation of calcineurin-NFAT signaling cascade(GO:0070886) |
| 1.5 | 40.1 | GO:0006471 | protein ADP-ribosylation(GO:0006471) |
| 1.5 | 80.4 | GO:0055008 | cardiac muscle tissue morphogenesis(GO:0055008) |
| 1.5 | 178.0 | GO:0006941 | striated muscle contraction(GO:0006941) |
| 1.5 | 7.5 | GO:0035822 | meiotic gene conversion(GO:0006311) gene conversion(GO:0035822) |
| 1.5 | 16.3 | GO:0035845 | photoreceptor cell outer segment organization(GO:0035845) |
| 1.4 | 75.0 | GO:0055013 | cardiac muscle cell development(GO:0055013) |
| 1.4 | 72.5 | GO:0007528 | neuromuscular junction development(GO:0007528) |
| 1.3 | 11.8 | GO:0035878 | nail development(GO:0035878) |
| 1.3 | 10.2 | GO:0042760 | very long-chain fatty acid catabolic process(GO:0042760) |
| 1.1 | 32.2 | GO:0015986 | energy coupled proton transport, down electrochemical gradient(GO:0015985) ATP synthesis coupled proton transport(GO:0015986) |
| 1.1 | 30.1 | GO:0019373 | epoxygenase P450 pathway(GO:0019373) |
| 0.9 | 60.5 | GO:0006414 | translational elongation(GO:0006414) |
| 0.9 | 4.4 | GO:0060023 | soft palate development(GO:0060023) |
| 0.9 | 2.6 | GO:0006059 | hexitol metabolic process(GO:0006059) |
| 0.8 | 3.4 | GO:2000292 | regulation of defecation(GO:2000292) negative regulation of defecation(GO:2000293) |
| 0.8 | 65.5 | GO:0031032 | actomyosin structure organization(GO:0031032) |
| 0.8 | 6.0 | GO:2000346 | negative regulation of hepatocyte proliferation(GO:2000346) |
| 0.7 | 2.9 | GO:0006235 | dTTP biosynthetic process(GO:0006235) pyrimidine deoxyribonucleoside triphosphate biosynthetic process(GO:0009212) |
| 0.7 | 2.9 | GO:0051351 | regulation of ligase activity(GO:0051340) positive regulation of ligase activity(GO:0051351) |
| 0.7 | 4.2 | GO:0010760 | negative regulation of macrophage chemotaxis(GO:0010760) |
| 0.7 | 3.5 | GO:0071400 | cellular response to oleic acid(GO:0071400) |
| 0.7 | 4.8 | GO:0034982 | mitochondrial protein processing(GO:0034982) |
| 0.7 | 54.0 | GO:0042220 | response to cocaine(GO:0042220) |
| 0.7 | 4.1 | GO:0048808 | male genitalia morphogenesis(GO:0048808) male anatomical structure morphogenesis(GO:0090598) |
| 0.7 | 36.3 | GO:0009268 | response to pH(GO:0009268) |
| 0.7 | 21.0 | GO:0072661 | protein targeting to plasma membrane(GO:0072661) |
| 0.6 | 25.2 | GO:0045103 | intermediate filament-based process(GO:0045103) |
| 0.6 | 3.3 | GO:1904751 | positive regulation of protein localization to nucleolus(GO:1904751) |
| 0.6 | 6.6 | GO:0061158 | 3'-UTR-mediated mRNA destabilization(GO:0061158) |
| 0.5 | 8.6 | GO:0001553 | luteinization(GO:0001553) |
| 0.5 | 30.9 | GO:0032233 | positive regulation of actin filament bundle assembly(GO:0032233) |
| 0.5 | 1.9 | GO:1903225 | negative regulation of endodermal cell differentiation(GO:1903225) |
| 0.5 | 3.9 | GO:0008616 | queuosine biosynthetic process(GO:0008616) queuosine metabolic process(GO:0046116) |
| 0.5 | 36.3 | GO:0010923 | negative regulation of phosphatase activity(GO:0010923) |
| 0.5 | 6.8 | GO:0006415 | translational termination(GO:0006415) |
| 0.5 | 2.3 | GO:0019405 | alditol catabolic process(GO:0019405) glycerol catabolic process(GO:0019563) |
| 0.4 | 2.5 | GO:0071918 | urea transmembrane transport(GO:0071918) |
| 0.4 | 3.4 | GO:0048664 | neuron fate determination(GO:0048664) |
| 0.4 | 33.8 | GO:0007229 | integrin-mediated signaling pathway(GO:0007229) |
| 0.3 | 251.1 | GO:0016567 | protein ubiquitination(GO:0016567) |
| 0.3 | 17.4 | GO:0061045 | negative regulation of wound healing(GO:0061045) |
| 0.3 | 1.9 | GO:0034475 | U4 snRNA 3'-end processing(GO:0034475) DNA deamination(GO:0045006) polyadenylation-dependent snoRNA 3'-end processing(GO:0071051) |
| 0.2 | 3.9 | GO:0019236 | response to pheromone(GO:0019236) |
| 0.2 | 3.9 | GO:0035404 | histone-serine phosphorylation(GO:0035404) |
| 0.2 | 3.1 | GO:0097094 | craniofacial suture morphogenesis(GO:0097094) |
| 0.2 | 4.4 | GO:0007094 | mitotic spindle assembly checkpoint(GO:0007094) spindle checkpoint(GO:0031577) spindle assembly checkpoint(GO:0071173) mitotic spindle checkpoint(GO:0071174) |
| 0.2 | 6.6 | GO:0030433 | ER-associated ubiquitin-dependent protein catabolic process(GO:0030433) |
| 0.1 | 10.1 | GO:0033574 | response to testosterone(GO:0033574) |
| 0.1 | 176.2 | GO:0050911 | detection of chemical stimulus involved in sensory perception of smell(GO:0050911) |
| 0.1 | 16.7 | GO:0018022 | peptidyl-lysine methylation(GO:0018022) |
| 0.1 | 13.5 | GO:0043433 | negative regulation of sequence-specific DNA binding transcription factor activity(GO:0043433) |
| 0.1 | 7.9 | GO:0090502 | RNA phosphodiester bond hydrolysis, endonucleolytic(GO:0090502) |
| 0.1 | 1.3 | GO:0035269 | protein O-linked mannosylation(GO:0035269) |
| 0.1 | 8.9 | GO:0016525 | negative regulation of angiogenesis(GO:0016525) |
| 0.1 | 1.1 | GO:0070197 | meiotic telomere tethering at nuclear periphery(GO:0044821) meiotic attachment of telomere to nuclear envelope(GO:0070197) chromosome attachment to the nuclear envelope(GO:0097240) |
| 0.1 | 3.3 | GO:0050913 | sensory perception of bitter taste(GO:0050913) |
| 0.1 | 0.9 | GO:0006707 | cholesterol catabolic process(GO:0006707) sterol catabolic process(GO:0016127) |
| 0.1 | 2.2 | GO:0007205 | protein kinase C-activating G-protein coupled receptor signaling pathway(GO:0007205) |
| 0.1 | 0.7 | GO:0002430 | complement receptor mediated signaling pathway(GO:0002430) |
| 0.0 | 2.2 | GO:0071549 | negative regulation of autophagy(GO:0010507) cellular response to dexamethasone stimulus(GO:0071549) |
| 0.0 | 5.3 | GO:0050821 | protein stabilization(GO:0050821) |
| 0.0 | 2.8 | GO:0035023 | regulation of Rho protein signal transduction(GO:0035023) |
| 0.0 | 3.7 | GO:0007565 | female pregnancy(GO:0007565) |
Gene overrepresentation in cellular component category:
| Log-likelihood per target | Total log-likelihood | Term | Description |
|---|---|---|---|
| 34.4 | 103.1 | GO:0014801 | longitudinal sarcoplasmic reticulum(GO:0014801) |
| 26.3 | 105.1 | GO:0033018 | sarcoplasmic reticulum lumen(GO:0033018) |
| 15.5 | 77.7 | GO:0005927 | muscle tendon junction(GO:0005927) |
| 12.3 | 148.1 | GO:0005861 | troponin complex(GO:0005861) |
| 12.1 | 36.3 | GO:0014701 | junctional sarcoplasmic reticulum membrane(GO:0014701) |
| 8.8 | 53.0 | GO:0016012 | sarcoglycan complex(GO:0016012) |
| 8.3 | 74.9 | GO:0005826 | actomyosin contractile ring(GO:0005826) |
| 7.8 | 31.2 | GO:0044218 | other organism cell membrane(GO:0044218) other organism membrane(GO:0044279) |
| 7.2 | 36.0 | GO:0070195 | growth hormone receptor complex(GO:0070195) |
| 7.0 | 42.3 | GO:1990712 | HFE-transferrin receptor complex(GO:1990712) |
| 6.8 | 88.5 | GO:0031143 | pseudopodium(GO:0031143) |
| 6.2 | 1002.0 | GO:0030018 | Z disc(GO:0030018) |
| 5.7 | 91.4 | GO:0005751 | mitochondrial respiratory chain complex IV(GO:0005751) |
| 5.2 | 31.4 | GO:0032280 | symmetric synapse(GO:0032280) |
| 4.5 | 54.0 | GO:0031674 | I band(GO:0031674) |
| 4.0 | 32.2 | GO:0045261 | mitochondrial proton-transporting ATP synthase complex, catalytic core F(1)(GO:0000275) proton-transporting ATP synthase complex, catalytic core F(1)(GO:0045261) |
| 3.4 | 37.4 | GO:0032541 | cortical endoplasmic reticulum(GO:0032541) |
| 2.8 | 33.0 | GO:0045275 | respiratory chain complex III(GO:0045275) |
| 1.7 | 36.3 | GO:0005922 | connexon complex(GO:0005922) |
| 1.7 | 15.5 | GO:0034366 | spherical high-density lipoprotein particle(GO:0034366) |
| 1.6 | 8.2 | GO:0097425 | smooth endoplasmic reticulum membrane(GO:0030868) smooth endoplasmic reticulum part(GO:0097425) |
| 1.6 | 4.8 | GO:0005745 | m-AAA complex(GO:0005745) |
| 1.5 | 4.4 | GO:0005592 | collagen type XI trimer(GO:0005592) |
| 1.3 | 65.4 | GO:0016459 | myosin complex(GO:0016459) |
| 1.3 | 16.3 | GO:0097542 | ciliary tip(GO:0097542) |
| 1.2 | 88.9 | GO:0031463 | Cul3-RING ubiquitin ligase complex(GO:0031463) |
| 0.9 | 9.4 | GO:0032593 | insulin-responsive compartment(GO:0032593) |
| 0.8 | 54.0 | GO:0070469 | respiratory chain(GO:0070469) |
| 0.8 | 45.1 | GO:0034707 | chloride channel complex(GO:0034707) |
| 0.8 | 35.4 | GO:0044295 | axonal growth cone(GO:0044295) |
| 0.7 | 26.9 | GO:0008180 | COP9 signalosome(GO:0008180) |
| 0.7 | 4.2 | GO:0005579 | membrane attack complex(GO:0005579) |
| 0.6 | 7.5 | GO:0000801 | central element(GO:0000801) |
| 0.5 | 4.4 | GO:0045179 | apical cortex(GO:0045179) |
| 0.5 | 90.5 | GO:0005741 | mitochondrial outer membrane(GO:0005741) |
| 0.5 | 2.9 | GO:0005672 | transcription factor TFIIA complex(GO:0005672) |
| 0.5 | 1.9 | GO:0005588 | collagen type V trimer(GO:0005588) |
| 0.5 | 2.3 | GO:0009331 | glycerol-3-phosphate dehydrogenase complex(GO:0009331) |
| 0.4 | 3.4 | GO:0097443 | sorting endosome(GO:0097443) |
| 0.4 | 8.9 | GO:0031091 | platelet alpha granule(GO:0031091) |
| 0.3 | 3.4 | GO:0070852 | cell body fiber(GO:0070852) |
| 0.3 | 2.6 | GO:0033010 | paranodal junction(GO:0033010) |
| 0.3 | 2.2 | GO:0016281 | eukaryotic translation initiation factor 4F complex(GO:0016281) |
| 0.3 | 39.1 | GO:0042383 | sarcolemma(GO:0042383) |
| 0.3 | 4.9 | GO:0034706 | sodium channel complex(GO:0034706) |
| 0.3 | 45.8 | GO:0030426 | growth cone(GO:0030426) |
| 0.2 | 10.1 | GO:0030017 | sarcomere(GO:0030017) |
| 0.2 | 3.9 | GO:0031588 | nucleotide-activated protein kinase complex(GO:0031588) |
| 0.2 | 8.9 | GO:0045171 | intercellular bridge(GO:0045171) |
| 0.2 | 3.5 | GO:0000800 | lateral element(GO:0000800) |
| 0.2 | 1.9 | GO:0000176 | nuclear exosome (RNase complex)(GO:0000176) |
| 0.2 | 1.3 | GO:0001740 | Barr body(GO:0001740) |
| 0.2 | 1.2 | GO:0005638 | lamin filament(GO:0005638) |
| 0.1 | 37.8 | GO:0015629 | actin cytoskeleton(GO:0015629) |
| 0.1 | 3.5 | GO:0005811 | lipid particle(GO:0005811) |
| 0.0 | 0.7 | GO:0043202 | lysosomal lumen(GO:0043202) |
| 0.0 | 10.3 | GO:0000151 | ubiquitin ligase complex(GO:0000151) |
| 0.0 | 3.1 | GO:0005604 | basement membrane(GO:0005604) |
| 0.0 | 1.3 | GO:0005801 | cis-Golgi network(GO:0005801) |
| 0.0 | 1.6 | GO:0031227 | intrinsic component of endoplasmic reticulum membrane(GO:0031227) |
Gene overrepresentation in molecular function category:
| Log-likelihood per target | Total log-likelihood | Term | Description |
|---|---|---|---|
| 39.2 | 274.3 | GO:0031433 | telethonin binding(GO:0031433) |
| 21.2 | 148.1 | GO:0031014 | troponin T binding(GO:0031014) |
| 17.5 | 52.5 | GO:0004556 | alpha-amylase activity(GO:0004556) |
| 11.4 | 45.6 | GO:1904288 | BAT3 complex binding(GO:1904288) |
| 9.1 | 127.6 | GO:0031432 | titin binding(GO:0031432) |
| 9.0 | 36.0 | GO:0004903 | growth hormone receptor activity(GO:0004903) |
| 7.0 | 42.3 | GO:0098821 | BMP receptor activity(GO:0098821) |
| 6.4 | 51.3 | GO:0003956 | NAD(P)+-protein-arginine ADP-ribosyltransferase activity(GO:0003956) |
| 5.2 | 31.4 | GO:0001515 | opioid peptide activity(GO:0001515) |
| 4.7 | 103.1 | GO:0004745 | retinol dehydrogenase activity(GO:0004745) |
| 4.5 | 203.9 | GO:0051393 | alpha-actinin binding(GO:0051393) |
| 4.3 | 38.9 | GO:0015217 | ATP transmembrane transporter activity(GO:0005347) ADP transmembrane transporter activity(GO:0015217) |
| 4.2 | 21.0 | GO:0008093 | cytoskeletal adaptor activity(GO:0008093) |
| 4.1 | 33.0 | GO:0016681 | ubiquinol-cytochrome-c reductase activity(GO:0008121) oxidoreductase activity, acting on diphenols and related substances as donors, cytochrome as acceptor(GO:0016681) |
| 4.0 | 36.3 | GO:0043495 | protein anchor(GO:0043495) |
| 3.7 | 18.3 | GO:0004558 | alpha-1,4-glucosidase activity(GO:0004558) |
| 3.0 | 91.4 | GO:0016676 | cytochrome-c oxidase activity(GO:0004129) heme-copper terminal oxidase activity(GO:0015002) oxidoreductase activity, acting on a heme group of donors, oxygen as acceptor(GO:0016676) |
| 3.0 | 12.1 | GO:0031013 | troponin I binding(GO:0031013) |
| 3.0 | 35.6 | GO:0102391 | decanoate--CoA ligase activity(GO:0102391) |
| 2.8 | 61.6 | GO:0003746 | translation elongation factor activity(GO:0003746) |
| 2.6 | 7.9 | GO:0004522 | ribonuclease A activity(GO:0004522) |
| 2.6 | 36.3 | GO:0005243 | gap junction channel activity(GO:0005243) |
| 2.6 | 46.0 | GO:0050308 | sugar-phosphatase activity(GO:0050308) |
| 2.4 | 24.4 | GO:0003680 | AT DNA binding(GO:0003680) |
| 2.4 | 31.2 | GO:1990405 | protein antigen binding(GO:1990405) |
| 2.2 | 42.0 | GO:0005247 | voltage-gated chloride channel activity(GO:0005247) |
| 2.1 | 83.5 | GO:0031624 | ubiquitin conjugating enzyme binding(GO:0031624) |
| 2.0 | 54.0 | GO:0050136 | NADH dehydrogenase (ubiquinone) activity(GO:0008137) NADH dehydrogenase (quinone) activity(GO:0050136) |
| 1.7 | 6.8 | GO:0016149 | translation release factor activity, codon specific(GO:0016149) |
| 1.6 | 32.2 | GO:0046933 | proton-transporting ATP synthase activity, rotational mechanism(GO:0046933) |
| 1.4 | 4.2 | GO:0031714 | C5a anaphylatoxin chemotactic receptor binding(GO:0031714) |
| 1.4 | 5.5 | GO:0005136 | interleukin-4 receptor binding(GO:0005136) |
| 1.3 | 10.1 | GO:0008172 | S-methyltransferase activity(GO:0008172) |
| 1.2 | 13.6 | GO:0016783 | sulfurtransferase activity(GO:0016783) |
| 1.2 | 17.8 | GO:0070628 | proteasome binding(GO:0070628) |
| 1.2 | 8.2 | GO:0004332 | fructose-bisphosphate aldolase activity(GO:0004332) |
| 1.1 | 3.4 | GO:0030229 | very-low-density lipoprotein particle receptor activity(GO:0030229) |
| 1.1 | 15.5 | GO:0051787 | misfolded protein binding(GO:0051787) |
| 1.0 | 42.8 | GO:0070330 | aromatase activity(GO:0070330) |
| 1.0 | 12.9 | GO:0030215 | semaphorin receptor binding(GO:0030215) |
| 0.9 | 3.5 | GO:0050252 | retinol O-fatty-acyltransferase activity(GO:0050252) |
| 0.8 | 10.2 | GO:0016290 | palmitoyl-CoA hydrolase activity(GO:0016290) |
| 0.8 | 3.4 | GO:0015056 | corticotrophin-releasing factor receptor activity(GO:0015056) corticotropin-releasing hormone receptor activity(GO:0043404) |
| 0.8 | 5.6 | GO:1990239 | steroid hormone binding(GO:1990239) |
| 0.8 | 17.6 | GO:0042975 | peroxisome proliferator activated receptor binding(GO:0042975) |
| 0.8 | 2.3 | GO:0052591 | sn-glycerol-3-phosphate:ubiquinone oxidoreductase activity(GO:0052590) sn-glycerol-3-phosphate:ubiquinone-8 oxidoreductase activity(GO:0052591) |
| 0.7 | 79.1 | GO:0005200 | structural constituent of cytoskeleton(GO:0005200) |
| 0.7 | 50.8 | GO:0048306 | calcium-dependent protein binding(GO:0048306) |
| 0.6 | 269.9 | GO:0004842 | ubiquitin-protein transferase activity(GO:0004842) |
| 0.6 | 6.7 | GO:0004499 | N,N-dimethylaniline monooxygenase activity(GO:0004499) |
| 0.5 | 3.9 | GO:0008479 | queuine tRNA-ribosyltransferase activity(GO:0008479) |
| 0.5 | 2.8 | GO:0047961 | glycine N-acyltransferase activity(GO:0047961) |
| 0.4 | 11.3 | GO:0017147 | Wnt-protein binding(GO:0017147) |
| 0.4 | 286.7 | GO:0005509 | calcium ion binding(GO:0005509) |
| 0.4 | 10.3 | GO:0004190 | aspartic-type endopeptidase activity(GO:0004190) |
| 0.4 | 3.6 | GO:0016712 | oxidoreductase activity, acting on paired donors, with incorporation or reduction of molecular oxygen, reduced flavin or flavoprotein as one donor, and incorporation of one atom of oxygen(GO:0016712) |
| 0.4 | 2.5 | GO:0015204 | urea transmembrane transporter activity(GO:0015204) |
| 0.3 | 2.6 | GO:0004032 | alditol:NADP+ 1-oxidoreductase activity(GO:0004032) |
| 0.3 | 8.5 | GO:0017091 | AU-rich element binding(GO:0017091) |
| 0.3 | 3.3 | GO:0043023 | ribosomal large subunit binding(GO:0043023) |
| 0.3 | 4.4 | GO:0001618 | virus receptor activity(GO:0001618) |
| 0.3 | 3.9 | GO:0004679 | AMP-activated protein kinase activity(GO:0004679) |
| 0.3 | 16.7 | GO:0016279 | lysine N-methyltransferase activity(GO:0016278) protein-lysine N-methyltransferase activity(GO:0016279) |
| 0.2 | 18.5 | GO:0004843 | thiol-dependent ubiquitin-specific protease activity(GO:0004843) |
| 0.2 | 9.6 | GO:0048365 | Rac GTPase binding(GO:0048365) |
| 0.2 | 8.1 | GO:0004364 | glutathione transferase activity(GO:0004364) |
| 0.2 | 2.2 | GO:0004143 | diacylglycerol kinase activity(GO:0004143) |
| 0.2 | 2.2 | GO:0000340 | RNA 7-methylguanosine cap binding(GO:0000340) |
| 0.2 | 71.5 | GO:0003779 | actin binding(GO:0003779) |
| 0.2 | 33.2 | GO:0003714 | transcription corepressor activity(GO:0003714) |
| 0.2 | 22.2 | GO:0004867 | serine-type endopeptidase inhibitor activity(GO:0004867) |
| 0.2 | 12.3 | GO:0051087 | chaperone binding(GO:0051087) |
| 0.1 | 14.7 | GO:0004222 | metalloendopeptidase activity(GO:0004222) |
| 0.1 | 1.7 | GO:0005223 | intracellular cGMP activated cation channel activity(GO:0005223) |
| 0.1 | 176.2 | GO:0004984 | olfactory receptor activity(GO:0004984) |
| 0.1 | 3.3 | GO:0008527 | taste receptor activity(GO:0008527) |
| 0.1 | 4.9 | GO:0005227 | calcium activated cation channel activity(GO:0005227) |
| 0.1 | 5.9 | GO:0016776 | phosphotransferase activity, phosphate group as acceptor(GO:0016776) |
| 0.1 | 0.7 | GO:0004982 | N-formyl peptide receptor activity(GO:0004982) |
| 0.0 | 0.9 | GO:0016709 | oxidoreductase activity, acting on paired donors, with incorporation or reduction of molecular oxygen, NAD(P)H as one donor, and incorporation of one atom of oxygen(GO:0016709) |
| 0.0 | 32.8 | GO:0004672 | protein kinase activity(GO:0004672) |
| 0.0 | 1.3 | GO:0031492 | nucleosomal DNA binding(GO:0031492) |
| 0.0 | 7.7 | GO:0004252 | serine-type endopeptidase activity(GO:0004252) |
| 0.0 | 5.9 | GO:0019902 | phosphatase binding(GO:0019902) |
| 0.0 | 3.6 | GO:0052689 | carboxylic ester hydrolase activity(GO:0052689) |
Gene overrepresentation in curated gene sets: canonical pathways category:
| Log-likelihood per target | Total log-likelihood | Term | Description |
|---|---|---|---|
| 1.4 | 64.0 | PID INTEGRIN A4B1 PATHWAY | Alpha4 beta1 integrin signaling events |
| 1.0 | 17.6 | PID ERB GENOMIC PATHWAY | Validated nuclear estrogen receptor beta network |
| 1.0 | 31.2 | PID SYNDECAN 4 PATHWAY | Syndecan-4-mediated signaling events |
| 0.9 | 18.5 | PID HIF1A PATHWAY | Hypoxic and oxygen homeostasis regulation of HIF-1-alpha |
| 0.7 | 40.0 | PID BMP PATHWAY | BMP receptor signaling |
| 0.6 | 25.9 | PID HDAC CLASSII PATHWAY | Signaling events mediated by HDAC Class II |
| 0.6 | 36.0 | PID HES HEY PATHWAY | Notch-mediated HES/HEY network |
| 0.5 | 9.4 | SA PTEN PATHWAY | PTEN is a tumor suppressor that dephosphorylates the lipid messenger phosphatidylinositol triphosphate. |
| 0.4 | 31.8 | PID MYC REPRESS PATHWAY | Validated targets of C-MYC transcriptional repression |
| 0.4 | 82.3 | NABA ECM REGULATORS | Genes encoding enzymes and their regulators involved in the remodeling of the extracellular matrix |
| 0.3 | 5.5 | ST INTERLEUKIN 4 PATHWAY | Interleukin 4 (IL-4) Pathway |
| 0.2 | 8.2 | PID HNF3B PATHWAY | FOXA2 and FOXA3 transcription factor networks |
| 0.2 | 6.0 | PID ILK PATHWAY | Integrin-linked kinase signaling |
| 0.2 | 6.4 | PID SYNDECAN 1 PATHWAY | Syndecan-1-mediated signaling events |
| 0.1 | 8.9 | PID P53 REGULATION PATHWAY | p53 pathway |
| 0.1 | 2.2 | ST ERK1 ERK2 MAPK PATHWAY | ERK1/ERK2 MAPK Pathway |
| 0.1 | 2.6 | PID AP1 PATHWAY | AP-1 transcription factor network |
| 0.0 | 1.2 | PID CASPASE PATHWAY | Caspase cascade in apoptosis |
| 0.0 | 1.3 | PID CMYB PATHWAY | C-MYB transcription factor network |
Gene overrepresentation in curated gene sets: REACTOME pathways category:
| Log-likelihood per target | Total log-likelihood | Term | Description |
|---|---|---|---|
| 7.7 | 300.1 | REACTOME STRIATED MUSCLE CONTRACTION | Genes involved in Striated Muscle Contraction |
| 6.6 | 39.8 | REACTOME DIGESTION OF DIETARY CARBOHYDRATE | Genes involved in Digestion of dietary carbohydrate |
| 2.0 | 36.3 | REACTOME GAP JUNCTION ASSEMBLY | Genes involved in Gap junction assembly |
| 2.0 | 32.2 | REACTOME FORMATION OF ATP BY CHEMIOSMOTIC COUPLING | Genes involved in Formation of ATP by chemiosmotic coupling |
| 2.0 | 35.6 | REACTOME SYNTHESIS OF VERY LONG CHAIN FATTY ACYL COAS | Genes involved in Synthesis of very long-chain fatty acyl-CoAs |
| 1.7 | 36.0 | REACTOME PROLACTIN RECEPTOR SIGNALING | Genes involved in Prolactin receptor signaling |
| 1.6 | 54.9 | REACTOME INTERACTIONS OF VPR WITH HOST CELLULAR PROTEINS | Genes involved in Interactions of Vpr with host cellular proteins |
| 1.5 | 31.2 | REACTOME REGULATION OF INSULIN LIKE GROWTH FACTOR IGF ACTIVITY BY INSULIN LIKE GROWTH FACTOR BINDING PROTEINS IGFBPS | Genes involved in Regulation of Insulin-like Growth Factor (IGF) Activity by Insulin-like Growth Factor Binding Proteins (IGFBPs) |
| 1.4 | 54.2 | REACTOME GLUCONEOGENESIS | Genes involved in Gluconeogenesis |
| 1.2 | 3.6 | REACTOME XENOBIOTICS | Genes involved in Xenobiotics |
| 1.2 | 9.4 | REACTOME NEGATIVE REGULATION OF THE PI3K AKT NETWORK | Genes involved in Negative regulation of the PI3K/AKT network |
| 0.8 | 196.2 | REACTOME ANTIGEN PROCESSING UBIQUITINATION PROTEASOME DEGRADATION | Genes involved in Antigen processing: Ubiquitination & Proteasome degradation |
| 0.5 | 8.9 | REACTOME SIGNALING BY PDGF | Genes involved in Signaling by PDGF |
| 0.4 | 10.0 | REACTOME ERK MAPK TARGETS | Genes involved in ERK/MAPK targets |
| 0.4 | 6.0 | REACTOME CELL EXTRACELLULAR MATRIX INTERACTIONS | Genes involved in Cell-extracellular matrix interactions |
| 0.3 | 10.9 | REACTOME INTERACTION BETWEEN L1 AND ANKYRINS | Genes involved in Interaction between L1 and Ankyrins |
| 0.3 | 5.9 | REACTOME CHOLESTEROL BIOSYNTHESIS | Genes involved in Cholesterol biosynthesis |
| 0.2 | 2.2 | REACTOME TRANSPORT OF MATURE MRNA DERIVED FROM AN INTRONLESS TRANSCRIPT | Genes involved in Transport of Mature mRNA Derived from an Intronless Transcript |
| 0.2 | 3.4 | REACTOME CHYLOMICRON MEDIATED LIPID TRANSPORT | Genes involved in Chylomicron-mediated lipid transport |
| 0.1 | 1.9 | REACTOME MRNA DECAY BY 3 TO 5 EXORIBONUCLEASE | Genes involved in mRNA Decay by 3' to 5' Exoribonuclease |
| 0.1 | 4.2 | REACTOME COMPLEMENT CASCADE | Genes involved in Complement cascade |
| 0.1 | 3.5 | REACTOME TRIGLYCERIDE BIOSYNTHESIS | Genes involved in Triglyceride Biosynthesis |
| 0.1 | 6.4 | REACTOME COLLAGEN FORMATION | Genes involved in Collagen formation |
| 0.1 | 0.9 | REACTOME ENDOGENOUS STEROLS | Genes involved in Endogenous sterols |
| 0.1 | 6.6 | REACTOME PHASE II CONJUGATION | Genes involved in Phase II conjugation |
| 0.1 | 2.6 | REACTOME STEROID HORMONES | Genes involved in Steroid hormones |
| 0.1 | 2.2 | REACTOME EFFECTS OF PIP2 HYDROLYSIS | Genes involved in Effects of PIP2 hydrolysis |
| 0.1 | 6.5 | REACTOME RESPONSE TO ELEVATED PLATELET CYTOSOLIC CA2 | Genes involved in Response to elevated platelet cytosolic Ca2+ |
| 0.1 | 11.1 | REACTOME G ALPHA I SIGNALLING EVENTS | Genes involved in G alpha (i) signalling events |
| 0.1 | 7.9 | REACTOME SIGNALING BY RHO GTPASES | Genes involved in Signaling by Rho GTPases |
| 0.0 | 1.5 | REACTOME BMAL1 CLOCK NPAS2 ACTIVATES CIRCADIAN EXPRESSION | Genes involved in BMAL1:CLOCK/NPAS2 Activates Circadian Expression |
| 0.0 | 1.2 | REACTOME ACTIVATION OF CHAPERONE GENES BY XBP1S | Genes involved in Activation of Chaperone Genes by XBP1(S) |
| 0.0 | 2.3 | REACTOME FATTY ACID TRIACYLGLYCEROL AND KETONE BODY METABOLISM | Genes involved in Fatty acid, triacylglycerol, and ketone body metabolism |