Project
GSE53960: rat RNA-Seq transcriptomic Bodymap
Navigation
Downloads
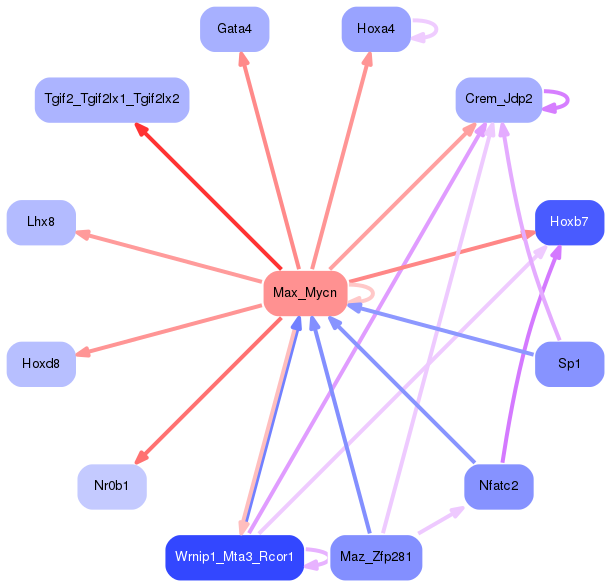
Results for Max_Mycn
Z-value: 1.74
Motif logo
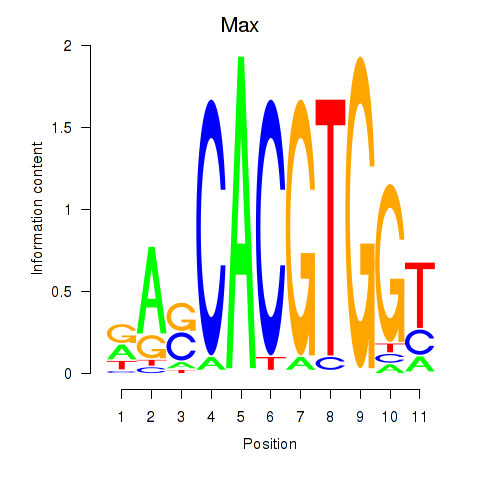
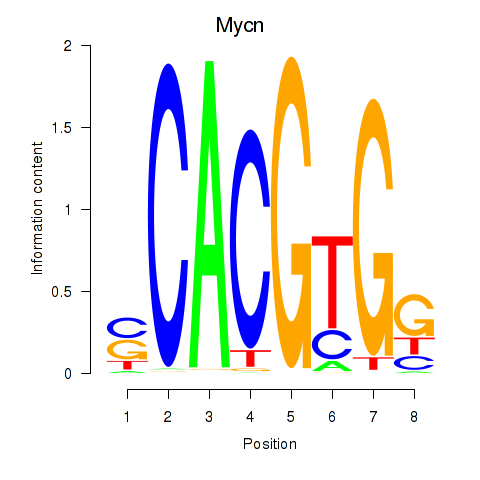
Transcription factors associated with Max_Mycn
| Gene Symbol | Gene ID | Gene Info |
|---|---|---|
|
Max
|
ENSRNOG00000008049 | MYC associated factor X |
|
Mycn
|
ENSRNOG00000051372 | v-myc avian myelocytomatosis viral oncogene neuroblastoma derived homolog |
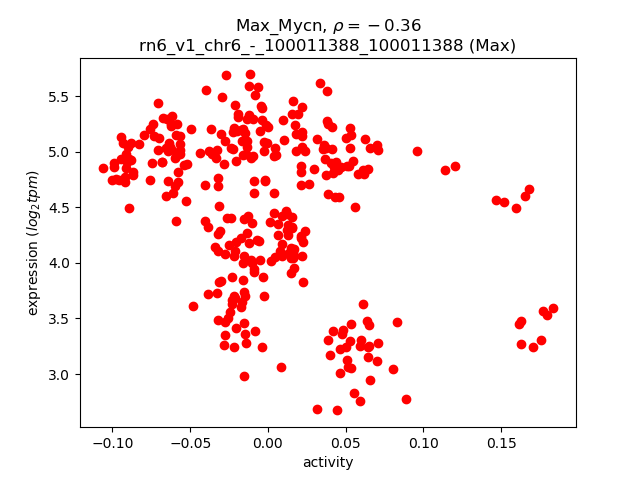
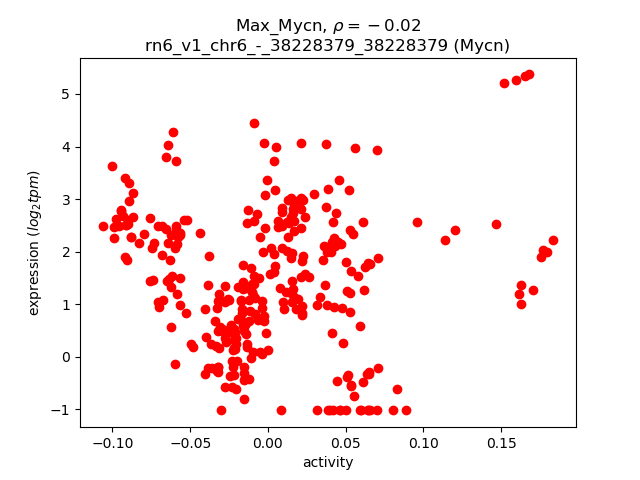
Activity-expression correlation:
| Gene | Promoter | Pearson corr. coef. | P-value | Plot |
|---|---|---|---|---|
| Max | rn6_v1_chr6_-_100011388_100011388 | -0.36 | 3.3e-11 | Click! |
| Mycn | rn6_v1_chr6_-_38228379_38228379 | -0.02 | 6.7e-01 | Click! |
Activity profile of Max_Mycn motif
Sorted Z-values of Max_Mycn motif
| Promoter | Log-likelihood | Transcript | Gene | Gene Info |
|---|---|---|---|---|
| chr4_-_78879294 | 59.90 |
ENSRNOT00000084543
|
Igf2bp3
|
insulin-like growth factor 2 mRNA binding protein 3 |
| chr9_+_12633990 | 47.64 |
ENSRNOT00000066517
ENSRNOT00000077532 |
Dazl
|
deleted in azoospermia-like |
| chr1_+_193424812 | 46.52 |
ENSRNOT00000019939
|
Aqp8
|
aquaporin 8 |
| chr3_+_152909189 | 39.72 |
ENSRNOT00000066341
|
Tgif2
|
TGFB-induced factor homeobox 2 |
| chr8_+_62779875 | 37.26 |
ENSRNOT00000010831
|
Cyp11a1
|
cytochrome P450, family 11, subfamily a, polypeptide 1 |
| chr2_-_187668677 | 36.39 |
ENSRNOT00000056898
ENSRNOT00000092563 |
Tsacc
|
TSSK6 activating co-chaperone |
| chr9_+_80118029 | 36.36 |
ENSRNOT00000023068
|
Igfbp2
|
insulin-like growth factor binding protein 2 |
| chr16_-_36373546 | 35.51 |
ENSRNOT00000079552
|
Hand2
|
heart and neural crest derivatives expressed transcript 2 |
| chr10_-_35058870 | 33.63 |
ENSRNOT00000079481
|
AABR07029573.3
|
|
| chr18_-_786674 | 33.42 |
ENSRNOT00000021955
|
Cetn1
|
centrin 1 |
| chr12_+_24367199 | 32.69 |
ENSRNOT00000001971
|
Fkbp6
|
FK506 binding protein 6 |
| chr9_-_43251400 | 32.61 |
ENSRNOT00000037570
|
Fam178b
|
family with sequence similarity 178, member B |
| chr13_-_84452181 | 31.32 |
ENSRNOT00000005060
|
Mael
|
maelstrom spermatogenic transposon silencer |
| chr4_-_30276372 | 29.60 |
ENSRNOT00000011823
|
Pon1
|
paraoxonase 1 |
| chr1_-_259287684 | 29.60 |
ENSRNOT00000054724
|
Cyp2c22
|
cytochrome P450, family 2, subfamily c, polypeptide 22 |
| chr12_+_19599834 | 29.42 |
ENSRNOT00000092039
ENSRNOT00000042006 |
Stag3
|
stromal antigen 3 |
| chr2_+_30346069 | 28.35 |
ENSRNOT00000076577
|
Serf1
|
small EDRK-rich factor 1 |
| chr7_+_38945836 | 26.97 |
ENSRNOT00000006455
|
Ccer1
|
coiled-coil glutamate-rich protein 1 |
| chr10_+_64952119 | 26.96 |
ENSRNOT00000012154
|
Pipox
|
pipecolic acid and sarcosine oxidase |
| chr1_+_277641512 | 26.84 |
ENSRNOT00000084861
ENSRNOT00000023024 |
Tdrd1
|
tudor domain containing 1 |
| chr4_-_78759408 | 26.38 |
ENSRNOT00000050994
|
Igf2bp3
|
insulin-like growth factor 2 mRNA binding protein 3 |
| chr4_-_157798868 | 26.05 |
ENSRNOT00000044425
|
Tuba3b
|
tubulin, alpha 3B |
| chr10_-_83822996 | 25.59 |
ENSRNOT00000008139
|
Igf2bp1
|
insulin-like growth factor 2 mRNA binding protein 1 |
| chr5_-_147784311 | 25.31 |
ENSRNOT00000074172
|
Fam167b
|
family with sequence similarity 167, member B |
| chr9_+_19917603 | 24.89 |
ENSRNOT00000038239
|
Tdrd6
|
tudor domain containing 6 |
| chr10_+_61432819 | 24.49 |
ENSRNOT00000003687
ENSRNOT00000092478 |
Cluh
|
clustered mitochondria homolog |
| chr1_-_218920094 | 24.16 |
ENSRNOT00000022213
|
Lrp5
|
LDL receptor related protein 5 |
| chr2_-_181905300 | 23.72 |
ENSRNOT00000035411
|
Lrat
|
lecithin-retinol acyltransferase (phosphatidylcholine-retinol-O-acyltransferase) |
| chr7_-_12673659 | 23.66 |
ENSRNOT00000091650
ENSRNOT00000041277 ENSRNOT00000044865 |
Ptbp1
|
polypyrimidine tract binding protein 1 |
| chrX_+_54734385 | 23.58 |
ENSRNOT00000005023
|
Nr0b1
|
nuclear receptor subfamily 0, group B, member 1 |
| chr4_-_132171153 | 23.45 |
ENSRNOT00000015058
ENSRNOT00000015075 |
Prok2
|
prokineticin 2 |
| chr1_-_213534641 | 23.42 |
ENSRNOT00000033074
|
Syce1
|
synaptonemal complex central element protein 1 |
| chr9_-_16848503 | 23.23 |
ENSRNOT00000024815
|
Dnph1
|
2'-deoxynucleoside 5'-phosphate N-hydrolase 1 |
| chr16_-_60427474 | 23.10 |
ENSRNOT00000051720
|
Ppp1r3b
|
protein phosphatase 1, regulatory subunit 3B |
| chr17_+_85356042 | 23.04 |
ENSRNOT00000022201
|
Commd3
|
COMM domain containing 3 |
| chr3_-_3295101 | 22.48 |
ENSRNOT00000051729
|
Sohlh1
|
spermatogenesis and oogenesis specific basic helix-loop-helix 1 |
| chr1_-_107385257 | 22.36 |
ENSRNOT00000074296
|
Ccdc179
|
coiled-coil domain containing 179 |
| chr7_+_91588458 | 22.11 |
ENSRNOT00000006257
|
Aard
|
alanine and arginine rich domain containing protein |
| chr4_+_79055280 | 21.51 |
ENSRNOT00000086307
|
Stk31
|
serine threonine kinase 31 |
| chr10_+_88459490 | 21.48 |
ENSRNOT00000080231
ENSRNOT00000067559 |
Ttc25
|
tetratricopeptide repeat domain 25 |
| chr3_+_125503638 | 21.33 |
ENSRNOT00000028900
|
Crls1
|
cardiolipin synthase 1 |
| chr1_+_247228061 | 21.22 |
ENSRNOT00000020809
|
Rcl1
|
RNA terminal phosphate cyclase-like 1 |
| chr5_+_151776004 | 21.16 |
ENSRNOT00000009683
|
Nr0b2
|
nuclear receptor subfamily 0, group B, member 2 |
| chr9_-_61974898 | 21.12 |
ENSRNOT00000091519
|
Boll
|
boule homolog, RNA binding protein |
| chr14_+_1959610 | 21.10 |
ENSRNOT00000085898
|
Rnf212
|
ring finger protein 212 |
| chr10_+_64375924 | 20.94 |
ENSRNOT00000010227
|
Dbil5
|
diazepam binding inhibitor-like 5 |
| chr12_+_16912249 | 20.92 |
ENSRNOT00000085936
|
Tmem184a
|
transmembrane protein 184A |
| chr19_-_11308740 | 20.91 |
ENSRNOT00000067391
|
Mt2A
|
metallothionein 2A |
| chr3_+_114176309 | 20.86 |
ENSRNOT00000023350
|
Sord
|
sorbitol dehydrogenase |
| chr15_-_52029816 | 20.63 |
ENSRNOT00000013067
|
Slc39a14
|
solute carrier family 39 member 14 |
| chr12_-_48254822 | 20.44 |
ENSRNOT00000056865
|
Ung
|
uracil-DNA glycosylase |
| chr9_-_64573076 | 20.42 |
ENSRNOT00000084658
|
LOC108348134
|
protein boule-like |
| chr4_-_100099517 | 20.22 |
ENSRNOT00000014277
|
Atoh8
|
atonal bHLH transcription factor 8 |
| chrX_+_43497763 | 20.09 |
ENSRNOT00000005014
|
Prdx4
|
peroxiredoxin 4 |
| chr1_+_261229347 | 19.96 |
ENSRNOT00000018485
|
Ubtd1
|
ubiquitin domain containing 1 |
| chr2_+_248649441 | 19.74 |
ENSRNOT00000067165
|
Kyat3
|
kynurenine aminotransferase 3 |
| chr7_+_13913929 | 19.70 |
ENSRNOT00000009833
|
Ccdc105
|
coiled-coil domain containing 105 |
| chr9_-_64573660 | 19.61 |
ENSRNOT00000021299
|
LOC108348134
|
protein boule-like |
| chr1_-_199159125 | 19.37 |
ENSRNOT00000025618
|
Bcl7c
|
BCL tumor suppressor 7C |
| chr16_+_71889235 | 19.32 |
ENSRNOT00000038266
|
Adam32
|
ADAM metallopeptidase domain 32 |
| chr8_-_61917125 | 19.24 |
ENSRNOT00000085049
|
RGD1305464
|
similar to human chromosome 15 open reading frame 39 |
| chr10_-_104564480 | 19.23 |
ENSRNOT00000008525
|
Galk1
|
galactokinase 1 |
| chr3_-_23020441 | 19.22 |
ENSRNOT00000017651
|
Nr5a1
|
nuclear receptor subfamily 5, group A, member 1 |
| chr11_-_17130120 | 18.90 |
ENSRNOT00000002119
|
RGD1563888
|
similar to DNA segment, Chr 16, ERATO Doi 472, expressed |
| chr2_-_210766501 | 18.90 |
ENSRNOT00000025800
|
Gstm3
|
glutathione S-transferase mu 3 |
| chr1_+_65576535 | 18.84 |
ENSRNOT00000026575
|
Slc27a5
|
solute carrier family 27 member 5 |
| chr1_+_218058405 | 18.76 |
ENSRNOT00000028365
|
Fgf19
|
fibroblast growth factor 19 |
| chr6_+_136536736 | 18.66 |
ENSRNOT00000086594
|
Tdrd9
|
tudor domain containing 9 |
| chr10_-_65820538 | 18.65 |
ENSRNOT00000011808
|
Tmem97
|
transmembrane protein 97 |
| chr10_+_4951557 | 18.65 |
ENSRNOT00000003451
|
Prm3
|
protamine 3 |
| chr9_+_100281339 | 18.59 |
ENSRNOT00000029127
|
Agxt
|
alanine-glyoxylate aminotransferase |
| chr3_+_148082790 | 18.36 |
ENSRNOT00000009930
ENSRNOT00000080767 |
Defb36
|
defensin beta 36 |
| chr13_+_105408179 | 18.36 |
ENSRNOT00000003378
|
Ddx3y
|
DEAD (Asp-Glu-Ala-Asp) box helicase 3, Y-linked |
| chrX_-_105355716 | 17.98 |
ENSRNOT00000015043
|
Timm8a1
|
translocase of inner mitochondrial membrane 8 homolog A1 (yeast) |
| chr20_+_4576057 | 17.95 |
ENSRNOT00000081456
ENSRNOT00000085701 |
Ehmt2
|
euchromatic histone lysine methyltransferase 2 |
| chr10_+_84135116 | 17.93 |
ENSRNOT00000031035
|
Hoxb7
|
homeo box B7 |
| chr4_+_154215250 | 17.85 |
ENSRNOT00000072465
|
Mug2
|
murinoglobulin 2 |
| chr14_-_77321977 | 17.85 |
ENSRNOT00000084093
|
Lyar
|
Ly1 antibody reactive |
| chr9_-_65879521 | 17.79 |
ENSRNOT00000017517
|
Als2cr11
|
amyotrophic lateral sclerosis 2 chromosome region, candidate 11 |
| chr2_-_264765085 | 17.72 |
ENSRNOT00000089714
|
LOC103691744
|
cystathionine gamma-lyase |
| chr9_-_61690956 | 17.72 |
ENSRNOT00000066589
|
Hspd1
|
heat shock protein family D member 1 |
| chr10_+_56546710 | 17.66 |
ENSRNOT00000023003
|
Ybx2
|
Y box binding protein 2 |
| chr6_+_42852683 | 17.66 |
ENSRNOT00000079185
|
Odc1
|
ornithine decarboxylase 1 |
| chr8_+_50559126 | 17.53 |
ENSRNOT00000024918
|
Apoa5
|
apolipoprotein A5 |
| chr13_+_70852023 | 17.51 |
ENSRNOT00000003661
|
Shcbp1l
|
SHC binding and spindle associated 1 like |
| chr1_+_257076221 | 17.47 |
ENSRNOT00000044895
|
Slc35g1
|
solute carrier family 35, member G1 |
| chr8_+_79489790 | 17.43 |
ENSRNOT00000091722
|
Prtg
|
protogenin |
| chr7_-_138512952 | 17.43 |
ENSRNOT00000009187
|
Slc38a4
|
solute carrier family 38, member 4 |
| chr10_-_64375816 | 17.43 |
ENSRNOT00000087689
|
Gemin4
|
gem (nuclear organelle) associated protein 4 |
| chr1_-_80599572 | 17.29 |
ENSRNOT00000024832
|
Apoc4
|
apolipoprotein C4 |
| chr2_-_44504354 | 17.29 |
ENSRNOT00000013035
|
Ddx4
|
DEAD-box helicase 4 |
| chr15_-_46432965 | 17.19 |
ENSRNOT00000014320
|
Gata4
|
GATA binding protein 4 |
| chr1_-_82452281 | 17.18 |
ENSRNOT00000027995
|
Bckdha
|
branched chain ketoacid dehydrogenase E1, alpha polypeptide |
| chr10_-_103848035 | 17.05 |
ENSRNOT00000029001
|
Fads6
|
fatty acid desaturase 6 |
| chr10_+_107469377 | 16.95 |
ENSRNOT00000087404
|
C1qtnf1
|
C1q and tumor necrosis factor related protein 1 |
| chr1_+_82452469 | 16.69 |
ENSRNOT00000028026
|
Exosc5
|
exosome component 5 |
| chr2_-_181874223 | 16.67 |
ENSRNOT00000035846
|
Rbm46
|
RNA binding motif protein 46 |
| chr10_+_74910713 | 16.61 |
ENSRNOT00000091619
|
Hsf5
|
heat shock transcription factor 5 |
| chr8_-_113689681 | 16.59 |
ENSRNOT00000056435
|
LOC688828
|
similar to Nucleoside diphosphate-linked moiety X motif 16 (Nudix motif 16) |
| chr1_-_281874456 | 16.48 |
ENSRNOT00000084760
ENSRNOT00000050617 |
Cacul1
|
CDK2-associated, cullin domain 1 |
| chr16_-_81797815 | 16.37 |
ENSRNOT00000026666
|
Proz
|
protein Z, vitamin K-dependent plasma glycoprotein |
| chr3_+_70285219 | 16.37 |
ENSRNOT00000076015
|
Fsip2
|
fibrous sheath-interacting protein 2 |
| chr17_-_417480 | 16.33 |
ENSRNOT00000023685
|
Fbp1
|
fructose-bisphosphatase 1 |
| chr12_-_31323810 | 16.32 |
ENSRNOT00000001247
|
Ran
|
RAN, member RAS oncogene family |
| chr6_+_137889261 | 16.24 |
ENSRNOT00000034995
|
Tex22
|
testis expressed 22 |
| chr8_-_85645718 | 16.21 |
ENSRNOT00000032185
|
Gsta2
|
glutathione S-transferase alpha 2 |
| chr8_-_47529689 | 16.18 |
ENSRNOT00000012826
|
Oaf
|
out at first homolog |
| chr18_-_56728185 | 16.10 |
ENSRNOT00000066048
|
Ppargc1b
|
PPARG coactivator 1 beta |
| chr15_-_52116001 | 16.06 |
ENSRNOT00000013284
|
Piwil2
|
piwi-like RNA-mediated gene silencing 2 |
| chr6_+_128073344 | 16.05 |
ENSRNOT00000014073
|
LOC500712
|
Ab1-233 |
| chr6_-_107461041 | 15.85 |
ENSRNOT00000058127
|
Heatr4
|
HEAT repeat containing 4 |
| chr3_-_8659102 | 15.78 |
ENSRNOT00000050908
|
Zdhhc12
|
zinc finger, DHHC-type containing 12 |
| chr5_-_24631679 | 15.72 |
ENSRNOT00000010846
ENSRNOT00000067129 |
Esrp1
|
epithelial splicing regulatory protein 1 |
| chr9_+_23503236 | 15.70 |
ENSRNOT00000017996
|
Crisp2
|
cysteine-rich secretory protein 2 |
| chr1_+_48039909 | 15.67 |
ENSRNOT00000060412
ENSRNOT00000076338 |
Pnldc1
|
PARN like, ribonuclease domain containing 1 |
| chr3_+_114772603 | 15.66 |
ENSRNOT00000073569
|
MGC105649
|
hypothetical LOC302884 |
| chr4_+_159410799 | 15.63 |
ENSRNOT00000079225
|
Akap3
|
A-kinase anchoring protein 3 |
| chr11_+_83883879 | 15.60 |
ENSRNOT00000050927
|
LOC108348101
|
chloride channel protein 2 |
| chr20_+_4993560 | 15.55 |
ENSRNOT00000081628
ENSRNOT00000087861 ENSRNOT00000001160 |
Vars
|
valyl-tRNA synthetase |
| chrX_-_105793306 | 15.48 |
ENSRNOT00000015806
|
Nxf2
|
nuclear RNA export factor 2 |
| chr10_-_47630799 | 15.43 |
ENSRNOT00000057907
|
Slc47a2
|
solute carrier family 47 member 2 |
| chr8_-_111850075 | 15.39 |
ENSRNOT00000082097
|
Cdv3
|
CDV3 homolog |
| chr12_+_24158766 | 15.38 |
ENSRNOT00000001963
|
Ccl26
|
C-C motif chemokine ligand 26 |
| chr2_-_52282548 | 15.34 |
ENSRNOT00000033627
|
Nnt
|
nicotinamide nucleotide transhydrogenase |
| chr14_+_22724070 | 15.28 |
ENSRNOT00000089471
|
Ugt2b10
|
UDP glucuronosyltransferase 2 family, polypeptide B10 |
| chr5_-_64946580 | 15.26 |
ENSRNOT00000007290
|
Ppp3r2
|
protein phosphatase 3, regulatory subunit B, beta |
| chr10_-_56530842 | 15.09 |
ENSRNOT00000077451
|
AABR07029863.3
|
|
| chr4_+_96831880 | 15.04 |
ENSRNOT00000068400
|
RSA-14-44
|
RSA-14-44 protein |
| chr19_+_52217984 | 14.98 |
ENSRNOT00000079580
|
Dnaaf1
|
dynein, axonemal, assembly factor 1 |
| chr6_+_93539271 | 14.91 |
ENSRNOT00000078791
|
Tomm20l
|
translocase of outer mitochondrial membrane 20 homolog (yeast)-like |
| chr9_-_61975640 | 14.87 |
ENSRNOT00000085744
|
Boll
|
boule homolog, RNA binding protein |
| chr4_+_179905116 | 14.73 |
ENSRNOT00000052352
|
Tuba3a
|
tubulin, alpha 3A |
| chr1_-_101596822 | 14.60 |
ENSRNOT00000028490
|
Fgf21
|
fibroblast growth factor 21 |
| chr11_-_60251415 | 14.59 |
ENSRNOT00000080148
ENSRNOT00000086602 |
Slc9c1
|
solute carrier family 9 member C1 |
| chr9_+_10535340 | 14.46 |
ENSRNOT00000075408
|
Znrf4
|
zinc and ring finger 4 |
| chrX_+_74497262 | 14.38 |
ENSRNOT00000003899
|
Zcchc13
|
zinc finger CCHC-type containing 13 |
| chr3_+_61627383 | 14.38 |
ENSRNOT00000067861
|
Hoxd8
|
homeobox D8 |
| chr17_-_44595323 | 14.32 |
ENSRNOT00000086767
|
Pom121l2
|
POM121 transmembrane nucleoporin-like 2 |
| chr15_-_3435888 | 14.30 |
ENSRNOT00000016709
|
Adk
|
adenosine kinase |
| chr4_-_82160240 | 14.22 |
ENSRNOT00000038775
ENSRNOT00000058985 |
Hoxa4
|
homeo box A4 |
| chr10_-_109795697 | 14.22 |
ENSRNOT00000054952
|
Pcyt2
|
phosphate cytidylyltransferase 2, ethanolamine |
| chr2_-_195935878 | 14.19 |
ENSRNOT00000028440
|
Cgn
|
cingulin |
| chr16_+_72011870 | 14.08 |
ENSRNOT00000092198
|
Adam5
|
ADAM metallopeptidase domain 5 |
| chr16_-_54513349 | 14.04 |
ENSRNOT00000014809
ENSRNOT00000015127 |
Slc7a2
|
solute carrier family 7 member 2 |
| chr5_+_90419020 | 14.02 |
ENSRNOT00000058893
|
Rasef
|
RAS and EF hand domain containing |
| chr10_+_70134729 | 13.96 |
ENSRNOT00000076739
|
Lig3
|
DNA ligase 3 |
| chr13_+_36039283 | 13.90 |
ENSRNOT00000072088
|
Sctr
|
secretin receptor |
| chr3_-_146764015 | 13.83 |
ENSRNOT00000068689
|
Ninl
|
ninein-like |
| chr6_-_1622196 | 13.77 |
ENSRNOT00000007492
|
Prkd3
|
protein kinase D3 |
| chr6_+_80220547 | 13.72 |
ENSRNOT00000086221
ENSRNOT00000077435 ENSRNOT00000059318 ENSRNOT00000089010 |
Mia2
|
melanoma inhibitory activity 2 |
| chr9_+_55050203 | 13.68 |
ENSRNOT00000021403
|
Nabp1
|
nucleic acid binding protein 1 |
| chrX_-_106066227 | 13.63 |
ENSRNOT00000033752
|
Nxf7
|
nuclear RNA export factor 7 |
| chr9_+_15068399 | 13.61 |
ENSRNOT00000064229
ENSRNOT00000087107 |
Foxp4
|
forkhead box P4 |
| chr1_-_256813711 | 13.60 |
ENSRNOT00000021055
|
Rbp4
|
retinol binding protein 4 |
| chr19_-_64303 | 13.59 |
ENSRNOT00000015451
|
Ces2a
|
carboxylesterase 2A |
| chr13_+_89597138 | 13.58 |
ENSRNOT00000004662
|
Apoa2
|
apolipoprotein A2 |
| chr3_-_173947018 | 13.50 |
ENSRNOT00000078047
|
Sycp2
|
synaptonemal complex protein 2 |
| chr12_-_12025549 | 13.50 |
ENSRNOT00000001331
|
Nptx2
|
neuronal pentraxin 2 |
| chr8_-_25829569 | 13.49 |
ENSRNOT00000071884
|
Dpy19l2
|
dpy-19 like 2 |
| chr1_-_164143818 | 13.48 |
ENSRNOT00000022557
|
Dgat2
|
diacylglycerol O-acyltransferase 2 |
| chr9_-_113331319 | 13.47 |
ENSRNOT00000020681
|
Vapa
|
VAMP associated protein A |
| chr19_+_24496569 | 13.37 |
ENSRNOT00000004982
|
Mgat4d
|
MGAT4 family, member D |
| chr11_+_82862695 | 13.31 |
ENSRNOT00000071707
ENSRNOT00000073435 |
Clcn2
|
chloride voltage-gated channel 2 |
| chr12_+_16913312 | 13.25 |
ENSRNOT00000001718
|
Tmem184a
|
transmembrane protein 184A |
| chr1_-_198706852 | 13.23 |
ENSRNOT00000024074
|
Dctpp1
|
dCTP pyrophosphatase 1 |
| chr13_-_101163393 | 13.20 |
ENSRNOT00000037997
|
Ccdc185
|
coiled-coil domain containing 185 |
| chr3_+_152143811 | 13.15 |
ENSRNOT00000026578
|
LOC100911109
|
sperm-associated antigen 4 protein-like |
| chr7_-_101140308 | 13.13 |
ENSRNOT00000006279
|
Fam84b
|
family with sequence similarity 84, member B |
| chr3_+_138398011 | 13.13 |
ENSRNOT00000038865
|
Mgme1
|
mitochondrial genome maintenance exonuclease 1 |
| chr2_-_187622373 | 13.11 |
ENSRNOT00000026396
|
Rhbg
|
Rh family B glycoprotein |
| chr18_-_27749235 | 13.00 |
ENSRNOT00000026696
|
Hspa9
|
heat shock protein family A member 9 |
| chr1_-_91811547 | 12.94 |
ENSRNOT00000017021
|
Tdrd12
|
tudor domain containing 12 |
| chr7_-_73270308 | 12.93 |
ENSRNOT00000007430
|
Rida
|
reactive intermediate imine deaminase A homolog |
| chr8_-_111850393 | 12.93 |
ENSRNOT00000044956
|
Cdv3
|
CDV3 homolog |
| chr5_-_144176807 | 12.92 |
ENSRNOT00000045841
|
Sh3d21
|
SH3 domain containing 21 |
| chr4_+_145489869 | 12.89 |
ENSRNOT00000082618
|
Fancd2
|
Fanconi anemia, complementation group D2 |
| chr3_+_2182957 | 12.83 |
ENSRNOT00000011633
|
Pnpla7
|
patatin-like phospholipase domain containing 7 |
| chr2_-_264293010 | 12.80 |
ENSRNOT00000082532
ENSRNOT00000067843 |
LOC103691744
|
cystathionine gamma-lyase |
| chr1_+_222229835 | 12.80 |
ENSRNOT00000051749
|
Ppp1r14b
|
protein phosphatase 1, regulatory (inhibitor) subunit 14B |
| chr17_+_45175121 | 12.76 |
ENSRNOT00000080417
|
Nkapl
|
NFKB activating protein-like |
| chr2_+_207108552 | 12.75 |
ENSRNOT00000027234
|
Slc16a1
|
solute carrier family 16 member 1 |
| chr17_+_27452638 | 12.70 |
ENSRNOT00000038349
|
Cage1
|
cancer antigen 1 |
| chr2_-_260596777 | 12.70 |
ENSRNOT00000009370
|
Lhx8
|
LIM homeobox 8 |
| chr3_+_110367939 | 12.67 |
ENSRNOT00000010406
|
Bub1b
|
BUB1 mitotic checkpoint serine/threonine kinase B |
| chr13_-_90832469 | 12.63 |
ENSRNOT00000086508
|
Igsf9
|
immunoglobulin superfamily, member 9 |
| chr3_-_10375826 | 12.53 |
ENSRNOT00000093365
|
Ass1
|
argininosuccinate synthase 1 |
| chr11_-_83985385 | 12.44 |
ENSRNOT00000002334
|
LOC102551435
|
endothelin-converting enzyme 2-like |
| chr11_+_83884048 | 12.41 |
ENSRNOT00000002376
|
LOC108348101
|
chloride channel protein 2 |
| chr17_-_86322144 | 12.40 |
ENSRNOT00000034474
|
LOC681241
|
hypothetical protein LOC681241 |
| chr15_-_44411004 | 12.39 |
ENSRNOT00000031163
|
Cdca2
|
cell division cycle associated 2 |
| chr19_-_52252587 | 12.31 |
ENSRNOT00000020990
|
Taf1c
|
TATA-box binding protein associated factor, RNA polymerase 1 subunit C |
| chr5_+_133620706 | 12.30 |
ENSRNOT00000053202
|
Gm12830
|
predicted gene 12830 |
| chr12_+_22451596 | 12.24 |
ENSRNOT00000072838
|
Trip6
|
thyroid hormone receptor interactor 6 |
| chr4_+_172119331 | 12.19 |
ENSRNOT00000010579
|
Mgst1
|
microsomal glutathione S-transferase 1 |
| chr14_-_77321783 | 12.17 |
ENSRNOT00000007154
|
Lyar
|
Ly1 antibody reactive |
| chr3_-_51054378 | 12.15 |
ENSRNOT00000089243
|
Grb14
|
growth factor receptor bound protein 14 |
| chr3_+_110618298 | 12.13 |
ENSRNOT00000012454
|
Knstrn
|
kinetochore-localized astrin/SPAG5 binding protein |
| chr6_+_27241919 | 12.09 |
ENSRNOT00000013123
|
Cib4
|
calcium and integrin binding family member 4 |
| chr9_-_100624638 | 12.05 |
ENSRNOT00000051155
|
Hdlbp
|
high density lipoprotein binding protein |
| chr1_-_78573374 | 12.00 |
ENSRNOT00000090519
|
Arhgap35
|
Rho GTPase activating protein 35 |
Network of associatons between targets according to the STRING database.

First level regulatory network of Max_Mycn
Gene Ontology Analysis
Gene overrepresentation in biological process category:
| Log-likelihood per target | Total log-likelihood | Term | Description |
|---|---|---|---|
| 13.4 | 40.1 | GO:0006059 | hexitol metabolic process(GO:0006059) |
| 10.0 | 170.8 | GO:0034587 | piRNA metabolic process(GO:0034587) |
| 9.9 | 29.6 | GO:0034445 | regulation of plasma lipoprotein particle oxidation(GO:0034444) negative regulation of plasma lipoprotein particle oxidation(GO:0034445) |
| 9.1 | 27.3 | GO:0019343 | cysteine biosynthetic process via cystathionine(GO:0019343) |
| 8.9 | 35.5 | GO:0003219 | cardiac right ventricle formation(GO:0003219) |
| 8.8 | 26.5 | GO:0018916 | nitrobenzene metabolic process(GO:0018916) |
| 8.5 | 34.2 | GO:0018992 | germ-line sex determination(GO:0018992) |
| 8.2 | 24.7 | GO:0035054 | embryonic heart tube anterior/posterior pattern specification(GO:0035054) |
| 8.2 | 57.4 | GO:0015722 | canalicular bile acid transport(GO:0015722) |
| 8.1 | 24.2 | GO:0060764 | cell-cell signaling involved in mammary gland development(GO:0060764) |
| 7.8 | 31.1 | GO:0010901 | regulation of very-low-density lipoprotein particle remodeling(GO:0010901) |
| 7.7 | 30.6 | GO:2000195 | negative regulation of female gonad development(GO:2000195) |
| 7.5 | 37.3 | GO:0060014 | granulosa cell differentiation(GO:0060014) |
| 7.2 | 28.7 | GO:0010424 | DNA methylation on cytosine within a CG sequence(GO:0010424) |
| 6.7 | 27.0 | GO:0019474 | lysine catabolic process(GO:0006554) L-lysine catabolic process to acetyl-CoA(GO:0019474) L-lysine catabolic process(GO:0019477) L-lysine metabolic process(GO:0046440) |
| 6.6 | 19.8 | GO:0045041 | protein import into mitochondrial intermembrane space(GO:0045041) |
| 6.6 | 26.2 | GO:0046951 | ketone body biosynthetic process(GO:0046951) |
| 6.2 | 18.6 | GO:0019448 | cysteine catabolic process(GO:0009093) glycine biosynthetic process, by transamination of glyoxylate(GO:0019265) L-cysteine catabolic process(GO:0019448) L-cysteine metabolic process(GO:0046439) oxalic acid secretion(GO:0046724) |
| 6.0 | 18.1 | GO:0006288 | base-excision repair, DNA ligation(GO:0006288) |
| 5.9 | 70.3 | GO:0007135 | meiosis II(GO:0007135) |
| 5.2 | 26.0 | GO:0071400 | cellular response to oleic acid(GO:0071400) |
| 5.2 | 15.6 | GO:0006438 | valyl-tRNA aminoacylation(GO:0006438) |
| 5.1 | 20.4 | GO:0006285 | base-excision repair, AP site formation(GO:0006285) |
| 5.0 | 5.0 | GO:0010982 | regulation of high-density lipoprotein particle clearance(GO:0010982) |
| 4.9 | 24.7 | GO:0043091 | L-arginine import(GO:0043091) arginine import(GO:0090467) L-arginine transport(GO:1902023) |
| 4.9 | 19.7 | GO:0097052 | L-kynurenine metabolic process(GO:0097052) |
| 4.8 | 24.2 | GO:1904640 | response to methionine(GO:1904640) |
| 4.8 | 33.4 | GO:0032049 | cardiolipin biosynthetic process(GO:0032049) |
| 4.8 | 14.3 | GO:0046086 | purine deoxyribonucleoside triphosphate biosynthetic process(GO:0009216) adenosine biosynthetic process(GO:0046086) |
| 4.8 | 14.3 | GO:0097498 | endothelial tube lumen extension(GO:0097498) |
| 4.7 | 14.1 | GO:1902037 | negative regulation of hematopoietic stem cell differentiation(GO:1902037) |
| 4.6 | 36.7 | GO:0051026 | chiasma assembly(GO:0051026) |
| 4.5 | 13.6 | GO:0046864 | isoprenoid transport(GO:0046864) terpenoid transport(GO:0046865) |
| 4.5 | 36.2 | GO:0070934 | CRD-mediated mRNA stabilization(GO:0070934) |
| 4.4 | 13.1 | GO:0070634 | transepithelial ammonium transport(GO:0070634) |
| 4.3 | 38.6 | GO:0075522 | IRES-dependent viral translational initiation(GO:0075522) |
| 4.2 | 46.0 | GO:1902570 | protein localization to nucleolus(GO:1902570) |
| 4.1 | 12.2 | GO:0008588 | release of cytoplasmic sequestered NF-kappaB(GO:0008588) |
| 4.0 | 16.0 | GO:0046351 | disaccharide biosynthetic process(GO:0046351) |
| 4.0 | 8.0 | GO:0071698 | olfactory placode formation(GO:0030910) olfactory placode development(GO:0071698) olfactory placode morphogenesis(GO:0071699) |
| 3.9 | 11.8 | GO:1903165 | response to polycyclic arene(GO:1903165) |
| 3.8 | 7.6 | GO:0000720 | pyrimidine dimer repair by nucleotide-excision repair(GO:0000720) |
| 3.8 | 18.8 | GO:1904252 | negative regulation of bile acid biosynthetic process(GO:0070858) negative regulation of bile acid metabolic process(GO:1904252) |
| 3.5 | 21.2 | GO:0000480 | endonucleolytic cleavage in 5'-ETS of tricistronic rRNA transcript (SSU-rRNA, 5.8S rRNA, LSU-rRNA)(GO:0000480) |
| 3.5 | 14.1 | GO:2000255 | negative regulation of male germ cell proliferation(GO:2000255) |
| 3.5 | 24.6 | GO:0010694 | positive regulation of alkaline phosphatase activity(GO:0010694) |
| 3.5 | 35.0 | GO:0042178 | xenobiotic catabolic process(GO:0042178) |
| 3.5 | 34.7 | GO:0071907 | determination of digestive tract left/right asymmetry(GO:0071907) |
| 3.4 | 17.2 | GO:0051594 | detection of carbohydrate stimulus(GO:0009730) detection of hexose stimulus(GO:0009732) detection of monosaccharide stimulus(GO:0034287) detection of glucose(GO:0051594) |
| 3.4 | 37.9 | GO:0009125 | nucleoside monophosphate catabolic process(GO:0009125) |
| 3.4 | 10.3 | GO:0051977 | lysophospholipid transport(GO:0051977) |
| 3.4 | 13.5 | GO:0018406 | protein C-linked glycosylation(GO:0018103) peptidyl-tryptophan modification(GO:0018211) protein C-linked glycosylation via tryptophan(GO:0018317) protein C-linked glycosylation via 2'-alpha-mannosyl-L-tryptophan(GO:0018406) |
| 3.4 | 26.8 | GO:0006776 | vitamin A metabolic process(GO:0006776) |
| 3.3 | 13.2 | GO:0009223 | pyrimidine deoxyribonucleotide catabolic process(GO:0009223) |
| 3.2 | 9.7 | GO:0002949 | tRNA threonylcarbamoyladenosine modification(GO:0002949) |
| 3.2 | 6.4 | GO:0006344 | maintenance of chromatin silencing(GO:0006344) |
| 3.2 | 9.6 | GO:0097089 | methyl-branched fatty acid metabolic process(GO:0097089) |
| 3.2 | 22.3 | GO:0006610 | ribosomal protein import into nucleus(GO:0006610) |
| 3.1 | 18.7 | GO:0033387 | putrescine biosynthetic process from ornithine(GO:0033387) |
| 3.0 | 12.2 | GO:0060155 | platelet dense granule organization(GO:0060155) |
| 3.0 | 20.9 | GO:0036016 | response to interleukin-3(GO:0036015) cellular response to interleukin-3(GO:0036016) astrocyte activation(GO:0048143) |
| 3.0 | 17.8 | GO:0070973 | protein localization to endoplasmic reticulum exit site(GO:0070973) |
| 2.9 | 11.7 | GO:0019464 | glycine catabolic process(GO:0006546) glycine decarboxylation via glycine cleavage system(GO:0019464) |
| 2.9 | 8.7 | GO:0038161 | prolactin signaling pathway(GO:0038161) |
| 2.9 | 11.6 | GO:0006104 | succinyl-CoA metabolic process(GO:0006104) |
| 2.9 | 14.5 | GO:0001552 | ovarian follicle atresia(GO:0001552) |
| 2.9 | 2.9 | GO:1901536 | regulation of DNA demethylation(GO:1901535) negative regulation of DNA demethylation(GO:1901536) |
| 2.8 | 11.4 | GO:0051005 | negative regulation of lipoprotein lipase activity(GO:0051005) |
| 2.8 | 5.6 | GO:0033087 | negative regulation of immature T cell proliferation(GO:0033087) negative regulation of immature T cell proliferation in thymus(GO:0033088) |
| 2.8 | 11.2 | GO:0019483 | beta-alanine biosynthetic process(GO:0019483) |
| 2.8 | 22.1 | GO:0086073 | bundle of His cell-Purkinje myocyte adhesion involved in cell communication(GO:0086073) |
| 2.8 | 8.3 | GO:1990167 | protein K27-linked deubiquitination(GO:1990167) |
| 2.7 | 13.6 | GO:0060480 | lung goblet cell differentiation(GO:0060480) |
| 2.7 | 10.7 | GO:2000124 | regulation of endocannabinoid signaling pathway(GO:2000124) |
| 2.7 | 13.3 | GO:0060689 | cell differentiation involved in salivary gland development(GO:0060689) |
| 2.7 | 13.3 | GO:0060718 | chorionic trophoblast cell differentiation(GO:0060718) |
| 2.6 | 10.5 | GO:0036353 | histone H2A-K119 monoubiquitination(GO:0036353) |
| 2.6 | 2.6 | GO:0046671 | negative regulation of retinal cell programmed cell death(GO:0046671) |
| 2.6 | 7.8 | GO:0033540 | fatty acid beta-oxidation using acyl-CoA oxidase(GO:0033540) |
| 2.6 | 12.9 | GO:0035166 | post-embryonic hemopoiesis(GO:0035166) |
| 2.6 | 48.9 | GO:0038092 | nodal signaling pathway(GO:0038092) |
| 2.6 | 15.4 | GO:0045006 | DNA deamination(GO:0045006) |
| 2.6 | 5.1 | GO:1903334 | positive regulation of protein folding(GO:1903334) |
| 2.5 | 7.6 | GO:2000111 | positive regulation of macrophage apoptotic process(GO:2000111) |
| 2.5 | 10.1 | GO:0015879 | carnitine transport(GO:0015879) |
| 2.5 | 5.0 | GO:0014908 | myotube differentiation involved in skeletal muscle regeneration(GO:0014908) |
| 2.5 | 17.3 | GO:0010890 | positive regulation of sequestering of triglyceride(GO:0010890) |
| 2.5 | 7.4 | GO:0090210 | regulation of establishment of blood-brain barrier(GO:0090210) |
| 2.4 | 12.1 | GO:1900194 | negative regulation of oocyte maturation(GO:1900194) |
| 2.4 | 7.3 | GO:1902211 | regulation of prolactin signaling pathway(GO:1902211) |
| 2.4 | 7.2 | GO:0006113 | fermentation(GO:0006113) glucose catabolic process to lactate(GO:0019659) glycolytic fermentation(GO:0019660) glucose catabolic process to lactate via pyruvate(GO:0019661) |
| 2.4 | 12.0 | GO:0031296 | B cell costimulation(GO:0031296) |
| 2.4 | 2.4 | GO:0010528 | regulation of transposition(GO:0010528) negative regulation of transposition(GO:0010529) |
| 2.3 | 7.0 | GO:0034696 | response to prostaglandin F(GO:0034696) |
| 2.3 | 25.4 | GO:0030238 | male sex determination(GO:0030238) |
| 2.3 | 13.8 | GO:0089700 | protein kinase D signaling(GO:0089700) |
| 2.3 | 6.8 | GO:0030091 | protein repair(GO:0030091) |
| 2.3 | 9.0 | GO:0072106 | regulation of ureteric bud formation(GO:0072106) positive regulation of ureteric bud formation(GO:0072107) |
| 2.3 | 13.5 | GO:0090598 | male genitalia morphogenesis(GO:0048808) male anatomical structure morphogenesis(GO:0090598) |
| 2.2 | 13.4 | GO:0010266 | response to vitamin B1(GO:0010266) response to platinum ion(GO:0070541) |
| 2.2 | 17.8 | GO:0006975 | DNA damage induced protein phosphorylation(GO:0006975) |
| 2.2 | 11.1 | GO:0000066 | mitochondrial ornithine transport(GO:0000066) L-ornithine transmembrane transport(GO:1903352) |
| 2.2 | 15.2 | GO:0043504 | mitochondrial DNA repair(GO:0043504) |
| 2.2 | 4.3 | GO:0000960 | mitochondrial RNA catabolic process(GO:0000957) regulation of mitochondrial RNA catabolic process(GO:0000960) |
| 2.1 | 4.2 | GO:0021938 | smoothened signaling pathway involved in regulation of cerebellar granule cell precursor cell proliferation(GO:0021938) |
| 2.1 | 4.2 | GO:0042414 | epinephrine metabolic process(GO:0042414) |
| 2.1 | 6.4 | GO:1904884 | telomerase catalytic core complex assembly(GO:1904868) regulation of telomerase catalytic core complex assembly(GO:1904882) positive regulation of telomerase catalytic core complex assembly(GO:1904884) |
| 2.1 | 29.1 | GO:0016973 | poly(A)+ mRNA export from nucleus(GO:0016973) |
| 2.1 | 12.4 | GO:0061484 | hematopoietic stem cell homeostasis(GO:0061484) |
| 2.0 | 18.4 | GO:0080111 | DNA demethylation(GO:0080111) |
| 2.0 | 6.1 | GO:0000965 | mitochondrial RNA 3'-end processing(GO:0000965) |
| 2.0 | 8.1 | GO:0042769 | DNA damage response, detection of DNA damage(GO:0042769) |
| 2.0 | 12.0 | GO:0030950 | establishment or maintenance of actin cytoskeleton polarity(GO:0030950) |
| 2.0 | 100.0 | GO:0007129 | synapsis(GO:0007129) |
| 2.0 | 6.0 | GO:0044375 | regulation of peroxisome size(GO:0044375) |
| 2.0 | 6.0 | GO:0000738 | DNA catabolic process, exonucleolytic(GO:0000738) |
| 2.0 | 7.9 | GO:0044725 | chromatin reprogramming in the zygote(GO:0044725) |
| 2.0 | 21.6 | GO:0071578 | zinc II ion transmembrane import(GO:0071578) |
| 2.0 | 5.9 | GO:0014707 | branchiomeric skeletal muscle development(GO:0014707) |
| 2.0 | 3.9 | GO:0060849 | lymphatic endothelial cell fate commitment(GO:0060838) regulation of transcription involved in lymphatic endothelial cell fate commitment(GO:0060849) |
| 1.9 | 13.6 | GO:0061368 | behavioral response to chemical pain(GO:0061366) behavioral response to formalin induced pain(GO:0061368) |
| 1.9 | 5.8 | GO:0009609 | response to symbiotic bacterium(GO:0009609) |
| 1.9 | 5.8 | GO:0061643 | chemorepulsion of axon(GO:0061643) |
| 1.9 | 7.7 | GO:0046726 | positive regulation by virus of viral protein levels in host cell(GO:0046726) |
| 1.9 | 5.7 | GO:0060414 | aorta smooth muscle tissue morphogenesis(GO:0060414) |
| 1.9 | 5.7 | GO:0019303 | D-ribose catabolic process(GO:0019303) |
| 1.9 | 15.2 | GO:0070317 | negative regulation of G0 to G1 transition(GO:0070317) |
| 1.9 | 17.0 | GO:0044791 | modulation by host of viral release from host cell(GO:0044789) positive regulation by host of viral release from host cell(GO:0044791) |
| 1.9 | 7.5 | GO:0009972 | cytidine catabolic process(GO:0006216) cytidine deamination(GO:0009972) cytidine metabolic process(GO:0046087) |
| 1.9 | 5.6 | GO:0006116 | NADH oxidation(GO:0006116) |
| 1.9 | 5.6 | GO:0048560 | establishment of anatomical structure orientation(GO:0048560) |
| 1.9 | 9.3 | GO:0021960 | anterior commissure morphogenesis(GO:0021960) ciliary body morphogenesis(GO:0061073) |
| 1.9 | 7.4 | GO:0006642 | triglyceride mobilization(GO:0006642) |
| 1.8 | 7.3 | GO:0032304 | negative regulation of icosanoid secretion(GO:0032304) |
| 1.8 | 5.5 | GO:0046833 | positive regulation of RNA export from nucleus(GO:0046833) |
| 1.8 | 9.0 | GO:0006177 | GMP biosynthetic process(GO:0006177) |
| 1.7 | 8.7 | GO:0070459 | prolactin secretion(GO:0070459) |
| 1.7 | 8.7 | GO:0044691 | tooth eruption(GO:0044691) |
| 1.7 | 6.9 | GO:0042985 | negative regulation of amyloid precursor protein biosynthetic process(GO:0042985) |
| 1.7 | 5.1 | GO:0035425 | autocrine signaling(GO:0035425) |
| 1.7 | 3.4 | GO:0015864 | pyrimidine nucleoside transport(GO:0015864) |
| 1.7 | 3.3 | GO:0060399 | positive regulation of growth hormone receptor signaling pathway(GO:0060399) |
| 1.7 | 3.3 | GO:1901382 | chorionic trophoblast cell proliferation(GO:0097360) regulation of chorionic trophoblast cell proliferation(GO:1901382) |
| 1.7 | 11.6 | GO:0010587 | miRNA catabolic process(GO:0010587) |
| 1.7 | 6.6 | GO:0097167 | circadian regulation of translation(GO:0097167) |
| 1.6 | 4.9 | GO:0033306 | phytol metabolic process(GO:0033306) fatty alcohol metabolic process(GO:1903173) |
| 1.6 | 4.9 | GO:0006742 | NADP catabolic process(GO:0006742) |
| 1.6 | 31.7 | GO:0045948 | positive regulation of translational initiation(GO:0045948) |
| 1.6 | 4.7 | GO:0044339 | canonical Wnt signaling pathway involved in osteoblast differentiation(GO:0044339) |
| 1.6 | 3.1 | GO:0001543 | ovarian follicle rupture(GO:0001543) |
| 1.6 | 40.7 | GO:0043567 | regulation of insulin-like growth factor receptor signaling pathway(GO:0043567) |
| 1.6 | 9.4 | GO:2000623 | regulation of nuclear-transcribed mRNA catabolic process, nonsense-mediated decay(GO:2000622) negative regulation of nuclear-transcribed mRNA catabolic process, nonsense-mediated decay(GO:2000623) |
| 1.6 | 4.7 | GO:0016128 | phytosteroid metabolic process(GO:0016128) phytosteroid biosynthetic process(GO:0016129) |
| 1.5 | 17.0 | GO:0006228 | UTP biosynthetic process(GO:0006228) |
| 1.5 | 4.6 | GO:0032298 | positive regulation of DNA-dependent DNA replication initiation(GO:0032298) |
| 1.5 | 20.0 | GO:0051151 | negative regulation of smooth muscle cell differentiation(GO:0051151) |
| 1.5 | 22.5 | GO:0051450 | myoblast proliferation(GO:0051450) |
| 1.5 | 3.0 | GO:0002085 | inhibition of neuroepithelial cell differentiation(GO:0002085) negative regulation of auditory receptor cell differentiation(GO:0045608) negative regulation of pro-B cell differentiation(GO:2000974) |
| 1.5 | 3.0 | GO:0061009 | common bile duct development(GO:0061009) |
| 1.5 | 1.5 | GO:0061010 | gall bladder development(GO:0061010) |
| 1.5 | 4.4 | GO:1903348 | positive regulation of bicellular tight junction assembly(GO:1903348) |
| 1.5 | 13.1 | GO:0035878 | nail development(GO:0035878) |
| 1.5 | 4.4 | GO:0051037 | regulation of transcription involved in meiotic cell cycle(GO:0051037) |
| 1.5 | 7.3 | GO:0002190 | cap-independent translational initiation(GO:0002190) |
| 1.4 | 8.6 | GO:0050917 | sensory perception of umami taste(GO:0050917) |
| 1.4 | 25.9 | GO:0046337 | phosphatidylethanolamine metabolic process(GO:0046337) |
| 1.4 | 5.8 | GO:0030576 | Cajal body organization(GO:0030576) |
| 1.4 | 10.0 | GO:0034650 | cortisol metabolic process(GO:0034650) cortisol biosynthetic process(GO:0034651) |
| 1.4 | 17.1 | GO:0060628 | regulation of ER to Golgi vesicle-mediated transport(GO:0060628) |
| 1.4 | 5.7 | GO:0001582 | detection of chemical stimulus involved in sensory perception of sweet taste(GO:0001582) |
| 1.4 | 12.7 | GO:0035879 | plasma membrane lactate transport(GO:0035879) |
| 1.4 | 9.9 | GO:0045630 | positive regulation of T-helper 2 cell differentiation(GO:0045630) |
| 1.4 | 11.3 | GO:0051182 | coenzyme transport(GO:0051182) |
| 1.4 | 7.1 | GO:1902525 | regulation of protein monoubiquitination(GO:1902525) |
| 1.4 | 2.8 | GO:0035964 | COPI-coated vesicle budding(GO:0035964) |
| 1.4 | 7.0 | GO:0031536 | positive regulation of exit from mitosis(GO:0031536) |
| 1.4 | 4.2 | GO:0015938 | coenzyme A catabolic process(GO:0015938) nucleoside bisphosphate catabolic process(GO:0033869) ribonucleoside bisphosphate catabolic process(GO:0034031) purine nucleoside bisphosphate catabolic process(GO:0034034) fatty-acyl-CoA catabolic process(GO:0036115) |
| 1.4 | 22.3 | GO:0030150 | protein import into mitochondrial matrix(GO:0030150) |
| 1.4 | 8.3 | GO:0090286 | cytoskeletal anchoring at nuclear membrane(GO:0090286) |
| 1.4 | 2.8 | GO:0046416 | D-amino acid metabolic process(GO:0046416) |
| 1.4 | 8.2 | GO:0060296 | regulation of cilium movement involved in cell motility(GO:0060295) regulation of cilium beat frequency involved in ciliary motility(GO:0060296) regulation of cilium-dependent cell motility(GO:1902019) |
| 1.4 | 2.7 | GO:0001757 | somite specification(GO:0001757) |
| 1.4 | 1.4 | GO:0034971 | histone H3-R17 methylation(GO:0034971) |
| 1.4 | 2.7 | GO:0000294 | nuclear-transcribed mRNA catabolic process, endonucleolytic cleavage-dependent decay(GO:0000294) |
| 1.4 | 14.9 | GO:0005981 | regulation of glycogen catabolic process(GO:0005981) |
| 1.3 | 29.6 | GO:0009081 | branched-chain amino acid metabolic process(GO:0009081) |
| 1.3 | 6.7 | GO:0006741 | NADP biosynthetic process(GO:0006741) |
| 1.3 | 13.4 | GO:0043922 | negative regulation by host of viral transcription(GO:0043922) |
| 1.3 | 7.9 | GO:0031584 | activation of phospholipase D activity(GO:0031584) |
| 1.3 | 35.6 | GO:0048255 | mRNA stabilization(GO:0048255) |
| 1.3 | 9.2 | GO:0043686 | co-translational protein modification(GO:0043686) |
| 1.3 | 5.3 | GO:0045347 | negative regulation of MHC class II biosynthetic process(GO:0045347) |
| 1.3 | 6.5 | GO:0009758 | carbohydrate utilization(GO:0009758) |
| 1.3 | 7.8 | GO:0006041 | glucosamine metabolic process(GO:0006041) |
| 1.3 | 7.8 | GO:0008635 | activation of cysteine-type endopeptidase activity involved in apoptotic process by cytochrome c(GO:0008635) |
| 1.3 | 5.1 | GO:0015860 | purine nucleoside transmembrane transport(GO:0015860) |
| 1.3 | 8.9 | GO:0000492 | box C/D snoRNP assembly(GO:0000492) |
| 1.3 | 3.8 | GO:0044208 | 'de novo' AMP biosynthetic process(GO:0044208) |
| 1.3 | 5.0 | GO:1904045 | cellular response to aldosterone(GO:1904045) |
| 1.2 | 5.0 | GO:0048865 | stem cell fate commitment(GO:0048865) |
| 1.2 | 5.0 | GO:0010032 | meiotic chromosome condensation(GO:0010032) |
| 1.2 | 6.2 | GO:0039019 | pronephric nephron development(GO:0039019) |
| 1.2 | 4.9 | GO:0043461 | proton-transporting ATP synthase complex assembly(GO:0043461) proton-transporting ATP synthase complex biogenesis(GO:0070272) |
| 1.2 | 9.8 | GO:1990034 | calcium ion export from cell(GO:1990034) |
| 1.2 | 4.9 | GO:0052314 | phytoalexin metabolic process(GO:0052314) |
| 1.2 | 11.0 | GO:0090220 | meiotic telomere clustering(GO:0045141) chromosome localization to nuclear envelope involved in homologous chromosome segregation(GO:0090220) |
| 1.2 | 8.5 | GO:0032926 | negative regulation of activin receptor signaling pathway(GO:0032926) |
| 1.2 | 9.7 | GO:0098706 | ferric iron import into cell(GO:0097461) ferric iron import across plasma membrane(GO:0098706) |
| 1.2 | 4.7 | GO:0034080 | CENP-A containing nucleosome assembly(GO:0034080) CENP-A containing chromatin organization(GO:0061641) |
| 1.2 | 5.8 | GO:0070940 | dephosphorylation of RNA polymerase II C-terminal domain(GO:0070940) |
| 1.2 | 9.3 | GO:0042989 | sequestering of actin monomers(GO:0042989) |
| 1.2 | 4.6 | GO:0051708 | intracellular transport of viral protein in host cell(GO:0019060) symbiont intracellular protein transport in host(GO:0030581) intracellular protein transport in other organism involved in symbiotic interaction(GO:0051708) |
| 1.2 | 3.5 | GO:0006788 | heme oxidation(GO:0006788) |
| 1.1 | 9.2 | GO:0019852 | L-ascorbic acid metabolic process(GO:0019852) |
| 1.1 | 5.7 | GO:0000727 | double-strand break repair via break-induced replication(GO:0000727) |
| 1.1 | 29.6 | GO:0019373 | epoxygenase P450 pathway(GO:0019373) |
| 1.1 | 4.5 | GO:0090118 | receptor-mediated endocytosis of low-density lipoprotein particle involved in cholesterol transport(GO:0090118) |
| 1.1 | 3.4 | GO:0016598 | protein arginylation(GO:0016598) |
| 1.1 | 2.2 | GO:1903898 | negative regulation of PERK-mediated unfolded protein response(GO:1903898) |
| 1.1 | 9.9 | GO:1903025 | regulation of RNA polymerase II regulatory region sequence-specific DNA binding(GO:1903025) |
| 1.1 | 8.7 | GO:0032815 | negative regulation of natural killer cell activation(GO:0032815) |
| 1.1 | 1.1 | GO:0042640 | anagen(GO:0042640) regulation of anagen(GO:0051884) |
| 1.1 | 9.7 | GO:0035372 | protein localization to microtubule(GO:0035372) |
| 1.1 | 4.3 | GO:0021747 | cochlear nucleus development(GO:0021747) |
| 1.1 | 3.2 | GO:1901856 | negative regulation of cellular respiration(GO:1901856) |
| 1.1 | 10.6 | GO:0015886 | heme transport(GO:0015886) |
| 1.1 | 8.4 | GO:0006107 | oxaloacetate metabolic process(GO:0006107) |
| 1.1 | 1.1 | GO:0044828 | negative regulation by host of viral genome replication(GO:0044828) |
| 1.0 | 4.2 | GO:0097680 | double-strand break repair via classical nonhomologous end joining(GO:0097680) |
| 1.0 | 4.1 | GO:2000857 | positive regulation of mineralocorticoid secretion(GO:2000857) positive regulation of aldosterone secretion(GO:2000860) |
| 1.0 | 5.2 | GO:0070127 | tRNA aminoacylation for mitochondrial protein translation(GO:0070127) |
| 1.0 | 3.1 | GO:0016480 | negative regulation of transcription from RNA polymerase III promoter(GO:0016480) |
| 1.0 | 8.3 | GO:2000680 | regulation of rubidium ion transport(GO:2000680) |
| 1.0 | 2.1 | GO:0000448 | cleavage in ITS2 between 5.8S rRNA and LSU-rRNA of tricistronic rRNA transcript (SSU-rRNA, 5.8S rRNA, LSU-rRNA)(GO:0000448) |
| 1.0 | 3.1 | GO:0048319 | axial mesoderm morphogenesis(GO:0048319) |
| 1.0 | 10.1 | GO:0070314 | G1 to G0 transition(GO:0070314) |
| 1.0 | 2.0 | GO:0035510 | DNA dealkylation(GO:0035510) |
| 1.0 | 1.0 | GO:0090032 | negative regulation of steroid hormone biosynthetic process(GO:0090032) |
| 1.0 | 3.0 | GO:0000105 | histidine biosynthetic process(GO:0000105) |
| 1.0 | 2.0 | GO:0071284 | cellular response to lead ion(GO:0071284) |
| 1.0 | 4.9 | GO:0090168 | Golgi reassembly(GO:0090168) |
| 1.0 | 12.6 | GO:0048853 | forebrain morphogenesis(GO:0048853) |
| 1.0 | 10.7 | GO:0006013 | mannose metabolic process(GO:0006013) |
| 1.0 | 14.5 | GO:0015937 | coenzyme A biosynthetic process(GO:0015937) |
| 1.0 | 2.9 | GO:0006436 | tryptophanyl-tRNA aminoacylation(GO:0006436) |
| 1.0 | 4.8 | GO:0035948 | positive regulation of gluconeogenesis by positive regulation of transcription from RNA polymerase II promoter(GO:0035948) |
| 1.0 | 6.7 | GO:0035740 | CD8-positive, alpha-beta T cell proliferation(GO:0035740) |
| 1.0 | 5.7 | GO:0048227 | plasma membrane to endosome transport(GO:0048227) |
| 0.9 | 0.9 | GO:0007354 | zygotic determination of anterior/posterior axis, embryo(GO:0007354) |
| 0.9 | 5.6 | GO:0061087 | positive regulation of histone H3-K27 methylation(GO:0061087) |
| 0.9 | 16.7 | GO:0043968 | histone H2A acetylation(GO:0043968) |
| 0.9 | 3.7 | GO:0070650 | actin filament bundle distribution(GO:0070650) |
| 0.9 | 18.5 | GO:0000289 | nuclear-transcribed mRNA poly(A) tail shortening(GO:0000289) |
| 0.9 | 14.7 | GO:0048312 | intracellular distribution of mitochondria(GO:0048312) |
| 0.9 | 5.5 | GO:0045329 | carnitine biosynthetic process(GO:0045329) |
| 0.9 | 4.5 | GO:0045039 | protein import into mitochondrial inner membrane(GO:0045039) |
| 0.9 | 1.8 | GO:0071386 | cellular response to corticosterone stimulus(GO:0071386) |
| 0.9 | 7.1 | GO:1903405 | protein localization to nuclear body(GO:1903405) protein localization to Cajal body(GO:1904867) regulation of protein localization to Cajal body(GO:1904869) positive regulation of protein localization to Cajal body(GO:1904871) protein localization to nucleoplasm(GO:1990173) |
| 0.9 | 4.4 | GO:0001992 | regulation of systemic arterial blood pressure by vasopressin(GO:0001992) |
| 0.9 | 5.3 | GO:0010825 | positive regulation of centrosome duplication(GO:0010825) |
| 0.9 | 1.8 | GO:0048617 | foregut morphogenesis(GO:0007440) embryonic foregut morphogenesis(GO:0048617) |
| 0.9 | 9.6 | GO:0006957 | complement activation, alternative pathway(GO:0006957) |
| 0.9 | 2.6 | GO:1903699 | tarsal gland development(GO:1903699) |
| 0.9 | 20.9 | GO:0060445 | branching involved in salivary gland morphogenesis(GO:0060445) |
| 0.9 | 2.6 | GO:0018201 | N-terminal protein amino acid methylation(GO:0006480) peptidyl-glycine modification(GO:0018201) |
| 0.9 | 2.6 | GO:2000359 | regulation of binding of sperm to zona pellucida(GO:2000359) negative regulation of binding of sperm to zona pellucida(GO:2000360) |
| 0.9 | 3.4 | GO:0060454 | positive regulation of gastric acid secretion(GO:0060454) |
| 0.8 | 2.5 | GO:0032972 | regulation of muscle filament sliding speed(GO:0032972) |
| 0.8 | 5.8 | GO:0090344 | negative regulation of cell aging(GO:0090344) |
| 0.8 | 5.8 | GO:0048368 | lateral mesoderm development(GO:0048368) |
| 0.8 | 6.6 | GO:0051503 | ATP transport(GO:0015867) adenine nucleotide transport(GO:0051503) |
| 0.8 | 8.2 | GO:0046855 | inositol phosphate dephosphorylation(GO:0046855) |
| 0.8 | 6.5 | GO:0051599 | response to hydrostatic pressure(GO:0051599) |
| 0.8 | 6.5 | GO:0006689 | ganglioside catabolic process(GO:0006689) |
| 0.8 | 0.8 | GO:1904378 | maintenance of unfolded protein(GO:0036506) maintenance of unfolded protein involved in ERAD pathway(GO:1904378) |
| 0.8 | 2.4 | GO:0070084 | protein initiator methionine removal(GO:0070084) |
| 0.8 | 4.8 | GO:0042760 | very long-chain fatty acid catabolic process(GO:0042760) |
| 0.8 | 4.8 | GO:0042997 | negative regulation of Golgi to plasma membrane protein transport(GO:0042997) |
| 0.8 | 32.9 | GO:0010501 | RNA secondary structure unwinding(GO:0010501) |
| 0.8 | 5.5 | GO:0033313 | meiotic cell cycle checkpoint(GO:0033313) |
| 0.8 | 1.6 | GO:0006567 | threonine catabolic process(GO:0006567) |
| 0.8 | 7.8 | GO:1900029 | positive regulation of ruffle assembly(GO:1900029) |
| 0.8 | 7.7 | GO:1904153 | negative regulation of protein exit from endoplasmic reticulum(GO:0070862) negative regulation of retrograde protein transport, ER to cytosol(GO:1904153) |
| 0.8 | 2.3 | GO:0097327 | response to antineoplastic agent(GO:0097327) |
| 0.8 | 9.2 | GO:0048642 | negative regulation of skeletal muscle tissue development(GO:0048642) |
| 0.8 | 3.8 | GO:0040034 | regulation of development, heterochronic(GO:0040034) |
| 0.8 | 19.0 | GO:0048240 | sperm capacitation(GO:0048240) |
| 0.8 | 9.1 | GO:0055015 | ventricular cardiac muscle cell development(GO:0055015) |
| 0.8 | 4.6 | GO:0055089 | fatty acid homeostasis(GO:0055089) |
| 0.8 | 3.8 | GO:0072553 | terminal button organization(GO:0072553) |
| 0.8 | 12.1 | GO:0051988 | regulation of attachment of spindle microtubules to kinetochore(GO:0051988) |
| 0.8 | 5.3 | GO:0043654 | recognition of apoptotic cell(GO:0043654) |
| 0.8 | 2.3 | GO:0007161 | calcium-independent cell-matrix adhesion(GO:0007161) |
| 0.7 | 2.2 | GO:1902963 | regulation of aspartic-type endopeptidase activity involved in amyloid precursor protein catabolic process(GO:1902959) positive regulation of aspartic-type endopeptidase activity involved in amyloid precursor protein catabolic process(GO:1902961) regulation of metalloendopeptidase activity involved in amyloid precursor protein catabolic process(GO:1902962) negative regulation of metalloendopeptidase activity involved in amyloid precursor protein catabolic process(GO:1902963) regulation of aspartic-type peptidase activity(GO:1905245) positive regulation of aspartic-type peptidase activity(GO:1905247) |
| 0.7 | 8.2 | GO:1904294 | positive regulation of ERAD pathway(GO:1904294) |
| 0.7 | 2.2 | GO:0015074 | DNA integration(GO:0015074) |
| 0.7 | 3.7 | GO:0006336 | DNA replication-independent nucleosome assembly(GO:0006336) |
| 0.7 | 6.6 | GO:0048934 | peripheral nervous system neuron differentiation(GO:0048934) peripheral nervous system neuron development(GO:0048935) |
| 0.7 | 4.4 | GO:0006362 | transcription elongation from RNA polymerase I promoter(GO:0006362) |
| 0.7 | 1.5 | GO:0006435 | threonyl-tRNA aminoacylation(GO:0006435) |
| 0.7 | 2.2 | GO:0046884 | follicle-stimulating hormone secretion(GO:0046884) |
| 0.7 | 4.3 | GO:0048387 | negative regulation of retinoic acid receptor signaling pathway(GO:0048387) |
| 0.7 | 3.6 | GO:0045835 | negative regulation of meiotic nuclear division(GO:0045835) |
| 0.7 | 2.2 | GO:0010499 | proteasomal ubiquitin-independent protein catabolic process(GO:0010499) |
| 0.7 | 2.1 | GO:0080120 | CAAX-box protein processing(GO:0071586) CAAX-box protein maturation(GO:0080120) |
| 0.7 | 1.4 | GO:0044107 | calcitriol biosynthetic process from calciol(GO:0036378) cellular alcohol metabolic process(GO:0044107) cellular alcohol biosynthetic process(GO:0044108) |
| 0.7 | 2.1 | GO:0097010 | eukaryotic translation initiation factor 4F complex assembly(GO:0097010) |
| 0.7 | 5.7 | GO:0032957 | inositol trisphosphate metabolic process(GO:0032957) |
| 0.7 | 11.8 | GO:0045662 | negative regulation of myoblast differentiation(GO:0045662) |
| 0.7 | 4.2 | GO:0045541 | negative regulation of cholesterol biosynthetic process(GO:0045541) negative regulation of cholesterol metabolic process(GO:0090206) |
| 0.7 | 9.0 | GO:0072520 | seminiferous tubule development(GO:0072520) |
| 0.7 | 19.3 | GO:0030261 | chromosome condensation(GO:0030261) |
| 0.7 | 4.8 | GO:0060767 | epithelial cell proliferation involved in prostate gland development(GO:0060767) regulation of epithelial cell proliferation involved in prostate gland development(GO:0060768) negative regulation of epithelial cell proliferation involved in prostate gland development(GO:0060770) |
| 0.7 | 16.4 | GO:0006855 | drug transmembrane transport(GO:0006855) |
| 0.7 | 8.8 | GO:0010818 | T cell chemotaxis(GO:0010818) |
| 0.7 | 1.4 | GO:0038183 | bile acid signaling pathway(GO:0038183) |
| 0.7 | 4.1 | GO:0033314 | mitotic DNA replication checkpoint(GO:0033314) |
| 0.7 | 1.3 | GO:0080033 | neural fold elevation formation(GO:0021502) cellular response to nitrite(GO:0071250) response to nitrite(GO:0080033) |
| 0.7 | 4.7 | GO:0000012 | single strand break repair(GO:0000012) |
| 0.7 | 5.3 | GO:0015712 | hexose phosphate transport(GO:0015712) glucose-6-phosphate transport(GO:0015760) |
| 0.7 | 2.0 | GO:1904211 | membrane protein proteolysis involved in retrograde protein transport, ER to cytosol(GO:1904211) |
| 0.7 | 2.7 | GO:0002326 | B cell lineage commitment(GO:0002326) |
| 0.7 | 3.3 | GO:0006545 | glycine biosynthetic process(GO:0006545) |
| 0.7 | 2.6 | GO:1904354 | negative regulation of telomere capping(GO:1904354) |
| 0.7 | 3.9 | GO:0061158 | 3'-UTR-mediated mRNA destabilization(GO:0061158) |
| 0.6 | 1.9 | GO:0018364 | peptidyl-glutamine methylation(GO:0018364) |
| 0.6 | 29.6 | GO:0048477 | oogenesis(GO:0048477) |
| 0.6 | 22.5 | GO:0000387 | spliceosomal snRNP assembly(GO:0000387) |
| 0.6 | 6.4 | GO:0045714 | regulation of low-density lipoprotein particle receptor biosynthetic process(GO:0045714) |
| 0.6 | 3.2 | GO:0034141 | positive regulation of toll-like receptor 3 signaling pathway(GO:0034141) |
| 0.6 | 2.5 | GO:0007008 | outer mitochondrial membrane organization(GO:0007008) protein import into mitochondrial outer membrane(GO:0045040) |
| 0.6 | 3.8 | GO:0018095 | protein polyglutamylation(GO:0018095) |
| 0.6 | 2.5 | GO:0090234 | regulation of centromere complex assembly(GO:0090230) regulation of kinetochore assembly(GO:0090234) |
| 0.6 | 6.2 | GO:0001731 | formation of translation preinitiation complex(GO:0001731) |
| 0.6 | 1.2 | GO:0042196 | chlorinated hydrocarbon metabolic process(GO:0042196) halogenated hydrocarbon metabolic process(GO:0042197) |
| 0.6 | 3.1 | GO:0043951 | negative regulation of cAMP-mediated signaling(GO:0043951) |
| 0.6 | 4.9 | GO:1900264 | regulation of DNA-directed DNA polymerase activity(GO:1900262) positive regulation of DNA-directed DNA polymerase activity(GO:1900264) |
| 0.6 | 1.8 | GO:0000055 | ribosomal large subunit export from nucleus(GO:0000055) |
| 0.6 | 1.8 | GO:0061146 | Peyer's patch morphogenesis(GO:0061146) |
| 0.6 | 2.4 | GO:0061304 | retinal blood vessel morphogenesis(GO:0061304) |
| 0.6 | 0.6 | GO:0045653 | negative regulation of megakaryocyte differentiation(GO:0045653) |
| 0.6 | 1.8 | GO:0001682 | tRNA 5'-leader removal(GO:0001682) |
| 0.6 | 3.0 | GO:0034154 | toll-like receptor 7 signaling pathway(GO:0034154) |
| 0.6 | 4.8 | GO:0097068 | response to thyroxine(GO:0097068) |
| 0.6 | 3.0 | GO:0000076 | DNA replication checkpoint(GO:0000076) |
| 0.6 | 4.2 | GO:1901030 | positive regulation of mitochondrial outer membrane permeabilization involved in apoptotic signaling pathway(GO:1901030) |
| 0.6 | 7.0 | GO:0060088 | auditory receptor cell stereocilium organization(GO:0060088) |
| 0.6 | 4.0 | GO:0033689 | negative regulation of osteoblast proliferation(GO:0033689) |
| 0.6 | 4.0 | GO:0006729 | tetrahydrobiopterin biosynthetic process(GO:0006729) |
| 0.6 | 1.7 | GO:1901838 | positive regulation of transcription of nuclear large rRNA transcript from RNA polymerase I promoter(GO:1901838) |
| 0.6 | 9.2 | GO:0008211 | glucocorticoid metabolic process(GO:0008211) |
| 0.6 | 1.1 | GO:0000912 | assembly of actomyosin apparatus involved in cytokinesis(GO:0000912) actomyosin contractile ring assembly(GO:0000915) actomyosin contractile ring organization(GO:0044837) |
| 0.6 | 10.3 | GO:1900004 | regulation of serine-type endopeptidase activity(GO:1900003) negative regulation of serine-type endopeptidase activity(GO:1900004) regulation of serine-type peptidase activity(GO:1902571) negative regulation of serine-type peptidase activity(GO:1902572) |
| 0.6 | 6.3 | GO:0042407 | cristae formation(GO:0042407) |
| 0.6 | 9.1 | GO:0055070 | copper ion homeostasis(GO:0055070) |
| 0.6 | 2.8 | GO:0048311 | mitochondrion distribution(GO:0048311) |
| 0.6 | 11.8 | GO:0070816 | phosphorylation of RNA polymerase II C-terminal domain(GO:0070816) |
| 0.6 | 1.7 | GO:1905073 | proepicardium development(GO:0003342) septum transversum development(GO:0003343) occluding junction disassembly(GO:1905071) regulation of occluding junction disassembly(GO:1905073) positive regulation of occluding junction disassembly(GO:1905075) |
| 0.6 | 4.5 | GO:0031936 | negative regulation of chromatin silencing(GO:0031936) |
| 0.6 | 6.1 | GO:1990118 | sodium ion import across plasma membrane(GO:0098719) sodium ion import into cell(GO:1990118) |
| 0.6 | 1.7 | GO:0006432 | phenylalanyl-tRNA aminoacylation(GO:0006432) |
| 0.6 | 2.8 | GO:0033685 | negative regulation of luteinizing hormone secretion(GO:0033685) negative regulation of follicle-stimulating hormone secretion(GO:0046882) |
| 0.5 | 2.7 | GO:0010044 | response to aluminum ion(GO:0010044) |
| 0.5 | 0.5 | GO:0032639 | TRAIL production(GO:0032639) regulation of TRAIL production(GO:0032679) positive regulation of TRAIL production(GO:0032759) |
| 0.5 | 2.2 | GO:0002184 | cytoplasmic translational termination(GO:0002184) |
| 0.5 | 2.2 | GO:0009068 | aspartate family amino acid catabolic process(GO:0009068) |
| 0.5 | 1.1 | GO:0010918 | positive regulation of mitochondrial membrane potential(GO:0010918) |
| 0.5 | 1.6 | GO:0071233 | cellular response to leucine(GO:0071233) |
| 0.5 | 1.6 | GO:0021570 | rhombomere 3 development(GO:0021569) rhombomere 4 development(GO:0021570) |
| 0.5 | 1.6 | GO:0038110 | interleukin-2-mediated signaling pathway(GO:0038110) |
| 0.5 | 1.6 | GO:1903867 | chorion development(GO:0060717) extraembryonic membrane development(GO:1903867) |
| 0.5 | 2.7 | GO:0015809 | arginine transport(GO:0015809) |
| 0.5 | 2.1 | GO:0010510 | regulation of acetyl-CoA biosynthetic process from pyruvate(GO:0010510) |
| 0.5 | 5.8 | GO:0006068 | ethanol catabolic process(GO:0006068) |
| 0.5 | 3.2 | GO:0021559 | trigeminal nerve development(GO:0021559) |
| 0.5 | 7.9 | GO:0033327 | Leydig cell differentiation(GO:0033327) |
| 0.5 | 209.8 | GO:0048232 | male gamete generation(GO:0048232) |
| 0.5 | 3.6 | GO:0007320 | insemination(GO:0007320) |
| 0.5 | 0.5 | GO:0060702 | negative regulation of ribonuclease activity(GO:0060701) negative regulation of endoribonuclease activity(GO:0060702) |
| 0.5 | 5.7 | GO:0010792 | DNA double-strand break processing involved in repair via single-strand annealing(GO:0010792) |
| 0.5 | 15.9 | GO:0035019 | somatic stem cell population maintenance(GO:0035019) |
| 0.5 | 3.1 | GO:0000972 | transcription-dependent tethering of RNA polymerase II gene DNA at nuclear periphery(GO:0000972) |
| 0.5 | 8.7 | GO:1902187 | negative regulation of viral release from host cell(GO:1902187) |
| 0.5 | 1.5 | GO:0060708 | spongiotrophoblast differentiation(GO:0060708) |
| 0.5 | 1.5 | GO:1990009 | retinal cell apoptotic process(GO:1990009) |
| 0.5 | 5.0 | GO:0090070 | positive regulation of ribosome biogenesis(GO:0090070) positive regulation of rRNA processing(GO:2000234) |
| 0.5 | 4.0 | GO:0035413 | positive regulation of catenin import into nucleus(GO:0035413) |
| 0.5 | 1.5 | GO:1903912 | negative regulation of endoplasmic reticulum stress-induced eIF2 alpha phosphorylation(GO:1903912) |
| 0.5 | 2.0 | GO:0045650 | negative regulation of macrophage differentiation(GO:0045650) |
| 0.5 | 2.5 | GO:1903772 | regulation of viral budding via host ESCRT complex(GO:1903772) |
| 0.5 | 1.0 | GO:0060846 | arterial endothelial cell fate commitment(GO:0060844) blood vessel endothelial cell fate commitment(GO:0060846) positive regulation of transcription from RNA polymerase II promoter in response to hypoxia(GO:0061419) blood vessel endothelial cell fate specification(GO:0097101) regulation of canonical Wnt signaling pathway involved in cardiac muscle cell fate commitment(GO:1901295) regulation of canonical Wnt signaling pathway involved in heart development(GO:1905066) |
| 0.5 | 1.0 | GO:0002018 | renin-angiotensin regulation of aldosterone production(GO:0002018) |
| 0.5 | 5.9 | GO:0060573 | ventral spinal cord interneuron specification(GO:0021521) cell fate specification involved in pattern specification(GO:0060573) |
| 0.5 | 3.4 | GO:0046504 | ether lipid biosynthetic process(GO:0008611) glycerol ether biosynthetic process(GO:0046504) ether biosynthetic process(GO:1901503) |
| 0.5 | 6.9 | GO:0035404 | histone-serine phosphorylation(GO:0035404) |
| 0.5 | 2.4 | GO:0070345 | negative regulation of fat cell proliferation(GO:0070345) |
| 0.5 | 1.0 | GO:0070601 | centromeric sister chromatid cohesion(GO:0070601) |
| 0.5 | 0.5 | GO:1902093 | positive regulation of sperm motility(GO:1902093) |
| 0.5 | 0.5 | GO:2000814 | positive regulation of barbed-end actin filament capping(GO:2000814) |
| 0.5 | 0.9 | GO:1900186 | negative regulation of clathrin-mediated endocytosis(GO:1900186) |
| 0.5 | 1.9 | GO:0032227 | negative regulation of synaptic transmission, dopaminergic(GO:0032227) |
| 0.5 | 8.0 | GO:0090190 | positive regulation of branching involved in ureteric bud morphogenesis(GO:0090190) |
| 0.5 | 3.7 | GO:0070933 | histone H4 deacetylation(GO:0070933) |
| 0.5 | 0.9 | GO:0019230 | proprioception(GO:0019230) |
| 0.5 | 15.8 | GO:0006739 | NADP metabolic process(GO:0006739) |
| 0.5 | 1.4 | GO:0002101 | tRNA wobble cytosine modification(GO:0002101) |
| 0.5 | 3.2 | GO:0071460 | cellular response to cell-matrix adhesion(GO:0071460) |
| 0.4 | 3.1 | GO:0097428 | protein maturation by iron-sulfur cluster transfer(GO:0097428) |
| 0.4 | 3.9 | GO:0061088 | sequestering of zinc ion(GO:0032119) regulation of sequestering of zinc ion(GO:0061088) |
| 0.4 | 2.2 | GO:0048539 | bone marrow development(GO:0048539) |
| 0.4 | 10.9 | GO:0000184 | nuclear-transcribed mRNA catabolic process, nonsense-mediated decay(GO:0000184) |
| 0.4 | 6.1 | GO:0051601 | exocyst localization(GO:0051601) |
| 0.4 | 3.9 | GO:2000060 | positive regulation of protein ubiquitination involved in ubiquitin-dependent protein catabolic process(GO:2000060) |
| 0.4 | 2.1 | GO:0061299 | retina vasculature morphogenesis in camera-type eye(GO:0061299) |
| 0.4 | 2.1 | GO:0090308 | regulation of methylation-dependent chromatin silencing(GO:0090308) |
| 0.4 | 3.0 | GO:0000463 | maturation of LSU-rRNA from tricistronic rRNA transcript (SSU-rRNA, 5.8S rRNA, LSU-rRNA)(GO:0000463) |
| 0.4 | 2.5 | GO:0017196 | N-terminal peptidyl-methionine acetylation(GO:0017196) |
| 0.4 | 6.3 | GO:0043312 | neutrophil degranulation(GO:0043312) |
| 0.4 | 1.3 | GO:0016103 | diterpenoid catabolic process(GO:0016103) retinoic acid catabolic process(GO:0034653) |
| 0.4 | 1.3 | GO:0071494 | cellular response to UV-C(GO:0071494) |
| 0.4 | 10.8 | GO:0000002 | mitochondrial genome maintenance(GO:0000002) |
| 0.4 | 2.5 | GO:0006390 | transcription from mitochondrial promoter(GO:0006390) |
| 0.4 | 6.6 | GO:0006613 | cotranslational protein targeting to membrane(GO:0006613) |
| 0.4 | 20.7 | GO:0034605 | cellular response to heat(GO:0034605) |
| 0.4 | 5.8 | GO:0035825 | reciprocal meiotic recombination(GO:0007131) reciprocal DNA recombination(GO:0035825) |
| 0.4 | 7.4 | GO:0019432 | triglyceride biosynthetic process(GO:0019432) |
| 0.4 | 0.8 | GO:1903576 | response to L-arginine(GO:1903576) |
| 0.4 | 7.3 | GO:0010800 | positive regulation of peptidyl-threonine phosphorylation(GO:0010800) |
| 0.4 | 2.4 | GO:0097338 | response to clozapine(GO:0097338) |
| 0.4 | 3.6 | GO:0031998 | regulation of fatty acid beta-oxidation(GO:0031998) |
| 0.4 | 3.5 | GO:0051574 | positive regulation of histone H3-K9 methylation(GO:0051574) |
| 0.4 | 2.4 | GO:0061074 | regulation of neural retina development(GO:0061074) |
| 0.4 | 2.8 | GO:0006659 | phosphatidylserine biosynthetic process(GO:0006659) |
| 0.4 | 6.6 | GO:0031440 | regulation of mRNA 3'-end processing(GO:0031440) |
| 0.4 | 1.9 | GO:0010225 | response to UV-C(GO:0010225) |
| 0.4 | 4.2 | GO:0097435 | fibril organization(GO:0097435) |
| 0.4 | 4.2 | GO:0043162 | ubiquitin-dependent protein catabolic process via the multivesicular body sorting pathway(GO:0043162) |
| 0.4 | 3.0 | GO:0006348 | chromatin silencing at telomere(GO:0006348) |
| 0.4 | 4.5 | GO:0032958 | inositol phosphate biosynthetic process(GO:0032958) |
| 0.4 | 1.1 | GO:0032289 | central nervous system myelin formation(GO:0032289) |
| 0.4 | 9.3 | GO:0006335 | DNA replication-dependent nucleosome assembly(GO:0006335) DNA replication-dependent nucleosome organization(GO:0034723) |
| 0.4 | 13.6 | GO:0001523 | retinoid metabolic process(GO:0001523) |
| 0.4 | 13.4 | GO:0051290 | protein heterotetramerization(GO:0051290) |
| 0.4 | 1.1 | GO:0042256 | mature ribosome assembly(GO:0042256) |
| 0.4 | 0.7 | GO:0060585 | regulation of prostaglandin-endoperoxide synthase activity(GO:0060584) positive regulation of prostaglandin-endoperoxide synthase activity(GO:0060585) |
| 0.4 | 2.1 | GO:1904116 | response to vasopressin(GO:1904116) cellular response to vasopressin(GO:1904117) |
| 0.4 | 1.8 | GO:0018171 | peptidyl-cysteine oxidation(GO:0018171) |
| 0.4 | 4.6 | GO:0008272 | sulfate transport(GO:0008272) sulfate transmembrane transport(GO:1902358) |
| 0.3 | 3.1 | GO:0002092 | positive regulation of receptor internalization(GO:0002092) |
| 0.3 | 1.0 | GO:0051661 | maintenance of centrosome location(GO:0051661) |
| 0.3 | 2.8 | GO:0018298 | protein-chromophore linkage(GO:0018298) |
| 0.3 | 7.9 | GO:0010972 | negative regulation of G2/M transition of mitotic cell cycle(GO:0010972) |
| 0.3 | 0.7 | GO:0000432 | regulation of transcription from RNA polymerase II promoter by glucose(GO:0000430) positive regulation of transcription from RNA polymerase II promoter by glucose(GO:0000432) |
| 0.3 | 1.4 | GO:1904627 | response to phorbol 13-acetate 12-myristate(GO:1904627) cellular response to phorbol 13-acetate 12-myristate(GO:1904628) |
| 0.3 | 2.4 | GO:0051934 | dopamine uptake involved in synaptic transmission(GO:0051583) catecholamine uptake involved in synaptic transmission(GO:0051934) |
| 0.3 | 0.7 | GO:0033184 | regulation of primitive erythrocyte differentiation(GO:0010725) positive regulation of histone ubiquitination(GO:0033184) guanine metabolic process(GO:0046098) |
| 0.3 | 3.0 | GO:0045793 | positive regulation of cell size(GO:0045793) |
| 0.3 | 14.8 | GO:0015909 | long-chain fatty acid transport(GO:0015909) |
| 0.3 | 5.0 | GO:0036342 | post-anal tail morphogenesis(GO:0036342) |
| 0.3 | 2.0 | GO:0021707 | cerebellar granular layer formation(GO:0021684) cerebellar granule cell differentiation(GO:0021707) |
| 0.3 | 2.6 | GO:1903799 | negative regulation of production of miRNAs involved in gene silencing by miRNA(GO:1903799) |
| 0.3 | 4.8 | GO:0043011 | myeloid dendritic cell differentiation(GO:0043011) |
| 0.3 | 0.6 | GO:0010992 | ubiquitin homeostasis(GO:0010992) |
| 0.3 | 5.1 | GO:0032515 | negative regulation of phosphoprotein phosphatase activity(GO:0032515) |
| 0.3 | 1.3 | GO:0006004 | fucose metabolic process(GO:0006004) |
| 0.3 | 0.9 | GO:0090164 | asymmetric Golgi ribbon formation(GO:0090164) |
| 0.3 | 1.9 | GO:0006621 | protein retention in ER lumen(GO:0006621) |
| 0.3 | 0.6 | GO:0032241 | positive regulation of nucleobase-containing compound transport(GO:0032241) regulation of nucleoside transport(GO:0032242) negative regulation of neurotrophin production(GO:0032900) |
| 0.3 | 1.8 | GO:0015858 | nucleoside transport(GO:0015858) |
| 0.3 | 1.5 | GO:0036233 | glycine import(GO:0036233) |
| 0.3 | 4.7 | GO:0048672 | positive regulation of collateral sprouting(GO:0048672) |
| 0.3 | 2.1 | GO:0034377 | plasma lipoprotein particle assembly(GO:0034377) |
| 0.3 | 1.2 | GO:0006428 | isoleucyl-tRNA aminoacylation(GO:0006428) |
| 0.3 | 1.4 | GO:0051534 | negative regulation of NFAT protein import into nucleus(GO:0051534) |
| 0.3 | 1.7 | GO:0070164 | negative regulation of adiponectin secretion(GO:0070164) |
| 0.3 | 0.9 | GO:0039689 | negative stranded viral RNA replication(GO:0039689) multi-organism biosynthetic process(GO:0044034) |
| 0.3 | 2.2 | GO:0033299 | secretion of lysosomal enzymes(GO:0033299) |
| 0.3 | 1.4 | GO:0031119 | tRNA pseudouridine synthesis(GO:0031119) |
| 0.3 | 1.9 | GO:0006686 | sphingomyelin biosynthetic process(GO:0006686) |
| 0.3 | 1.9 | GO:0034551 | respiratory chain complex III assembly(GO:0017062) mitochondrial respiratory chain complex III assembly(GO:0034551) |
| 0.3 | 5.0 | GO:0046329 | negative regulation of JNK cascade(GO:0046329) |
| 0.3 | 7.6 | GO:0097502 | mannosylation(GO:0097502) |
| 0.3 | 6.5 | GO:0070534 | protein K63-linked ubiquitination(GO:0070534) |
| 0.3 | 1.6 | GO:2000659 | regulation of interleukin-1-mediated signaling pathway(GO:2000659) |
| 0.3 | 32.3 | GO:0042787 | protein ubiquitination involved in ubiquitin-dependent protein catabolic process(GO:0042787) |
| 0.3 | 1.8 | GO:0032986 | nucleosome disassembly(GO:0006337) protein-DNA complex disassembly(GO:0032986) |
| 0.3 | 3.1 | GO:0016339 | calcium-dependent cell-cell adhesion via plasma membrane cell adhesion molecules(GO:0016339) |
| 0.3 | 3.9 | GO:0006378 | mRNA polyadenylation(GO:0006378) |
| 0.3 | 8.2 | GO:0007032 | endosome organization(GO:0007032) |
| 0.3 | 10.2 | GO:0032543 | mitochondrial translation(GO:0032543) |
| 0.3 | 5.3 | GO:1990126 | retrograde transport, endosome to plasma membrane(GO:1990126) |
| 0.2 | 1.5 | GO:0033572 | transferrin transport(GO:0033572) |
| 0.2 | 4.0 | GO:0051443 | positive regulation of ubiquitin-protein transferase activity(GO:0051443) |
| 0.2 | 4.4 | GO:0000470 | maturation of LSU-rRNA(GO:0000470) |
| 0.2 | 5.1 | GO:0021591 | ventricular system development(GO:0021591) |
| 0.2 | 3.6 | GO:0015721 | bile acid and bile salt transport(GO:0015721) |
| 0.2 | 1.7 | GO:0010739 | positive regulation of protein kinase A signaling(GO:0010739) |
| 0.2 | 1.2 | GO:1905150 | regulation of voltage-gated sodium channel activity(GO:1905150) |
| 0.2 | 16.0 | GO:0008203 | cholesterol metabolic process(GO:0008203) |
| 0.2 | 1.9 | GO:0000478 | endonucleolytic cleavage involved in rRNA processing(GO:0000478) endonucleolytic cleavage of tricistronic rRNA transcript (SSU-rRNA, 5.8S rRNA, LSU-rRNA)(GO:0000479) |
| 0.2 | 1.2 | GO:0045218 | zonula adherens maintenance(GO:0045218) |
| 0.2 | 2.5 | GO:0060707 | trophoblast giant cell differentiation(GO:0060707) |
| 0.2 | 4.6 | GO:0006400 | tRNA modification(GO:0006400) |
| 0.2 | 4.6 | GO:0050686 | negative regulation of mRNA processing(GO:0050686) |
| 0.2 | 3.6 | GO:0016180 | snRNA processing(GO:0016180) |
| 0.2 | 3.2 | GO:0045063 | negative regulation of interferon-beta production(GO:0032688) T-helper 1 cell differentiation(GO:0045063) |
| 0.2 | 1.4 | GO:0046116 | queuosine biosynthetic process(GO:0008616) queuosine metabolic process(GO:0046116) |
| 0.2 | 3.1 | GO:0016226 | iron-sulfur cluster assembly(GO:0016226) metallo-sulfur cluster assembly(GO:0031163) |
| 0.2 | 2.9 | GO:0043488 | regulation of mRNA stability(GO:0043488) |
| 0.2 | 0.7 | GO:0032264 | IMP salvage(GO:0032264) |
| 0.2 | 1.3 | GO:0072718 | response to cisplatin(GO:0072718) |
| 0.2 | 8.3 | GO:0045600 | positive regulation of fat cell differentiation(GO:0045600) |
| 0.2 | 8.4 | GO:0042273 | ribosomal large subunit biogenesis(GO:0042273) |
| 0.2 | 0.4 | GO:0001982 | baroreceptor response to decreased systemic arterial blood pressure(GO:0001982) |
| 0.2 | 4.3 | GO:0010569 | regulation of double-strand break repair via homologous recombination(GO:0010569) |
| 0.2 | 4.0 | GO:0060351 | cartilage development involved in endochondral bone morphogenesis(GO:0060351) |
| 0.2 | 1.7 | GO:0055012 | ventricular cardiac muscle cell differentiation(GO:0055012) |
| 0.2 | 0.6 | GO:1990573 | potassium ion import across plasma membrane(GO:1990573) |
| 0.2 | 1.9 | GO:0045162 | clustering of voltage-gated sodium channels(GO:0045162) |
| 0.2 | 2.9 | GO:0006744 | ubiquinone metabolic process(GO:0006743) ubiquinone biosynthetic process(GO:0006744) quinone biosynthetic process(GO:1901663) |
| 0.2 | 1.0 | GO:0034035 | purine ribonucleoside bisphosphate metabolic process(GO:0034035) 3'-phosphoadenosine 5'-phosphosulfate metabolic process(GO:0050427) |
| 0.2 | 6.3 | GO:1900047 | negative regulation of blood coagulation(GO:0030195) negative regulation of hemostasis(GO:1900047) |
| 0.2 | 1.2 | GO:0046479 | glycosphingolipid catabolic process(GO:0046479) |
| 0.2 | 2.4 | GO:1902043 | positive regulation of extrinsic apoptotic signaling pathway via death domain receptors(GO:1902043) |
| 0.2 | 0.8 | GO:0032480 | negative regulation of type I interferon production(GO:0032480) |
| 0.2 | 1.3 | GO:0006346 | methylation-dependent chromatin silencing(GO:0006346) |
| 0.2 | 1.7 | GO:0051451 | myoblast migration(GO:0051451) |
| 0.2 | 1.7 | GO:0032310 | prostaglandin secretion(GO:0032310) |
| 0.2 | 4.7 | GO:0055092 | cholesterol homeostasis(GO:0042632) sterol homeostasis(GO:0055092) |
| 0.2 | 0.5 | GO:1902231 | positive regulation of intrinsic apoptotic signaling pathway in response to DNA damage(GO:1902231) |
| 0.2 | 3.8 | GO:0010259 | multicellular organism aging(GO:0010259) |
| 0.2 | 0.7 | GO:0061709 | reticulophagy(GO:0061709) |
| 0.2 | 0.2 | GO:1904380 | endoplasmic reticulum mannose trimming(GO:1904380) |
| 0.2 | 0.5 | GO:0010265 | SCF complex assembly(GO:0010265) |
| 0.2 | 0.8 | GO:0016191 | synaptic vesicle uncoating(GO:0016191) vesicle uncoating(GO:0072319) |
| 0.2 | 0.2 | GO:0044340 | canonical Wnt signaling pathway involved in regulation of cell proliferation(GO:0044340) |
| 0.2 | 1.3 | GO:0006120 | mitochondrial electron transport, NADH to ubiquinone(GO:0006120) |
| 0.2 | 2.2 | GO:0006111 | regulation of gluconeogenesis(GO:0006111) |
| 0.2 | 1.0 | GO:0045086 | positive regulation of interleukin-2 biosynthetic process(GO:0045086) |
| 0.2 | 0.5 | GO:0010760 | negative regulation of macrophage chemotaxis(GO:0010760) |
| 0.2 | 0.2 | GO:0060700 | regulation of ribonuclease activity(GO:0060700) |
| 0.2 | 0.5 | GO:0010133 | proline catabolic process(GO:0006562) proline catabolic process to glutamate(GO:0010133) |
| 0.2 | 2.5 | GO:0090026 | positive regulation of monocyte chemotaxis(GO:0090026) |
| 0.2 | 0.6 | GO:0060272 | organ induction(GO:0001759) embryonic skeletal joint morphogenesis(GO:0060272) |
| 0.2 | 5.3 | GO:0003382 | epithelial cell morphogenesis(GO:0003382) |
| 0.2 | 0.5 | GO:0046167 | glycerol-3-phosphate biosynthetic process(GO:0046167) |
| 0.2 | 0.3 | GO:0070920 | regulation of production of small RNA involved in gene silencing by RNA(GO:0070920) |
| 0.1 | 6.3 | GO:0045454 | cell redox homeostasis(GO:0045454) |
| 0.1 | 0.7 | GO:0060075 | regulation of resting membrane potential(GO:0060075) |
| 0.1 | 4.3 | GO:0035307 | positive regulation of protein dephosphorylation(GO:0035307) |
| 0.1 | 1.3 | GO:0007140 | male meiosis(GO:0007140) |
| 0.1 | 0.6 | GO:0034773 | histone H4-K20 trimethylation(GO:0034773) |
| 0.1 | 1.1 | GO:0031167 | rRNA methylation(GO:0031167) |
| 0.1 | 1.0 | GO:0008228 | opsonization(GO:0008228) |
| 0.1 | 0.3 | GO:0051712 | positive regulation of killing of cells of other organism(GO:0051712) |
| 0.1 | 1.7 | GO:1901387 | positive regulation of voltage-gated calcium channel activity(GO:1901387) |
| 0.1 | 1.0 | GO:0045196 | establishment or maintenance of neuroblast polarity(GO:0045196) establishment of neuroblast polarity(GO:0045200) |
| 0.1 | 1.1 | GO:1902235 | regulation of endoplasmic reticulum stress-induced intrinsic apoptotic signaling pathway(GO:1902235) |
| 0.1 | 3.1 | GO:0030514 | negative regulation of BMP signaling pathway(GO:0030514) |
| 0.1 | 16.2 | GO:0090305 | nucleic acid phosphodiester bond hydrolysis(GO:0090305) |
| 0.1 | 2.1 | GO:0045953 | negative regulation of natural killer cell mediated cytotoxicity(GO:0045953) |
| 0.1 | 0.7 | GO:0051533 | regulation of NFAT protein import into nucleus(GO:0051532) positive regulation of NFAT protein import into nucleus(GO:0051533) |
| 0.1 | 0.5 | GO:1903564 | regulation of protein localization to cilium(GO:1903564) |
| 0.1 | 5.3 | GO:0000724 | double-strand break repair via homologous recombination(GO:0000724) |
| 0.1 | 1.0 | GO:0032740 | positive regulation of interleukin-17 production(GO:0032740) |
| 0.1 | 0.9 | GO:0071340 | skeletal muscle acetylcholine-gated channel clustering(GO:0071340) |
| 0.1 | 1.9 | GO:0005513 | detection of calcium ion(GO:0005513) |
| 0.1 | 1.9 | GO:0051220 | cytoplasmic sequestering of protein(GO:0051220) |
| 0.1 | 2.1 | GO:0071108 | protein K48-linked deubiquitination(GO:0071108) |
| 0.1 | 1.2 | GO:0018026 | peptidyl-lysine monomethylation(GO:0018026) |
| 0.1 | 3.6 | GO:0051865 | protein autoubiquitination(GO:0051865) |
| 0.1 | 1.8 | GO:0031424 | keratinization(GO:0031424) |
| 0.1 | 0.8 | GO:0006384 | transcription initiation from RNA polymerase III promoter(GO:0006384) |
| 0.1 | 3.3 | GO:0097421 | liver regeneration(GO:0097421) |
| 0.1 | 2.1 | GO:0006270 | DNA replication initiation(GO:0006270) |
| 0.1 | 0.9 | GO:0002230 | positive regulation of defense response to virus by host(GO:0002230) |
| 0.1 | 5.3 | GO:0032755 | positive regulation of interleukin-6 production(GO:0032755) |
| 0.1 | 2.0 | GO:0031581 | hemidesmosome assembly(GO:0031581) |
| 0.1 | 3.4 | GO:0009583 | detection of light stimulus(GO:0009583) |
| 0.1 | 1.5 | GO:0043536 | positive regulation of blood vessel endothelial cell migration(GO:0043536) |
| 0.1 | 1.5 | GO:0046039 | GTP metabolic process(GO:0046039) |
| 0.1 | 0.8 | GO:0006047 | UDP-N-acetylglucosamine metabolic process(GO:0006047) |
| 0.1 | 0.5 | GO:0044351 | macropinocytosis(GO:0044351) |
| 0.1 | 0.5 | GO:0017183 | peptidyl-diphthamide metabolic process(GO:0017182) peptidyl-diphthamide biosynthetic process from peptidyl-histidine(GO:0017183) |
| 0.1 | 4.5 | GO:0043966 | histone H3 acetylation(GO:0043966) |
| 0.1 | 2.8 | GO:0006383 | transcription from RNA polymerase III promoter(GO:0006383) |
| 0.1 | 1.4 | GO:0014002 | astrocyte development(GO:0014002) |
| 0.1 | 4.7 | GO:0007157 | heterophilic cell-cell adhesion via plasma membrane cell adhesion molecules(GO:0007157) |
| 0.1 | 0.7 | GO:0072595 | maintenance of protein localization in organelle(GO:0072595) |
| 0.1 | 0.4 | GO:0031507 | heterochromatin assembly(GO:0031507) |
| 0.1 | 3.0 | GO:0007569 | cell aging(GO:0007569) |
| 0.1 | 1.3 | GO:0051894 | positive regulation of focal adhesion assembly(GO:0051894) |
| 0.1 | 0.2 | GO:0030223 | neutrophil differentiation(GO:0030223) |
| 0.1 | 0.4 | GO:0010840 | regulation of circadian sleep/wake cycle, wakefulness(GO:0010840) circadian sleep/wake cycle, wakefulness(GO:0042746) |
| 0.1 | 2.1 | GO:0045071 | negative regulation of viral genome replication(GO:0045071) |
| 0.1 | 1.9 | GO:0019369 | arachidonic acid metabolic process(GO:0019369) |
| 0.1 | 0.4 | GO:0003266 | regulation of secondary heart field cardioblast proliferation(GO:0003266) |
| 0.1 | 0.2 | GO:2000074 | regulation of type B pancreatic cell development(GO:2000074) |
| 0.1 | 1.3 | GO:0031952 | regulation of protein autophosphorylation(GO:0031952) |
| 0.1 | 5.9 | GO:0006888 | ER to Golgi vesicle-mediated transport(GO:0006888) |
| 0.1 | 0.5 | GO:0050774 | negative regulation of dendrite morphogenesis(GO:0050774) |
| 0.1 | 12.4 | GO:0032259 | methylation(GO:0032259) |
| 0.1 | 4.9 | GO:0043433 | negative regulation of sequence-specific DNA binding transcription factor activity(GO:0043433) |
| 0.1 | 0.5 | GO:0007252 | I-kappaB phosphorylation(GO:0007252) |
| 0.1 | 0.5 | GO:0090385 | phagosome-lysosome fusion(GO:0090385) |
| 0.1 | 0.4 | GO:0051095 | regulation of helicase activity(GO:0051095) positive regulation of helicase activity(GO:0051096) |
| 0.1 | 0.2 | GO:0002003 | angiotensin maturation(GO:0002003) |
| 0.1 | 2.1 | GO:0006342 | chromatin silencing(GO:0006342) |
| 0.1 | 2.1 | GO:0032436 | positive regulation of proteasomal ubiquitin-dependent protein catabolic process(GO:0032436) |
| 0.1 | 0.1 | GO:0009106 | lipoate metabolic process(GO:0009106) |
| 0.1 | 2.6 | GO:0006405 | RNA export from nucleus(GO:0006405) |
| 0.1 | 0.9 | GO:2000036 | regulation of stem cell population maintenance(GO:2000036) |
| 0.1 | 1.5 | GO:0006506 | GPI anchor biosynthetic process(GO:0006506) |
| 0.1 | 0.3 | GO:0090435 | protein localization to nuclear envelope(GO:0090435) |
| 0.1 | 0.5 | GO:1901984 | negative regulation of protein acetylation(GO:1901984) |
| 0.1 | 0.5 | GO:0043044 | ATP-dependent chromatin remodeling(GO:0043044) |
| 0.1 | 1.1 | GO:0051123 | RNA polymerase II transcriptional preinitiation complex assembly(GO:0051123) |
| 0.1 | 0.2 | GO:0030311 | poly-N-acetyllactosamine metabolic process(GO:0030309) poly-N-acetyllactosamine biosynthetic process(GO:0030311) |
| 0.1 | 0.8 | GO:0031648 | protein destabilization(GO:0031648) |
| 0.1 | 0.1 | GO:0021564 | vagus nerve development(GO:0021564) |
| 0.0 | 0.1 | GO:0071934 | thiamine transmembrane transport(GO:0071934) |
| 0.0 | 0.3 | GO:0043981 | histone H4-K5 acetylation(GO:0043981) histone H4-K8 acetylation(GO:0043982) |
| 0.0 | 2.3 | GO:0051057 | positive regulation of small GTPase mediated signal transduction(GO:0051057) |
| 0.0 | 0.3 | GO:0014886 | transition between slow and fast fiber(GO:0014886) |
| 0.0 | 0.2 | GO:0050691 | regulation of defense response to virus by host(GO:0050691) |
| 0.0 | 0.0 | GO:0071288 | cellular response to mercury ion(GO:0071288) |
| 0.0 | 0.4 | GO:0051014 | actin filament severing(GO:0051014) |
| 0.0 | 0.2 | GO:0019885 | antigen processing and presentation of endogenous peptide antigen via MHC class I(GO:0019885) |
| 0.0 | 1.1 | GO:0008543 | fibroblast growth factor receptor signaling pathway(GO:0008543) |
| 0.0 | 0.4 | GO:0045604 | regulation of epidermal cell differentiation(GO:0045604) |
| 0.0 | 0.3 | GO:0060716 | labyrinthine layer blood vessel development(GO:0060716) |
| 0.0 | 0.8 | GO:0045582 | positive regulation of T cell differentiation(GO:0045582) |
| 0.0 | 0.2 | GO:0044804 | nucleophagy(GO:0044804) |
| 0.0 | 0.5 | GO:0001580 | detection of chemical stimulus involved in sensory perception of bitter taste(GO:0001580) |
| 0.0 | 0.4 | GO:0051341 | regulation of oxidoreductase activity(GO:0051341) |
| 0.0 | 0.6 | GO:0002474 | antigen processing and presentation of peptide antigen via MHC class I(GO:0002474) |
| 0.0 | 17.1 | GO:0050911 | detection of chemical stimulus involved in sensory perception of smell(GO:0050911) |
| 0.0 | 0.3 | GO:0003341 | cilium movement(GO:0003341) |
Gene overrepresentation in cellular component category:
| Log-likelihood per target | Total log-likelihood | Term | Description |
|---|---|---|---|
| 15.5 | 46.5 | GO:0046691 | intracellular canaliculus(GO:0046691) |
| 13.0 | 39.0 | GO:0000802 | transverse filament(GO:0000802) |
| 11.2 | 67.3 | GO:0071547 | piP-body(GO:0071547) |
| 9.7 | 29.0 | GO:1990923 | PET complex(GO:1990923) |
| 8.4 | 41.8 | GO:0071546 | pi-body(GO:0071546) |
| 6.0 | 18.1 | GO:0070421 | DNA ligase III-XRCC1 complex(GO:0070421) |
| 5.0 | 15.1 | GO:0071149 | TEAD-2-YAP complex(GO:0071149) |
| 4.8 | 43.3 | GO:0034366 | spherical high-density lipoprotein particle(GO:0034366) |
| 3.9 | 11.7 | GO:0005960 | glycine cleavage complex(GO:0005960) |
| 3.5 | 17.7 | GO:0046696 | lipopolysaccharide receptor complex(GO:0046696) |
| 3.4 | 17.2 | GO:0005947 | mitochondrial alpha-ketoglutarate dehydrogenase complex(GO:0005947) |
| 3.4 | 13.7 | GO:0070876 | SOSS complex(GO:0070876) |
| 3.4 | 16.9 | GO:1990726 | Lsm1-7-Pat1 complex(GO:1990726) |
| 3.2 | 25.6 | GO:0070937 | CRD-mediated mRNA stability complex(GO:0070937) |
| 3.1 | 9.3 | GO:0033186 | CAF-1 complex(GO:0033186) |
| 2.9 | 14.4 | GO:0070695 | FHF complex(GO:0070695) |
| 2.8 | 25.6 | GO:0045495 | P granule(GO:0043186) pole plasm(GO:0045495) germ plasm(GO:0060293) |
| 2.8 | 55.7 | GO:0034364 | high-density lipoprotein particle(GO:0034364) |
| 2.7 | 18.9 | GO:0036128 | CatSper complex(GO:0036128) |
| 2.6 | 30.8 | GO:0000801 | central element(GO:0000801) |
| 2.5 | 86.2 | GO:0000795 | synaptonemal complex(GO:0000795) |
| 2.5 | 39.9 | GO:0030061 | mitochondrial crista(GO:0030061) |
| 2.4 | 9.7 | GO:0000408 | EKC/KEOPS complex(GO:0000408) |
| 2.4 | 11.9 | GO:0070195 | growth hormone receptor complex(GO:0070195) |
| 2.4 | 16.7 | GO:0090543 | Flemming body(GO:0090543) |
| 2.4 | 2.4 | GO:0005663 | DNA replication factor C complex(GO:0005663) |
| 2.2 | 17.8 | GO:0071541 | eukaryotic translation initiation factor 3 complex, eIF3m(GO:0071541) |
| 2.2 | 22.1 | GO:0042587 | glycogen granule(GO:0042587) |
| 2.1 | 21.3 | GO:0042788 | polysomal ribosome(GO:0042788) |
| 2.1 | 10.6 | GO:0071204 | histone pre-mRNA 3'end processing complex(GO:0071204) |
| 2.1 | 25.0 | GO:0032797 | SMN complex(GO:0032797) |
| 2.1 | 10.4 | GO:0000120 | RNA polymerase I transcription factor complex(GO:0000120) |
| 1.9 | 5.8 | GO:0031262 | Ndc80 complex(GO:0031262) |
| 1.9 | 5.7 | GO:0000811 | GINS complex(GO:0000811) |
| 1.9 | 87.1 | GO:0005844 | polysome(GO:0005844) |
| 1.9 | 13.1 | GO:0001674 | female germ cell nucleus(GO:0001674) |
| 1.9 | 5.6 | GO:0016281 | eukaryotic translation initiation factor 4F complex(GO:0016281) |
| 1.8 | 22.2 | GO:0000812 | Swr1 complex(GO:0000812) |
| 1.7 | 5.2 | GO:0032937 | SREBP-SCAP-Insig complex(GO:0032937) |
| 1.7 | 15.1 | GO:0000439 | core TFIIH complex(GO:0000439) |
| 1.7 | 10.0 | GO:0033391 | chromatoid body(GO:0033391) |
| 1.6 | 16.4 | GO:0000778 | condensed nuclear chromosome kinetochore(GO:0000778) |
| 1.6 | 27.6 | GO:0035686 | sperm fibrous sheath(GO:0035686) |
| 1.6 | 22.7 | GO:0001520 | outer dense fiber(GO:0001520) |
| 1.6 | 8.0 | GO:0035985 | senescence-associated heterochromatin focus(GO:0035985) |
| 1.6 | 6.4 | GO:0045240 | dihydrolipoyl dehydrogenase complex(GO:0045240) |
| 1.6 | 7.9 | GO:0034455 | t-UTP complex(GO:0034455) |
| 1.6 | 14.1 | GO:0097539 | ciliary transition fiber(GO:0097539) |
| 1.6 | 18.8 | GO:0072687 | meiotic spindle(GO:0072687) |
| 1.5 | 15.5 | GO:0000177 | cytoplasmic exosome (RNase complex)(GO:0000177) |
| 1.5 | 12.1 | GO:0044613 | nuclear pore central transport channel(GO:0044613) |
| 1.5 | 25.6 | GO:0008250 | oligosaccharyltransferase complex(GO:0008250) |
| 1.5 | 27.0 | GO:0031588 | nucleotide-activated protein kinase complex(GO:0031588) |
| 1.5 | 4.4 | GO:0097124 | cyclin A2-CDK2 complex(GO:0097124) |
| 1.5 | 5.8 | GO:0097413 | Lewy body(GO:0097413) |
| 1.4 | 8.3 | GO:0033290 | eukaryotic 43S preinitiation complex(GO:0016282) eukaryotic 48S preinitiation complex(GO:0033290) |
| 1.3 | 17.5 | GO:0030914 | STAGA complex(GO:0030914) |
| 1.3 | 26.3 | GO:0070971 | endoplasmic reticulum exit site(GO:0070971) |
| 1.3 | 7.9 | GO:0001940 | male pronucleus(GO:0001940) |
| 1.3 | 2.6 | GO:0034666 | integrin alpha2-beta1 complex(GO:0034666) |
| 1.3 | 3.8 | GO:0031680 | G-protein beta/gamma-subunit complex(GO:0031680) |
| 1.3 | 23.9 | GO:0005782 | peroxisomal matrix(GO:0005782) microbody lumen(GO:0031907) |
| 1.2 | 5.0 | GO:0031088 | platelet dense granule membrane(GO:0031088) |
| 1.2 | 7.4 | GO:0005785 | signal recognition particle receptor complex(GO:0005785) |
| 1.2 | 30.6 | GO:0005640 | nuclear outer membrane(GO:0005640) |
| 1.2 | 23.3 | GO:0035098 | ESC/E(Z) complex(GO:0035098) |
| 1.2 | 3.5 | GO:0072588 | box H/ACA snoRNP complex(GO:0031429) box H/ACA RNP complex(GO:0072588) |
| 1.2 | 7.0 | GO:0002142 | stereocilia ankle link complex(GO:0002142) USH2 complex(GO:1990696) |
| 1.2 | 11.6 | GO:0005744 | mitochondrial inner membrane presequence translocase complex(GO:0005744) |
| 1.1 | 2.3 | GO:0097165 | nuclear stress granule(GO:0097165) |
| 1.1 | 4.6 | GO:0031021 | interphase microtubule organizing center(GO:0031021) |
| 1.1 | 5.7 | GO:1903768 | sweet taste receptor complex(GO:1903767) taste receptor complex(GO:1903768) |
| 1.1 | 5.6 | GO:0009331 | glycerol-3-phosphate dehydrogenase complex(GO:0009331) |
| 1.1 | 6.7 | GO:0031904 | endosome lumen(GO:0031904) multivesicular body membrane(GO:0032585) |
| 1.1 | 11.7 | GO:0035631 | CD40 receptor complex(GO:0035631) |
| 1.1 | 2.1 | GO:1990723 | cytoplasmic periphery of the nuclear pore complex(GO:1990723) |
| 1.1 | 11.6 | GO:0001673 | male germ cell nucleus(GO:0001673) |
| 1.1 | 4.2 | GO:0005726 | perichromatin fibrils(GO:0005726) |
| 1.0 | 4.2 | GO:0030906 | retromer, cargo-selective complex(GO:0030906) |
| 1.0 | 18.5 | GO:0001741 | XY body(GO:0001741) |
| 1.0 | 3.1 | GO:0044611 | nuclear pore inner ring(GO:0044611) |
| 1.0 | 9.0 | GO:0005828 | kinetochore microtubule(GO:0005828) |
| 1.0 | 8.9 | GO:0098651 | basement membrane collagen trimer(GO:0098651) |
| 1.0 | 10.7 | GO:0030688 | preribosome, small subunit precursor(GO:0030688) |
| 1.0 | 36.1 | GO:0032391 | photoreceptor connecting cilium(GO:0032391) |
| 1.0 | 2.9 | GO:0034362 | low-density lipoprotein particle(GO:0034362) |
| 0.9 | 2.8 | GO:0045120 | pronucleus(GO:0045120) |
| 0.9 | 0.9 | GO:0097629 | extrinsic component of omegasome membrane(GO:0097629) |
| 0.9 | 6.4 | GO:0061617 | MICOS complex(GO:0061617) |
| 0.9 | 4.5 | GO:0042719 | mitochondrial intermembrane space protein transporter complex(GO:0042719) |
| 0.9 | 10.6 | GO:0036513 | Derlin-1 retrotranslocation complex(GO:0036513) |
| 0.9 | 11.3 | GO:0097346 | INO80-type complex(GO:0097346) |
| 0.9 | 5.2 | GO:0005852 | eukaryotic translation initiation factor 3 complex(GO:0005852) |
| 0.9 | 4.3 | GO:0030062 | mitochondrial tricarboxylic acid cycle enzyme complex(GO:0030062) |
| 0.8 | 18.5 | GO:0030057 | desmosome(GO:0030057) |
| 0.8 | 16.6 | GO:0005665 | DNA-directed RNA polymerase II, core complex(GO:0005665) |
| 0.8 | 10.7 | GO:0032156 | septin cytoskeleton(GO:0032156) |
| 0.8 | 15.7 | GO:0005671 | Ada2/Gcn5/Ada3 transcription activator complex(GO:0005671) |
| 0.8 | 15.6 | GO:0005779 | integral component of peroxisomal membrane(GO:0005779) intrinsic component of peroxisomal membrane(GO:0031231) |
| 0.8 | 39.9 | GO:0009295 | nucleoid(GO:0009295) mitochondrial nucleoid(GO:0042645) |
| 0.8 | 31.0 | GO:0010494 | cytoplasmic stress granule(GO:0010494) |
| 0.8 | 6.3 | GO:0070820 | tertiary granule(GO:0070820) |
| 0.8 | 4.7 | GO:0030896 | checkpoint clamp complex(GO:0030896) |
| 0.8 | 3.1 | GO:0071817 | MMXD complex(GO:0071817) |
| 0.8 | 8.5 | GO:0070852 | cell body fiber(GO:0070852) |
| 0.7 | 2.2 | GO:0098554 | cytoplasmic side of endoplasmic reticulum membrane(GO:0098554) |
| 0.7 | 0.7 | GO:0034750 | Scrib-APC-beta-catenin complex(GO:0034750) |
| 0.7 | 6.5 | GO:0000808 | origin recognition complex(GO:0000808) nuclear origin of replication recognition complex(GO:0005664) |
| 0.7 | 5.7 | GO:0071141 | SMAD protein complex(GO:0071141) |
| 0.7 | 6.4 | GO:0008541 | proteasome regulatory particle, lid subcomplex(GO:0008541) |
| 0.7 | 34.9 | GO:0005637 | nuclear inner membrane(GO:0005637) |
| 0.7 | 5.0 | GO:0000796 | condensin complex(GO:0000796) |
| 0.7 | 2.1 | GO:0005967 | mitochondrial pyruvate dehydrogenase complex(GO:0005967) |
| 0.7 | 4.2 | GO:0042567 | insulin-like growth factor ternary complex(GO:0042567) |
| 0.7 | 4.2 | GO:0030289 | protein phosphatase 4 complex(GO:0030289) |
| 0.7 | 11.2 | GO:0005751 | mitochondrial respiratory chain complex IV(GO:0005751) |
| 0.7 | 5.4 | GO:0044233 | ER-mitochondrion membrane contact site(GO:0044233) |
| 0.7 | 4.0 | GO:0034388 | Pwp2p-containing subcomplex of 90S preribosome(GO:0034388) |
| 0.7 | 3.3 | GO:0016461 | unconventional myosin complex(GO:0016461) |
| 0.7 | 17.9 | GO:0030687 | preribosome, large subunit precursor(GO:0030687) |
| 0.6 | 3.8 | GO:0031314 | extrinsic component of mitochondrial inner membrane(GO:0031314) |
| 0.6 | 0.6 | GO:0008282 | ATP-sensitive potassium channel complex(GO:0008282) |
| 0.6 | 2.5 | GO:1990584 | cardiac Troponin complex(GO:1990584) |
| 0.6 | 1.9 | GO:0008537 | proteasome activator complex(GO:0008537) |
| 0.6 | 5.6 | GO:0000506 | glycosylphosphatidylinositol-N-acetylglucosaminyltransferase (GPI-GnT) complex(GO:0000506) |
| 0.6 | 5.6 | GO:0008385 | IkappaB kinase complex(GO:0008385) |
| 0.6 | 6.2 | GO:0017071 | intracellular cyclic nucleotide activated cation channel complex(GO:0017071) |
| 0.6 | 7.4 | GO:0045180 | basal cortex(GO:0045180) |
| 0.6 | 6.1 | GO:0042405 | nuclear inclusion body(GO:0042405) |
| 0.6 | 1.8 | GO:0000172 | ribonuclease MRP complex(GO:0000172) |
| 0.6 | 4.1 | GO:0071203 | WASH complex(GO:0071203) |
| 0.6 | 0.6 | GO:0045298 | tubulin complex(GO:0045298) |
| 0.6 | 10.7 | GO:0043196 | varicosity(GO:0043196) |
| 0.6 | 2.8 | GO:0034751 | aryl hydrocarbon receptor complex(GO:0034751) |
| 0.6 | 26.1 | GO:0044438 | microbody part(GO:0044438) peroxisomal part(GO:0044439) |
| 0.5 | 4.9 | GO:0031390 | Ctf18 RFC-like complex(GO:0031390) |
| 0.5 | 7.1 | GO:0002199 | zona pellucida receptor complex(GO:0002199) |
| 0.5 | 2.2 | GO:0018444 | translation release factor complex(GO:0018444) |
| 0.5 | 2.7 | GO:0044530 | supraspliceosomal complex(GO:0044530) |
| 0.5 | 7.0 | GO:0016580 | Sin3 complex(GO:0016580) |
| 0.5 | 3.2 | GO:0033256 | I-kappaB/NF-kappaB complex(GO:0033256) |
| 0.5 | 25.2 | GO:0030667 | secretory granule membrane(GO:0030667) |
| 0.5 | 23.6 | GO:0016592 | mediator complex(GO:0016592) |
| 0.5 | 1.5 | GO:0005655 | nucleolar ribonuclease P complex(GO:0005655) ribonuclease P complex(GO:0030677) multimeric ribonuclease P complex(GO:0030681) |
| 0.5 | 6.9 | GO:0042582 | primary lysosome(GO:0005766) azurophil granule(GO:0042582) |
| 0.5 | 40.9 | GO:0017053 | transcriptional repressor complex(GO:0017053) |
| 0.5 | 13.5 | GO:0005763 | organellar small ribosomal subunit(GO:0000314) mitochondrial small ribosomal subunit(GO:0005763) |
| 0.5 | 1.4 | GO:0009328 | phenylalanine-tRNA ligase complex(GO:0009328) |
| 0.5 | 12.0 | GO:0035371 | microtubule plus-end(GO:0035371) |
| 0.5 | 40.2 | GO:0042579 | peroxisome(GO:0005777) microbody(GO:0042579) |
| 0.5 | 5.7 | GO:0098643 | fibrillar collagen trimer(GO:0005583) banded collagen fibril(GO:0098643) |
| 0.5 | 4.2 | GO:0097542 | ciliary tip(GO:0097542) |
| 0.5 | 3.2 | GO:0070449 | elongin complex(GO:0070449) |
| 0.4 | 6.7 | GO:0036038 | MKS complex(GO:0036038) |
| 0.4 | 6.6 | GO:0043657 | host(GO:0018995) host cell(GO:0043657) |
| 0.4 | 6.6 | GO:0070938 | contractile ring(GO:0070938) |
| 0.4 | 4.3 | GO:0042555 | MCM complex(GO:0042555) |
| 0.4 | 28.4 | GO:0005761 | organellar ribosome(GO:0000313) mitochondrial ribosome(GO:0005761) |
| 0.4 | 4.7 | GO:0034663 | endoplasmic reticulum chaperone complex(GO:0034663) |
| 0.4 | 31.7 | GO:0036064 | ciliary basal body(GO:0036064) |
| 0.4 | 1.7 | GO:0032280 | symmetric synapse(GO:0032280) |
| 0.4 | 22.0 | GO:0005930 | axoneme(GO:0005930) ciliary plasm(GO:0097014) |
| 0.4 | 5.1 | GO:0030127 | COPII vesicle coat(GO:0030127) |
| 0.4 | 1.7 | GO:0020016 | ciliary pocket(GO:0020016) ciliary pocket membrane(GO:0020018) |
| 0.4 | 2.1 | GO:0005658 | alpha DNA polymerase:primase complex(GO:0005658) |
| 0.4 | 42.4 | GO:0001669 | acrosomal vesicle(GO:0001669) |
| 0.4 | 0.8 | GO:0097136 | Bcl-2 family protein complex(GO:0097136) |
| 0.4 | 132.6 | GO:0005667 | transcription factor complex(GO:0005667) |
| 0.4 | 1.6 | GO:1990851 | Wnt-Frizzled-LRP5/6 complex(GO:1990851) |
| 0.4 | 9.6 | GO:0000791 | euchromatin(GO:0000791) |
| 0.4 | 11.2 | GO:0071782 | endoplasmic reticulum tubular network(GO:0071782) |
| 0.4 | 1.2 | GO:0005853 | eukaryotic translation elongation factor 1 complex(GO:0005853) |
| 0.4 | 23.3 | GO:0016459 | myosin complex(GO:0016459) |
| 0.4 | 1.9 | GO:0001652 | granular component(GO:0001652) |
| 0.4 | 42.4 | GO:0031514 | motile cilium(GO:0031514) |
| 0.4 | 38.6 | GO:0030176 | integral component of endoplasmic reticulum membrane(GO:0030176) |
| 0.4 | 3.8 | GO:0070775 | H3 histone acetyltransferase complex(GO:0070775) MOZ/MORF histone acetyltransferase complex(GO:0070776) |
| 0.4 | 2.3 | GO:0000015 | phosphopyruvate hydratase complex(GO:0000015) |
| 0.4 | 3.7 | GO:0002177 | manchette(GO:0002177) |
| 0.4 | 2.1 | GO:0034045 | pre-autophagosomal structure membrane(GO:0034045) |
| 0.3 | 25.2 | GO:0005791 | rough endoplasmic reticulum(GO:0005791) |
| 0.3 | 2.0 | GO:1990316 | ATG1/ULK1 kinase complex(GO:1990316) |
| 0.3 | 3.7 | GO:0043205 | microfibril(GO:0001527) fibril(GO:0043205) |
| 0.3 | 12.0 | GO:0097610 | cleavage furrow(GO:0032154) cell surface furrow(GO:0097610) |
| 0.3 | 14.3 | GO:0046658 | anchored component of plasma membrane(GO:0046658) |
| 0.3 | 19.8 | GO:0005758 | mitochondrial intermembrane space(GO:0005758) |
| 0.3 | 8.1 | GO:0005790 | smooth endoplasmic reticulum(GO:0005790) |
| 0.3 | 3.8 | GO:0005666 | DNA-directed RNA polymerase III complex(GO:0005666) |
| 0.3 | 9.5 | GO:0016591 | DNA-directed RNA polymerase II, holoenzyme(GO:0016591) |
| 0.3 | 1.6 | GO:0030870 | Mre11 complex(GO:0030870) |
| 0.3 | 2.1 | GO:0048500 | signal recognition particle, endoplasmic reticulum targeting(GO:0005786) signal recognition particle(GO:0048500) |
| 0.3 | 0.9 | GO:0030312 | external encapsulating structure(GO:0030312) |
| 0.3 | 3.0 | GO:0000242 | pericentriolar material(GO:0000242) |
| 0.3 | 1.8 | GO:0045009 | melanosome membrane(GO:0033162) chitosome(GO:0045009) |
| 0.3 | 14.9 | GO:0005581 | collagen trimer(GO:0005581) |
| 0.3 | 6.1 | GO:0000145 | exocyst(GO:0000145) |
| 0.3 | 1.1 | GO:0072487 | MSL complex(GO:0072487) |
| 0.3 | 3.0 | GO:0044666 | MLL3/4 complex(GO:0044666) |
| 0.3 | 3.8 | GO:0017119 | Golgi transport complex(GO:0017119) |
| 0.3 | 14.1 | GO:0005793 | endoplasmic reticulum-Golgi intermediate compartment(GO:0005793) |
| 0.2 | 8.7 | GO:0060077 | inhibitory synapse(GO:0060077) |
| 0.2 | 3.3 | GO:0044292 | dendrite terminus(GO:0044292) |
| 0.2 | 2.3 | GO:0031616 | spindle pole centrosome(GO:0031616) |
| 0.2 | 2.3 | GO:0070652 | HAUS complex(GO:0070652) |
| 0.2 | 2.9 | GO:0071339 | MLL1/2 complex(GO:0044665) MLL1 complex(GO:0071339) |
| 0.2 | 5.8 | GO:0072686 | mitotic spindle(GO:0072686) |
| 0.2 | 9.6 | GO:0000922 | spindle pole(GO:0000922) |
| 0.2 | 21.4 | GO:0034399 | nuclear periphery(GO:0034399) |
| 0.2 | 8.8 | GO:0005643 | nuclear pore(GO:0005643) |
| 0.2 | 1.1 | GO:1990130 | Iml1 complex(GO:1990130) |
| 0.2 | 0.8 | GO:0030891 | VCB complex(GO:0030891) |
| 0.2 | 3.6 | GO:0035145 | exon-exon junction complex(GO:0035145) |
| 0.2 | 27.7 | GO:0005759 | mitochondrial matrix(GO:0005759) |
| 0.2 | 0.8 | GO:0016442 | RISC complex(GO:0016442) RNAi effector complex(GO:0031332) |
| 0.2 | 6.4 | GO:0000777 | condensed chromosome kinetochore(GO:0000777) |
| 0.2 | 0.8 | GO:0072379 | BAT3 complex(GO:0071818) ER membrane insertion complex(GO:0072379) |
| 0.2 | 4.6 | GO:0000118 | histone deacetylase complex(GO:0000118) |
| 0.2 | 57.1 | GO:0005743 | mitochondrial inner membrane(GO:0005743) |
| 0.2 | 6.1 | GO:0000307 | cyclin-dependent protein kinase holoenzyme complex(GO:0000307) |
| 0.2 | 1.6 | GO:0010369 | chromocenter(GO:0010369) |
| 0.2 | 4.7 | GO:0080008 | Cul4-RING E3 ubiquitin ligase complex(GO:0080008) |
| 0.2 | 19.4 | GO:0035770 | ribonucleoprotein granule(GO:0035770) |
| 0.2 | 6.5 | GO:0005801 | cis-Golgi network(GO:0005801) |
| 0.2 | 2.6 | GO:0043240 | Fanconi anaemia nuclear complex(GO:0043240) |
| 0.2 | 3.4 | GO:0000794 | condensed nuclear chromosome(GO:0000794) |
| 0.2 | 3.3 | GO:0005614 | interstitial matrix(GO:0005614) |
| 0.2 | 12.1 | GO:0045095 | keratin filament(GO:0045095) |
| 0.2 | 1.2 | GO:0031932 | TORC2 complex(GO:0031932) |
| 0.2 | 1.5 | GO:0032593 | insulin-responsive compartment(GO:0032593) |
| 0.2 | 1.5 | GO:0000164 | protein phosphatase type 1 complex(GO:0000164) |
| 0.2 | 1.8 | GO:0030014 | CCR4-NOT complex(GO:0030014) |
| 0.2 | 1.2 | GO:0005915 | zonula adherens(GO:0005915) |
| 0.2 | 0.5 | GO:0031515 | tRNA (m1A) methyltransferase complex(GO:0031515) |
| 0.2 | 10.5 | GO:0000781 | chromosome, telomeric region(GO:0000781) |
| 0.2 | 11.8 | GO:0044815 | DNA packaging complex(GO:0044815) |
| 0.2 | 5.0 | GO:0016235 | aggresome(GO:0016235) |
| 0.1 | 3.8 | GO:0000793 | condensed chromosome(GO:0000793) |
| 0.1 | 2.2 | GO:0005686 | U2 snRNP(GO:0005686) |
| 0.1 | 1.0 | GO:0035097 | histone methyltransferase complex(GO:0035097) |
| 0.1 | 1.6 | GO:0005847 | mRNA cleavage and polyadenylation specificity factor complex(GO:0005847) |
| 0.1 | 0.2 | GO:1990604 | IRE1-TRAF2-ASK1 complex(GO:1990604) |
| 0.1 | 0.8 | GO:0034098 | VCP-NPL4-UFD1 AAA ATPase complex(GO:0034098) |
| 0.1 | 21.2 | GO:0005635 | nuclear envelope(GO:0005635) |
| 0.1 | 0.5 | GO:0005851 | eukaryotic translation initiation factor 2B complex(GO:0005851) |
| 0.1 | 21.0 | GO:0016607 | nuclear speck(GO:0016607) |
| 0.1 | 1.9 | GO:0000776 | kinetochore(GO:0000776) |
| 0.1 | 1.5 | GO:0030056 | hemidesmosome(GO:0030056) |
| 0.1 | 0.6 | GO:0012507 | ER to Golgi transport vesicle membrane(GO:0012507) |
| 0.1 | 3.1 | GO:0005891 | voltage-gated calcium channel complex(GO:0005891) |
| 0.1 | 0.3 | GO:0033063 | Rad51B-Rad51C-Rad51D-XRCC2 complex(GO:0033063) |
| 0.1 | 0.1 | GO:0000153 | cytoplasmic ubiquitin ligase complex(GO:0000153) |
| 0.1 | 17.4 | GO:0016604 | nuclear body(GO:0016604) |
| 0.1 | 0.4 | GO:0005677 | chromatin silencing complex(GO:0005677) |
| 0.1 | 2.2 | GO:0032420 | stereocilium(GO:0032420) |
| 0.1 | 10.3 | GO:0031966 | mitochondrial membrane(GO:0031966) |
| 0.1 | 3.4 | GO:0005788 | endoplasmic reticulum lumen(GO:0005788) |
| 0.1 | 6.4 | GO:0072562 | blood microparticle(GO:0072562) |
| 0.1 | 0.5 | GO:0097431 | mitotic spindle pole(GO:0097431) |
| 0.1 | 0.3 | GO:0000930 | gamma-tubulin complex(GO:0000930) |
| 0.1 | 3.0 | GO:0005811 | lipid particle(GO:0005811) |
| 0.1 | 0.5 | GO:0043202 | lysosomal lumen(GO:0043202) |
| 0.1 | 0.2 | GO:0044322 | endoplasmic reticulum quality control compartment(GO:0044322) |
| 0.1 | 11.5 | GO:0000151 | ubiquitin ligase complex(GO:0000151) |
| 0.1 | 1.4 | GO:0005881 | cytoplasmic microtubule(GO:0005881) |
| 0.0 | 36.3 | GO:0005739 | mitochondrion(GO:0005739) |
| 0.0 | 0.2 | GO:0031983 | vesicle lumen(GO:0031983) |
| 0.0 | 0.6 | GO:0042613 | MHC class II protein complex(GO:0042613) |
| 0.0 | 0.1 | GO:0019773 | proteasome core complex, alpha-subunit complex(GO:0019773) |
| 0.0 | 0.1 | GO:0000407 | pre-autophagosomal structure(GO:0000407) |
Gene overrepresentation in molecular function category:
| Log-likelihood per target | Total log-likelihood | Term | Description |
|---|---|---|---|
| 11.6 | 46.4 | GO:0050682 | AF-2 domain binding(GO:0050682) |
| 9.0 | 81.4 | GO:0008494 | translation activator activity(GO:0008494) |
| 8.4 | 25.1 | GO:0046573 | lactonohydrolase activity(GO:0046573) acyl-L-homoserine-lactone lactonohydrolase activity(GO:0102007) |
| 7.9 | 23.7 | GO:0001069 | regulatory region RNA binding(GO:0001069) |
| 6.8 | 34.0 | GO:0032795 | heterotrimeric G-protein binding(GO:0032795) |
| 6.7 | 27.0 | GO:0016647 | oxidoreductase activity, acting on the CH-NH group of donors, oxygen as acceptor(GO:0016647) |
| 6.4 | 19.2 | GO:0004335 | galactokinase activity(GO:0004335) |
| 6.1 | 18.4 | GO:0008311 | double-stranded DNA 3'-5' exodeoxyribonuclease activity(GO:0008311) |
| 5.8 | 17.5 | GO:0060230 | lipoprotein lipase activator activity(GO:0060230) |
| 5.8 | 23.2 | GO:0034584 | piRNA binding(GO:0034584) |
| 5.7 | 28.7 | GO:0034186 | apolipoprotein A-I binding(GO:0034186) |
| 5.2 | 15.6 | GO:0004832 | valine-tRNA ligase activity(GO:0004832) |
| 5.2 | 20.6 | GO:0030613 | oxidoreductase activity, acting on a sulfur group of donors, quinone or similar compound as acceptor(GO:0016672) oxidoreductase activity, acting on phosphorus or arsenic in donors(GO:0030613) oxidoreductase activity, acting on phosphorus or arsenic in donors, disulfide as acceptor(GO:0030614) glutathione dehydrogenase (ascorbate) activity(GO:0045174) methylarsonate reductase activity(GO:0050610) |
| 5.1 | 15.4 | GO:0031728 | CCR3 chemokine receptor binding(GO:0031728) |
| 5.1 | 51.1 | GO:0031957 | very long-chain fatty acid-CoA ligase activity(GO:0031957) |
| 5.0 | 19.9 | GO:0071936 | coreceptor activity involved in Wnt signaling pathway(GO:0071936) |
| 4.9 | 19.7 | GO:0036137 | kynurenine-oxoglutarate transaminase activity(GO:0016212) kynurenine aminotransferase activity(GO:0036137) |
| 4.8 | 19.1 | GO:0050252 | retinol O-fatty-acyltransferase activity(GO:0050252) |
| 4.7 | 18.7 | GO:0033149 | FFAT motif binding(GO:0033149) |
| 4.6 | 23.2 | GO:0008453 | alanine-glyoxylate transaminase activity(GO:0008453) |
| 4.5 | 13.6 | GO:0070653 | high-density lipoprotein particle receptor binding(GO:0070653) |
| 4.5 | 40.6 | GO:0031995 | insulin-like growth factor II binding(GO:0031995) |
| 4.5 | 13.4 | GO:0004655 | porphobilinogen synthase activity(GO:0004655) |
| 4.2 | 117.5 | GO:0048027 | mRNA 5'-UTR binding(GO:0048027) |
| 4.1 | 37.3 | GO:0016713 | oxidoreductase activity, acting on paired donors, with incorporation or reduction of molecular oxygen, reduced iron-sulfur protein as one donor, and incorporation of one atom of oxygen(GO:0016713) |
| 4.0 | 16.2 | GO:0044729 | hemi-methylated DNA-binding(GO:0044729) |
| 3.7 | 18.7 | GO:0004586 | ornithine decarboxylase activity(GO:0004586) |
| 3.5 | 24.8 | GO:0046976 | histone methyltransferase activity (H3-K27 specific)(GO:0046976) |
| 3.5 | 10.4 | GO:0008607 | phosphorylase kinase regulator activity(GO:0008607) |
| 3.4 | 20.4 | GO:0004844 | uracil DNA N-glycosylase activity(GO:0004844) deaminated base DNA N-glycosylase activity(GO:0097506) |
| 3.4 | 30.5 | GO:0016846 | carbon-sulfur lyase activity(GO:0016846) |
| 3.4 | 10.1 | GO:0015226 | amino-acid betaine transmembrane transporter activity(GO:0015199) carnitine transmembrane transporter activity(GO:0015226) |
| 3.3 | 32.7 | GO:0003680 | AT DNA binding(GO:0003680) |
| 3.3 | 16.3 | GO:0061676 | importin-alpha family protein binding(GO:0061676) |
| 3.2 | 9.6 | GO:0060002 | plus-end directed microfilament motor activity(GO:0060002) |
| 3.1 | 25.1 | GO:0000064 | L-ornithine transmembrane transporter activity(GO:0000064) |
| 3.1 | 9.3 | GO:0035851 | Krueppel-associated box domain binding(GO:0035851) |
| 3.1 | 55.5 | GO:0043295 | glutathione binding(GO:0043295) |
| 3.1 | 9.2 | GO:0004774 | succinate-CoA ligase activity(GO:0004774) succinate-CoA ligase (ADP-forming) activity(GO:0004775) |
| 3.0 | 3.0 | GO:0001091 | RNA polymerase II basal transcription factor binding(GO:0001091) TFIID-class transcription factor binding(GO:0001094) |
| 3.0 | 11.9 | GO:0004903 | growth hormone receptor activity(GO:0004903) |
| 3.0 | 38.6 | GO:0019841 | retinol binding(GO:0019841) |
| 2.9 | 38.2 | GO:0005527 | macrolide binding(GO:0005527) FK506 binding(GO:0005528) |
| 2.9 | 8.7 | GO:0004925 | prolactin receptor activity(GO:0004925) |
| 2.9 | 11.5 | GO:0005087 | Ran guanyl-nucleotide exchange factor activity(GO:0005087) |
| 2.8 | 11.3 | GO:0008486 | endopolyphosphatase activity(GO:0000298) diphosphoinositol-polyphosphate diphosphatase activity(GO:0008486) bis(5'-adenosyl)-hexaphosphatase activity(GO:0034431) bis(5'-adenosyl)-pentaphosphatase activity(GO:0034432) |
| 2.8 | 25.2 | GO:0051920 | peroxiredoxin activity(GO:0051920) |
| 2.7 | 10.9 | GO:0004645 | phosphorylase activity(GO:0004645) |
| 2.6 | 7.9 | GO:0031752 | D5 dopamine receptor binding(GO:0031752) |
| 2.6 | 20.9 | GO:0046870 | cadmium ion binding(GO:0046870) |
| 2.4 | 7.2 | GO:0004315 | 3-oxoacyl-[acyl-carrier-protein] synthase activity(GO:0004315) |
| 2.4 | 54.9 | GO:0015288 | porin activity(GO:0015288) |
| 2.4 | 7.1 | GO:0004736 | pyruvate carboxylase activity(GO:0004736) |
| 2.4 | 11.8 | GO:0004103 | choline kinase activity(GO:0004103) |
| 2.3 | 9.2 | GO:0003987 | acetate-CoA ligase activity(GO:0003987) |
| 2.3 | 13.7 | GO:0042954 | lipoprotein transporter activity(GO:0042954) |
| 2.3 | 20.4 | GO:0016624 | oxidoreductase activity, acting on the aldehyde or oxo group of donors, disulfide as acceptor(GO:0016624) |
| 2.2 | 20.2 | GO:0015093 | ferrous iron transmembrane transporter activity(GO:0015093) |
| 2.2 | 8.9 | GO:0055105 | ubiquitin-protein transferase inhibitor activity(GO:0055105) |
| 2.2 | 19.5 | GO:0003909 | DNA ligase activity(GO:0003909) DNA ligase (ATP) activity(GO:0003910) |
| 2.1 | 17.2 | GO:0051525 | NFAT protein binding(GO:0051525) |
| 2.1 | 6.4 | GO:0004167 | dopachrome isomerase activity(GO:0004167) |
| 2.1 | 14.7 | GO:0002151 | G-quadruplex RNA binding(GO:0002151) |
| 2.1 | 10.4 | GO:0004140 | dephospho-CoA kinase activity(GO:0004140) |
| 2.1 | 16.7 | GO:0008297 | single-stranded DNA exodeoxyribonuclease activity(GO:0008297) |
| 2.1 | 8.3 | GO:0047023 | androsterone dehydrogenase activity(GO:0047023) |
| 2.0 | 8.0 | GO:0070579 | methylcytosine dioxygenase activity(GO:0070579) |
| 1.9 | 9.4 | GO:0008332 | low voltage-gated calcium channel activity(GO:0008332) |
| 1.9 | 14.9 | GO:0001164 | RNA polymerase I regulatory region sequence-specific DNA binding(GO:0001163) RNA polymerase I CORE element sequence-specific DNA binding(GO:0001164) |
| 1.8 | 7.3 | GO:0010465 | nerve growth factor receptor activity(GO:0010465) |
| 1.8 | 14.5 | GO:0001075 | transcription factor activity, RNA polymerase II core promoter sequence-specific binding involved in preinitiation complex assembly(GO:0001075) |
| 1.8 | 5.4 | GO:0004956 | prostaglandin D receptor activity(GO:0004956) |
| 1.8 | 10.9 | GO:0008865 | glucokinase activity(GO:0004340) hexokinase activity(GO:0004396) fructokinase activity(GO:0008865) mannokinase activity(GO:0019158) |
| 1.8 | 7.2 | GO:0004459 | L-lactate dehydrogenase activity(GO:0004459) |
| 1.8 | 8.9 | GO:0004563 | beta-N-acetylhexosaminidase activity(GO:0004563) |
| 1.8 | 5.3 | GO:0031127 | galactoside 2-alpha-L-fucosyltransferase activity(GO:0008107) alpha-(1,2)-fucosyltransferase activity(GO:0031127) |
| 1.7 | 6.8 | GO:0033743 | peptide-methionine (R)-S-oxide reductase activity(GO:0033743) |
| 1.7 | 6.8 | GO:0030984 | kininogen binding(GO:0030984) |
| 1.7 | 8.4 | GO:0004427 | inorganic diphosphatase activity(GO:0004427) |
| 1.7 | 8.4 | GO:0046912 | transferase activity, transferring acyl groups, acyl groups converted into alkyl on transfer(GO:0046912) |
| 1.7 | 20.0 | GO:0008143 | poly(A) binding(GO:0008143) |
| 1.7 | 5.0 | GO:0044547 | DNA topoisomerase binding(GO:0044547) |
| 1.7 | 3.3 | GO:0008732 | threonine aldolase activity(GO:0004793) L-allo-threonine aldolase activity(GO:0008732) |
| 1.6 | 4.9 | GO:0004058 | aromatic-L-amino-acid decarboxylase activity(GO:0004058) L-dopa decarboxylase activity(GO:0036468) |
| 1.6 | 9.7 | GO:0052851 | cupric reductase activity(GO:0008823) ferric-chelate reductase (NADPH) activity(GO:0052851) |
| 1.6 | 4.8 | GO:0031871 | proteinase activated receptor binding(GO:0031871) |
| 1.6 | 4.8 | GO:0004060 | arylamine N-acetyltransferase activity(GO:0004060) |
| 1.6 | 12.7 | GO:0015129 | lactate transmembrane transporter activity(GO:0015129) |
| 1.6 | 9.5 | GO:0061578 | Lys63-specific deubiquitinase activity(GO:0061578) |
| 1.6 | 6.3 | GO:0030622 | U4atac snRNA binding(GO:0030622) |
| 1.6 | 9.3 | GO:0035613 | RNA stem-loop binding(GO:0035613) |
| 1.6 | 7.8 | GO:0003997 | acyl-CoA oxidase activity(GO:0003997) |
| 1.6 | 14.0 | GO:0016208 | AMP binding(GO:0016208) |
| 1.5 | 4.6 | GO:0016971 | flavin-linked sulfhydryl oxidase activity(GO:0016971) |
| 1.5 | 7.6 | GO:0005134 | interleukin-2 receptor binding(GO:0005134) |
| 1.5 | 4.6 | GO:0004618 | phosphoglycerate kinase activity(GO:0004618) |
| 1.5 | 4.5 | GO:0000033 | alpha-1,3-mannosyltransferase activity(GO:0000033) |
| 1.5 | 5.9 | GO:0005333 | norepinephrine transmembrane transporter activity(GO:0005333) |
| 1.5 | 4.5 | GO:0097677 | STAT family protein binding(GO:0097677) |
| 1.5 | 7.3 | GO:0051185 | coenzyme transporter activity(GO:0051185) |
| 1.4 | 11.5 | GO:0030957 | Tat protein binding(GO:0030957) |
| 1.4 | 14.4 | GO:0051959 | dynein light intermediate chain binding(GO:0051959) |
| 1.4 | 24.4 | GO:0019789 | SUMO transferase activity(GO:0019789) |
| 1.4 | 11.4 | GO:0015245 | fatty acid transporter activity(GO:0015245) |
| 1.4 | 5.7 | GO:0003842 | 1-pyrroline-5-carboxylate dehydrogenase activity(GO:0003842) |
| 1.4 | 12.7 | GO:0032552 | deoxyribonucleotide binding(GO:0032552) |
| 1.4 | 2.8 | GO:0047179 | platelet-activating factor acetyltransferase activity(GO:0047179) |
| 1.4 | 5.6 | GO:0004368 | glycerol-3-phosphate dehydrogenase activity(GO:0004368) |
| 1.4 | 9.7 | GO:0042030 | ATPase inhibitor activity(GO:0042030) |
| 1.4 | 9.6 | GO:0015119 | hexose phosphate transmembrane transporter activity(GO:0015119) organophosphate:inorganic phosphate antiporter activity(GO:0015315) hexose-phosphate:inorganic phosphate antiporter activity(GO:0015526) glucose 6-phosphate:inorganic phosphate antiporter activity(GO:0061513) |
| 1.3 | 28.3 | GO:0042975 | peroxisome proliferator activated receptor binding(GO:0042975) |
| 1.3 | 10.7 | GO:0047372 | acylglycerol lipase activity(GO:0047372) |
| 1.3 | 14.6 | GO:0070567 | cytidylyltransferase activity(GO:0070567) |
| 1.3 | 12.8 | GO:0016892 | endoribonuclease activity, producing 3'-phosphomonoesters(GO:0016892) |
| 1.3 | 6.4 | GO:0032405 | MutLalpha complex binding(GO:0032405) |
| 1.3 | 6.3 | GO:0030348 | syntaxin-3 binding(GO:0030348) |
| 1.2 | 7.5 | GO:0004126 | cytidine deaminase activity(GO:0004126) |
| 1.2 | 4.9 | GO:0016833 | oxo-acid-lyase activity(GO:0016833) |
| 1.2 | 10.8 | GO:0000295 | adenine nucleotide transmembrane transporter activity(GO:0000295) purine ribonucleotide transmembrane transporter activity(GO:0005346) |
| 1.2 | 9.5 | GO:0008559 | xenobiotic-transporting ATPase activity(GO:0008559) |
| 1.2 | 4.7 | GO:0000822 | inositol hexakisphosphate binding(GO:0000822) inositol 1,4,5-trisphosphate-sensitive calcium-release channel activity(GO:0005220) inositol 1,3,4,5 tetrakisphosphate binding(GO:0043533) |
| 1.2 | 10.6 | GO:0015232 | heme transporter activity(GO:0015232) |
| 1.2 | 3.5 | GO:0034513 | box H/ACA snoRNA binding(GO:0034513) |
| 1.2 | 25.7 | GO:0016780 | phosphotransferase activity, for other substituted phosphate groups(GO:0016780) |
| 1.2 | 7.0 | GO:0043141 | ATP-dependent 5'-3' DNA helicase activity(GO:0043141) |
| 1.2 | 5.8 | GO:0070404 | NADH binding(GO:0070404) |
| 1.2 | 5.8 | GO:0030620 | U2 snRNA binding(GO:0030620) |
| 1.2 | 3.5 | GO:0004392 | heme oxygenase (decyclizing) activity(GO:0004392) |
| 1.1 | 11.3 | GO:0033170 | DNA clamp loader activity(GO:0003689) protein-DNA loading ATPase activity(GO:0033170) |
| 1.1 | 4.5 | GO:0000829 | inositol heptakisphosphate kinase activity(GO:0000829) |
| 1.1 | 4.5 | GO:0008670 | 2,4-dienoyl-CoA reductase (NADPH) activity(GO:0008670) trans-2-enoyl-CoA reductase (NADPH) activity(GO:0019166) |
| 1.1 | 19.0 | GO:0004745 | retinol dehydrogenase activity(GO:0004745) |
| 1.1 | 7.8 | GO:0043495 | protein anchor(GO:0043495) |
| 1.1 | 3.3 | GO:0004874 | aryl hydrocarbon receptor activity(GO:0004874) |
| 1.1 | 7.7 | GO:0016812 | hydrolase activity, acting on carbon-nitrogen (but not peptide) bonds, in cyclic amides(GO:0016812) |
| 1.1 | 29.6 | GO:0008392 | arachidonic acid epoxygenase activity(GO:0008392) |
| 1.1 | 70.5 | GO:0004004 | RNA helicase activity(GO:0003724) ATP-dependent RNA helicase activity(GO:0004004) |
| 1.1 | 5.3 | GO:0050309 | glucose-6-phosphatase activity(GO:0004346) sugar-terminal-phosphatase activity(GO:0050309) |
| 1.1 | 26.5 | GO:0070840 | dynein complex binding(GO:0070840) |
| 1.1 | 19.0 | GO:0004550 | nucleoside diphosphate kinase activity(GO:0004550) |
| 1.0 | 8.4 | GO:0008430 | selenium binding(GO:0008430) |
| 1.0 | 3.1 | GO:0031708 | endothelin B receptor binding(GO:0031708) |
| 1.0 | 9.4 | GO:0009881 | photoreceptor activity(GO:0009881) |
| 1.0 | 9.3 | GO:0047498 | calcium-dependent phospholipase A2 activity(GO:0047498) |
| 1.0 | 3.1 | GO:0016230 | sphingomyelin phosphodiesterase activator activity(GO:0016230) |
| 1.0 | 13.4 | GO:0015924 | mannosyl-oligosaccharide mannosidase activity(GO:0015924) |
| 1.0 | 18.5 | GO:0017160 | Ral GTPase binding(GO:0017160) |
| 1.0 | 15.4 | GO:0070182 | DNA polymerase binding(GO:0070182) |
| 1.0 | 7.2 | GO:0047499 | calcium-independent phospholipase A2 activity(GO:0047499) |
| 1.0 | 6.1 | GO:0034511 | U3 snoRNA binding(GO:0034511) |
| 1.0 | 3.0 | GO:0001227 | transcriptional repressor activity, RNA polymerase II transcription regulatory region sequence-specific binding(GO:0001227) |
| 1.0 | 4.1 | GO:0004594 | pantothenate kinase activity(GO:0004594) |
| 1.0 | 6.0 | GO:0008603 | cAMP-dependent protein kinase regulator activity(GO:0008603) |
| 1.0 | 14.0 | GO:0004576 | oligosaccharyl transferase activity(GO:0004576) dolichyl-diphosphooligosaccharide-protein glycotransferase activity(GO:0004579) |
| 1.0 | 5.0 | GO:0051033 | nucleic acid transmembrane transporter activity(GO:0051032) RNA transmembrane transporter activity(GO:0051033) |
| 1.0 | 6.0 | GO:0017176 | phosphatidylinositol N-acetylglucosaminyltransferase activity(GO:0017176) |
| 1.0 | 4.0 | GO:0008158 | hedgehog receptor activity(GO:0008158) |
| 1.0 | 27.4 | GO:0008536 | Ran GTPase binding(GO:0008536) |
| 1.0 | 2.9 | GO:0004830 | tryptophan-tRNA ligase activity(GO:0004830) |
| 1.0 | 30.5 | GO:0005104 | fibroblast growth factor receptor binding(GO:0005104) |
| 1.0 | 3.8 | GO:0016428 | tRNA (cytosine-5-)-methyltransferase activity(GO:0016428) |
| 0.9 | 3.8 | GO:0070568 | guanylyltransferase activity(GO:0070568) |
| 0.9 | 4.7 | GO:0005166 | neurotrophin p75 receptor binding(GO:0005166) |
| 0.9 | 2.8 | GO:0102345 | 3-hydroxy-behenoyl-CoA dehydratase activity(GO:0102344) 3-hydroxy-lignoceroyl-CoA dehydratase activity(GO:0102345) |
| 0.9 | 13.9 | GO:0005487 | nucleocytoplasmic transporter activity(GO:0005487) |
| 0.9 | 2.8 | GO:0003941 | L-serine ammonia-lyase activity(GO:0003941) |
| 0.9 | 6.4 | GO:0098634 | protein binding involved in cell-matrix adhesion(GO:0098634) |
| 0.9 | 24.8 | GO:0031492 | nucleosomal DNA binding(GO:0031492) |
| 0.9 | 2.7 | GO:0070012 | oligopeptidase activity(GO:0070012) |
| 0.9 | 5.4 | GO:0098519 | nucleotide phosphatase activity, acting on free nucleotides(GO:0098519) |
| 0.9 | 3.6 | GO:0070878 | primary miRNA binding(GO:0070878) |
| 0.9 | 9.8 | GO:0004549 | tRNA-specific ribonuclease activity(GO:0004549) |
| 0.9 | 7.0 | GO:0005007 | fibroblast growth factor-activated receptor activity(GO:0005007) |
| 0.9 | 13.2 | GO:0004622 | lysophospholipase activity(GO:0004622) |
| 0.9 | 2.6 | GO:0071885 | N-terminal protein N-methyltransferase activity(GO:0071885) |
| 0.9 | 8.6 | GO:0051766 | inositol trisphosphate kinase activity(GO:0051766) |
| 0.9 | 7.7 | GO:0003691 | double-stranded telomeric DNA binding(GO:0003691) |
| 0.9 | 3.4 | GO:0086089 | voltage-gated potassium channel activity involved in atrial cardiac muscle cell action potential repolarization(GO:0086089) |
| 0.8 | 3.4 | GO:0043262 | adenosine-diphosphatase activity(GO:0043262) |
| 0.8 | 5.0 | GO:0008970 | phosphatidylcholine 1-acylhydrolase activity(GO:0008970) |
| 0.8 | 14.2 | GO:0004535 | poly(A)-specific ribonuclease activity(GO:0004535) |
| 0.8 | 2.5 | GO:0000179 | rRNA (adenine-N6,N6-)-dimethyltransferase activity(GO:0000179) |
| 0.8 | 18.2 | GO:0000062 | fatty-acyl-CoA binding(GO:0000062) |
| 0.8 | 5.8 | GO:0008934 | inositol monophosphate 1-phosphatase activity(GO:0008934) inositol monophosphate 3-phosphatase activity(GO:0052832) |
| 0.8 | 5.7 | GO:0050692 | DBD domain binding(GO:0050692) |
| 0.8 | 15.3 | GO:0010485 | H4 histone acetyltransferase activity(GO:0010485) |
| 0.8 | 2.4 | GO:0051870 | methotrexate binding(GO:0051870) |
| 0.8 | 12.8 | GO:0008574 | ATP-dependent microtubule motor activity, plus-end-directed(GO:0008574) |
| 0.8 | 6.4 | GO:0031419 | cobalamin binding(GO:0031419) |
| 0.8 | 6.3 | GO:0004931 | extracellular ATP-gated cation channel activity(GO:0004931) ATP-gated ion channel activity(GO:0035381) |
| 0.8 | 8.5 | GO:0003995 | acyl-CoA dehydrogenase activity(GO:0003995) |
| 0.8 | 6.8 | GO:0016174 | NAD(P)H oxidase activity(GO:0016174) |
| 0.8 | 10.6 | GO:0004679 | AMP-activated protein kinase activity(GO:0004679) |
| 0.8 | 3.8 | GO:0009019 | tRNA (guanine-N1-)-methyltransferase activity(GO:0009019) |
| 0.7 | 2.2 | GO:0070644 | vitamin D response element binding(GO:0070644) |
| 0.7 | 5.2 | GO:0004652 | polynucleotide adenylyltransferase activity(GO:0004652) |
| 0.7 | 3.0 | GO:0070815 | peptidyl-lysine 5-dioxygenase activity(GO:0070815) |
| 0.7 | 3.0 | GO:0004487 | methylenetetrahydrofolate dehydrogenase (NAD+) activity(GO:0004487) |
| 0.7 | 9.6 | GO:0070034 | telomerase RNA binding(GO:0070034) |
| 0.7 | 11.0 | GO:0015238 | drug transmembrane transporter activity(GO:0015238) |
| 0.7 | 14.5 | GO:0004532 | exoribonuclease activity(GO:0004532) |
| 0.7 | 2.1 | GO:0034057 | RNA strand-exchange activity(GO:0034057) |
| 0.7 | 14.7 | GO:0000030 | mannosyltransferase activity(GO:0000030) |
| 0.7 | 21.6 | GO:0015020 | glucuronosyltransferase activity(GO:0015020) |
| 0.7 | 2.1 | GO:0004769 | steroid delta-isomerase activity(GO:0004769) |
| 0.7 | 2.8 | GO:0051431 | corticotropin-releasing hormone receptor 2 binding(GO:0051431) |
| 0.7 | 2.0 | GO:0004852 | uroporphyrinogen-III synthase activity(GO:0004852) |
| 0.7 | 20.2 | GO:0045182 | translation regulator activity(GO:0045182) |
| 0.6 | 7.7 | GO:0043138 | 3'-5' DNA helicase activity(GO:0043138) |
| 0.6 | 5.1 | GO:0015037 | peptide disulfide oxidoreductase activity(GO:0015037) |
| 0.6 | 3.8 | GO:0004366 | glycerol-3-phosphate O-acyltransferase activity(GO:0004366) |
| 0.6 | 0.6 | GO:0017098 | sulfonylurea receptor binding(GO:0017098) |
| 0.6 | 2.5 | GO:0030172 | troponin C binding(GO:0030172) |
| 0.6 | 2.5 | GO:0033142 | progesterone receptor binding(GO:0033142) |
| 0.6 | 4.4 | GO:0010340 | carboxyl-O-methyltransferase activity(GO:0010340) protein carboxyl O-methyltransferase activity(GO:0051998) |
| 0.6 | 3.7 | GO:0097157 | pre-mRNA intronic binding(GO:0097157) |
| 0.6 | 6.1 | GO:0015386 | potassium:proton antiporter activity(GO:0015386) |
| 0.6 | 7.3 | GO:0000400 | four-way junction DNA binding(GO:0000400) |
| 0.6 | 6.1 | GO:1904264 | ubiquitin protein ligase activity involved in ERAD pathway(GO:1904264) |
| 0.6 | 7.8 | GO:0070410 | co-SMAD binding(GO:0070410) |
| 0.6 | 1.8 | GO:0016901 | oxidoreductase activity, acting on the CH-OH group of donors, quinone or similar compound as acceptor(GO:0016901) |
| 0.6 | 1.8 | GO:0038181 | bile acid receptor activity(GO:0038181) |
| 0.6 | 8.2 | GO:0048407 | platelet-derived growth factor binding(GO:0048407) |
| 0.6 | 7.0 | GO:0048185 | activin binding(GO:0048185) |
| 0.6 | 25.0 | GO:0005164 | tumor necrosis factor receptor binding(GO:0005164) |
| 0.6 | 11.0 | GO:0005149 | interleukin-1 receptor binding(GO:0005149) |
| 0.6 | 2.9 | GO:0030229 | very-low-density lipoprotein particle receptor activity(GO:0030229) |
| 0.6 | 33.1 | GO:0003743 | translation initiation factor activity(GO:0003743) |
| 0.5 | 4.3 | GO:0051787 | misfolded protein binding(GO:0051787) |
| 0.5 | 3.8 | GO:0004767 | sphingomyelin phosphodiesterase activity(GO:0004767) |
| 0.5 | 1.6 | GO:0004911 | interleukin-2 receptor activity(GO:0004911) |
| 0.5 | 1.6 | GO:0016823 | oxaloacetate decarboxylase activity(GO:0008948) hydrolase activity, acting on acid carbon-carbon bonds(GO:0016822) hydrolase activity, acting on acid carbon-carbon bonds, in ketonic substances(GO:0016823) |
| 0.5 | 2.1 | GO:0004740 | pyruvate dehydrogenase (acetyl-transferring) kinase activity(GO:0004740) |
| 0.5 | 10.0 | GO:0008353 | RNA polymerase II carboxy-terminal domain kinase activity(GO:0008353) |
| 0.5 | 3.7 | GO:0004559 | alpha-mannosidase activity(GO:0004559) |
| 0.5 | 1.6 | GO:0016453 | C-acetyltransferase activity(GO:0016453) |
| 0.5 | 6.2 | GO:0005223 | intracellular cGMP activated cation channel activity(GO:0005223) |
| 0.5 | 2.1 | GO:0051731 | polynucleotide 5'-hydroxyl-kinase activity(GO:0051731) |
| 0.5 | 16.6 | GO:0061650 | ubiquitin conjugating enzyme activity(GO:0061631) ubiquitin-like protein conjugating enzyme activity(GO:0061650) |
| 0.5 | 9.0 | GO:0048018 | receptor agonist activity(GO:0048018) |
| 0.5 | 5.5 | GO:0004653 | polypeptide N-acetylgalactosaminyltransferase activity(GO:0004653) |
| 0.5 | 8.4 | GO:0008519 | ammonium transmembrane transporter activity(GO:0008519) |
| 0.5 | 3.9 | GO:0015266 | protein channel activity(GO:0015266) |
| 0.5 | 3.9 | GO:0001972 | retinoic acid binding(GO:0001972) |
| 0.5 | 1.0 | GO:0070053 | thrombospondin receptor activity(GO:0070053) |
| 0.5 | 5.8 | GO:0004602 | glutathione peroxidase activity(GO:0004602) |
| 0.5 | 15.5 | GO:0098632 | protein binding involved in cell-cell adhesion(GO:0098632) |
| 0.5 | 1.5 | GO:0004829 | threonine-tRNA ligase activity(GO:0004829) |
| 0.5 | 1.4 | GO:0004046 | aminoacylase activity(GO:0004046) |
| 0.5 | 5.3 | GO:0019206 | nucleoside kinase activity(GO:0019206) |
| 0.5 | 8.6 | GO:0047617 | acyl-CoA hydrolase activity(GO:0047617) |
| 0.5 | 1.9 | GO:0004741 | [pyruvate dehydrogenase (lipoamide)] phosphatase activity(GO:0004741) |
| 0.5 | 11.9 | GO:0070330 | aromatase activity(GO:0070330) |
| 0.5 | 6.2 | GO:0003688 | DNA replication origin binding(GO:0003688) |
| 0.5 | 3.3 | GO:0003707 | steroid hormone receptor activity(GO:0003707) |
| 0.5 | 11.2 | GO:0031491 | nucleosome binding(GO:0031491) |
| 0.5 | 39.4 | GO:0051082 | unfolded protein binding(GO:0051082) |
| 0.4 | 69.6 | GO:0044822 | mRNA binding(GO:0003729) poly(A) RNA binding(GO:0044822) |
| 0.4 | 1.8 | GO:0035243 | protein-arginine omega-N symmetric methyltransferase activity(GO:0035243) |
| 0.4 | 1.3 | GO:0019237 | centromeric DNA binding(GO:0019237) |
| 0.4 | 6.6 | GO:0004806 | triglyceride lipase activity(GO:0004806) |
| 0.4 | 0.4 | GO:0050220 | prostaglandin-E synthase activity(GO:0050220) |
| 0.4 | 2.6 | GO:0008508 | bile acid:sodium symporter activity(GO:0008508) |
| 0.4 | 3.4 | GO:0005337 | nucleoside transmembrane transporter activity(GO:0005337) |
| 0.4 | 1.7 | GO:0005025 | transforming growth factor beta receptor activity, type I(GO:0005025) |
| 0.4 | 2.0 | GO:0015181 | arginine transmembrane transporter activity(GO:0015181) |
| 0.4 | 6.9 | GO:0008331 | high voltage-gated calcium channel activity(GO:0008331) |
| 0.4 | 11.7 | GO:0001106 | RNA polymerase II transcription corepressor activity(GO:0001106) |
| 0.4 | 4.4 | GO:0005000 | vasopressin receptor activity(GO:0005000) |
| 0.4 | 45.2 | GO:0004867 | serine-type endopeptidase inhibitor activity(GO:0004867) |
| 0.4 | 21.4 | GO:0051287 | NAD binding(GO:0051287) |
| 0.4 | 1.9 | GO:1990380 | Lys48-specific deubiquitinase activity(GO:1990380) |
| 0.4 | 2.3 | GO:0061133 | endopeptidase activator activity(GO:0061133) |
| 0.4 | 47.0 | GO:0004222 | metalloendopeptidase activity(GO:0004222) |
| 0.4 | 4.2 | GO:0043531 | ADP binding(GO:0043531) |
| 0.4 | 2.3 | GO:0004634 | phosphopyruvate hydratase activity(GO:0004634) |
| 0.4 | 1.9 | GO:0046923 | ER retention sequence binding(GO:0046923) |
| 0.4 | 7.1 | GO:0005247 | voltage-gated chloride channel activity(GO:0005247) |
| 0.4 | 1.5 | GO:0048406 | nerve growth factor binding(GO:0048406) |
| 0.4 | 3.0 | GO:0008432 | JUN kinase binding(GO:0008432) |
| 0.4 | 6.7 | GO:0005522 | profilin binding(GO:0005522) |
| 0.4 | 3.7 | GO:0008649 | rRNA methyltransferase activity(GO:0008649) |
| 0.4 | 7.4 | GO:0070577 | lysine-acetylated histone binding(GO:0070577) |
| 0.4 | 0.7 | GO:0008296 | 3'-5'-exodeoxyribonuclease activity(GO:0008296) |
| 0.4 | 46.9 | GO:0003714 | transcription corepressor activity(GO:0003714) |
| 0.4 | 1.4 | GO:0043532 | angiostatin binding(GO:0043532) |
| 0.4 | 5.8 | GO:0001134 | transcription factor activity, transcription factor recruiting(GO:0001134) |
| 0.4 | 7.2 | GO:0070300 | phosphatidic acid binding(GO:0070300) |
| 0.4 | 2.5 | GO:0004311 | farnesyltranstransferase activity(GO:0004311) |
| 0.4 | 2.8 | GO:0000182 | rDNA binding(GO:0000182) |
| 0.3 | 1.0 | GO:0050294 | steroid sulfotransferase activity(GO:0050294) |
| 0.3 | 24.3 | GO:0004843 | thiol-dependent ubiquitin-specific protease activity(GO:0004843) |
| 0.3 | 6.9 | GO:0036312 | phosphatidylinositol 3-kinase regulatory subunit binding(GO:0036312) |
| 0.3 | 1.7 | GO:0004886 | 9-cis retinoic acid receptor activity(GO:0004886) |
| 0.3 | 1.7 | GO:0008420 | CTD phosphatase activity(GO:0008420) |
| 0.3 | 8.3 | GO:0004707 | MAP kinase activity(GO:0004707) |
| 0.3 | 1.3 | GO:0005222 | intracellular cAMP activated cation channel activity(GO:0005222) |
| 0.3 | 1.3 | GO:0030942 | endoplasmic reticulum signal peptide binding(GO:0030942) |
| 0.3 | 0.6 | GO:0032137 | guanine/thymine mispair binding(GO:0032137) |
| 0.3 | 5.1 | GO:0070064 | proline-rich region binding(GO:0070064) |
| 0.3 | 13.1 | GO:0098531 | RNA polymerase II transcription factor activity, ligand-activated sequence-specific DNA binding(GO:0004879) transcription factor activity, direct ligand regulated sequence-specific DNA binding(GO:0098531) |
| 0.3 | 4.3 | GO:0035173 | histone kinase activity(GO:0035173) |
| 0.3 | 3.0 | GO:0008171 | O-methyltransferase activity(GO:0008171) |
| 0.3 | 1.5 | GO:0070087 | chromo shadow domain binding(GO:0070087) |
| 0.3 | 1.2 | GO:0004822 | isoleucine-tRNA ligase activity(GO:0004822) |
| 0.3 | 20.6 | GO:0003697 | single-stranded DNA binding(GO:0003697) |
| 0.3 | 3.7 | GO:0008408 | 3'-5' exonuclease activity(GO:0008408) |
| 0.3 | 7.9 | GO:0043539 | protein serine/threonine kinase activator activity(GO:0043539) |
| 0.3 | 5.7 | GO:0042800 | histone methyltransferase activity (H3-K4 specific)(GO:0042800) |
| 0.3 | 19.0 | GO:0019888 | protein phosphatase regulator activity(GO:0019888) |
| 0.3 | 0.6 | GO:0003845 | 11-beta-hydroxysteroid dehydrogenase [NAD(P)] activity(GO:0003845) |
| 0.3 | 17.5 | GO:0004518 | nuclease activity(GO:0004518) |
| 0.3 | 10.4 | GO:0043022 | ribosome binding(GO:0043022) |
| 0.3 | 4.6 | GO:0015116 | sulfate transmembrane transporter activity(GO:0015116) |
| 0.3 | 3.7 | GO:0005243 | gap junction channel activity(GO:0005243) |
| 0.3 | 8.0 | GO:0000049 | tRNA binding(GO:0000049) |
| 0.3 | 6.1 | GO:0016538 | cyclin-dependent protein serine/threonine kinase regulator activity(GO:0016538) |
| 0.3 | 13.3 | GO:0008235 | metalloexopeptidase activity(GO:0008235) |
| 0.2 | 3.4 | GO:0047555 | 3',5'-cyclic-GMP phosphodiesterase activity(GO:0047555) |
| 0.2 | 1.4 | GO:0004826 | phenylalanine-tRNA ligase activity(GO:0004826) |
| 0.2 | 3.1 | GO:0046966 | thyroid hormone receptor binding(GO:0046966) |
| 0.2 | 1.9 | GO:0001055 | RNA polymerase II activity(GO:0001055) |
| 0.2 | 0.9 | GO:0030292 | protein tyrosine kinase inhibitor activity(GO:0030292) |
| 0.2 | 0.9 | GO:0016530 | metallochaperone activity(GO:0016530) |
| 0.2 | 1.4 | GO:0015125 | bile acid transmembrane transporter activity(GO:0015125) |
| 0.2 | 23.4 | GO:0008168 | methyltransferase activity(GO:0008168) |
| 0.2 | 1.1 | GO:0001162 | RNA polymerase II intronic transcription regulatory region sequence-specific DNA binding(GO:0001162) |
| 0.2 | 46.0 | GO:0004252 | serine-type endopeptidase activity(GO:0004252) |
| 0.2 | 5.2 | GO:0005385 | zinc ion transmembrane transporter activity(GO:0005385) |
| 0.2 | 4.7 | GO:0051059 | NF-kappaB binding(GO:0051059) |
| 0.2 | 0.8 | GO:0016635 | oxidoreductase activity, acting on the CH-CH group of donors, quinone or related compound as acceptor(GO:0016635) |
| 0.2 | 1.2 | GO:0070697 | activin receptor binding(GO:0070697) |
| 0.2 | 2.2 | GO:0003747 | translation release factor activity(GO:0003747) translation termination factor activity(GO:0008079) |
| 0.2 | 2.3 | GO:0008329 | signaling pattern recognition receptor activity(GO:0008329) pattern recognition receptor activity(GO:0038187) |
| 0.2 | 36.8 | GO:0061630 | ubiquitin protein ligase activity(GO:0061630) ubiquitin-like protein ligase activity(GO:0061659) |
| 0.2 | 5.2 | GO:0004386 | helicase activity(GO:0004386) |
| 0.2 | 9.0 | GO:0051087 | chaperone binding(GO:0051087) |
| 0.2 | 7.4 | GO:0035064 | methylated histone binding(GO:0035064) |
| 0.2 | 9.5 | GO:0016763 | transferase activity, transferring pentosyl groups(GO:0016763) |
| 0.2 | 7.6 | GO:0042393 | histone binding(GO:0042393) |
| 0.2 | 4.4 | GO:0008527 | taste receptor activity(GO:0008527) |
| 0.2 | 3.1 | GO:0005003 | ephrin receptor activity(GO:0005003) |
| 0.2 | 8.5 | GO:0016811 | hydrolase activity, acting on carbon-nitrogen (but not peptide) bonds, in linear amides(GO:0016811) |
| 0.2 | 2.7 | GO:0005537 | mannose binding(GO:0005537) |
| 0.2 | 0.7 | GO:0043426 | MRF binding(GO:0043426) |
| 0.2 | 5.1 | GO:0004129 | cytochrome-c oxidase activity(GO:0004129) heme-copper terminal oxidase activity(GO:0015002) oxidoreductase activity, acting on a heme group of donors, oxygen as acceptor(GO:0016676) |
| 0.2 | 1.4 | GO:0016885 | CoA carboxylase activity(GO:0016421) ligase activity, forming carbon-carbon bonds(GO:0016885) |
| 0.2 | 0.7 | GO:0030297 | transmembrane receptor protein tyrosine kinase activator activity(GO:0030297) |
| 0.2 | 2.0 | GO:0035612 | AP-2 adaptor complex binding(GO:0035612) |
| 0.2 | 0.7 | GO:0047623 | AMP deaminase activity(GO:0003876) adenosine-phosphate deaminase activity(GO:0047623) |
| 0.2 | 2.8 | GO:0001594 | trace-amine receptor activity(GO:0001594) |
| 0.2 | 1.0 | GO:0043023 | ribosomal large subunit binding(GO:0043023) |
| 0.2 | 0.5 | GO:0004657 | proline dehydrogenase activity(GO:0004657) |
| 0.2 | 2.0 | GO:0043522 | leucine zipper domain binding(GO:0043522) |
| 0.2 | 12.3 | GO:0016410 | N-acyltransferase activity(GO:0016410) |
| 0.2 | 0.9 | GO:0070051 | fibrinogen binding(GO:0070051) |
| 0.2 | 0.8 | GO:0036435 | K48-linked polyubiquitin binding(GO:0036435) |
| 0.2 | 0.5 | GO:0004370 | glycerol kinase activity(GO:0004370) |
| 0.2 | 1.8 | GO:0008301 | DNA binding, bending(GO:0008301) |
| 0.2 | 2.4 | GO:0051721 | protein phosphatase 2A binding(GO:0051721) |
| 0.1 | 2.7 | GO:0071837 | HMG box domain binding(GO:0071837) |
| 0.1 | 200.9 | GO:0003677 | DNA binding(GO:0003677) |
| 0.1 | 1.9 | GO:0009982 | pseudouridine synthase activity(GO:0009982) |
| 0.1 | 0.5 | GO:0052796 | exo-alpha-(2->3)-sialidase activity(GO:0052794) exo-alpha-(2->6)-sialidase activity(GO:0052795) exo-alpha-(2->8)-sialidase activity(GO:0052796) |
| 0.1 | 2.4 | GO:0015035 | protein disulfide oxidoreductase activity(GO:0015035) |
| 0.1 | 1.6 | GO:0051400 | BH domain binding(GO:0051400) |
| 0.1 | 1.6 | GO:0019869 | chloride channel inhibitor activity(GO:0019869) |
| 0.1 | 0.5 | GO:0060698 | endoribonuclease inhibitor activity(GO:0060698) |
| 0.1 | 1.2 | GO:0032183 | SUMO binding(GO:0032183) |
| 0.1 | 2.1 | GO:0003727 | single-stranded RNA binding(GO:0003727) |
| 0.1 | 0.8 | GO:0008121 | ubiquinol-cytochrome-c reductase activity(GO:0008121) oxidoreductase activity, acting on diphenols and related substances as donors(GO:0016679) oxidoreductase activity, acting on diphenols and related substances as donors, cytochrome as acceptor(GO:0016681) |
| 0.1 | 1.0 | GO:0005159 | insulin-like growth factor receptor binding(GO:0005159) |
| 0.1 | 1.4 | GO:0008568 | microtubule-severing ATPase activity(GO:0008568) |
| 0.1 | 1.8 | GO:0051537 | 2 iron, 2 sulfur cluster binding(GO:0051537) |
| 0.1 | 0.6 | GO:0060229 | lipase activator activity(GO:0060229) |
| 0.1 | 0.5 | GO:0022841 | potassium ion leak channel activity(GO:0022841) |
| 0.1 | 1.0 | GO:0003810 | protein-glutamine gamma-glutamyltransferase activity(GO:0003810) |
| 0.1 | 0.7 | GO:0050700 | CARD domain binding(GO:0050700) |
| 0.1 | 3.6 | GO:0003700 | nucleic acid binding transcription factor activity(GO:0001071) transcription factor activity, sequence-specific DNA binding(GO:0003700) |
| 0.1 | 2.5 | GO:0048020 | CCR chemokine receptor binding(GO:0048020) |
| 0.1 | 0.6 | GO:0098748 | clathrin adaptor activity(GO:0035615) endocytic adaptor activity(GO:0098748) |
| 0.1 | 0.5 | GO:0001665 | alpha-N-acetylgalactosaminide alpha-2,6-sialyltransferase activity(GO:0001665) |
| 0.1 | 4.5 | GO:0008138 | protein tyrosine/serine/threonine phosphatase activity(GO:0008138) |
| 0.1 | 4.2 | GO:0043130 | ubiquitin binding(GO:0043130) |
| 0.1 | 0.7 | GO:0019843 | rRNA binding(GO:0019843) |
| 0.1 | 1.3 | GO:0017049 | GTP-Rho binding(GO:0017049) |
| 0.1 | 0.2 | GO:0008532 | N-acetyllactosaminide beta-1,3-N-acetylglucosaminyltransferase activity(GO:0008532) |
| 0.1 | 0.7 | GO:0005225 | volume-sensitive anion channel activity(GO:0005225) |
| 0.1 | 0.6 | GO:0003996 | acyl-CoA ligase activity(GO:0003996) fatty-acyl-CoA synthase activity(GO:0004321) |
| 0.1 | 2.0 | GO:0030506 | ankyrin binding(GO:0030506) |
| 0.1 | 0.2 | GO:0004517 | nitric-oxide synthase activity(GO:0004517) |
| 0.1 | 1.1 | GO:0016854 | racemase and epimerase activity(GO:0016854) |
| 0.1 | 1.3 | GO:0008137 | NADH dehydrogenase (ubiquinone) activity(GO:0008137) NADH dehydrogenase (quinone) activity(GO:0050136) |
| 0.1 | 0.4 | GO:0017081 | chloride channel regulator activity(GO:0017081) |
| 0.1 | 1.2 | GO:0051536 | iron-sulfur cluster binding(GO:0051536) metal cluster binding(GO:0051540) |
| 0.1 | 0.3 | GO:0016742 | hydroxymethyl-, formyl- and related transferase activity(GO:0016742) |
| 0.1 | 0.3 | GO:0004416 | hydroxyacylglutathione hydrolase activity(GO:0004416) |
| 0.1 | 0.1 | GO:1990381 | ubiquitin-specific protease binding(GO:1990381) |
| 0.1 | 1.3 | GO:0015269 | calcium-activated potassium channel activity(GO:0015269) |
| 0.1 | 0.6 | GO:0036002 | pre-mRNA binding(GO:0036002) |
| 0.0 | 0.6 | GO:0019864 | IgG binding(GO:0019864) |
| 0.0 | 2.2 | GO:0004715 | non-membrane spanning protein tyrosine kinase activity(GO:0004715) |
| 0.0 | 8.3 | GO:0003735 | structural constituent of ribosome(GO:0003735) |
| 0.0 | 0.1 | GO:0016415 | octanoyltransferase activity(GO:0016415) |
| 0.0 | 3.7 | GO:0003774 | motor activity(GO:0003774) |
| 0.0 | 1.0 | GO:0042605 | peptide antigen binding(GO:0042605) |
| 0.0 | 0.1 | GO:0016520 | growth hormone-releasing hormone receptor activity(GO:0016520) |
| 0.0 | 0.3 | GO:0045236 | CXCR chemokine receptor binding(GO:0045236) |
| 0.0 | 0.2 | GO:0038036 | sphingosine-1-phosphate receptor activity(GO:0038036) |
| 0.0 | 0.6 | GO:0051393 | alpha-actinin binding(GO:0051393) |
| 0.0 | 0.1 | GO:0019776 | Atg8 ligase activity(GO:0019776) |
| 0.0 | 0.2 | GO:0030332 | cyclin binding(GO:0030332) |
| 0.0 | 0.7 | GO:0030971 | receptor tyrosine kinase binding(GO:0030971) |
| 0.0 | 19.9 | GO:0003676 | nucleic acid binding(GO:0003676) |
| 0.0 | 17.1 | GO:0004984 | olfactory receptor activity(GO:0004984) |
Gene overrepresentation in curated gene sets: canonical pathways category:
| Log-likelihood per target | Total log-likelihood | Term | Description |
|---|---|---|---|
| 2.8 | 47.3 | PID ERB GENOMIC PATHWAY | Validated nuclear estrogen receptor beta network |
| 2.4 | 2.4 | PID FAS PATHWAY | FAS (CD95) signaling pathway |
| 1.5 | 39.0 | PID RHODOPSIN PATHWAY | Visual signal transduction: Rods |
| 1.4 | 6.9 | SA G1 AND S PHASES | Cdk2, 4, and 6 bind cyclin D in G1, while cdk2/cyclin E promotes the G1/S transition. |
| 1.4 | 17.9 | PID RANBP2 PATHWAY | Sumoylation by RanBP2 regulates transcriptional repression |
| 1.0 | 17.8 | SA REG CASCADE OF CYCLIN EXPR | Expression of cyclins regulates progression through the cell cycle by activating cyclin-dependent kinases. |
| 1.0 | 32.5 | PID BARD1 PATHWAY | BARD1 signaling events |
| 1.0 | 100.5 | PID MYC ACTIV PATHWAY | Validated targets of C-MYC transcriptional activation |
| 0.9 | 46.4 | PID AR TF PATHWAY | Regulation of Androgen receptor activity |
| 0.8 | 2.4 | SA G2 AND M PHASES | Cdc25 activates the cdc2/cyclin B complex to induce the G2/M transition. |
| 0.7 | 30.0 | PID HES HEY PATHWAY | Notch-mediated HES/HEY network |
| 0.7 | 24.5 | PID RXR VDR PATHWAY | RXR and RAR heterodimerization with other nuclear receptor |
| 0.7 | 11.3 | PID EPHA2 FWD PATHWAY | EPHA2 forward signaling |
| 0.7 | 36.3 | PID PLK1 PATHWAY | PLK1 signaling events |
| 0.7 | 2.6 | PID LYMPH ANGIOGENESIS PATHWAY | VEGFR3 signaling in lymphatic endothelium |
| 0.7 | 51.4 | PID SMAD2 3NUCLEAR PATHWAY | Regulation of nuclear SMAD2/3 signaling |
| 0.6 | 6.2 | PID TCR RAS PATHWAY | Ras signaling in the CD4+ TCR pathway |
| 0.6 | 9.1 | PID CIRCADIAN PATHWAY | Circadian rhythm pathway |
| 0.6 | 17.2 | PID ATR PATHWAY | ATR signaling pathway |
| 0.6 | 12.7 | PID FOXM1 PATHWAY | FOXM1 transcription factor network |
| 0.5 | 18.0 | PID FGF PATHWAY | FGF signaling pathway |
| 0.5 | 23.7 | PID HNF3B PATHWAY | FOXA2 and FOXA3 transcription factor networks |
| 0.5 | 13.8 | PID HIF2PATHWAY | HIF-2-alpha transcription factor network |
| 0.5 | 9.2 | SA TRKA RECEPTOR | The TrkA receptor binds nerve growth factor to activate MAP kinase pathways and promote cell growth. |
| 0.4 | 10.6 | PID IL2 PI3K PATHWAY | IL2 signaling events mediated by PI3K |
| 0.4 | 0.4 | PID IFNG PATHWAY | IFN-gamma pathway |
| 0.4 | 10.7 | PID ANGIOPOIETIN RECEPTOR PATHWAY | Angiopoietin receptor Tie2-mediated signaling |
| 0.4 | 17.0 | PID ILK PATHWAY | Integrin-linked kinase signaling |
| 0.4 | 21.9 | PID DELTA NP63 PATHWAY | Validated transcriptional targets of deltaNp63 isoforms |
| 0.4 | 14.8 | PID TAP63 PATHWAY | Validated transcriptional targets of TAp63 isoforms |
| 0.4 | 19.2 | PID PTP1B PATHWAY | Signaling events mediated by PTP1B |
| 0.4 | 7.2 | PID FANCONI PATHWAY | Fanconi anemia pathway |
| 0.4 | 4.2 | PID HEDGEHOG 2PATHWAY | Signaling events mediated by the Hedgehog family |
| 0.3 | 16.0 | NABA COLLAGENS | Genes encoding collagen proteins |
| 0.3 | 7.1 | PID INTEGRIN A9B1 PATHWAY | Alpha9 beta1 integrin signaling events |
| 0.3 | 11.8 | PID IL4 2PATHWAY | IL4-mediated signaling events |
| 0.3 | 8.2 | PID TCPTP PATHWAY | Signaling events mediated by TCPTP |
| 0.3 | 9.9 | PID NCADHERIN PATHWAY | N-cadherin signaling events |
| 0.3 | 7.9 | ST GA13 PATHWAY | G alpha 13 Pathway |
| 0.3 | 4.1 | PID RB 1PATHWAY | Regulation of retinoblastoma protein |
| 0.3 | 8.0 | PID TELOMERASE PATHWAY | Regulation of Telomerase |
| 0.3 | 7.5 | PID LIS1 PATHWAY | Lissencephaly gene (LIS1) in neuronal migration and development |
| 0.2 | 3.1 | PID TRAIL PATHWAY | TRAIL signaling pathway |
| 0.2 | 5.5 | PID TCR CALCIUM PATHWAY | Calcium signaling in the CD4+ TCR pathway |
| 0.2 | 1.9 | SA PROGRAMMED CELL DEATH | Programmed cell death, or apoptosis, eliminates damaged or unneeded cells. |
| 0.2 | 4.5 | PID UPA UPAR PATHWAY | Urokinase-type plasminogen activator (uPA) and uPAR-mediated signaling |
| 0.2 | 3.9 | ST ERK1 ERK2 MAPK PATHWAY | ERK1/ERK2 MAPK Pathway |
| 0.2 | 1.6 | PID FRA PATHWAY | Validated transcriptional targets of AP1 family members Fra1 and Fra2 |
| 0.2 | 1.6 | PID A6B1 A6B4 INTEGRIN PATHWAY | a6b1 and a6b4 Integrin signaling |
| 0.2 | 0.8 | PID FAK PATHWAY | Signaling events mediated by focal adhesion kinase |
| 0.2 | 1.0 | PID INTEGRIN3 PATHWAY | Beta3 integrin cell surface interactions |
| 0.2 | 4.6 | PID AP1 PATHWAY | AP-1 transcription factor network |
| 0.2 | 0.2 | PID S1P S1P2 PATHWAY | S1P2 pathway |
| 0.1 | 4.7 | NABA BASEMENT MEMBRANES | Genes encoding structural components of basement membranes |
| 0.1 | 5.2 | PID HDAC CLASSI PATHWAY | Signaling events mediated by HDAC Class I |
| 0.1 | 1.3 | PID AURORA A PATHWAY | Aurora A signaling |
| 0.1 | 1.2 | PID NFKAPPAB CANONICAL PATHWAY | Canonical NF-kappaB pathway |
| 0.1 | 2.5 | SIG BCR SIGNALING PATHWAY | Members of the BCR signaling pathway |
| 0.1 | 1.1 | PID RHOA PATHWAY | RhoA signaling pathway |
| 0.1 | 2.5 | PID BMP PATHWAY | BMP receptor signaling |
| 0.1 | 3.6 | SIG REGULATION OF THE ACTIN CYTOSKELETON BY RHO GTPASES | Genes related to regulation of the actin cytoskeleton |
| 0.1 | 1.6 | PID BETA CATENIN DEG PATHWAY | Degradation of beta catenin |
| 0.1 | 1.5 | PID INTEGRIN A4B1 PATHWAY | Alpha4 beta1 integrin signaling events |
| 0.1 | 1.1 | PID BCR 5PATHWAY | BCR signaling pathway |
| 0.1 | 0.9 | PID INTEGRIN5 PATHWAY | Beta5 beta6 beta7 and beta8 integrin cell surface interactions |
| 0.1 | 3.5 | PID CASPASE PATHWAY | Caspase cascade in apoptosis |
| 0.1 | 4.0 | PID BETA CATENIN NUC PATHWAY | Regulation of nuclear beta catenin signaling and target gene transcription |
| 0.1 | 2.2 | PID REG GR PATHWAY | Glucocorticoid receptor regulatory network |
| 0.1 | 0.5 | PID P38 MK2 PATHWAY | p38 signaling mediated by MAPKAP kinases |
| 0.1 | 1.2 | PID CERAMIDE PATHWAY | Ceramide signaling pathway |
| 0.1 | 1.4 | PID MET PATHWAY | Signaling events mediated by Hepatocyte Growth Factor Receptor (c-Met) |
| 0.1 | 1.4 | PID AJDISS 2PATHWAY | Posttranslational regulation of adherens junction stability and dissassembly |
| 0.1 | 0.3 | PID SYNDECAN 1 PATHWAY | Syndecan-1-mediated signaling events |
| 0.0 | 1.8 | PID MYC REPRESS PATHWAY | Validated targets of C-MYC transcriptional repression |
| 0.0 | 0.4 | PID CD40 PATHWAY | CD40/CD40L signaling |
| 0.0 | 0.3 | PID IL1 PATHWAY | IL1-mediated signaling events |
| 0.0 | 0.6 | ST JNK MAPK PATHWAY | JNK MAPK Pathway |
| 0.0 | 0.8 | PID P53 REGULATION PATHWAY | p53 pathway |
| 0.0 | 5.1 | NABA ECM REGULATORS | Genes encoding enzymes and their regulators involved in the remodeling of the extracellular matrix |
| 0.0 | 0.3 | PID IL23 PATHWAY | IL23-mediated signaling events |
Gene overrepresentation in curated gene sets: REACTOME pathways category:
| Log-likelihood per target | Total log-likelihood | Term | Description |
|---|---|---|---|
| 3.6 | 10.9 | REACTOME REGULATION OF GLUCOKINASE BY GLUCOKINASE REGULATORY PROTEIN | Genes involved in Regulation of Glucokinase by Glucokinase Regulatory Protein |
| 2.8 | 33.0 | REACTOME RECYCLING OF BILE ACIDS AND SALTS | Genes involved in Recycling of bile acids and salts |
| 2.7 | 19.2 | REACTOME REGULATION OF THE FANCONI ANEMIA PATHWAY | Genes involved in Regulation of the Fanconi anemia pathway |
| 2.4 | 7.1 | REACTOME INFLUENZA VIRAL RNA TRANSCRIPTION AND REPLICATION | Genes involved in Influenza Viral RNA Transcription and Replication |
| 2.2 | 37.3 | REACTOME ENDOGENOUS STEROLS | Genes involved in Endogenous sterols |
| 2.1 | 36.5 | REACTOME RESOLUTION OF AP SITES VIA THE SINGLE NUCLEOTIDE REPLACEMENT PATHWAY | Genes involved in Resolution of AP sites via the single-nucleotide replacement pathway |
| 2.1 | 53.5 | REACTOME DOWNREGULATION OF SMAD2 3 SMAD4 TRANSCRIPTIONAL ACTIVITY | Genes involved in Downregulation of SMAD2/3:SMAD4 transcriptional activity |
| 2.0 | 28.6 | REACTOME SYNTHESIS OF PE | Genes involved in Synthesis of PE |
| 2.0 | 56.5 | REACTOME RNA POL I TRANSCRIPTION INITIATION | Genes involved in RNA Polymerase I Transcription Initiation |
| 1.9 | 40.6 | REACTOME REGULATION OF INSULIN LIKE GROWTH FACTOR IGF ACTIVITY BY INSULIN LIKE GROWTH FACTOR BINDING PROTEINS IGFBPS | Genes involved in Regulation of Insulin-like Growth Factor (IGF) Activity by Insulin-like Growth Factor Binding Proteins (IGFBPs) |
| 1.9 | 17.3 | REACTOME SYNTHESIS OF BILE ACIDS AND BILE SALTS VIA 7ALPHA HYDROXYCHOLESTEROL | Genes involved in Synthesis of bile acids and bile salts via 7alpha-hydroxycholesterol |
| 1.8 | 16.4 | REACTOME GAMMA CARBOXYLATION TRANSPORT AND AMINO TERMINAL CLEAVAGE OF PROTEINS | Genes involved in Gamma-carboxylation, transport, and amino-terminal cleavage of proteins |
| 1.7 | 29.4 | REACTOME CHYLOMICRON MEDIATED LIPID TRANSPORT | Genes involved in Chylomicron-mediated lipid transport |
| 1.7 | 22.1 | REACTOME PYRIMIDINE CATABOLISM | Genes involved in Pyrimidine catabolism |
| 1.6 | 21.8 | REACTOME FGFR4 LIGAND BINDING AND ACTIVATION | Genes involved in FGFR4 ligand binding and activation |
| 1.6 | 21.7 | REACTOME BILE SALT AND ORGANIC ANION SLC TRANSPORTERS | Genes involved in Bile salt and organic anion SLC transporters |
| 1.4 | 17.0 | REACTOME PASSIVE TRANSPORT BY AQUAPORINS | Genes involved in Passive Transport by Aquaporins |
| 1.4 | 26.3 | REACTOME GLUCURONIDATION | Genes involved in Glucuronidation |
| 1.4 | 6.9 | REACTOME NRAGE SIGNALS DEATH THROUGH JNK | Genes involved in NRAGE signals death through JNK |
| 1.4 | 74.5 | REACTOME MEIOTIC SYNAPSIS | Genes involved in Meiotic Synapsis |
| 1.4 | 20.3 | REACTOME CITRIC ACID CYCLE TCA CYCLE | Genes involved in Citric acid cycle (TCA cycle) |
| 1.3 | 15.2 | REACTOME E2F ENABLED INHIBITION OF PRE REPLICATION COMPLEX FORMATION | Genes involved in E2F-enabled inhibition of pre-replication complex formation |
| 1.2 | 10.7 | REACTOME REGULATION OF RHEB GTPASE ACTIVITY BY AMPK | Genes involved in Regulation of Rheb GTPase activity by AMPK |
| 1.1 | 9.2 | REACTOME ALPHA LINOLENIC ACID ALA METABOLISM | Genes involved in alpha-linolenic acid (ALA) metabolism |
| 1.1 | 55.6 | REACTOME MITOCHONDRIAL PROTEIN IMPORT | Genes involved in Mitochondrial Protein Import |
| 1.1 | 18.5 | REACTOME BRANCHED CHAIN AMINO ACID CATABOLISM | Genes involved in Branched-chain amino acid catabolism |
| 1.1 | 5.4 | REACTOME CROSS PRESENTATION OF SOLUBLE EXOGENOUS ANTIGENS ENDOSOMES | Genes involved in Cross-presentation of soluble exogenous antigens (endosomes) |
| 1.1 | 17.0 | REACTOME DESTABILIZATION OF MRNA BY TRISTETRAPROLIN TTP | Genes involved in Destabilization of mRNA by Tristetraprolin (TTP) |
| 1.1 | 15.9 | REACTOME SYNTHESIS SECRETION AND INACTIVATION OF GIP | Genes involved in Synthesis, Secretion, and Inactivation of Glucose-dependent Insulinotropic Polypeptide (GIP) |
| 1.0 | 15.7 | REACTOME MRNA DECAY BY 5 TO 3 EXORIBONUCLEASE | Genes involved in mRNA Decay by 5' to 3' Exoribonuclease |
| 1.0 | 17.8 | REACTOME MICRORNA MIRNA BIOGENESIS | Genes involved in MicroRNA (miRNA) Biogenesis |
| 1.0 | 13.2 | REACTOME VITAMIN B5 PANTOTHENATE METABOLISM | Genes involved in Vitamin B5 (pantothenate) metabolism |
| 1.0 | 29.1 | REACTOME GLUTATHIONE CONJUGATION | Genes involved in Glutathione conjugation |
| 1.0 | 18.4 | REACTOME TIE2 SIGNALING | Genes involved in Tie2 Signaling |
| 1.0 | 16.3 | REACTOME METABOLISM OF PORPHYRINS | Genes involved in Metabolism of porphyrins |
| 0.9 | 19.6 | REACTOME PROLACTIN RECEPTOR SIGNALING | Genes involved in Prolactin receptor signaling |
| 0.9 | 98.3 | REACTOME DIABETES PATHWAYS | Genes involved in Diabetes pathways |
| 0.9 | 11.5 | REACTOME MTORC1 MEDIATED SIGNALLING | Genes involved in mTORC1-mediated signalling |
| 0.8 | 4.2 | REACTOME APOBEC3G MEDIATED RESISTANCE TO HIV1 INFECTION | Genes involved in APOBEC3G mediated resistance to HIV-1 infection |
| 0.8 | 62.0 | REACTOME NUCLEAR RECEPTOR TRANSCRIPTION PATHWAY | Genes involved in Nuclear Receptor transcription pathway |
| 0.8 | 4.2 | REACTOME INTEGRATION OF PROVIRUS | Genes involved in Integration of provirus |
| 0.8 | 5.8 | REACTOME PURINE CATABOLISM | Genes involved in Purine catabolism |
| 0.8 | 8.7 | REACTOME NFKB ACTIVATION THROUGH FADD RIP1 PATHWAY MEDIATED BY CASPASE 8 AND10 | Genes involved in NF-kB activation through FADD/RIP-1 pathway mediated by caspase-8 and -10 |
| 0.8 | 11.8 | REACTOME PURINE SALVAGE | Genes involved in Purine salvage |
| 0.8 | 11.7 | REACTOME LATE PHASE OF HIV LIFE CYCLE | Genes involved in Late Phase of HIV Life Cycle |
| 0.8 | 6.2 | REACTOME ER PHAGOSOME PATHWAY | Genes involved in ER-Phagosome pathway |
| 0.7 | 5.8 | REACTOME ETHANOL OXIDATION | Genes involved in Ethanol oxidation |
| 0.7 | 10.7 | REACTOME HORMONE SENSITIVE LIPASE HSL MEDIATED TRIACYLGLYCEROL HYDROLYSIS | Genes involved in Hormone-sensitive lipase (HSL)-mediated triacylglycerol hydrolysis |
| 0.7 | 4.0 | REACTOME DESTABILIZATION OF MRNA BY KSRP | Genes involved in Destabilization of mRNA by KSRP |
| 0.6 | 6.5 | REACTOME PKB MEDIATED EVENTS | Genes involved in PKB-mediated events |
| 0.6 | 64.1 | REACTOME PPARA ACTIVATES GENE EXPRESSION | Genes involved in PPARA Activates Gene Expression |
| 0.6 | 15.4 | REACTOME DEPOSITION OF NEW CENPA CONTAINING NUCLEOSOMES AT THE CENTROMERE | Genes involved in Deposition of New CENPA-containing Nucleosomes at the Centromere |
| 0.6 | 21.8 | REACTOME METABOLISM OF STEROID HORMONES AND VITAMINS A AND D | Genes involved in Metabolism of steroid hormones and vitamins A and D |
| 0.6 | 10.8 | REACTOME PYRUVATE METABOLISM | Genes involved in Pyruvate metabolism |
| 0.6 | 8.9 | REACTOME CS DS DEGRADATION | Genes involved in CS/DS degradation |
| 0.6 | 9.7 | REACTOME SYNTHESIS OF SUBSTRATES IN N GLYCAN BIOSYTHESIS | Genes involved in Synthesis of substrates in N-glycan biosythesis |
| 0.6 | 10.6 | REACTOME INHIBITION OF THE PROTEOLYTIC ACTIVITY OF APC C REQUIRED FOR THE ONSET OF ANAPHASE BY MITOTIC SPINDLE CHECKPOINT COMPONENTS | Genes involved in Inhibition of the proteolytic activity of APC/C required for the onset of anaphase by mitotic spindle checkpoint components |
| 0.6 | 11.6 | REACTOME INITIAL TRIGGERING OF COMPLEMENT | Genes involved in Initial triggering of complement |
| 0.6 | 1.2 | REACTOME INCRETIN SYNTHESIS SECRETION AND INACTIVATION | Genes involved in Incretin Synthesis, Secretion, and Inactivation |
| 0.6 | 18.6 | REACTOME MEIOSIS | Genes involved in Meiosis |
| 0.6 | 22.4 | REACTOME AMINO ACID TRANSPORT ACROSS THE PLASMA MEMBRANE | Genes involved in Amino acid transport across the plasma membrane |
| 0.6 | 7.2 | REACTOME ELONGATION ARREST AND RECOVERY | Genes involved in Elongation arrest and recovery |
| 0.6 | 10.5 | REACTOME DEADENYLATION OF MRNA | Genes involved in Deadenylation of mRNA |
| 0.5 | 4.3 | REACTOME TGF BETA RECEPTOR SIGNALING ACTIVATES SMADS | Genes involved in TGF-beta receptor signaling activates SMADs |
| 0.5 | 18.5 | REACTOME GLUCONEOGENESIS | Genes involved in Gluconeogenesis |
| 0.5 | 10.8 | REACTOME RNA POL II TRANSCRIPTION PRE INITIATION AND PROMOTER OPENING | Genes involved in RNA Polymerase II Transcription Pre-Initiation And Promoter Opening |
| 0.5 | 21.4 | REACTOME TRANSPORT TO THE GOLGI AND SUBSEQUENT MODIFICATION | Genes involved in Transport to the Golgi and subsequent modification |
| 0.5 | 22.3 | REACTOME MRNA 3 END PROCESSING | Genes involved in mRNA 3'-end processing |
| 0.5 | 23.1 | REACTOME TRNA AMINOACYLATION | Genes involved in tRNA Aminoacylation |
| 0.5 | 7.2 | REACTOME APOPTOTIC CLEAVAGE OF CELL ADHESION PROTEINS | Genes involved in Apoptotic cleavage of cell adhesion proteins |
| 0.5 | 5.1 | REACTOME UNWINDING OF DNA | Genes involved in Unwinding of DNA |
| 0.5 | 9.5 | REACTOME GLUCOSE TRANSPORT | Genes involved in Glucose transport |
| 0.5 | 13.8 | REACTOME TRANSPORT OF VITAMINS NUCLEOSIDES AND RELATED MOLECULES | Genes involved in Transport of vitamins, nucleosides, and related molecules |
| 0.5 | 5.3 | REACTOME BMAL1 CLOCK NPAS2 ACTIVATES CIRCADIAN EXPRESSION | Genes involved in BMAL1:CLOCK/NPAS2 Activates Circadian Expression |
| 0.5 | 39.4 | REACTOME GLYCEROPHOSPHOLIPID BIOSYNTHESIS | Genes involved in Glycerophospholipid biosynthesis |
| 0.5 | 5.4 | REACTOME G0 AND EARLY G1 | Genes involved in G0 and Early G1 |
| 0.4 | 8.4 | REACTOME G2 M CHECKPOINTS | Genes involved in G2/M Checkpoints |
| 0.4 | 9.6 | REACTOME CLASS C 3 METABOTROPIC GLUTAMATE PHEROMONE RECEPTORS | Genes involved in Class C/3 (Metabotropic glutamate/pheromone receptors) |
| 0.4 | 3.0 | REACTOME CDC6 ASSOCIATION WITH THE ORC ORIGIN COMPLEX | Genes involved in CDC6 association with the ORC:origin complex |
| 0.4 | 5.6 | REACTOME TGF BETA RECEPTOR SIGNALING IN EMT EPITHELIAL TO MESENCHYMAL TRANSITION | Genes involved in TGF-beta receptor signaling in EMT (epithelial to mesenchymal transition) |
| 0.4 | 4.7 | REACTOME ELEVATION OF CYTOSOLIC CA2 LEVELS | Genes involved in Elevation of cytosolic Ca2+ levels |
| 0.4 | 4.6 | REACTOME PURINE METABOLISM | Genes involved in Purine metabolism |
| 0.4 | 15.8 | REACTOME GLUCAGON TYPE LIGAND RECEPTORS | Genes involved in Glucagon-type ligand receptors |
| 0.4 | 7.5 | REACTOME SIGNALING BY BMP | Genes involved in Signaling by BMP |
| 0.4 | 4.4 | REACTOME SRP DEPENDENT COTRANSLATIONAL PROTEIN TARGETING TO MEMBRANE | Genes involved in SRP-dependent cotranslational protein targeting to membrane |
| 0.4 | 19.1 | REACTOME ACTIVATION OF THE MRNA UPON BINDING OF THE CAP BINDING COMPLEX AND EIFS AND SUBSEQUENT BINDING TO 43S | Genes involved in Activation of the mRNA upon binding of the cap-binding complex and eIFs, and subsequent binding to 43S |
| 0.4 | 3.9 | REACTOME DOUBLE STRAND BREAK REPAIR | Genes involved in Double-Strand Break Repair |
| 0.4 | 6.3 | REACTOME SYNTHESIS OF GLYCOSYLPHOSPHATIDYLINOSITOL GPI | Genes involved in Synthesis of glycosylphosphatidylinositol (GPI) |
| 0.3 | 17.0 | REACTOME METABOLISM OF NON CODING RNA | Genes involved in Metabolism of non-coding RNA |
| 0.3 | 2.8 | REACTOME OPSINS | Genes involved in Opsins |
| 0.3 | 4.8 | REACTOME BIOSYNTHESIS OF THE N GLYCAN PRECURSOR DOLICHOL LIPID LINKED OLIGOSACCHARIDE LLO AND TRANSFER TO A NASCENT PROTEIN | Genes involved in Biosynthesis of the N-glycan precursor (dolichol lipid-linked oligosaccharide, LLO) and transfer to a nascent protein |
| 0.3 | 4.4 | REACTOME SIGNALLING TO P38 VIA RIT AND RIN | Genes involved in Signalling to p38 via RIT and RIN |
| 0.3 | 7.4 | REACTOME G1 PHASE | Genes involved in G1 Phase |
| 0.3 | 4.9 | REACTOME AMINE DERIVED HORMONES | Genes involved in Amine-derived hormones |
| 0.3 | 12.7 | REACTOME NCAM1 INTERACTIONS | Genes involved in NCAM1 interactions |
| 0.3 | 48.2 | REACTOME ANTIGEN PROCESSING UBIQUITINATION PROTEASOME DEGRADATION | Genes involved in Antigen processing: Ubiquitination & Proteasome degradation |
| 0.3 | 17.0 | REACTOME MRNA SPLICING | Genes involved in mRNA Splicing |
| 0.3 | 18.5 | REACTOME MITOTIC PROMETAPHASE | Genes involved in Mitotic Prometaphase |
| 0.3 | 5.4 | REACTOME ENOS ACTIVATION AND REGULATION | Genes involved in eNOS activation and regulation |
| 0.3 | 1.7 | REACTOME REGULATION OF WATER BALANCE BY RENAL AQUAPORINS | Genes involved in Regulation of Water Balance by Renal Aquaporins |
| 0.3 | 5.0 | REACTOME RNA POL III TRANSCRIPTION INITIATION FROM TYPE 3 PROMOTER | Genes involved in RNA Polymerase III Transcription Initiation From Type 3 Promoter |
| 0.3 | 8.6 | REACTOME INTRINSIC PATHWAY FOR APOPTOSIS | Genes involved in Intrinsic Pathway for Apoptosis |
| 0.3 | 5.0 | REACTOME ASPARAGINE N LINKED GLYCOSYLATION | Genes involved in Asparagine N-linked glycosylation |
| 0.3 | 1.3 | REACTOME CYCLIN E ASSOCIATED EVENTS DURING G1 S TRANSITION | Genes involved in Cyclin E associated events during G1/S transition |
| 0.2 | 3.9 | REACTOME TRANSCRIPTIONAL REGULATION OF WHITE ADIPOCYTE DIFFERENTIATION | Genes involved in Transcriptional Regulation of White Adipocyte Differentiation |
| 0.2 | 37.5 | REACTOME METABOLISM OF AMINO ACIDS AND DERIVATIVES | Genes involved in Metabolism of amino acids and derivatives |
| 0.2 | 0.2 | REACTOME ANTIGEN PRESENTATION FOLDING ASSEMBLY AND PEPTIDE LOADING OF CLASS I MHC | Genes involved in Antigen Presentation: Folding, assembly and peptide loading of class I MHC |
| 0.2 | 3.6 | REACTOME NUCLEAR EVENTS KINASE AND TRANSCRIPTION FACTOR ACTIVATION | Genes involved in Nuclear Events (kinase and transcription factor activation) |
| 0.2 | 6.1 | REACTOME SPHINGOLIPID DE NOVO BIOSYNTHESIS | Genes involved in Sphingolipid de novo biosynthesis |
| 0.2 | 1.3 | REACTOME OXYGEN DEPENDENT PROLINE HYDROXYLATION OF HYPOXIA INDUCIBLE FACTOR ALPHA | Genes involved in Oxygen-dependent Proline Hydroxylation of Hypoxia-inducible Factor Alpha |
| 0.2 | 2.8 | REACTOME CELL EXTRACELLULAR MATRIX INTERACTIONS | Genes involved in Cell-extracellular matrix interactions |
| 0.2 | 2.1 | REACTOME PYRIMIDINE METABOLISM | Genes involved in Pyrimidine metabolism |
| 0.2 | 1.0 | REACTOME SIGNAL REGULATORY PROTEIN SIRP FAMILY INTERACTIONS | Genes involved in Signal regulatory protein (SIRP) family interactions |
| 0.2 | 1.0 | REACTOME THROMBOXANE SIGNALLING THROUGH TP RECEPTOR | Genes involved in Thromboxane signalling through TP receptor |
| 0.2 | 1.0 | REACTOME P75 NTR RECEPTOR MEDIATED SIGNALLING | Genes involved in p75 NTR receptor-mediated signalling |
| 0.2 | 1.4 | REACTOME DCC MEDIATED ATTRACTIVE SIGNALING | Genes involved in DCC mediated attractive signaling |
| 0.2 | 1.7 | REACTOME TRANSLATION | Genes involved in Translation |
| 0.1 | 2.4 | REACTOME NA CL DEPENDENT NEUROTRANSMITTER TRANSPORTERS | Genes involved in Na+/Cl- dependent neurotransmitter transporters |
| 0.1 | 0.9 | REACTOME RNA POL III TRANSCRIPTION INITIATION FROM TYPE 2 PROMOTER | Genes involved in RNA Polymerase III Transcription Initiation From Type 2 Promoter |
| 0.1 | 0.1 | REACTOME ORC1 REMOVAL FROM CHROMATIN | Genes involved in Orc1 removal from chromatin |
| 0.1 | 2.0 | REACTOME FANCONI ANEMIA PATHWAY | Genes involved in Fanconi Anemia pathway |
| 0.1 | 5.3 | REACTOME SEMA4D IN SEMAPHORIN SIGNALING | Genes involved in Sema4D in semaphorin signaling |
| 0.1 | 5.2 | REACTOME COLLAGEN FORMATION | Genes involved in Collagen formation |
| 0.1 | 9.3 | REACTOME NONSENSE MEDIATED DECAY ENHANCED BY THE EXON JUNCTION COMPLEX | Genes involved in Nonsense Mediated Decay Enhanced by the Exon Junction Complex |
| 0.1 | 1.6 | REACTOME TANDEM PORE DOMAIN POTASSIUM CHANNELS | Genes involved in Tandem pore domain potassium channels |
| 0.1 | 1.1 | REACTOME COPI MEDIATED TRANSPORT | Genes involved in COPI Mediated Transport |
| 0.1 | 0.7 | REACTOME REPAIR SYNTHESIS FOR GAP FILLING BY DNA POL IN TC NER | Genes involved in Repair synthesis for gap-filling by DNA polymerase in TC-NER |
| 0.1 | 1.0 | REACTOME NOTCH HLH TRANSCRIPTION PATHWAY | Genes involved in Notch-HLH transcription pathway |
| 0.1 | 0.9 | REACTOME RNA POL I RNA POL III AND MITOCHONDRIAL TRANSCRIPTION | Genes involved in RNA Polymerase I, RNA Polymerase III, and Mitochondrial Transcription |
| 0.1 | 1.5 | REACTOME ZINC TRANSPORTERS | Genes involved in Zinc transporters |
| 0.1 | 2.0 | REACTOME CASPASE MEDIATED CLEAVAGE OF CYTOSKELETAL PROTEINS | Genes involved in Caspase-mediated cleavage of cytoskeletal proteins |
| 0.1 | 0.7 | REACTOME RECRUITMENT OF NUMA TO MITOTIC CENTROSOMES | Genes involved in Recruitment of NuMA to mitotic centrosomes |
| 0.1 | 1.0 | REACTOME CYTOSOLIC SULFONATION OF SMALL MOLECULES | Genes involved in Cytosolic sulfonation of small molecules |
| 0.1 | 2.8 | REACTOME FATTY ACID TRIACYLGLYCEROL AND KETONE BODY METABOLISM | Genes involved in Fatty acid, triacylglycerol, and ketone body metabolism |
| 0.1 | 1.1 | REACTOME SIGNALING BY HIPPO | Genes involved in Signaling by Hippo |
| 0.1 | 0.9 | REACTOME GRB2 SOS PROVIDES LINKAGE TO MAPK SIGNALING FOR INTERGRINS | Genes involved in GRB2:SOS provides linkage to MAPK signaling for Intergrins |
| 0.0 | 0.6 | REACTOME NUCLEOTIDE LIKE PURINERGIC RECEPTORS | Genes involved in Nucleotide-like (purinergic) receptors |
| 0.0 | 1.8 | REACTOME RECRUITMENT OF MITOTIC CENTROSOME PROTEINS AND COMPLEXES | Genes involved in Recruitment of mitotic centrosome proteins and complexes |
| 0.0 | 0.7 | REACTOME TAK1 ACTIVATES NFKB BY PHOSPHORYLATION AND ACTIVATION OF IKKS COMPLEX | Genes involved in TAK1 activates NFkB by phosphorylation and activation of IKKs complex |
| 0.0 | 0.5 | REACTOME ENDOSOMAL SORTING COMPLEX REQUIRED FOR TRANSPORT ESCRT | Genes involved in Endosomal Sorting Complex Required For Transport (ESCRT) |
| 0.0 | 1.0 | REACTOME ANTIVIRAL MECHANISM BY IFN STIMULATED GENES | Genes involved in Antiviral mechanism by IFN-stimulated genes |
| 0.0 | 0.2 | REACTOME SIGNALING BY NODAL | Genes involved in Signaling by NODAL |
| 0.0 | 0.4 | REACTOME ASSOCIATION OF TRIC CCT WITH TARGET PROTEINS DURING BIOSYNTHESIS | Genes involved in Association of TriC/CCT with target proteins during biosynthesis |
| 0.0 | 0.4 | REACTOME CELL CYCLE | Genes involved in Cell Cycle |
| 0.0 | 2.2 | REACTOME SIGNALING BY RHO GTPASES | Genes involved in Signaling by Rho GTPases |
| 0.0 | 0.4 | REACTOME ABC FAMILY PROTEINS MEDIATED TRANSPORT | Genes involved in ABC-family proteins mediated transport |