Project
GSE53960: rat RNA-Seq transcriptomic Bodymap
Navigation
Downloads
Results for Maf_Nrl
Z-value: 1.12
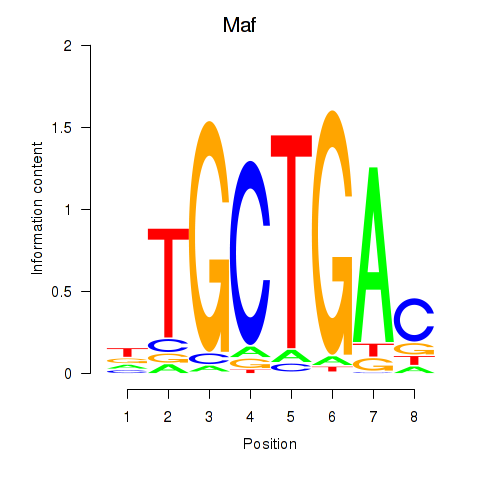
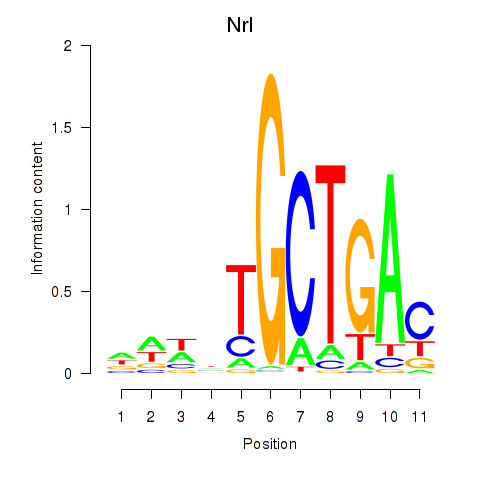
Motif logo
Transcription factors associated with Maf_Nrl
| Gene Symbol | Gene ID | Gene Info |
|---|---|---|
|
Maf
|
ENSRNOG00000012428 | MAF bZIP transcription factor |
|
Nrl
|
ENSRNOG00000018528 | neural retina leucine zipper |
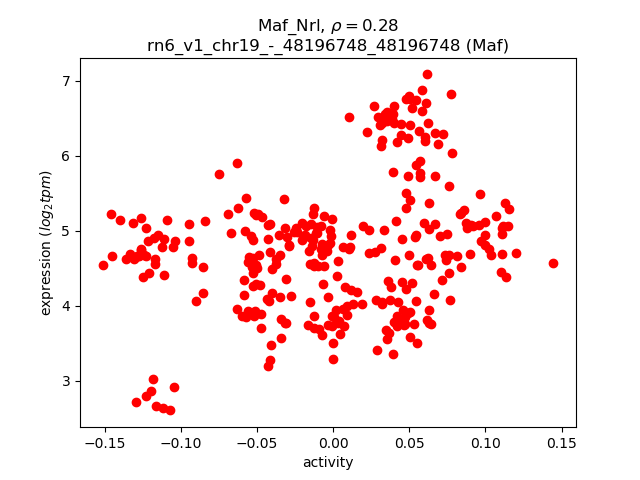
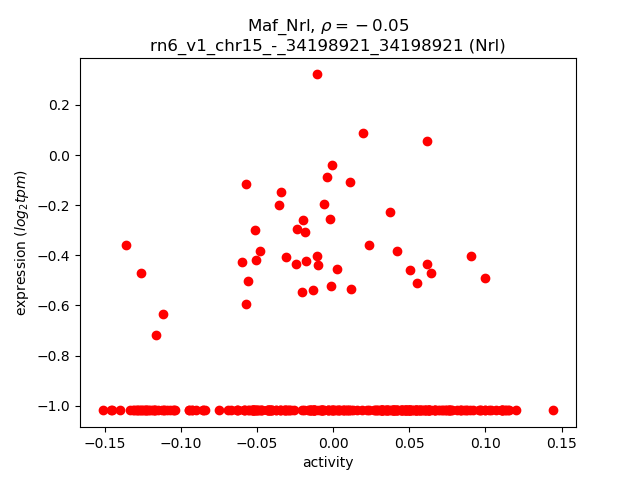
Activity-expression correlation:
| Gene | Promoter | Pearson corr. coef. | P-value | Plot |
|---|---|---|---|---|
| Maf | rn6_v1_chr19_-_48196748_48196748 | 0.28 | 2.9e-07 | Click! |
| Nrl | rn6_v1_chr15_-_34198921_34198921 | -0.05 | 3.6e-01 | Click! |
Activity profile of Maf_Nrl motif
Sorted Z-values of Maf_Nrl motif
| Promoter | Log-likelihood | Transcript | Gene | Gene Info |
|---|---|---|---|---|
| chr9_-_73948583 | 71.69 |
ENSRNOT00000018097
|
Myl1
|
myosin, light chain 1 |
| chr10_+_53818818 | 46.43 |
ENSRNOT00000057260
|
Myh8
|
myosin heavy chain 8 |
| chr9_-_73958480 | 45.41 |
ENSRNOT00000017838
|
Myl1
|
myosin, light chain 1 |
| chr11_-_28527890 | 41.30 |
ENSRNOT00000002138
|
Cldn8
|
claudin 8 |
| chr4_-_41212072 | 26.53 |
ENSRNOT00000085596
|
Ppp1r3a
|
protein phosphatase 1, regulatory subunit 3A |
| chr2_-_28799266 | 25.58 |
ENSRNOT00000089293
|
Tmem171
|
transmembrane protein 171 |
| chr16_+_26906716 | 22.48 |
ENSRNOT00000064297
|
Cpe
|
carboxypeptidase E |
| chr1_+_238222521 | 19.56 |
ENSRNOT00000024000
|
Aldh1a1
|
aldehyde dehydrogenase 1 family, member A1 |
| chr3_+_112242270 | 19.35 |
ENSRNOT00000080533
ENSRNOT00000082876 |
Capn3
|
calpain 3 |
| chr7_+_38858062 | 18.96 |
ENSRNOT00000006234
|
Kera
|
keratocan |
| chr17_-_389967 | 18.00 |
ENSRNOT00000023865
|
Fbp2
|
fructose-bisphosphatase 2 |
| chr1_+_32199810 | 17.94 |
ENSRNOT00000036714
|
Slc6a19
|
solute carrier family 6 member 19 |
| chr1_-_240601744 | 17.63 |
ENSRNOT00000024093
|
Aldh1a7
|
aldehyde dehydrogenase family 1, subfamily A7 |
| chr19_+_58823814 | 16.97 |
ENSRNOT00000027058
ENSRNOT00000088626 |
Kcnk1
|
potassium two pore domain channel subfamily K member 1 |
| chr15_-_27819376 | 16.34 |
ENSRNOT00000067400
|
A930018M24Rik
|
RIKEN cDNA A930018M24 gene |
| chr4_-_97784842 | 16.18 |
ENSRNOT00000007698
|
Gadd45a
|
growth arrest and DNA-damage-inducible, alpha |
| chr4_+_64088900 | 15.87 |
ENSRNOT00000075341
|
Chrm2
|
cholinergic receptor, muscarinic 2 |
| chr1_-_242765807 | 13.75 |
ENSRNOT00000020763
|
Pgm5
|
phosphoglucomutase 5 |
| chr1_-_250727079 | 13.34 |
ENSRNOT00000079942
ENSRNOT00000087588 |
Sgms1
|
sphingomyelin synthase 1 |
| chrX_+_26439197 | 13.25 |
ENSRNOT00000078843
ENSRNOT00000052176 ENSRNOT00000087268 |
Amelx
|
amelogenin, X-linked |
| chr19_+_27404712 | 11.51 |
ENSRNOT00000023657
|
Mylk3
|
myosin light chain kinase 3 |
| chr20_+_34258791 | 11.30 |
ENSRNOT00000000468
|
Slc35f1
|
solute carrier family 35, member F1 |
| chr11_-_83867203 | 11.24 |
ENSRNOT00000002394
|
Chrd
|
chordin |
| chr4_-_124338176 | 11.20 |
ENSRNOT00000016628
|
Prickle2
|
prickle planar cell polarity protein 2 |
| chr10_-_82887301 | 10.40 |
ENSRNOT00000035894
|
Itga3
|
integrin subunit alpha 3 |
| chr10_+_71202456 | 10.34 |
ENSRNOT00000076893
|
Hnf1b
|
HNF1 homeobox B |
| chr8_+_48718329 | 10.26 |
ENSRNOT00000089763
|
Slc37a4
|
solute carrier family 37 member 4 |
| chr7_-_81592206 | 9.97 |
ENSRNOT00000007979
|
Angpt1
|
angiopoietin 1 |
| chrX_+_110818716 | 9.90 |
ENSRNOT00000086308
|
Rnf128
|
ring finger protein 128, E3 ubiquitin protein ligase |
| chr11_+_27208564 | 9.89 |
ENSRNOT00000002158
|
Map3k7cl
|
MAP3K7 C-terminal like |
| chr9_-_52238564 | 9.88 |
ENSRNOT00000005073
|
Col5a2
|
collagen type V alpha 2 chain |
| chr18_-_28444880 | 9.72 |
ENSRNOT00000060696
|
Prob1
|
proline rich basic protein 1 |
| chr1_-_176983045 | 9.34 |
ENSRNOT00000022301
|
Dkk3
|
dickkopf WNT signaling pathway inhibitor 3 |
| chr2_-_138833933 | 9.32 |
ENSRNOT00000013343
|
Pcdh18
|
protocadherin 18 |
| chr3_-_163935617 | 9.18 |
ENSRNOT00000074023
|
Kcnb1
|
potassium voltage-gated channel subfamily B member 1 |
| chrX_-_23139694 | 8.96 |
ENSRNOT00000033656
|
Pfkfb1
|
6-phosphofructo-2-kinase/fructose-2,6-biphosphatase 1 |
| chr6_+_26784088 | 8.85 |
ENSRNOT00000009565
|
Preb
|
prolactin regulatory element binding |
| chrX_-_32153794 | 8.70 |
ENSRNOT00000005348
|
Tmem27
|
transmembrane protein 27 |
| chr10_+_31880918 | 8.68 |
ENSRNOT00000059448
|
Timd4
|
T-cell immunoglobulin and mucin domain containing 4 |
| chr3_+_57770948 | 8.64 |
ENSRNOT00000038429
|
AC107446.2
|
|
| chr15_-_3544685 | 8.58 |
ENSRNOT00000015179
ENSRNOT00000085126 |
Vcl
|
vinculin |
| chr17_-_77527894 | 8.49 |
ENSRNOT00000032173
|
Bend7
|
BEN domain containing 7 |
| chr14_-_8432195 | 8.41 |
ENSRNOT00000089800
|
Arhgap24
|
Rho GTPase activating protein 24 |
| chr14_+_33010300 | 8.35 |
ENSRNOT00000002809
|
Igfbp7
|
insulin-like growth factor binding protein 7 |
| chr7_-_96464049 | 8.35 |
ENSRNOT00000006517
|
Has2
|
hyaluronan synthase 2 |
| chr10_-_98469799 | 8.22 |
ENSRNOT00000087502
ENSRNOT00000088646 |
Abca9
|
ATP binding cassette subfamily A member 9 |
| chr1_+_266953139 | 7.93 |
ENSRNOT00000054696
|
Neurl1
|
neuralized E3 ubiquitin protein ligase 1 |
| chr7_-_134722215 | 7.37 |
ENSRNOT00000036750
|
Prickle1
|
prickle planar cell polarity protein 1 |
| chr16_+_83358116 | 7.26 |
ENSRNOT00000031109
|
Rab20
|
RAB20, member RAS oncogene family |
| chr9_-_71830730 | 7.20 |
ENSRNOT00000019963
|
Cryga
|
crystallin, gamma A |
| chr2_-_192991199 | 7.09 |
ENSRNOT00000056485
|
Lce1f
|
late cornified envelope 1F |
| chr5_+_28395296 | 7.06 |
ENSRNOT00000009375
|
Tmem55a
|
transmembrane protein 55A |
| chr17_+_11683862 | 7.01 |
ENSRNOT00000024766
|
Msx2
|
msh homeobox 2 |
| chr1_+_264507985 | 6.71 |
ENSRNOT00000085811
|
Pax2
|
paired box 2 |
| chr15_+_2766710 | 6.68 |
ENSRNOT00000017483
|
Dupd1
|
dual specificity phosphatase and pro isomerase domain containing 1 |
| chr2_+_11658568 | 6.60 |
ENSRNOT00000076408
ENSRNOT00000076416 ENSRNOT00000076992 ENSRNOT00000075931 ENSRNOT00000076136 ENSRNOT00000076481 ENSRNOT00000076084 ENSRNOT00000076230 ENSRNOT00000076710 ENSRNOT00000076239 |
Mef2c
|
myocyte enhancer factor 2C |
| chr2_-_113616766 | 6.34 |
ENSRNOT00000016858
ENSRNOT00000074723 |
Tmem212
|
transmembrane protein 212 |
| chr8_-_95387363 | 5.87 |
ENSRNOT00000014657
|
Tbx18
|
T-box18 |
| chr1_+_264504591 | 5.71 |
ENSRNOT00000050076
|
Pax2
|
paired box 2 |
| chr11_+_17538063 | 5.65 |
ENSRNOT00000031889
ENSRNOT00000090878 |
Chodl
|
chondrolectin |
| chr7_-_117259791 | 5.65 |
ENSRNOT00000086550
|
Plec
|
plectin |
| chr5_-_166282831 | 5.54 |
ENSRNOT00000021348
|
Rbp7
|
retinol binding protein 7 |
| chr3_+_37545238 | 5.27 |
ENSRNOT00000070792
|
Tnfaip6
|
TNF alpha induced protein 6 |
| chr14_+_83560541 | 5.24 |
ENSRNOT00000057738
ENSRNOT00000085228 |
Pik3ip1
|
phosphoinositide-3-kinase interacting protein 1 |
| chr6_+_136358057 | 5.23 |
ENSRNOT00000092741
|
Klc1
|
kinesin light chain 1 |
| chr1_+_258210344 | 5.17 |
ENSRNOT00000001990
|
LOC100361492
|
cytochrome P450, family 2, subfamily c, polypeptide 55-like |
| chr4_-_82141385 | 4.90 |
ENSRNOT00000008447
|
Hoxa3
|
homeobox A3 |
| chr2_-_193101051 | 4.81 |
ENSRNOT00000065242
|
AABR07012318.1
|
|
| chr4_+_6931495 | 4.79 |
ENSRNOT00000079770
|
Wdr86
|
WD repeat domain 86 |
| chr9_+_16702460 | 4.71 |
ENSRNOT00000061432
|
Ptk7
|
protein tyrosine kinase 7 |
| chr15_+_83707735 | 4.67 |
ENSRNOT00000057843
|
Klf5
|
Kruppel-like factor 5 |
| chr17_-_16695126 | 4.65 |
ENSRNOT00000021550
|
Id4
|
inhibitor of DNA binding 4, HLH protein |
| chr4_+_88584242 | 4.25 |
ENSRNOT00000008973
|
Pyurf
|
PIGY upstream reading frame |
| chr9_+_81566074 | 4.10 |
ENSRNOT00000074131
ENSRNOT00000046229 ENSRNOT00000090383 |
Pnkd
|
paroxysmal nonkinesigenic dyskinesia |
| chr17_+_23135985 | 4.03 |
ENSRNOT00000090794
|
Nedd9
|
neural precursor cell expressed, developmentally down-regulated 9 |
| chr9_+_100076958 | 3.97 |
ENSRNOT00000084297
|
Dusp28
|
dual specificity phosphatase 28 |
| chr7_+_59200918 | 3.90 |
ENSRNOT00000085073
|
Ptprr
|
protein tyrosine phosphatase, receptor type, R |
| chr9_-_19372673 | 3.83 |
ENSRNOT00000073667
ENSRNOT00000079517 |
Clic5
|
chloride intracellular channel 5 |
| chr1_+_85252103 | 3.83 |
ENSRNOT00000080740
|
Ifnl1
|
interferon, lambda 1 |
| chr3_-_122920684 | 3.66 |
ENSRNOT00000028818
|
Cpxm1
|
carboxypeptidase X (M14 family), member 1 |
| chr15_+_35002213 | 3.54 |
ENSRNOT00000043182
|
Mcpt1l4
|
mast cell protease 1-like 4 |
| chr2_+_127845034 | 3.49 |
ENSRNOT00000044804
|
Larp1b
|
La ribonucleoprotein domain family, member 1B |
| chr16_-_19399851 | 3.46 |
ENSRNOT00000089056
ENSRNOT00000021073 |
Tpm4
|
tropomyosin 4 |
| chr18_-_57515834 | 3.44 |
ENSRNOT00000026098
|
Adrb2
|
adrenoceptor beta 2 |
| chr9_+_88494676 | 3.41 |
ENSRNOT00000089451
|
LOC102556337
|
mitochondrial fission factor-like |
| chr1_-_175676699 | 3.31 |
ENSRNOT00000030474
|
Lyve1
|
lymphatic vessel endothelial hyaluronan receptor 1 |
| chr3_+_151126591 | 3.21 |
ENSRNOT00000025859
|
Myh7b
|
myosin heavy chain 7B |
| chr11_+_30550141 | 3.19 |
ENSRNOT00000002866
|
Hunk
|
hormonally upregulated Neu-associated kinase |
| chr10_+_59923201 | 3.18 |
ENSRNOT00000073603
ENSRNOT00000045573 |
Olr1498
|
olfactory receptor 1498 |
| chr8_+_112526553 | 3.14 |
ENSRNOT00000014636
|
Nphp3
|
nephrocystin 3 |
| chr10_-_88144625 | 3.10 |
ENSRNOT00000086209
|
Ka11
|
type I keratin KA11 |
| chr10_-_88144468 | 3.03 |
ENSRNOT00000084619
|
Ka11
|
type I keratin KA11 |
| chr4_-_71893306 | 2.91 |
ENSRNOT00000077710
|
Olr803
|
olfactory receptor 803 |
| chr1_-_131454689 | 2.89 |
ENSRNOT00000014152
|
Nr2f2
|
nuclear receptor subfamily 2, group F, member 2 |
| chr13_+_42008842 | 2.86 |
ENSRNOT00000038811
|
Gpr39
|
G protein-coupled receptor 39 |
| chr15_-_34636197 | 2.85 |
ENSRNOT00000087476
|
AABR07017922.1
|
|
| chr6_-_39363367 | 2.84 |
ENSRNOT00000088687
ENSRNOT00000065531 |
Fam84a
|
family with sequence similarity 84, member A |
| chr3_-_45210474 | 2.71 |
ENSRNOT00000091777
|
Ccdc148
|
coiled-coil domain containing 148 |
| chr13_+_27032048 | 2.60 |
ENSRNOT00000031789
|
Serpinb13
|
serpin family B member 13 |
| chr10_-_6870011 | 2.51 |
ENSRNOT00000003439
|
RGD1309748
|
similar to CG4768-PA |
| chr5_+_113725717 | 2.50 |
ENSRNOT00000032248
|
Tek
|
TEK receptor tyrosine kinase |
| chr17_-_1648973 | 2.50 |
ENSRNOT00000036212
|
Slc35d2
|
solute carrier family 35 member D2 |
| chr14_-_42221225 | 2.44 |
ENSRNOT00000036103
|
Shisa3
|
shisa family member 3 |
| chr19_-_46101250 | 2.44 |
ENSRNOT00000015874
|
Adamts18
|
ADAM metallopeptidase with thrombospondin type 1 motif, 18 |
| chr5_+_76150840 | 2.40 |
ENSRNOT00000020702
|
Dnajc25
|
DnaJ heat shock protein family (Hsp40) member C25 |
| chr9_+_49479023 | 2.39 |
ENSRNOT00000050922
ENSRNOT00000077111 |
Pou3f3
|
POU class 3 homeobox 3 |
| chr10_-_86997981 | 2.39 |
ENSRNOT00000030720
|
Tns4
|
tensin 4 |
| chr2_+_148722231 | 2.38 |
ENSRNOT00000018022
|
Eif2a
|
eukaryotic translation initiation factor 2A |
| chr1_+_234183427 | 2.32 |
ENSRNOT00000050860
|
AABR07006451.1
|
|
| chr5_+_21830882 | 2.30 |
ENSRNOT00000008901
|
Chd7
|
chromodomain helicase DNA binding protein 7 |
| chr13_+_52413241 | 2.29 |
ENSRNOT00000035157
|
AABR07020999.1
|
|
| chr3_-_7498555 | 2.28 |
ENSRNOT00000017725
|
Barhl1
|
BarH-like homeobox 1 |
| chr3_+_65815080 | 2.28 |
ENSRNOT00000006429
|
Ube2e3
|
ubiquitin-conjugating enzyme E2E 3 |
| chr9_+_111597037 | 2.16 |
ENSRNOT00000021758
|
Fer
|
FER tyrosine kinase |
| chr8_+_41365984 | 2.15 |
ENSRNOT00000074250
|
Olr1228
|
olfactory receptor 1228 |
| chr5_-_117754571 | 2.10 |
ENSRNOT00000011405
|
Dock7
|
dedicator of cytokinesis 7 |
| chr17_-_87826421 | 2.09 |
ENSRNOT00000068156
|
Arhgap21
|
Rho GTPase activating protein 21 |
| chr13_-_42885440 | 2.06 |
ENSRNOT00000038020
|
Nckap5
|
NCK-associated protein 5 |
| chrX_-_22440187 | 2.03 |
ENSRNOT00000090731
|
Gpr173
|
|
| chr12_-_35318685 | 1.98 |
ENSRNOT00000074199
|
AABR07036167.1
|
|
| chr9_+_45605552 | 1.97 |
ENSRNOT00000059587
|
NMS
|
neuromedin S |
| chr10_+_60231027 | 1.94 |
ENSRNOT00000085543
|
Olr1482
|
olfactory receptor 1482 |
| chr5_-_147584038 | 1.91 |
ENSRNOT00000010983
|
Zbtb8a
|
zinc finger and BTB domain containing 8a |
| chr3_+_120728688 | 1.84 |
ENSRNOT00000022596
|
Bcl2l11
|
BCL2 like 11 |
| chr4_-_40385349 | 1.79 |
ENSRNOT00000039005
|
Gpr85
|
G protein-coupled receptor 85 |
| chr6_+_10533151 | 1.72 |
ENSRNOT00000020822
|
Rhoq
|
ras homolog family member Q |
| chr1_-_101514974 | 1.72 |
ENSRNOT00000044788
|
Ppp1r15a
|
protein phosphatase 1, regulatory subunit 15A |
| chr8_-_18408179 | 1.72 |
ENSRNOT00000040032
|
AABR07069371.1
|
|
| chr7_+_14821691 | 1.56 |
ENSRNOT00000067074
|
Cyp4f37
|
cytochrome P450, family 4, subfamily f, polypeptide 37 |
| chr9_+_17105151 | 1.54 |
ENSRNOT00000091113
|
Tjap1
|
tight junction associated protein 1 |
| chr3_+_76862322 | 1.54 |
ENSRNOT00000088803
|
LOC100910893
|
olfactory receptor 4C11-like |
| chr10_+_56411028 | 1.48 |
ENSRNOT00000085772
|
AABR07029862.1
|
|
| chr11_-_33003021 | 1.41 |
ENSRNOT00000084134
|
Runx1
|
runt-related transcription factor 1 |
| chr2_+_18392142 | 1.40 |
ENSRNOT00000043196
|
Hapln1
|
hyaluronan and proteoglycan link protein 1 |
| chrX_+_67563988 | 1.29 |
ENSRNOT00000048313
|
AABR07039075.1
|
|
| chr16_-_75107931 | 1.29 |
ENSRNOT00000058066
|
Defb15
|
defensin beta 15 |
| chr3_-_78942535 | 1.23 |
ENSRNOT00000008924
|
Olr731
|
olfactory receptor 731 |
| chr18_-_57031459 | 1.15 |
ENSRNOT00000026583
|
Pcyox1l
|
prenylcysteine oxidase 1 like |
| chr5_+_124300477 | 1.13 |
ENSRNOT00000010100
|
C8b
|
complement C8 beta chain |
| chr1_+_78029555 | 1.08 |
ENSRNOT00000047289
|
Slc8a2
|
solute carrier family 8 member A2 |
| chrX_+_15114892 | 1.06 |
ENSRNOT00000078168
|
Wdr13
|
WD repeat domain 13 |
| chr19_+_10167797 | 1.06 |
ENSRNOT00000085440
|
Cngb1
|
cyclic nucleotide gated channel beta 1 |
| chr19_-_10763091 | 1.04 |
ENSRNOT00000079523
ENSRNOT00000023455 |
Arl2bp
|
ADP-ribosylation factor like GTPase 2 binding protein |
| chr1_+_221801524 | 1.03 |
ENSRNOT00000031227
|
Nrxn2
|
neurexin 2 |
| chr3_-_78886096 | 1.01 |
ENSRNOT00000008864
|
Olr729
|
olfactory receptor 729 |
| chrX_+_20216587 | 0.99 |
ENSRNOT00000073114
|
AABR07037412.2
|
FYVE, RhoGEF and PH domain-containing protein 1 |
| chr8_-_68312909 | 0.97 |
ENSRNOT00000066106
|
RGD1309779
|
similar to ENSANGP00000021391 |
| chr7_+_28412198 | 0.97 |
ENSRNOT00000081822
ENSRNOT00000038780 ENSRNOT00000005995 |
Igf1
|
insulin-like growth factor 1 |
| chr10_-_60772313 | 0.96 |
ENSRNOT00000050847
|
Olr1504
|
olfactory receptor 1504 |
| chr1_-_101514547 | 0.96 |
ENSRNOT00000079633
|
Ppp1r15a
|
protein phosphatase 1, regulatory subunit 15A |
| chr10_+_55924938 | 0.89 |
ENSRNOT00000087003
ENSRNOT00000057079 |
Trappc1
|
trafficking protein particle complex 1 |
| chr10_-_63240332 | 0.85 |
ENSRNOT00000005125
|
Blmh
|
bleomycin hydrolase |
| chr7_-_23948202 | 0.85 |
ENSRNOT00000044252
|
Ascl4
|
achaete-scute family bHLH transcription factor 4 |
| chr1_-_8885967 | 0.85 |
ENSRNOT00000016102
|
Gje1
|
gap junction protein, epsilon 1 |
| chr4_+_1625754 | 0.83 |
ENSRNOT00000075645
|
Olr1248
|
olfactory receptor 1248 |
| chr5_+_171297850 | 0.83 |
ENSRNOT00000034284
|
Lrrc47
|
leucine rich repeat containing 47 |
| chr1_-_170763377 | 0.82 |
ENSRNOT00000041335
|
Olr209
|
olfactory receptor 209 |
| chr5_+_59080765 | 0.80 |
ENSRNOT00000021888
ENSRNOT00000064419 |
Rgp1
|
RGP1 homolog, RAB6A GEF complex partner 1 |
| chr4_-_148048726 | 0.73 |
ENSRNOT00000042418
ENSRNOT00000056393 |
Tmcc1
|
transmembrane and coiled-coil domain family 1 |
| chr16_+_75122996 | 0.71 |
ENSRNOT00000018375
|
Defb15
|
defensin beta 15 |
| chr8_+_41336340 | 0.68 |
ENSRNOT00000072049
|
Olr1225
|
olfactory receptor 1225 |
| chr10_-_12509386 | 0.66 |
ENSRNOT00000072476
|
Olr1369
|
olfactory receptor 1369 |
| chr1_+_168844875 | 0.65 |
ENSRNOT00000051398
|
AC107531.1
|
|
| chr13_+_92504374 | 0.64 |
ENSRNOT00000033697
|
Olr1602
|
olfactory receptor 1602 |
| chrX_+_22302485 | 0.63 |
ENSRNOT00000082902
|
Kdm5c
|
lysine demethylase 5C |
| chr1_+_169562247 | 0.61 |
ENSRNOT00000023124
|
Olr153
|
olfactory receptor 153 |
| chr7_-_3499697 | 0.58 |
ENSRNOT00000064311
|
Olr878
|
olfactory receptor 878 |
| chr3_-_20853708 | 0.57 |
ENSRNOT00000010360
|
Olr411
|
olfactory receptor 411 |
| chr1_-_168994253 | 0.57 |
ENSRNOT00000039946
|
Hbg1
|
hemoglobin subunit gamma 1 |
| chr1_+_64486251 | 0.55 |
ENSRNOT00000091497
|
LOC103689958
|
olfactory receptor 49-like |
| chr3_-_10144388 | 0.54 |
ENSRNOT00000042495
|
Abl1
|
ABL proto-oncogene 1, non-receptor tyrosine kinase |
| chr1_+_164225934 | 0.50 |
ENSRNOT00000034389
|
Map6
|
microtubule-associated protein 6 |
| chr20_+_3230052 | 0.50 |
ENSRNOT00000078454
|
RT1-T24-3
|
RT1 class I, locus T24, gene 3 |
| chr1_+_169552487 | 0.48 |
ENSRNOT00000023119
|
Olr152
|
olfactory receptor 152 |
| chr5_-_57947183 | 0.43 |
ENSRNOT00000060642
|
Fam219a
|
family with sequence similarity 219, member A |
| chr4_+_1671269 | 0.39 |
ENSRNOT00000071452
|
Olr1251
|
olfactory receptor 1251 |
| chr3_-_110249627 | 0.37 |
ENSRNOT00000009866
|
Srp14
|
signal recognition particle 14 |
| chr8_+_42347811 | 0.32 |
ENSRNOT00000073897
|
LOC100912186
|
olfactory receptor 8B3-like |
| chr7_-_106465830 | 0.30 |
ENSRNOT00000044610
|
AABR07058253.1
|
|
| chr11_+_43687107 | 0.29 |
ENSRNOT00000048343
|
Olr1558
|
olfactory receptor 1558 |
| chr1_+_99486253 | 0.28 |
ENSRNOT00000074820
|
LOC102546648
|
uncharacterized LOC102546648 |
| chr6_-_114488880 | 0.27 |
ENSRNOT00000087560
|
AC118957.1
|
|
| chr4_-_56656980 | 0.27 |
ENSRNOT00000009278
|
Opn1sw
|
opsin 1 (cone pigments), short-wave-sensitive |
| chr3_+_73344447 | 0.25 |
ENSRNOT00000045693
|
Olr471
|
olfactory receptor 471 |
| chr2_-_187742747 | 0.19 |
ENSRNOT00000026530
|
Bglap
|
bone gamma-carboxyglutamate protein |
| chr1_+_192025710 | 0.18 |
ENSRNOT00000077457
|
Ubfd1
|
ubiquitin family domain containing 1 |
| chr20_-_3822754 | 0.16 |
ENSRNOT00000000541
ENSRNOT00000077357 |
Slc39a7
|
solute carrier family 39 member 7 |
| chr8_+_41394884 | 0.16 |
ENSRNOT00000071019
|
LOC100910939
|
olfactory receptor 143-like |
| chr6_+_73345392 | 0.14 |
ENSRNOT00000088378
|
Arhgap5
|
Rho GTPase activating protein 5 |
| chr1_+_167748100 | 0.14 |
ENSRNOT00000024961
|
Olr45
|
olfactory receptor 45 |
| chr14_-_81426496 | 0.12 |
ENSRNOT00000018073
|
Add1
|
adducin 1 |
| chr5_+_136014017 | 0.11 |
ENSRNOT00000025346
|
Best4
|
bestrophin 4 |
| chr10_-_12386222 | 0.10 |
ENSRNOT00000060994
|
Olr1364
|
olfactory receptor 1364 |
| chr4_+_184019087 | 0.09 |
ENSRNOT00000055435
|
Bicd1
|
BICD cargo adaptor 1 |
| chr6_-_7421456 | 0.04 |
ENSRNOT00000006725
|
Zfp36l2
|
zinc finger protein 36, C3H type-like 2 |
| chr5_-_117612123 | 0.03 |
ENSRNOT00000065112
|
Dock7
|
dedicator of cytokinesis 7 |
Network of associatons between targets according to the STRING database.

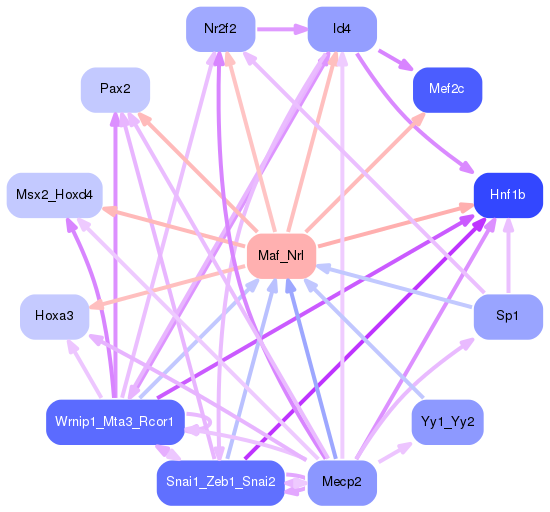
First level regulatory network of Maf_Nrl
Gene Ontology Analysis
Gene overrepresentation in biological process category:
| Log-likelihood per target | Total log-likelihood | Term | Description |
|---|---|---|---|
| 6.4 | 19.3 | GO:1990091 | sodium-dependent self proteolysis(GO:1990091) |
| 4.5 | 18.0 | GO:0046351 | disaccharide biosynthetic process(GO:0046351) |
| 4.5 | 22.5 | GO:2000173 | insulin processing(GO:0030070) negative regulation of branching morphogenesis of a nerve(GO:2000173) |
| 4.2 | 46.4 | GO:0030049 | muscle filament sliding(GO:0030049) |
| 4.2 | 12.5 | GO:0048014 | Tie signaling pathway(GO:0048014) |
| 4.1 | 12.4 | GO:0035566 | regulation of metanephros size(GO:0035566) |
| 3.5 | 17.6 | GO:0035106 | operant conditioning(GO:0035106) |
| 3.4 | 10.3 | GO:1901146 | mesonephros morphogenesis(GO:0061206) mesonephric nephron development(GO:0061215) mesonephric nephron morphogenesis(GO:0061228) mesenchymal stem cell maintenance involved in mesonephric nephron morphogenesis(GO:0061235) regulation of mesenchymal cell apoptotic process involved in mesonephric nephron morphogenesis(GO:0061295) negative regulation of mesenchymal cell apoptotic process involved in mesonephric nephron morphogenesis(GO:0061296) mesenchymal cell apoptotic process involved in mesonephric nephron morphogenesis(GO:1901146) |
| 3.3 | 19.6 | GO:0002072 | optic cup morphogenesis involved in camera-type eye development(GO:0002072) |
| 3.2 | 15.9 | GO:0007207 | adenylate cyclase-inhibiting G-protein coupled acetylcholine receptor signaling pathway(GO:0007197) phospholipase C-activating G-protein coupled acetylcholine receptor signaling pathway(GO:0007207) |
| 2.7 | 19.0 | GO:0061303 | cornea development in camera-type eye(GO:0061303) |
| 2.4 | 17.0 | GO:0060075 | regulation of resting membrane potential(GO:0060075) |
| 2.3 | 7.0 | GO:0035880 | embryonic nail plate morphogenesis(GO:0035880) positive regulation of mesenchymal cell apoptotic process(GO:2001055) |
| 2.3 | 11.5 | GO:0060298 | positive regulation of sarcomere organization(GO:0060298) |
| 2.2 | 9.0 | GO:1903225 | negative regulation of endodermal cell differentiation(GO:1903225) |
| 2.2 | 11.2 | GO:0021914 | negative regulation of smoothened signaling pathway involved in ventral spinal cord patterning(GO:0021914) |
| 2.1 | 8.3 | GO:0046379 | extracellular polysaccharide biosynthetic process(GO:0045226) extracellular polysaccharide metabolic process(GO:0046379) regulation of monocyte aggregation(GO:1900623) positive regulation of monocyte aggregation(GO:1900625) |
| 2.0 | 5.9 | GO:2000729 | positive regulation of mesenchymal cell proliferation involved in ureter development(GO:2000729) |
| 1.9 | 13.3 | GO:0006686 | sphingomyelin biosynthetic process(GO:0006686) |
| 1.9 | 9.3 | GO:2000065 | negative regulation of aldosterone metabolic process(GO:0032345) negative regulation of aldosterone biosynthetic process(GO:0032348) negative regulation of cortisol biosynthetic process(GO:2000065) |
| 1.7 | 5.2 | GO:0043553 | negative regulation of phosphatidylinositol 3-kinase activity(GO:0043553) |
| 1.7 | 3.4 | GO:0002086 | diaphragm contraction(GO:0002086) |
| 1.7 | 13.8 | GO:0019388 | galactose catabolic process(GO:0019388) |
| 1.7 | 6.6 | GO:2001013 | positive regulation of macrophage apoptotic process(GO:2000111) epithelial cell proliferation involved in renal tubule morphogenesis(GO:2001013) |
| 1.5 | 9.2 | GO:0010701 | positive regulation of norepinephrine secretion(GO:0010701) |
| 1.5 | 10.3 | GO:0035166 | post-embryonic hemopoiesis(GO:0035166) |
| 1.4 | 2.9 | GO:0060838 | lymphatic endothelial cell fate commitment(GO:0060838) regulation of transcription involved in lymphatic endothelial cell fate commitment(GO:0060849) |
| 1.2 | 4.9 | GO:0021615 | glossopharyngeal nerve morphogenesis(GO:0021615) |
| 1.2 | 7.3 | GO:0090383 | phagosome acidification(GO:0090383) |
| 1.2 | 4.6 | GO:0061107 | seminal vesicle development(GO:0061107) |
| 1.1 | 2.3 | GO:0003221 | right ventricular cardiac muscle tissue morphogenesis(GO:0003221) |
| 1.1 | 9.0 | GO:0033133 | positive regulation of glucokinase activity(GO:0033133) |
| 1.0 | 5.2 | GO:0035617 | stress granule disassembly(GO:0035617) |
| 1.0 | 8.8 | GO:0048208 | vesicle targeting, rough ER to cis-Golgi(GO:0048207) COPII vesicle coating(GO:0048208) |
| 1.0 | 3.9 | GO:0038128 | ERBB2 signaling pathway(GO:0038128) |
| 1.0 | 8.7 | GO:0035542 | regulation of SNARE complex assembly(GO:0035542) |
| 1.0 | 3.8 | GO:0042531 | negative regulation of interleukin-13 production(GO:0032696) regulation of tyrosine phosphorylation of STAT protein(GO:0042509) positive regulation of tyrosine phosphorylation of STAT protein(GO:0042531) |
| 1.0 | 2.9 | GO:0035483 | gastric emptying(GO:0035483) |
| 1.0 | 16.2 | GO:0000185 | activation of MAPKKK activity(GO:0000185) |
| 0.9 | 8.3 | GO:0051414 | response to cortisol(GO:0051414) |
| 0.9 | 2.7 | GO:1902310 | regulation of endoplasmic reticulum stress-induced eIF2 alpha phosphorylation(GO:0060734) response to methyl methanesulfonate(GO:0072702) cellular response to methyl methanesulfonate(GO:0072703) response to environmental enrichment(GO:0090648) positive regulation of peptidyl-serine dephosphorylation(GO:1902310) |
| 0.8 | 8.4 | GO:0035021 | negative regulation of Rac protein signal transduction(GO:0035021) |
| 0.8 | 4.1 | GO:0019243 | methylglyoxal catabolic process to D-lactate via S-lactoyl-glutathione(GO:0019243) methylglyoxal catabolic process(GO:0051596) methylglyoxal catabolic process to lactate(GO:0061727) |
| 0.8 | 7.4 | GO:0051890 | regulation of cardioblast differentiation(GO:0051890) |
| 0.8 | 10.4 | GO:0007342 | fusion of sperm to egg plasma membrane(GO:0007342) |
| 0.8 | 2.4 | GO:0072240 | DCT cell differentiation(GO:0072069) metanephric DCT cell differentiation(GO:0072240) |
| 0.8 | 117.1 | GO:0060048 | cardiac muscle contraction(GO:0060048) |
| 0.7 | 2.2 | GO:0050904 | diapedesis(GO:0050904) |
| 0.7 | 13.2 | GO:0070166 | enamel mineralization(GO:0070166) |
| 0.6 | 7.9 | GO:0090129 | positive regulation of synapse maturation(GO:0090129) |
| 0.5 | 2.1 | GO:0045200 | establishment or maintenance of neuroblast polarity(GO:0045196) establishment of neuroblast polarity(GO:0045200) |
| 0.5 | 3.1 | GO:0048496 | maintenance of organ identity(GO:0048496) |
| 0.5 | 2.1 | GO:0051684 | maintenance of Golgi location(GO:0051684) |
| 0.5 | 8.6 | GO:0090136 | epithelial cell-cell adhesion(GO:0090136) |
| 0.5 | 11.2 | GO:0001829 | trophectodermal cell differentiation(GO:0001829) |
| 0.5 | 1.4 | GO:0071335 | hair follicle cell proliferation(GO:0071335) regulation of hair follicle cell proliferation(GO:0071336) positive regulation of progesterone secretion(GO:2000872) |
| 0.5 | 1.8 | GO:0060139 | induction of programmed cell death(GO:0012502) positive regulation of apoptotic process in other organism(GO:0044533) positive regulation by symbiont of host programmed cell death(GO:0052042) positive regulation by symbiont of host apoptotic process(GO:0052151) positive regulation by organism of programmed cell death in other organism involved in symbiotic interaction(GO:0052330) positive regulation by organism of apoptotic process in other organism involved in symbiotic interaction(GO:0052501) positive regulation of apoptotic process by virus(GO:0060139) apoptotic process involved in embryonic digit morphogenesis(GO:1902263) |
| 0.4 | 2.4 | GO:1990928 | response to amino acid starvation(GO:1990928) |
| 0.4 | 4.7 | GO:0060484 | lung-associated mesenchyme development(GO:0060484) |
| 0.4 | 17.9 | GO:0015804 | neutral amino acid transport(GO:0015804) |
| 0.4 | 4.7 | GO:0032534 | regulation of microvillus assembly(GO:0032534) |
| 0.4 | 1.1 | GO:0030327 | prenylated protein catabolic process(GO:0030327) |
| 0.4 | 2.6 | GO:1902172 | keratinocyte apoptotic process(GO:0097283) regulation of keratinocyte apoptotic process(GO:1902172) |
| 0.4 | 9.9 | GO:0042036 | negative regulation of cytokine biosynthetic process(GO:0042036) |
| 0.3 | 1.0 | GO:1904192 | trophectodermal cell proliferation(GO:0001834) cholangiocyte apoptotic process(GO:1902488) regulation of cholangiocyte apoptotic process(GO:1904192) negative regulation of cholangiocyte apoptotic process(GO:1904193) |
| 0.3 | 3.8 | GO:0002024 | diet induced thermogenesis(GO:0002024) |
| 0.3 | 3.4 | GO:1900244 | positive regulation of synaptic vesicle endocytosis(GO:1900244) |
| 0.3 | 5.6 | GO:0031581 | hemidesmosome assembly(GO:0031581) |
| 0.3 | 7.1 | GO:0046856 | phosphatidylinositol dephosphorylation(GO:0046856) |
| 0.3 | 1.0 | GO:0097116 | gephyrin clustering involved in postsynaptic density assembly(GO:0097116) |
| 0.3 | 2.0 | GO:0097211 | response to gonadotropin-releasing hormone(GO:0097210) cellular response to gonadotropin-releasing hormone(GO:0097211) |
| 0.2 | 2.4 | GO:0090331 | negative regulation of platelet aggregation(GO:0090331) |
| 0.2 | 0.5 | GO:0002333 | transitional stage B cell differentiation(GO:0002332) transitional one stage B cell differentiation(GO:0002333) positive regulation of actin filament binding(GO:1904531) positive regulation of actin binding(GO:1904618) activation of protein kinase C activity(GO:1990051) |
| 0.2 | 0.9 | GO:0043418 | homocysteine catabolic process(GO:0043418) |
| 0.2 | 7.1 | GO:0018149 | peptide cross-linking(GO:0018149) |
| 0.2 | 3.3 | GO:0006027 | glycosaminoglycan catabolic process(GO:0006027) |
| 0.1 | 5.3 | GO:0030728 | ovulation(GO:0030728) |
| 0.1 | 1.1 | GO:1990034 | calcium ion export from cell(GO:1990034) |
| 0.1 | 9.9 | GO:0000186 | activation of MAPKK activity(GO:0000186) |
| 0.1 | 4.3 | GO:0006506 | GPI anchor biosynthetic process(GO:0006506) |
| 0.1 | 1.1 | GO:0006957 | complement activation, alternative pathway(GO:0006957) |
| 0.1 | 1.1 | GO:0035845 | photoreceptor cell outer segment organization(GO:0035845) |
| 0.1 | 1.7 | GO:0090005 | negative regulation of establishment of protein localization to plasma membrane(GO:0090005) |
| 0.1 | 0.1 | GO:1900275 | negative regulation of phospholipase C activity(GO:1900275) |
| 0.1 | 2.3 | GO:0070979 | protein K11-linked ubiquitination(GO:0070979) |
| 0.1 | 2.0 | GO:0045475 | locomotor rhythm(GO:0045475) |
| 0.1 | 1.0 | GO:0051457 | maintenance of protein location in nucleus(GO:0051457) |
| 0.1 | 6.1 | GO:0035335 | peptidyl-tyrosine dephosphorylation(GO:0035335) |
| 0.0 | 0.6 | GO:0034720 | histone H3-K4 demethylation(GO:0034720) |
| 0.0 | 0.4 | GO:0006614 | SRP-dependent cotranslational protein targeting to membrane(GO:0006614) |
| 0.0 | 0.3 | GO:0018298 | protein-chromophore linkage(GO:0018298) |
| 0.0 | 0.2 | GO:0032571 | response to vitamin K(GO:0032571) |
| 0.0 | 2.3 | GO:0030901 | midbrain development(GO:0030901) |
| 0.0 | 0.1 | GO:1901552 | positive regulation of endothelial cell development(GO:1901552) positive regulation of establishment of endothelial barrier(GO:1903142) |
| 0.0 | 2.6 | GO:0006936 | muscle contraction(GO:0006936) |
| 0.0 | 19.5 | GO:0050911 | detection of chemical stimulus involved in sensory perception of smell(GO:0050911) |
| 0.0 | 3.9 | GO:0016485 | protein processing(GO:0016485) |
| 0.0 | 0.9 | GO:0006888 | ER to Golgi vesicle-mediated transport(GO:0006888) |
| 0.0 | 1.5 | GO:0007030 | Golgi organization(GO:0007030) |
| 0.0 | 0.8 | GO:0042147 | retrograde transport, endosome to Golgi(GO:0042147) |
Gene overrepresentation in cellular component category:
| Log-likelihood per target | Total log-likelihood | Term | Description |
|---|---|---|---|
| 3.5 | 10.4 | GO:0034667 | integrin alpha3-beta1 complex(GO:0034667) |
| 3.1 | 46.4 | GO:0032982 | myosin filament(GO:0032982) |
| 2.6 | 15.9 | GO:0032280 | symmetric synapse(GO:0032280) |
| 2.5 | 9.9 | GO:0005588 | collagen type V trimer(GO:0005588) |
| 2.2 | 120.3 | GO:0016459 | myosin complex(GO:0016459) |
| 2.2 | 52.5 | GO:0016327 | apicolateral plasma membrane(GO:0016327) |
| 1.5 | 13.3 | GO:0000138 | Golgi trans cisterna(GO:0000138) |
| 1.4 | 8.6 | GO:1990357 | terminal web(GO:1990357) |
| 1.4 | 22.5 | GO:0031045 | dense core granule(GO:0031045) |
| 1.0 | 3.1 | GO:0097543 | ciliary inversin compartment(GO:0097543) |
| 0.8 | 5.9 | GO:0090571 | RNA polymerase II transcription repressor complex(GO:0090571) |
| 0.8 | 13.8 | GO:0016010 | dystrophin-associated glycoprotein complex(GO:0016010) glycoprotein complex(GO:0090665) |
| 0.5 | 3.5 | GO:0005862 | muscle thin filament tropomyosin(GO:0005862) |
| 0.5 | 4.3 | GO:0000506 | glycosylphosphatidylinositol-N-acetylglucosaminyltransferase (GPI-GnT) complex(GO:0000506) |
| 0.4 | 8.8 | GO:0070971 | endoplasmic reticulum exit site(GO:0070971) |
| 0.4 | 12.4 | GO:0034451 | centriolar satellite(GO:0034451) |
| 0.4 | 33.0 | GO:0031526 | brush border membrane(GO:0031526) |
| 0.3 | 5.2 | GO:0035253 | ciliary rootlet(GO:0035253) |
| 0.3 | 12.6 | GO:0032809 | neuronal cell body membrane(GO:0032809) |
| 0.3 | 2.4 | GO:0005850 | eukaryotic translation initiation factor 2 complex(GO:0005850) |
| 0.3 | 7.9 | GO:0097440 | apical dendrite(GO:0097440) |
| 0.3 | 5.6 | GO:0030056 | hemidesmosome(GO:0030056) |
| 0.3 | 37.3 | GO:0030018 | Z disc(GO:0030018) |
| 0.3 | 1.8 | GO:0097136 | Bcl-2 family protein complex(GO:0097136) |
| 0.3 | 7.1 | GO:0001533 | cornified envelope(GO:0001533) |
| 0.2 | 1.0 | GO:0035867 | alphav-beta3 integrin-IGF-1-IGF1R complex(GO:0035867) |
| 0.2 | 2.7 | GO:0000164 | protein phosphatase type 1 complex(GO:0000164) |
| 0.2 | 1.1 | GO:0005579 | membrane attack complex(GO:0005579) |
| 0.1 | 11.7 | GO:0005902 | microvillus(GO:0005902) |
| 0.1 | 14.7 | GO:0005604 | basement membrane(GO:0005604) |
| 0.1 | 3.8 | GO:0032420 | stereocilium(GO:0032420) |
| 0.1 | 7.1 | GO:0031902 | late endosome membrane(GO:0031902) |
| 0.1 | 1.1 | GO:0017071 | intracellular cyclic nucleotide activated cation channel complex(GO:0017071) |
| 0.1 | 7.3 | GO:0045335 | phagocytic vesicle(GO:0045335) |
| 0.1 | 0.6 | GO:0005833 | hemoglobin complex(GO:0005833) |
| 0.1 | 0.9 | GO:0030008 | TRAPP complex(GO:0030008) |
| 0.1 | 28.6 | GO:0016607 | nuclear speck(GO:0016607) |
| 0.1 | 17.4 | GO:0005578 | proteinaceous extracellular matrix(GO:0005578) |
| 0.1 | 2.1 | GO:0008180 | COP9 signalosome(GO:0008180) |
| 0.1 | 7.4 | GO:0030176 | integral component of endoplasmic reticulum membrane(GO:0030176) |
| 0.1 | 0.8 | GO:0032045 | guanyl-nucleotide exchange factor complex(GO:0032045) |
| 0.1 | 0.4 | GO:0048500 | signal recognition particle, endoplasmic reticulum targeting(GO:0005786) signal recognition particle(GO:0048500) |
| 0.0 | 8.3 | GO:0031012 | extracellular matrix(GO:0031012) |
| 0.0 | 9.0 | GO:0061695 | transferase complex, transferring phosphorus-containing groups(GO:0061695) |
| 0.0 | 2.4 | GO:0099501 | synaptic vesicle membrane(GO:0030672) exocytic vesicle membrane(GO:0099501) |
| 0.0 | 0.1 | GO:0033648 | host intracellular organelle(GO:0033647) host intracellular membrane-bounded organelle(GO:0033648) |
| 0.0 | 20.9 | GO:0005615 | extracellular space(GO:0005615) |
| 0.0 | 1.8 | GO:0031234 | extrinsic component of cytoplasmic side of plasma membrane(GO:0031234) |
| 0.0 | 0.1 | GO:0008290 | F-actin capping protein complex(GO:0008290) |
| 0.0 | 1.5 | GO:0005802 | trans-Golgi network(GO:0005802) |
Gene overrepresentation in molecular function category:
| Log-likelihood per target | Total log-likelihood | Term | Description |
|---|---|---|---|
| 12.4 | 37.2 | GO:0018479 | benzaldehyde dehydrogenase (NAD+) activity(GO:0018479) |
| 5.3 | 15.9 | GO:1990763 | arrestin family protein binding(GO:1990763) |
| 3.4 | 17.0 | GO:0022841 | potassium ion leak channel activity(GO:0022841) |
| 3.3 | 13.2 | GO:0030345 | extracellular matrix structural constituent conferring compression resistance(GO:0030021) structural constituent of tooth enamel(GO:0030345) |
| 2.9 | 11.5 | GO:0004687 | myosin light chain kinase activity(GO:0004687) |
| 2.8 | 13.8 | GO:0004614 | phosphoglucomutase activity(GO:0004614) |
| 2.7 | 13.3 | GO:0033188 | sphingomyelin synthase activity(GO:0033188) ceramide cholinephosphotransferase activity(GO:0047493) |
| 2.2 | 8.7 | GO:0008241 | peptidyl-dipeptidase activity(GO:0008241) |
| 2.1 | 46.4 | GO:0000146 | microfilament motor activity(GO:0000146) |
| 1.7 | 3.4 | GO:0031711 | bradykinin receptor binding(GO:0031711) |
| 1.7 | 8.3 | GO:0050501 | hyaluronan synthase activity(GO:0050501) |
| 1.6 | 22.5 | GO:0042043 | neurexin family protein binding(GO:0042043) |
| 1.6 | 11.2 | GO:0045545 | syndecan binding(GO:0045545) |
| 1.5 | 27.0 | GO:0050308 | sugar-phosphatase activity(GO:0050308) |
| 1.5 | 10.3 | GO:0015119 | hexose phosphate transmembrane transporter activity(GO:0015119) organophosphate:inorganic phosphate antiporter activity(GO:0015315) hexose-phosphate:inorganic phosphate antiporter activity(GO:0015526) glucose 6-phosphate:inorganic phosphate antiporter activity(GO:0061513) |
| 1.4 | 7.1 | GO:0034597 | phosphatidylinositol-4,5-bisphosphate 4-phosphatase activity(GO:0034597) |
| 1.4 | 19.3 | GO:0031432 | titin binding(GO:0031432) |
| 1.4 | 12.4 | GO:0016175 | superoxide-generating NADPH oxidase activity(GO:0016175) |
| 1.2 | 4.7 | GO:0071936 | coreceptor activity involved in Wnt signaling pathway(GO:0071936) |
| 0.8 | 4.1 | GO:0004416 | hydroxyacylglutathione hydrolase activity(GO:0004416) |
| 0.7 | 17.9 | GO:0005328 | neurotransmitter:sodium symporter activity(GO:0005328) |
| 0.7 | 6.6 | GO:0003680 | AT DNA binding(GO:0003680) |
| 0.7 | 8.6 | GO:0045294 | alpha-catenin binding(GO:0045294) |
| 0.6 | 1.7 | GO:0032427 | GBD domain binding(GO:0032427) |
| 0.6 | 15.6 | GO:0005540 | hyaluronic acid binding(GO:0005540) |
| 0.5 | 9.2 | GO:0015271 | outward rectifier potassium channel activity(GO:0015271) |
| 0.4 | 9.9 | GO:0004709 | MAP kinase kinase kinase activity(GO:0004709) |
| 0.4 | 8.3 | GO:0005520 | insulin-like growth factor binding(GO:0005520) |
| 0.3 | 8.8 | GO:0005086 | ARF guanyl-nucleotide exchange factor activity(GO:0005086) |
| 0.3 | 7.3 | GO:0071837 | HMG box domain binding(GO:0071837) |
| 0.3 | 2.5 | GO:0004716 | receptor signaling protein tyrosine kinase activity(GO:0004716) |
| 0.3 | 10.4 | GO:0001968 | fibronectin binding(GO:0001968) |
| 0.3 | 8.4 | GO:0005501 | retinoid binding(GO:0005501) |
| 0.2 | 9.9 | GO:0005201 | extracellular matrix structural constituent(GO:0005201) |
| 0.2 | 9.1 | GO:0008307 | structural constituent of muscle(GO:0008307) |
| 0.2 | 4.8 | GO:0008157 | protein phosphatase 1 binding(GO:0008157) |
| 0.2 | 7.9 | GO:0045182 | translation regulator activity(GO:0045182) |
| 0.2 | 5.9 | GO:0001106 | RNA polymerase II transcription corepressor activity(GO:0001106) |
| 0.2 | 1.1 | GO:0016670 | oxidoreductase activity, acting on a sulfur group of donors, oxygen as acceptor(GO:0016670) |
| 0.2 | 8.7 | GO:0001786 | phosphatidylserine binding(GO:0001786) |
| 0.2 | 1.1 | GO:0005432 | calcium:sodium antiporter activity(GO:0005432) |
| 0.1 | 1.0 | GO:0097109 | neuroligin family protein binding(GO:0097109) |
| 0.1 | 3.7 | GO:0004181 | metallocarboxypeptidase activity(GO:0004181) |
| 0.1 | 2.0 | GO:0016500 | protein-hormone receptor activity(GO:0016500) |
| 0.1 | 4.8 | GO:1990841 | promoter-specific chromatin binding(GO:1990841) |
| 0.1 | 0.8 | GO:0004826 | phenylalanine-tRNA ligase activity(GO:0004826) |
| 0.1 | 6.7 | GO:0008138 | protein tyrosine/serine/threonine phosphatase activity(GO:0008138) |
| 0.1 | 6.9 | GO:0030971 | receptor tyrosine kinase binding(GO:0030971) |
| 0.1 | 15.4 | GO:0047485 | protein N-terminus binding(GO:0047485) |
| 0.1 | 5.2 | GO:0043548 | phosphatidylinositol 3-kinase binding(GO:0043548) |
| 0.1 | 78.2 | GO:0005509 | calcium ion binding(GO:0005509) |
| 0.1 | 1.1 | GO:0005222 | intracellular cAMP activated cation channel activity(GO:0005222) |
| 0.1 | 5.1 | GO:0016712 | oxidoreductase activity, acting on paired donors, with incorporation or reduction of molecular oxygen, reduced flavin or flavoprotein as one donor, and incorporation of one atom of oxygen(GO:0016712) |
| 0.1 | 10.3 | GO:0003705 | transcription factor activity, RNA polymerase II distal enhancer sequence-specific binding(GO:0003705) |
| 0.1 | 0.4 | GO:0030942 | endoplasmic reticulum signal peptide binding(GO:0030942) |
| 0.1 | 1.9 | GO:0070840 | dynein complex binding(GO:0070840) |
| 0.1 | 2.3 | GO:0061631 | ubiquitin conjugating enzyme activity(GO:0061631) |
| 0.1 | 1.0 | GO:0005159 | insulin-like growth factor receptor binding(GO:0005159) |
| 0.1 | 0.5 | GO:0070097 | delta-catenin binding(GO:0070097) |
| 0.1 | 8.2 | GO:0042626 | ATPase activity, coupled to transmembrane movement of substances(GO:0042626) |
| 0.1 | 3.9 | GO:0004725 | protein tyrosine phosphatase activity(GO:0004725) |
| 0.0 | 0.6 | GO:0032453 | histone demethylase activity (H3-K4 specific)(GO:0032453) |
| 0.0 | 2.1 | GO:0048365 | Rac GTPase binding(GO:0048365) |
| 0.0 | 2.4 | GO:0043022 | ribosome binding(GO:0043022) |
| 0.0 | 0.3 | GO:0009881 | photoreceptor activity(GO:0009881) |
| 0.0 | 2.6 | GO:0004869 | cysteine-type endopeptidase inhibitor activity(GO:0004869) |
| 0.0 | 28.4 | GO:0005198 | structural molecule activity(GO:0005198) |
| 0.0 | 10.5 | GO:0005096 | GTPase activator activity(GO:0005096) |
| 0.0 | 1.7 | GO:0017112 | Rab guanyl-nucleotide exchange factor activity(GO:0017112) |
| 0.0 | 4.1 | GO:0001085 | RNA polymerase II transcription factor binding(GO:0001085) |
| 0.0 | 6.5 | GO:0003924 | GTPase activity(GO:0003924) |
| 0.0 | 2.4 | GO:0004222 | metalloendopeptidase activity(GO:0004222) |
| 0.0 | 4.0 | GO:0016791 | phosphatase activity(GO:0016791) |
| 0.0 | 3.8 | GO:0005125 | cytokine activity(GO:0005125) |
| 0.0 | 4.4 | GO:0061630 | ubiquitin protein ligase activity(GO:0061630) |
| 0.0 | 0.9 | GO:0004177 | aminopeptidase activity(GO:0004177) |
| 0.0 | 1.6 | GO:0004497 | monooxygenase activity(GO:0004497) |
| 0.0 | 19.5 | GO:0004984 | olfactory receptor activity(GO:0004984) |
| 0.0 | 0.5 | GO:0042605 | peptide antigen binding(GO:0042605) |
| 0.0 | 2.0 | GO:0001664 | G-protein coupled receptor binding(GO:0001664) |
Gene overrepresentation in curated gene sets: canonical pathways category:
| Log-likelihood per target | Total log-likelihood | Term | Description |
|---|---|---|---|
| 0.9 | 28.3 | PID INSULIN GLUCOSE PATHWAY | Insulin-mediated glucose transport |
| 0.7 | 40.8 | PID ARF6 TRAFFICKING PATHWAY | Arf6 trafficking events |
| 0.5 | 16.2 | PID P38 MKK3 6PATHWAY | p38 MAPK signaling pathway |
| 0.5 | 20.4 | NABA PROTEOGLYCANS | Genes encoding proteoglycans |
| 0.3 | 13.9 | PID BMP PATHWAY | BMP receptor signaling |
| 0.3 | 9.3 | ST WNT BETA CATENIN PATHWAY | Wnt/beta-catenin Pathway |
| 0.3 | 13.3 | PID IL2 PI3K PATHWAY | IL2 signaling events mediated by PI3K |
| 0.3 | 12.5 | PID ANGIOPOIETIN RECEPTOR PATHWAY | Angiopoietin receptor Tie2-mediated signaling |
| 0.3 | 19.4 | PID AVB3 INTEGRIN PATHWAY | Integrins in angiogenesis |
| 0.2 | 10.3 | PID HNF3B PATHWAY | FOXA2 and FOXA3 transcription factor networks |
| 0.2 | 6.6 | PID HDAC CLASSII PATHWAY | Signaling events mediated by HDAC Class II |
| 0.2 | 9.9 | PID NFAT TFPATHWAY | Calcineurin-regulated NFAT-dependent transcription in lymphocytes |
| 0.2 | 1.8 | SA PROGRAMMED CELL DEATH | Programmed cell death, or apoptosis, eliminates damaged or unneeded cells. |
| 0.1 | 23.6 | NABA ECM GLYCOPROTEINS | Genes encoding structural ECM glycoproteins |
| 0.1 | 2.1 | PID WNT NONCANONICAL PATHWAY | Noncanonical Wnt signaling pathway |
| 0.1 | 2.9 | PID HNF3A PATHWAY | FOXA1 transcription factor network |
| 0.1 | 2.4 | PID CERAMIDE PATHWAY | Ceramide signaling pathway |
| 0.1 | 2.2 | PID PTP1B PATHWAY | Signaling events mediated by PTP1B |
| 0.0 | 1.4 | PID DELTA NP63 PATHWAY | Validated transcriptional targets of deltaNp63 isoforms |
| 0.0 | 5.2 | NABA SECRETED FACTORS | Genes encoding secreted soluble factors |
| 0.0 | 0.5 | PID TAP63 PATHWAY | Validated transcriptional targets of TAp63 isoforms |
Gene overrepresentation in curated gene sets: REACTOME pathways category:
| Log-likelihood per target | Total log-likelihood | Term | Description |
|---|---|---|---|
| 4.3 | 167.0 | REACTOME STRIATED MUSCLE CONTRACTION | Genes involved in Striated Muscle Contraction |
| 2.4 | 19.6 | REACTOME ETHANOL OXIDATION | Genes involved in Ethanol oxidation |
| 1.4 | 19.0 | REACTOME KERATAN SULFATE DEGRADATION | Genes involved in Keratan sulfate degradation |
| 1.3 | 17.0 | REACTOME TANDEM PORE DOMAIN POTASSIUM CHANNELS | Genes involved in Tandem pore domain potassium channels |
| 1.3 | 41.3 | REACTOME TIGHT JUNCTION INTERACTIONS | Genes involved in Tight junction interactions |
| 0.8 | 21.7 | REACTOME INSULIN SYNTHESIS AND PROCESSING | Genes involved in Insulin Synthesis and Processing |
| 0.8 | 17.9 | REACTOME NA CL DEPENDENT NEUROTRANSMITTER TRANSPORTERS | Genes involved in Na+/Cl- dependent neurotransmitter transporters |
| 0.7 | 11.7 | REACTOME HYALURONAN METABOLISM | Genes involved in Hyaluronan metabolism |
| 0.7 | 27.0 | REACTOME GLUCONEOGENESIS | Genes involved in Gluconeogenesis |
| 0.6 | 12.5 | REACTOME TIE2 SIGNALING | Genes involved in Tie2 Signaling |
| 0.5 | 19.3 | REACTOME AMINE LIGAND BINDING RECEPTORS | Genes involved in Amine ligand-binding receptors |
| 0.4 | 8.2 | REACTOME ABCA TRANSPORTERS IN LIPID HOMEOSTASIS | Genes involved in ABCA transporters in lipid homeostasis |
| 0.4 | 8.6 | REACTOME SMOOTH MUSCLE CONTRACTION | Genes involved in Smooth Muscle Contraction |
| 0.4 | 13.3 | REACTOME SPHINGOLIPID DE NOVO BIOSYNTHESIS | Genes involved in Sphingolipid de novo biosynthesis |
| 0.4 | 10.4 | REACTOME BASIGIN INTERACTIONS | Genes involved in Basigin interactions |
| 0.3 | 10.3 | REACTOME REGULATION OF BETA CELL DEVELOPMENT | Genes involved in Regulation of beta-cell development |
| 0.3 | 6.6 | REACTOME ERK MAPK TARGETS | Genes involved in ERK/MAPK targets |
| 0.2 | 9.9 | REACTOME NCAM1 INTERACTIONS | Genes involved in NCAM1 interactions |
| 0.2 | 10.3 | REACTOME GLUCOSE TRANSPORT | Genes involved in Glucose transport |
| 0.2 | 5.8 | REACTOME CASPASE MEDIATED CLEAVAGE OF CYTOSKELETAL PROTEINS | Genes involved in Caspase-mediated cleavage of cytoskeletal proteins |
| 0.2 | 8.8 | REACTOME TRANSPORT TO THE GOLGI AND SUBSEQUENT MODIFICATION | Genes involved in Transport to the Golgi and subsequent modification |
| 0.2 | 9.2 | REACTOME REGULATION OF INSULIN SECRETION BY GLUCAGON LIKE PEPTIDE1 | Genes involved in Regulation of Insulin Secretion by Glucagon-like Peptide-1 |
| 0.2 | 5.2 | REACTOME KINESINS | Genes involved in Kinesins |
| 0.1 | 2.7 | REACTOME DOWNREGULATION OF TGF BETA RECEPTOR SIGNALING | Genes involved in Downregulation of TGF-beta receptor signaling |
| 0.1 | 7.6 | REACTOME TRANSCRIPTIONAL REGULATION OF WHITE ADIPOCYTE DIFFERENTIATION | Genes involved in Transcriptional Regulation of White Adipocyte Differentiation |
| 0.1 | 1.8 | REACTOME ACTIVATION OF BH3 ONLY PROTEINS | Genes involved in Activation of BH3-only proteins |
| 0.1 | 2.5 | REACTOME TRANSPORT OF VITAMINS NUCLEOSIDES AND RELATED MOLECULES | Genes involved in Transport of vitamins, nucleosides, and related molecules |
| 0.1 | 10.1 | REACTOME SIGNALING BY RHO GTPASES | Genes involved in Signaling by Rho GTPases |
| 0.0 | 1.1 | REACTOME PLATELET CALCIUM HOMEOSTASIS | Genes involved in Platelet calcium homeostasis |
| 0.0 | 0.3 | REACTOME OPSINS | Genes involved in Opsins |
| 0.0 | 1.1 | REACTOME COMPLEMENT CASCADE | Genes involved in Complement cascade |
| 0.0 | 0.5 | REACTOME MYOGENESIS | Genes involved in Myogenesis |
| 0.0 | 3.9 | REACTOME CLASS A1 RHODOPSIN LIKE RECEPTORS | Genes involved in Class A/1 (Rhodopsin-like receptors) |