Project
GSE53960: rat RNA-Seq transcriptomic Bodymap
Navigation
Downloads
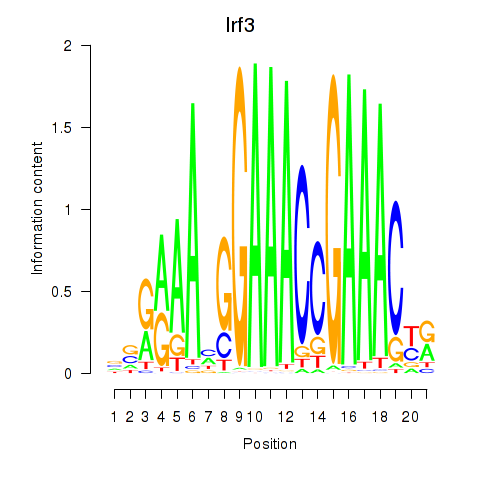
Results for Irf3
Z-value: 1.44
Motif logo
Transcription factors associated with Irf3
| Gene Symbol | Gene ID | Gene Info |
|---|---|---|
|
Irf3
|
ENSRNOG00000043388 | interferon regulatory factor 3 |
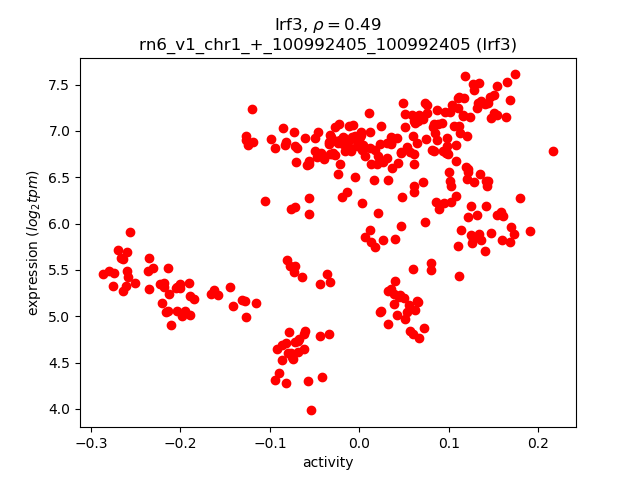
Activity-expression correlation:
| Gene | Promoter | Pearson corr. coef. | P-value | Plot |
|---|---|---|---|---|
| Irf3 | rn6_v1_chr1_+_100992405_100992405 | 0.49 | 1.5e-20 | Click! |
Activity profile of Irf3 motif
Sorted Z-values of Irf3 motif
| Promoter | Log-likelihood | Transcript | Gene | Gene Info |
|---|---|---|---|---|
| chr6_-_127337791 | 112.16 |
ENSRNOT00000032015
|
Ifi27l2b
|
interferon, alpha-inducible protein 27 like 2B |
| chr10_-_70744315 | 62.24 |
ENSRNOT00000014865
|
Ccl5
|
C-C motif chemokine ligand 5 |
| chr8_-_23146689 | 61.29 |
ENSRNOT00000092200
|
Acp5
|
acid phosphatase 5, tartrate resistant |
| chr20_+_3990820 | 59.75 |
ENSRNOT00000000528
|
Psmb8
|
proteasome subunit beta 8 |
| chr4_-_163890801 | 56.79 |
ENSRNOT00000081946
|
Ly49si1
|
immunoreceptor Ly49si1 |
| chr20_-_3978845 | 55.32 |
ENSRNOT00000000532
|
Psmb9
|
proteasome subunit beta 9 |
| chr12_+_41200718 | 55.30 |
ENSRNOT00000038426
ENSRNOT00000048450 ENSRNOT00000067176 |
Oas1a
|
2'-5' oligoadenylate synthetase 1A |
| chr11_-_37914983 | 52.89 |
ENSRNOT00000039876
|
Mx1
|
myxovirus (influenza virus) resistance 1 |
| chr20_-_4677034 | 52.13 |
ENSRNOT00000075244
|
Rn60_20_0047.3
|
|
| chr20_+_3979035 | 51.64 |
ENSRNOT00000000529
|
Tap1
|
transporter 1, ATP binding cassette subfamily B member |
| chr3_-_171286413 | 47.18 |
ENSRNOT00000008365
ENSRNOT00000081036 |
Zbp1
|
Z-DNA binding protein 1 |
| chr2_+_248249468 | 43.33 |
ENSRNOT00000022648
|
Gbp4
|
guanylate binding protein 4 |
| chr11_+_67757928 | 42.46 |
ENSRNOT00000039215
|
Dtx3l
|
deltex E3 ubiquitin ligase 3L |
| chr15_+_34256071 | 40.12 |
ENSRNOT00000025887
|
Psme1
|
proteasome activator subunit 1 |
| chr11_+_68105369 | 38.17 |
ENSRNOT00000046888
|
Parp14
|
poly (ADP-ribose) polymerase family, member 14 |
| chr6_-_127653124 | 36.22 |
ENSRNOT00000047324
|
Serpina11
|
serpin family A member 11 |
| chr18_-_25344614 | 36.19 |
ENSRNOT00000046369
|
Gypc
|
glycophorin C (Gerbich blood group) |
| chr15_+_31948035 | 34.78 |
ENSRNOT00000071627
|
AABR07017868.1
|
|
| chr16_-_19942343 | 31.71 |
ENSRNOT00000087162
ENSRNOT00000091906 |
Bst2
|
bone marrow stromal cell antigen 2 |
| chr10_-_15459897 | 31.67 |
ENSRNOT00000027518
|
Decr2
|
2,4-dienoyl-CoA reductase 2 |
| chr12_+_41155497 | 31.31 |
ENSRNOT00000041741
|
Oas1g
|
2'-5' oligoadenylate synthetase 1G |
| chr1_+_169433539 | 30.57 |
ENSRNOT00000055210
|
Trim34
|
tripartite motif-containing 34 |
| chr1_-_227505267 | 30.04 |
ENSRNOT00000028443
|
Ms4a7
|
membrane spanning 4-domains A7 |
| chr2_-_256915563 | 29.55 |
ENSRNOT00000084873
ENSRNOT00000029990 |
Ifi44
|
interferon-induced protein 44 |
| chr17_+_52755621 | 29.03 |
ENSRNOT00000089943
|
Psme1-ps1
|
proteasome (prosome, macropain) activator subunit 1 (PA28 alpha), pseudogene 1 |
| chr15_+_30270740 | 28.89 |
ENSRNOT00000070991
|
AABR07017707.1
|
|
| chr1_-_101131012 | 28.52 |
ENSRNOT00000082283
ENSRNOT00000093498 ENSRNOT00000093559 |
Flt3lg
Rpl13a
|
fms-related tyrosine kinase 3 ligand ribosomal protein L13A |
| chr15_-_34269851 | 27.76 |
ENSRNOT00000026279
|
Psme2
|
proteasome activator subunit 2 |
| chr10_+_89358376 | 27.43 |
ENSRNOT00000028067
|
Ifi35
|
interferon-induced protein 35 |
| chr1_-_167708685 | 26.78 |
ENSRNOT00000092857
ENSRNOT00000024992 |
Trim21
|
tripartite motif-containing 21 |
| chr1_-_214252456 | 26.28 |
ENSRNOT00000023504
|
Irf7
|
interferon regulatory factor 7 |
| chr3_-_48604097 | 25.86 |
ENSRNOT00000009620
|
Ifih1
|
interferon induced with helicase C domain 1 |
| chr10_-_34221928 | 23.86 |
ENSRNOT00000045545
|
Irgm
|
immunity-related GTPase M |
| chr1_-_101131413 | 23.48 |
ENSRNOT00000093729
|
Flt3lg
|
fms-related tyrosine kinase 3 ligand |
| chr5_-_173626248 | 22.55 |
ENSRNOT00000039263
|
Isg15
|
ISG15 ubiquitin-like modifier |
| chr18_+_55576239 | 22.45 |
ENSRNOT00000050063
|
LOC100910979
|
interferon-inducible GTPase 1-like |
| chr1_-_164101578 | 22.05 |
ENSRNOT00000022176
|
Uvrag
|
UV radiation resistance associated |
| chr13_+_71192142 | 21.80 |
ENSRNOT00000032157
|
Rnasel
|
ribonuclease L |
| chr12_+_42343123 | 21.67 |
ENSRNOT00000043279
|
Oas1i
|
2 ' -5 ' oligoadenylate synthetase 1I |
| chr10_-_88611105 | 21.10 |
ENSRNOT00000024718
|
Dhx58
|
DEXH-box helicase 58 |
| chr20_-_5476193 | 20.43 |
ENSRNOT00000044975
|
Tapbp
|
TAP binding protein |
| chr9_+_81968332 | 20.39 |
ENSRNOT00000023152
|
Cyp27a1
|
cytochrome P450, family 27, subfamily a, polypeptide 1 |
| chr3_+_114087287 | 19.34 |
ENSRNOT00000023017
|
B2m
|
beta-2 microglobulin |
| chr4_+_62380914 | 16.95 |
ENSRNOT00000029845
|
Tmem140
|
transmembrane protein 140 |
| chr4_+_67165883 | 16.91 |
ENSRNOT00000012280
|
Rab19
|
RAB19, member RAS oncogene family |
| chr7_-_118933812 | 16.83 |
ENSRNOT00000031951
|
Apol9a
|
apolipoprotein L 9a |
| chr7_-_28040510 | 16.31 |
ENSRNOT00000005674
|
Ascl1
|
achaete-scute family bHLH transcription factor 1 |
| chr7_+_2691369 | 15.85 |
ENSRNOT00000049536
|
Stat2
|
signal transducer and activator of transcription 2 |
| chr3_-_119405453 | 15.41 |
ENSRNOT00000090355
|
Sppl2a
|
signal peptide peptidase-like 2A |
| chr20_+_3269284 | 15.04 |
ENSRNOT00000089044
|
RT1-T24-1
|
RT1 class I, locus T24, gene 1 |
| chr4_-_66899914 | 14.69 |
ENSRNOT00000011481
|
Parp12
|
poly (ADP-ribose) polymerase family, member 12 |
| chr20_+_3242470 | 14.30 |
ENSRNOT00000078110
ENSRNOT00000041502 |
RT1-T24-2
RT1-T24-1
|
RT1 class I, locus T24, gene 2 RT1 class I, locus T24, gene 1 |
| chr8_-_63034226 | 13.67 |
ENSRNOT00000043434
|
Pml
|
promyelocytic leukemia |
| chr4_-_157743199 | 13.51 |
ENSRNOT00000038178
|
Tapbpl
|
TAP binding protein-like |
| chr2_+_240396152 | 13.21 |
ENSRNOT00000034565
|
Cenpe
|
centromere protein E |
| chr4_-_66062089 | 12.72 |
ENSRNOT00000018782
|
Zc3hav1
|
zinc finger CCCH-type containing, antiviral 1 |
| chr19_-_37912027 | 11.47 |
ENSRNOT00000026462
|
Psmb10
|
proteasome subunit beta 10 |
| chr10_+_108527740 | 10.88 |
ENSRNOT00000044983
|
Rnf213
|
ring finger protein 213 |
| chr2_+_1410934 | 10.80 |
ENSRNOT00000013625
ENSRNOT00000080222 |
Erap1
|
endoplasmic reticulum aminopeptidase 1 |
| chr3_-_140141679 | 10.44 |
ENSRNOT00000014632
|
Crnkl1
|
crooked neck pre-mRNA splicing factor 1 |
| chr16_+_75744786 | 10.20 |
ENSRNOT00000032368
|
Xkr5
|
XK related 5 |
| chr8_-_36374673 | 8.71 |
ENSRNOT00000013763
|
Dcps
|
decapping enzyme, scavenger |
| chr8_-_52828134 | 8.52 |
ENSRNOT00000007736
|
Rbm7
|
RNA binding motif protein 7 |
| chr7_+_11081536 | 8.30 |
ENSRNOT00000007110
|
Ncln
|
nicalin |
| chr3_-_119405300 | 7.84 |
ENSRNOT00000015568
|
Sppl2a
|
signal peptide peptidase-like 2A |
| chr3_-_163814799 | 7.22 |
ENSRNOT00000055127
|
Znfx1
|
zinc finger, NFX1-type containing 1 |
| chr1_+_263511537 | 4.99 |
ENSRNOT00000023396
|
Cutc
|
cutC copper transporter |
| chr6_+_52122318 | 4.09 |
ENSRNOT00000086432
|
Nampt
|
nicotinamide phosphoribosyltransferase |
| chrY_-_1238420 | 3.98 |
ENSRNOT00000092078
|
Ddx3
|
DEAD (Asp-Glu-Ala-Asp) box polypeptide 3 |
| chr3_-_103128243 | 2.98 |
ENSRNOT00000046310
|
Olr779
|
olfactory receptor 779 |
| chrX_-_63291371 | 2.90 |
ENSRNOT00000082421
|
Eif2s3
|
eukaryotic translation initiation factor 2 subunit gamma |
| chr1_-_263511505 | 2.46 |
ENSRNOT00000023215
|
Cox15
|
COX15 cytochrome c oxidase assembly homolog |
| chrX_-_63291107 | 2.20 |
ENSRNOT00000092019
|
Eif2s3
|
eukaryotic translation initiation factor 2 subunit gamma |
| chr16_+_6779281 | 2.00 |
ENSRNOT00000022865
|
Sfmbt1
|
Scm-like with four mbt domains 1 |
| chr7_-_26361221 | 1.63 |
ENSRNOT00000011326
|
RGD1309995
|
similar to CG13957-PA |
| chr1_-_198008893 | 1.47 |
ENSRNOT00000025950
|
Il27
|
interleukin 27 |
| chr1_+_230056710 | 1.41 |
ENSRNOT00000073539
|
Olr357
|
olfactory receptor 357 |
| chr7_-_120295618 | 1.21 |
ENSRNOT00000014413
|
Ankrd54
|
ankyrin repeat domain 54 |
| chr12_-_41266430 | 1.13 |
ENSRNOT00000001853
ENSRNOT00000081108 |
Oas1b
|
2-5 oligoadenylate synthetase 1B |
| chr13_+_29839867 | 0.01 |
ENSRNOT00000090623
|
AABR07020537.1
|
|
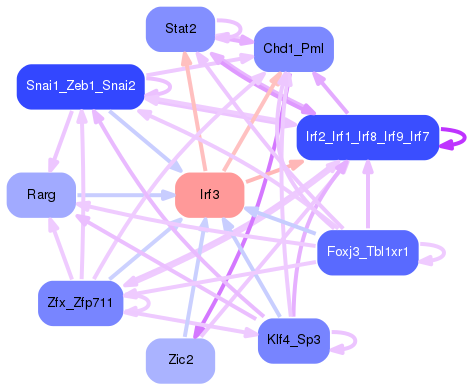
Network of associatons between targets according to the STRING database.

First level regulatory network of Irf3
Gene Ontology Analysis
Gene overrepresentation in biological process category:
| Log-likelihood per target | Total log-likelihood | Term | Description |
|---|---|---|---|
| 17.2 | 51.6 | GO:0046967 | cytosol to ER transport(GO:0046967) peptide antigen transport(GO:0046968) |
| 15.6 | 62.2 | GO:0050904 | CD8-positive, alpha-beta T cell extravasation(GO:0035697) regulation of tyrosine phosphorylation of STAT protein(GO:0042509) positive regulation of tyrosine phosphorylation of STAT protein(GO:0042531) diapedesis(GO:0050904) cellular response to vitamin K(GO:0071307) |
| 13.8 | 55.3 | GO:1901423 | response to benzene(GO:1901423) |
| 13.0 | 52.0 | GO:0090290 | positive regulation of osteoclast proliferation(GO:0090290) |
| 10.6 | 31.7 | GO:0002731 | negative regulation of dendritic cell cytokine production(GO:0002731) |
| 10.2 | 61.3 | GO:0032929 | negative regulation of superoxide anion generation(GO:0032929) |
| 9.7 | 19.3 | GO:0002481 | antigen processing and presentation of exogenous peptide antigen via MHC class Ib(GO:0002477) antigen processing and presentation of exogenous protein antigen via MHC class Ib, TAP-dependent(GO:0002481) |
| 6.8 | 20.4 | GO:0002397 | MHC class I protein complex assembly(GO:0002397) |
| 6.8 | 20.4 | GO:0036378 | calcitriol biosynthetic process from calciol(GO:0036378) |
| 6.8 | 13.5 | GO:0002589 | regulation of antigen processing and presentation of peptide antigen via MHC class I(GO:0002589) |
| 6.7 | 73.5 | GO:0060340 | positive regulation of type I interferon-mediated signaling pathway(GO:0060340) |
| 5.9 | 52.9 | GO:0003373 | dynamin polymerization involved in membrane fission(GO:0003373) dynamin polymerization involved in mitochondrial fission(GO:0003374) |
| 5.9 | 47.0 | GO:0039530 | MDA-5 signaling pathway(GO:0039530) |
| 5.5 | 22.0 | GO:0051684 | maintenance of Golgi location(GO:0051684) double-strand break repair via classical nonhomologous end joining(GO:0097680) |
| 5.4 | 16.3 | GO:0021529 | neuroblast differentiation(GO:0014016) spinal cord oligodendrocyte cell differentiation(GO:0021529) spinal cord oligodendrocyte cell fate specification(GO:0021530) medulla oblongata development(GO:0021550) musculoskeletal movement, spinal reflex action(GO:0050883) olfactory pit development(GO:0060166) |
| 4.5 | 22.5 | GO:0032020 | ISG15-protein conjugation(GO:0032020) |
| 3.6 | 10.8 | GO:0019885 | antigen processing and presentation of endogenous peptide antigen via MHC class I(GO:0019885) |
| 3.4 | 13.7 | GO:0030578 | PML body organization(GO:0030578) negative regulation of interleukin-1 beta secretion(GO:0050713) |
| 3.3 | 26.8 | GO:0090086 | negative regulation of protein deubiquitination(GO:0090086) |
| 3.1 | 43.3 | GO:0044406 | adhesion of symbiont to host(GO:0044406) |
| 2.9 | 31.7 | GO:0006228 | UTP biosynthetic process(GO:0006228) |
| 2.6 | 67.9 | GO:0019884 | antigen processing and presentation of exogenous antigen(GO:0019884) |
| 2.5 | 12.7 | GO:0052055 | modulation by symbiont of host molecular function(GO:0052055) |
| 2.2 | 13.2 | GO:1902101 | positive regulation of mitotic metaphase/anaphase transition(GO:0045842) positive regulation of attachment of spindle microtubules to kinetochore(GO:0051987) positive regulation of mitotic sister chromatid separation(GO:1901970) positive regulation of metaphase/anaphase transition of cell cycle(GO:1902101) |
| 2.1 | 23.2 | GO:0031293 | membrane protein intracellular domain proteolysis(GO:0031293) |
| 2.1 | 10.4 | GO:1990830 | response to leukemia inhibitory factor(GO:1990823) cellular response to leukemia inhibitory factor(GO:1990830) |
| 1.6 | 42.5 | GO:0010390 | histone monoubiquitination(GO:0010390) |
| 1.6 | 15.8 | GO:0060337 | type I interferon signaling pathway(GO:0060337) cellular response to type I interferon(GO:0071357) |
| 1.4 | 46.3 | GO:0035458 | cellular response to interferon-beta(GO:0035458) |
| 1.2 | 21.8 | GO:2001275 | positive regulation of glucose import in response to insulin stimulus(GO:2001275) |
| 1.2 | 10.9 | GO:2000051 | negative regulation of non-canonical Wnt signaling pathway(GO:2000051) |
| 1.0 | 85.1 | GO:0019882 | antigen processing and presentation(GO:0019882) |
| 0.8 | 8.7 | GO:0000290 | deadenylation-dependent decapping of nuclear-transcribed mRNA(GO:0000290) |
| 0.7 | 110.9 | GO:0051607 | defense response to virus(GO:0051607) |
| 0.6 | 36.2 | GO:0007157 | heterophilic cell-cell adhesion via plasma membrane cell adhesion molecules(GO:0007157) |
| 0.5 | 30.6 | GO:0070206 | protein trimerization(GO:0070206) |
| 0.3 | 5.0 | GO:0055070 | copper ion homeostasis(GO:0055070) |
| 0.3 | 4.1 | GO:0009435 | NAD biosynthetic process(GO:0009435) |
| 0.2 | 8.3 | GO:0031648 | protein destabilization(GO:0031648) |
| 0.2 | 2.5 | GO:0008535 | respiratory chain complex IV assembly(GO:0008535) |
| 0.1 | 36.2 | GO:0010951 | negative regulation of endopeptidase activity(GO:0010951) |
| 0.1 | 16.8 | GO:0042157 | lipoprotein metabolic process(GO:0042157) |
| 0.1 | 4.0 | GO:0010501 | RNA secondary structure unwinding(GO:0010501) |
| 0.0 | 2.0 | GO:0048635 | negative regulation of muscle organ development(GO:0048635) |
| 0.0 | 0.6 | GO:0045648 | positive regulation of erythrocyte differentiation(GO:0045648) |
Gene overrepresentation in cellular component category:
| Log-likelihood per target | Total log-likelihood | Term | Description |
|---|---|---|---|
| 22.6 | 67.9 | GO:0008537 | proteasome activator complex(GO:0008537) |
| 21.1 | 126.5 | GO:1990111 | spermatoproteasome complex(GO:1990111) |
| 10.8 | 43.3 | GO:0020005 | symbiont-containing vacuole membrane(GO:0020005) |
| 10.3 | 72.1 | GO:0042825 | TAP complex(GO:0042825) |
| 3.6 | 28.5 | GO:0097452 | GAIT complex(GO:0097452) |
| 3.3 | 23.2 | GO:0098553 | integral component of cytoplasmic side of endoplasmic reticulum membrane(GO:0071458) integral component of lumenal side of endoplasmic reticulum membrane(GO:0071556) lumenal side of endoplasmic reticulum membrane(GO:0098553) |
| 3.2 | 19.3 | GO:1990712 | HFE-transferrin receptor complex(GO:1990712) |
| 2.0 | 13.7 | GO:0042406 | extrinsic component of endoplasmic reticulum membrane(GO:0042406) |
| 1.1 | 23.5 | GO:0031233 | intrinsic component of external side of plasma membrane(GO:0031233) |
| 1.0 | 13.2 | GO:0000778 | condensed nuclear chromosome kinetochore(GO:0000778) |
| 0.9 | 23.9 | GO:0001891 | phagocytic cup(GO:0001891) |
| 0.6 | 5.1 | GO:0005850 | eukaryotic translation initiation factor 2 complex(GO:0005850) |
| 0.5 | 21.1 | GO:0005771 | multivesicular body(GO:0005771) |
| 0.5 | 31.7 | GO:0031903 | peroxisomal membrane(GO:0005778) microbody membrane(GO:0031903) |
| 0.4 | 26.8 | GO:0019005 | SCF ubiquitin ligase complex(GO:0019005) |
| 0.3 | 22.0 | GO:0045335 | phagocytic vesicle(GO:0045335) |
| 0.3 | 36.2 | GO:0005913 | cell-cell adherens junction(GO:0005913) |
| 0.2 | 21.8 | GO:0016363 | nuclear matrix(GO:0016363) |
| 0.1 | 45.3 | GO:0005783 | endoplasmic reticulum(GO:0005783) |
| 0.1 | 10.8 | GO:0005788 | endoplasmic reticulum lumen(GO:0005788) |
| 0.1 | 16.3 | GO:0090575 | RNA polymerase II transcription factor complex(GO:0090575) |
| 0.1 | 84.8 | GO:0005789 | endoplasmic reticulum membrane(GO:0005789) |
| 0.1 | 10.4 | GO:0071013 | catalytic step 2 spliceosome(GO:0071013) |
| 0.1 | 43.0 | GO:0005764 | lytic vacuole(GO:0000323) lysosome(GO:0005764) |
| 0.1 | 8.7 | GO:0000932 | cytoplasmic mRNA processing body(GO:0000932) |
| 0.1 | 2.5 | GO:0070069 | cytochrome complex(GO:0070069) |
| 0.1 | 79.9 | GO:0005615 | extracellular space(GO:0005615) |
| 0.1 | 4.0 | GO:0036464 | cytoplasmic ribonucleoprotein granule(GO:0036464) |
| 0.1 | 16.9 | GO:0005794 | Golgi apparatus(GO:0005794) |
| 0.1 | 20.4 | GO:0005743 | mitochondrial inner membrane(GO:0005743) |
| 0.0 | 259.4 | GO:0016021 | integral component of membrane(GO:0016021) |
| 0.0 | 102.6 | GO:0005829 | cytosol(GO:0005829) |
Gene overrepresentation in molecular function category:
| Log-likelihood per target | Total log-likelihood | Term | Description |
|---|---|---|---|
| 17.2 | 51.6 | GO:0015433 | peptide antigen-transporting ATPase activity(GO:0015433) tapasin binding(GO:0046980) |
| 11.8 | 47.2 | GO:0003726 | double-stranded RNA adenosine deaminase activity(GO:0003726) |
| 10.4 | 62.2 | GO:0031726 | CCR1 chemokine receptor binding(GO:0031726) |
| 9.1 | 64.0 | GO:0061133 | endopeptidase activator activity(GO:0061133) |
| 7.9 | 31.7 | GO:0008670 | 2,4-dienoyl-CoA reductase (NADPH) activity(GO:0008670) trans-2-enoyl-CoA reductase (NADPH) activity(GO:0019166) |
| 6.8 | 20.4 | GO:0046977 | TAP binding(GO:0046977) TAP1 binding(GO:0046978) TAP2 binding(GO:0046979) |
| 6.3 | 56.4 | GO:0001730 | 2'-5'-oligoadenylate synthetase activity(GO:0001730) |
| 4.7 | 126.5 | GO:0004298 | threonine-type endopeptidase activity(GO:0004298) threonine-type peptidase activity(GO:0070003) |
| 3.9 | 23.2 | GO:0042500 | aspartic endopeptidase activity, intramembrane cleaving(GO:0042500) |
| 3.2 | 61.3 | GO:0003993 | acid phosphatase activity(GO:0003993) |
| 2.9 | 65.6 | GO:0003950 | NAD+ ADP-ribosyltransferase activity(GO:0003950) |
| 2.8 | 22.5 | GO:0031386 | protein tag(GO:0031386) |
| 2.6 | 31.7 | GO:0008191 | metalloendopeptidase inhibitor activity(GO:0008191) |
| 1.5 | 10.8 | GO:0005138 | interleukin-6 receptor binding(GO:0005138) |
| 1.5 | 13.2 | GO:0043515 | kinetochore binding(GO:0043515) |
| 1.2 | 89.9 | GO:0003725 | double-stranded RNA binding(GO:0003725) |
| 1.1 | 13.7 | GO:0050897 | cobalt ion binding(GO:0050897) |
| 1.0 | 4.1 | GO:0004514 | nicotinate-nucleotide diphosphorylase (carboxylating) activity(GO:0004514) |
| 1.0 | 8.7 | GO:0000340 | RNA 7-methylguanosine cap binding(GO:0000340) |
| 0.8 | 29.3 | GO:0042605 | peptide antigen binding(GO:0042605) |
| 0.7 | 20.4 | GO:0008395 | steroid hydroxylase activity(GO:0008395) |
| 0.5 | 154.0 | GO:0003924 | GTPase activity(GO:0003924) |
| 0.5 | 33.6 | GO:0030971 | receptor tyrosine kinase binding(GO:0030971) |
| 0.4 | 16.3 | GO:0043425 | bHLH transcription factor binding(GO:0043425) |
| 0.3 | 21.8 | GO:0019843 | rRNA binding(GO:0019843) |
| 0.3 | 26.3 | GO:0000979 | RNA polymerase II core promoter sequence-specific DNA binding(GO:0000979) |
| 0.3 | 36.2 | GO:0004867 | serine-type endopeptidase inhibitor activity(GO:0004867) |
| 0.2 | 44.5 | GO:0042393 | histone binding(GO:0042393) |
| 0.2 | 56.8 | GO:0030246 | carbohydrate binding(GO:0030246) |
| 0.2 | 19.3 | GO:0001948 | glycoprotein binding(GO:0001948) |
| 0.2 | 8.5 | GO:0003727 | single-stranded RNA binding(GO:0003727) |
| 0.1 | 22.0 | GO:0017124 | SH3 domain binding(GO:0017124) |
| 0.1 | 5.0 | GO:0005507 | copper ion binding(GO:0005507) |
| 0.1 | 2.5 | GO:0015002 | cytochrome-c oxidase activity(GO:0004129) heme-copper terminal oxidase activity(GO:0015002) oxidoreductase activity, acting on a heme group of donors, oxygen as acceptor(GO:0016676) |
| 0.1 | 36.2 | GO:0050839 | cell adhesion molecule binding(GO:0050839) |
| 0.1 | 4.0 | GO:0004004 | RNA helicase activity(GO:0003724) ATP-dependent RNA helicase activity(GO:0004004) RNA-dependent ATPase activity(GO:0008186) |
| 0.0 | 18.7 | GO:0004842 | ubiquitin-protein transferase activity(GO:0004842) |
| 0.0 | 21.3 | GO:0003700 | nucleic acid binding transcription factor activity(GO:0001071) transcription factor activity, sequence-specific DNA binding(GO:0003700) |
| 0.0 | 14.7 | GO:0032403 | protein complex binding(GO:0032403) |
Gene overrepresentation in curated gene sets: canonical pathways category:
| Log-likelihood per target | Total log-likelihood | Term | Description |
|---|---|---|---|
| 1.5 | 62.2 | PID SYNDECAN 4 PATHWAY | Syndecan-4-mediated signaling events |
| 1.1 | 15.8 | ST TYPE I INTERFERON PATHWAY | Type I Interferon (alpha/beta IFN) Pathway |
| 0.5 | 38.2 | PID IL4 2PATHWAY | IL4-mediated signaling events |
| 0.5 | 13.7 | PID MYC PATHWAY | C-MYC pathway |
| 0.5 | 47.9 | WNT SIGNALING | Genes related to Wnt-mediated signal transduction |
| 0.4 | 16.3 | PID HES HEY PATHWAY | Notch-mediated HES/HEY network |
| 0.3 | 51.6 | PID P53 DOWNSTREAM PATHWAY | Direct p53 effectors |
| 0.3 | 26.3 | PID SMAD2 3NUCLEAR PATHWAY | Regulation of nuclear SMAD2/3 signaling |
| 0.3 | 13.2 | PID PLK1 PATHWAY | PLK1 signaling events |
| 0.2 | 36.2 | NABA ECM REGULATORS | Genes encoding enzymes and their regulators involved in the remodeling of the extracellular matrix |
| 0.1 | 7.2 | PID TELOMERASE PATHWAY | Regulation of Telomerase |
| 0.1 | 1.5 | PID IL27 PATHWAY | IL27-mediated signaling events |
| 0.1 | 23.5 | NABA SECRETED FACTORS | Genes encoding secreted soluble factors |
Gene overrepresentation in curated gene sets: REACTOME pathways category:
| Log-likelihood per target | Total log-likelihood | Term | Description |
|---|---|---|---|
| 6.4 | 19.3 | REACTOME ENDOSOMAL VACUOLAR PATHWAY | Genes involved in Endosomal/Vacuolar pathway |
| 4.1 | 242.2 | REACTOME ER PHAGOSOME PATHWAY | Genes involved in ER-Phagosome pathway |
| 3.7 | 52.1 | REACTOME TRAF3 DEPENDENT IRF ACTIVATION PATHWAY | Genes involved in TRAF3-dependent IRF activation pathway |
| 2.8 | 47.2 | REACTOME RIP MEDIATED NFKB ACTIVATION VIA DAI | Genes involved in RIP-mediated NFkB activation via DAI |
| 2.6 | 140.5 | REACTOME INTERFERON ALPHA BETA SIGNALING | Genes involved in Interferon alpha/beta signaling |
| 1.8 | 57.0 | REACTOME INTERFERON GAMMA SIGNALING | Genes involved in Interferon gamma signaling |
| 1.7 | 20.4 | REACTOME SYNTHESIS OF BILE ACIDS AND BILE SALTS VIA 24 HYDROXYCHOLESTEROL | Genes involved in Synthesis of bile acids and bile salts via 24-hydroxycholesterol |
| 1.2 | 62.2 | REACTOME CHEMOKINE RECEPTORS BIND CHEMOKINES | Genes involved in Chemokine receptors bind chemokines |
| 1.0 | 61.3 | REACTOME METABOLISM OF VITAMINS AND COFACTORS | Genes involved in Metabolism of vitamins and cofactors |
| 0.9 | 10.8 | REACTOME ANTIGEN PRESENTATION FOLDING ASSEMBLY AND PEPTIDE LOADING OF CLASS I MHC | Genes involved in Antigen Presentation: Folding, assembly and peptide loading of class I MHC |
| 0.7 | 21.1 | REACTOME RIG I MDA5 MEDIATED INDUCTION OF IFN ALPHA BETA PATHWAYS | Genes involved in RIG-I/MDA5 mediated induction of IFN-alpha/beta pathways |
| 0.7 | 8.7 | REACTOME MRNA DECAY BY 3 TO 5 EXORIBONUCLEASE | Genes involved in mRNA Decay by 3' to 5' Exoribonuclease |
| 0.3 | 58.1 | REACTOME ANTIGEN PROCESSING UBIQUITINATION PROTEASOME DEGRADATION | Genes involved in Antigen processing: Ubiquitination & Proteasome degradation |
| 0.3 | 5.1 | REACTOME FORMATION OF THE TERNARY COMPLEX AND SUBSEQUENTLY THE 43S COMPLEX | Genes involved in Formation of the ternary complex, and subsequently, the 43S complex |
| 0.3 | 28.5 | REACTOME PEPTIDE CHAIN ELONGATION | Genes involved in Peptide chain elongation |