Project
GSE53960: rat RNA-Seq transcriptomic Bodymap
Navigation
Downloads
Results for Hoxa9_Hoxb9
Z-value: 0.81
Motif logo
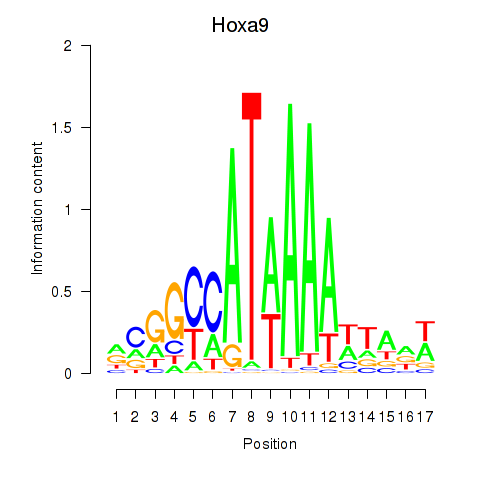
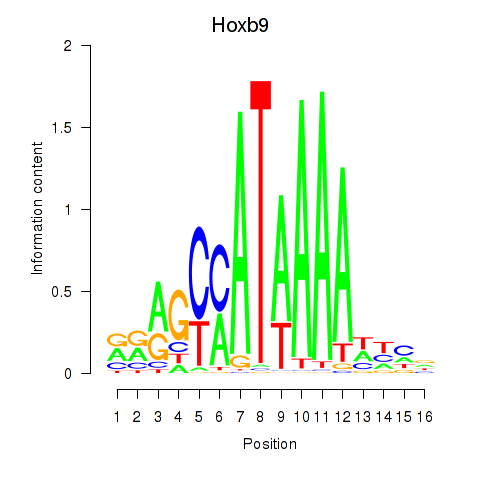
Transcription factors associated with Hoxa9_Hoxb9
| Gene Symbol | Gene ID | Gene Info |
|---|---|---|
|
Hoxa9
|
ENSRNOG00000048146 | homeobox A9 |
|
Hoxb9
|
ENSRNOG00000007573 | homeo box B9 |
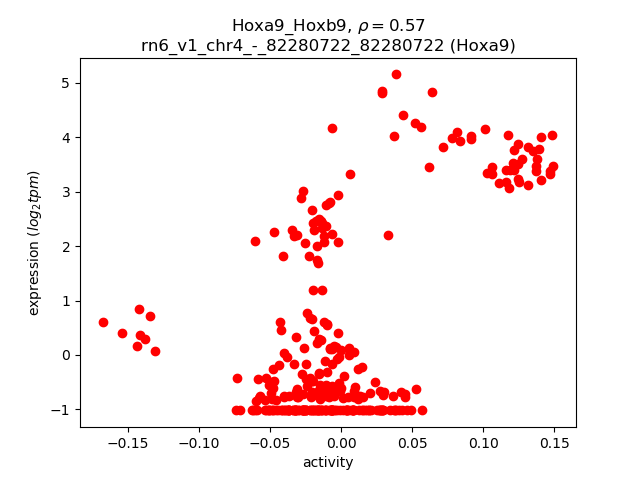
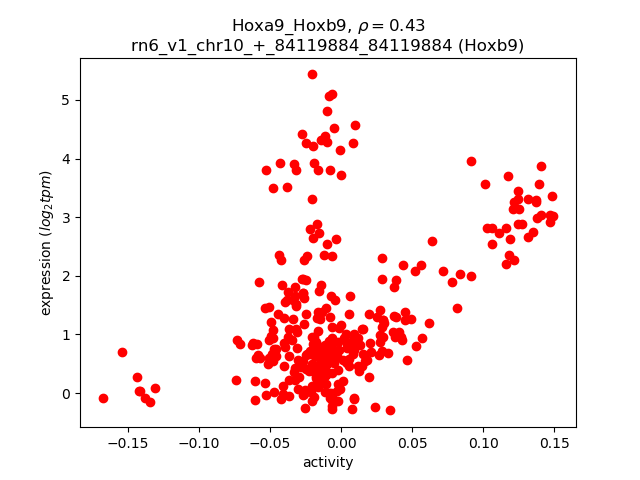
Activity-expression correlation:
| Gene | Promoter | Pearson corr. coef. | P-value | Plot |
|---|---|---|---|---|
| Hoxa9 | rn6_v1_chr4_-_82280722_82280722 | 0.57 | 2.1e-29 | Click! |
| Hoxb9 | rn6_v1_chr10_+_84119884_84119884 | 0.43 | 1.3e-15 | Click! |
Activity profile of Hoxa9_Hoxb9 motif
Sorted Z-values of Hoxa9_Hoxb9 motif
| Promoter | Log-likelihood | Transcript | Gene | Gene Info |
|---|---|---|---|---|
| chr9_+_20048121 | 59.66 |
ENSRNOT00000014791
|
Mep1a
|
meprin 1 subunit alpha |
| chr5_-_64818813 | 55.45 |
ENSRNOT00000009111
ENSRNOT00000086505 |
Aldob
|
aldolase, fructose-bisphosphate B |
| chr3_+_159902441 | 40.10 |
ENSRNOT00000089893
ENSRNOT00000011978 |
Hnf4a
|
hepatocyte nuclear factor 4, alpha |
| chr4_-_51199570 | 37.06 |
ENSRNOT00000010788
|
Slc13a1
|
solute carrier family 13 member 1 |
| chrX_+_110789269 | 34.11 |
ENSRNOT00000086014
|
Rnf128
|
ring finger protein 128, E3 ubiquitin protein ligase |
| chr14_-_20920286 | 33.36 |
ENSRNOT00000004391
|
Slc4a4
|
solute carrier family 4 member 4 |
| chr13_+_44424689 | 28.26 |
ENSRNOT00000005206
|
Acmsd
|
aminocarboxymuconate semialdehyde decarboxylase |
| chr5_-_147784311 | 20.95 |
ENSRNOT00000074172
|
Fam167b
|
family with sequence similarity 167, member B |
| chr4_+_68849033 | 18.98 |
ENSRNOT00000016912
|
Mgam
|
maltase-glucoamylase |
| chr3_+_140024043 | 17.70 |
ENSRNOT00000086409
|
Rin2
|
Ras and Rab interactor 2 |
| chr20_+_41266566 | 16.13 |
ENSRNOT00000000653
|
Frk
|
fyn-related Src family tyrosine kinase |
| chr16_+_2706428 | 15.48 |
ENSRNOT00000077117
|
Il17rd
|
interleukin 17 receptor D |
| chr4_-_173640684 | 14.25 |
ENSRNOT00000010728
|
Rergl
|
RERG like |
| chr10_+_84135116 | 12.75 |
ENSRNOT00000031035
|
Hoxb7
|
homeo box B7 |
| chr9_+_65534704 | 12.75 |
ENSRNOT00000016730
|
Cflar
|
CASP8 and FADD-like apoptosis regulator |
| chr2_+_23289374 | 12.59 |
ENSRNOT00000090666
ENSRNOT00000032783 |
Dmgdh
|
dimethylglycine dehydrogenase |
| chr4_+_163267450 | 11.46 |
ENSRNOT00000079337
|
Tmem52b
|
transmembrane protein 52B |
| chr4_+_56981283 | 11.43 |
ENSRNOT00000010989
|
Tspan33
|
tetraspanin 33 |
| chr2_-_185005572 | 11.15 |
ENSRNOT00000093291
|
Fam160a1
|
family with sequence similarity 160, member A1 |
| chr7_+_44146237 | 10.35 |
ENSRNOT00000058842
|
Rassf9
|
Ras association domain family member 9 |
| chrX_+_17016778 | 9.44 |
ENSRNOT00000003989
|
Bmp15
|
bone morphogenetic protein 15 |
| chr1_+_61786900 | 9.18 |
ENSRNOT00000090287
|
AABR07001905.1
|
|
| chr7_-_101138373 | 9.03 |
ENSRNOT00000043257
|
LOC500877
|
Ab1-152 |
| chr4_-_129515435 | 8.88 |
ENSRNOT00000039353
|
Eogt
|
EGF domain specific O-linked N-acetylglucosamine transferase |
| chr4_-_22424862 | 8.48 |
ENSRNOT00000082359
|
Abcb1a
|
ATP binding cassette subfamily B member 1A |
| chr8_+_99625545 | 8.42 |
ENSRNOT00000010689
ENSRNOT00000056727 |
Plscr1
|
phospholipid scramblase 1 |
| chr16_+_31734944 | 8.05 |
ENSRNOT00000059673
|
Palld
|
palladin, cytoskeletal associated protein |
| chr8_-_63750531 | 8.03 |
ENSRNOT00000009496
|
Neo1
|
neogenin 1 |
| chr5_+_117052260 | 7.86 |
ENSRNOT00000010211
|
Patj
|
PATJ, crumbs cell polarity complex component |
| chr3_-_36660758 | 7.66 |
ENSRNOT00000006111
|
Rnd3
|
Rho family GTPase 3 |
| chr18_-_75207306 | 7.61 |
ENSRNOT00000021717
|
Setbp1
|
SET binding protein 1 |
| chr14_-_84662143 | 7.57 |
ENSRNOT00000057529
ENSRNOT00000080078 |
Hormad2
|
HORMA domain containing 2 |
| chr7_-_101138860 | 7.56 |
ENSRNOT00000077137
|
AABR07058124.4
|
|
| chr2_+_243577082 | 7.53 |
ENSRNOT00000016556
|
Adh6a
|
alcohol dehydrogenase 6A (class V) |
| chr1_+_154131926 | 7.22 |
ENSRNOT00000035257
|
LOC102549852
|
ferritin light chain 1-like |
| chr18_-_41389510 | 7.15 |
ENSRNOT00000005476
ENSRNOT00000005446 |
Sema6a
|
semaphorin 6A |
| chr4_+_97657671 | 7.10 |
ENSRNOT00000075400
|
Gng12
|
G protein subunit gamma 12 |
| chr13_+_113373578 | 6.93 |
ENSRNOT00000009900
|
Plxna2
|
plexin A2 |
| chr9_+_95202632 | 6.81 |
ENSRNOT00000025652
|
Ugt1a5
|
UDP glucuronosyltransferase family 1 member A5 |
| chr14_-_5101177 | 6.53 |
ENSRNOT00000002888
|
Lrrc8d
|
leucine rich repeat containing 8 family, member D |
| chr1_+_242959488 | 6.31 |
ENSRNOT00000015668
|
Dock8
|
dedicator of cytokinesis 8 |
| chr4_-_183417667 | 6.28 |
ENSRNOT00000089160
|
Fam60a
|
family with sequence similarity 60, member A |
| chr1_+_114679537 | 5.72 |
ENSRNOT00000019498
|
Oca2
|
OCA2 melanosomal transmembrane protein |
| chr16_-_69176036 | 5.56 |
ENSRNOT00000018369
|
Prosc
|
proline synthetase co-transcribed homolog (bacterial) |
| chr8_-_109560747 | 5.56 |
ENSRNOT00000087334
|
Ppp2r3a
|
protein phosphatase 2, regulatory subunit B'', alpha |
| chr13_-_51297621 | 5.50 |
ENSRNOT00000030926
|
Ndufv3
|
NADH:ubiquinone oxidoreductase subunit V3 |
| chr9_-_60330086 | 5.25 |
ENSRNOT00000092162
ENSRNOT00000093630 |
Dnah7
|
dynein, axonemal, heavy chain 7 |
| chr12_+_19231092 | 5.20 |
ENSRNOT00000045379
|
Zkscan1
|
zinc finger with KRAB and SCAN domains 1 |
| chr1_-_169598835 | 5.09 |
ENSRNOT00000072996
|
Olr156
|
olfactory receptor 156 |
| chr9_-_52238564 | 5.08 |
ENSRNOT00000005073
|
Col5a2
|
collagen type V alpha 2 chain |
| chr1_-_211265161 | 4.92 |
ENSRNOT00000080041
ENSRNOT00000023477 |
Bnip3
|
BCL2 interacting protein 3 |
| chr5_+_137189473 | 4.91 |
ENSRNOT00000056815
|
Hyi
|
hydroxypyruvate isomerase |
| chr8_+_47674321 | 4.90 |
ENSRNOT00000026170
ENSRNOT00000078776 |
Trim29
|
tripartite motif-containing 29 |
| chr2_-_250862419 | 4.89 |
ENSRNOT00000017943
|
Clca4
|
chloride channel accessory 4 |
| chr2_+_248398917 | 4.59 |
ENSRNOT00000045855
|
Gbp1
|
guanylate binding protein 1 |
| chr2_-_18565842 | 4.52 |
ENSRNOT00000067456
ENSRNOT00000063821 ENSRNOT00000045532 |
Vcan
|
versican |
| chr1_-_163117235 | 4.48 |
ENSRNOT00000019370
|
Capn5
|
calpain 5 |
| chr20_-_45260119 | 4.42 |
ENSRNOT00000000718
|
Slc16a10
|
solute carrier family 16 member 10 |
| chr2_-_33920837 | 4.37 |
ENSRNOT00000075196
|
Erbin
|
erbb2 interacting protein |
| chr3_+_67538289 | 4.21 |
ENSRNOT00000009839
|
Dnajc10
|
DnaJ heat shock protein family (Hsp40) member C10 |
| chr18_-_35780519 | 4.18 |
ENSRNOT00000079667
|
Mcc
|
mutated in colorectal cancers |
| chr2_-_31753528 | 4.05 |
ENSRNOT00000075057
|
Pik3r1
|
phosphoinositide-3-kinase regulatory subunit 1 |
| chr16_-_74700815 | 3.99 |
ENSRNOT00000081297
|
Thsd1
|
thrombospondin type 1 domain containing 1 |
| chrM_+_3904 | 3.97 |
ENSRNOT00000040993
|
Mt-nd2
|
mitochondrially encoded NADH dehydrogenase 2 |
| chr16_-_81693000 | 3.92 |
ENSRNOT00000092353
|
Lamp1
|
lysosomal-associated membrane protein 1 |
| chr10_-_70337532 | 3.81 |
ENSRNOT00000055963
|
Slfn13
|
schlafen family member 13 |
| chr5_+_59491096 | 3.75 |
ENSRNOT00000019737
ENSRNOT00000036366 ENSRNOT00000083068 |
Clta
|
clathrin, light chain A |
| chr1_+_277355619 | 3.70 |
ENSRNOT00000022788
|
Nhlrc2
|
NHL repeat containing 2 |
| chr14_+_104480662 | 3.70 |
ENSRNOT00000078710
|
Rab1a
|
RAB1A, member RAS oncogene family |
| chr2_+_257626383 | 3.42 |
ENSRNOT00000080993
|
Zzz3
|
zinc finger, ZZ-type containing 3 |
| chr8_+_91070073 | 3.38 |
ENSRNOT00000012904
|
Sh3bgrl2
|
SH3 domain binding glutamate-rich protein like 2 |
| chrX_-_158978995 | 3.29 |
ENSRNOT00000001179
|
Mmgt1
|
membrane magnesium transporter 1 |
| chr18_+_30864216 | 3.26 |
ENSRNOT00000027015
|
Pcdhga7
|
protocadherin gamma subfamily A, 7 |
| chr2_+_54466280 | 3.23 |
ENSRNOT00000033112
|
C6
|
complement C6 |
| chr3_-_21061070 | 3.12 |
ENSRNOT00000044461
|
Olr422
|
olfactory receptor 422 |
| chr3_+_108795235 | 3.11 |
ENSRNOT00000007028
|
Spred1
|
sprouty-related, EVH1 domain containing 1 |
| chr19_+_46465647 | 3.10 |
ENSRNOT00000093714
|
Nudt7
|
nudix hydrolase 7 |
| chr10_+_49231730 | 3.09 |
ENSRNOT00000065335
|
Trim16
|
tripartite motif-containing 16 |
| chr8_+_82037977 | 3.02 |
ENSRNOT00000082288
|
Myo5a
|
myosin VA |
| chr1_+_8310577 | 2.97 |
ENSRNOT00000015131
|
Hivep2
|
human immunodeficiency virus type I enhancer binding protein 2 |
| chr3_-_60166013 | 2.96 |
ENSRNOT00000024922
|
Wipf1
|
WAS/WASL interacting protein family, member 1 |
| chr1_+_99616447 | 2.92 |
ENSRNOT00000029197
|
Klk14
|
kallikrein related-peptidase 14 |
| chr5_+_74766636 | 2.89 |
ENSRNOT00000030913
|
Rn50_5_0791.1
|
|
| chr1_+_201620642 | 2.88 |
ENSRNOT00000093674
|
Dmbt1
|
deleted in malignant brain tumors 1 |
| chr14_-_28967980 | 2.88 |
ENSRNOT00000048175
|
Adgrl3
|
adhesion G protein-coupled receptor L3 |
| chr8_-_6235967 | 2.88 |
ENSRNOT00000068290
|
LOC654482
|
hypothetical protein LOC654482 |
| chr4_-_168517177 | 2.86 |
ENSRNOT00000009151
|
Dusp16
|
dual specificity phosphatase 16 |
| chr2_-_54963448 | 2.80 |
ENSRNOT00000017886
|
Ptger4
|
prostaglandin E receptor 4 |
| chr4_-_163445302 | 2.79 |
ENSRNOT00000087106
|
Klrc3
|
killer cell lectin-like receptor subfamily C, member 3 |
| chr9_-_85617954 | 2.57 |
ENSRNOT00000077331
|
Serpine2
|
serpin family E member 2 |
| chr1_-_94784451 | 2.44 |
ENSRNOT00000020345
|
LOC365238
|
similar to CG15432-PA |
| chr8_-_94120433 | 2.44 |
ENSRNOT00000080195
ENSRNOT00000014600 |
Ube3d
|
ubiquitin protein ligase E3D |
| chr2_+_197715761 | 2.43 |
ENSRNOT00000083069
|
Golph3l
|
golgi phosphoprotein 3-like |
| chr20_-_6257604 | 2.39 |
ENSRNOT00000092489
|
Stk38
|
serine/threonine kinase 38 |
| chr6_-_136379348 | 2.39 |
ENSRNOT00000016208
|
Xrcc3
|
X-ray repair cross complementing 3 |
| chr8_-_69466618 | 2.35 |
ENSRNOT00000042925
|
Ids
|
iduronate 2-sulfatase |
| chr4_-_150829741 | 2.31 |
ENSRNOT00000051846
ENSRNOT00000052017 |
Cacna1c
|
calcium voltage-gated channel subunit alpha1 C |
| chr4_-_150829913 | 2.23 |
ENSRNOT00000041571
|
Cacna1c
|
calcium voltage-gated channel subunit alpha1 C |
| chr11_-_89260297 | 2.11 |
ENSRNOT00000057502
|
Spidr
|
scaffolding protein involved in DNA repair |
| chr2_+_55835151 | 2.09 |
ENSRNOT00000018634
|
Fyb
|
FYN binding protein |
| chr2_+_185846232 | 2.07 |
ENSRNOT00000023418
|
Lrba
|
LPS responsive beige-like anchor protein |
| chr3_-_77618518 | 2.07 |
ENSRNOT00000044273
|
Olr666
|
olfactory receptor 666 |
| chr9_-_95108739 | 2.04 |
ENSRNOT00000070819
|
Usp40
|
ubiquitin specific peptidase 40 |
| chr2_-_22096949 | 1.97 |
ENSRNOT00000089325
|
Zfyve16
|
zinc finger FYVE-type containing 16 |
| chr8_+_130009573 | 1.90 |
ENSRNOT00000026106
|
Trak1
|
trafficking kinesin protein 1 |
| chr6_-_91250138 | 1.87 |
ENSRNOT00000052408
|
LOC100911256
|
ninein-like |
| chr13_+_56513286 | 1.87 |
ENSRNOT00000015596
|
Zbtb41
|
zinc finger and BTB domain containing 41 |
| chrX_-_9999401 | 1.79 |
ENSRNOT00000060992
|
Gpr82
|
G protein-coupled receptor 82 |
| chr1_-_60281386 | 1.74 |
ENSRNOT00000092184
|
Vom1r10
|
vomeronasal 1 receptor 10 |
| chr8_+_64610952 | 1.74 |
ENSRNOT00000015963
|
Myo9a
|
myosin IXA |
| chr2_+_257633425 | 1.73 |
ENSRNOT00000071770
|
Zzz3
|
zinc finger, ZZ-type containing 3 |
| chr3_-_161812243 | 1.72 |
ENSRNOT00000025238
ENSRNOT00000087646 |
Slc35c2
|
solute carrier family 35 member C2 |
| chr3_+_93648343 | 1.70 |
ENSRNOT00000091164
|
AABR07053136.1
|
|
| chr15_-_48284548 | 1.67 |
ENSRNOT00000038336
|
Hmbox1
|
homeobox containing 1 |
| chr1_-_215553451 | 1.67 |
ENSRNOT00000027407
|
Ctsd
|
cathepsin D |
| chr4_-_13878126 | 1.61 |
ENSRNOT00000007032
|
Gnat3
|
G protein subunit alpha transducin 3 |
| chr9_-_91100482 | 1.61 |
ENSRNOT00000064642
|
LOC100911860
|
ubiquitin carboxyl-terminal hydrolase 40-like |
| chr16_-_74496731 | 1.53 |
ENSRNOT00000015790
|
Mrps31
|
mitochondrial ribosomal protein S31 |
| chr12_+_6403940 | 1.52 |
ENSRNOT00000083484
|
B3glct
|
beta 3-glucosyltransferase |
| chr1_-_238376841 | 1.52 |
ENSRNOT00000076393
|
Tmc1
|
transmembrane channel-like 1 |
| chr3_-_73475608 | 1.50 |
ENSRNOT00000049630
|
Olr480
|
olfactory receptor 480 |
| chr13_+_57243877 | 1.44 |
ENSRNOT00000083693
|
Kcnt2
|
potassium sodium-activated channel subfamily T member 2 |
| chr4_+_25635765 | 1.40 |
ENSRNOT00000009340
|
Gtpbp10
|
GTP binding protein 10 |
| chr2_-_197814808 | 1.38 |
ENSRNOT00000074156
|
Adamtsl4
|
ADAMTS-like 4 |
| chr7_-_59547174 | 1.27 |
ENSRNOT00000085836
|
Cnot2
|
CCR4-NOT transcription complex, subunit 2 |
| chr4_+_66091641 | 1.27 |
ENSRNOT00000043147
|
AABR07060287.1
|
|
| chr18_+_30880020 | 1.27 |
ENSRNOT00000060468
|
Pcdhgb5
|
protocadherin gamma subfamily B, 5 |
| chr8_+_19289506 | 1.25 |
ENSRNOT00000044135
|
Olr1143
|
olfactory receptor 1143 |
| chr19_+_39063998 | 1.20 |
ENSRNOT00000081116
|
Has3
|
hyaluronan synthase 3 |
| chr9_+_91001828 | 1.20 |
ENSRNOT00000080956
|
AABR07068214.1
|
|
| chr3_+_102841615 | 1.20 |
ENSRNOT00000075178
|
Olr770
|
olfactory receptor 770 |
| chr3_+_21114856 | 1.19 |
ENSRNOT00000044947
|
Olr423
|
olfactory receptor 423 |
| chr6_+_76745981 | 1.19 |
ENSRNOT00000076784
|
Brms1l
|
breast cancer metastasis-suppressor 1-like |
| chr16_-_3762877 | 1.17 |
ENSRNOT00000052224
|
Duxbl1
|
double homeobox B-like 1 |
| chr16_+_18447078 | 1.16 |
ENSRNOT00000075027
|
Fam60a
|
family with sequence similarity 60, member A |
| chr4_-_163445136 | 1.10 |
ENSRNOT00000080299
|
Klrc3
|
killer cell lectin-like receptor subfamily C, member 3 |
| chr17_-_53713408 | 1.07 |
ENSRNOT00000022445
|
LOC100912163
|
AT-rich interactive domain-containing protein 4B-like |
| chr3_+_111298713 | 1.07 |
ENSRNOT00000043677
|
Dppa3
|
developmental pluripotency-associated 3 |
| chr8_+_41247536 | 1.06 |
ENSRNOT00000073027
|
Olr1219
|
olfactory receptor 1219 |
| chr1_+_198682230 | 1.04 |
ENSRNOT00000023995
|
Znf48
|
zinc finger protein 48 |
| chr11_+_31389514 | 1.03 |
ENSRNOT00000000325
|
Olig2
|
oligodendrocyte lineage transcription factor 2 |
| chr19_-_56983807 | 1.03 |
ENSRNOT00000043529
|
Cox6c-ps1
|
cytochrome c oxidase subunit VIc, pseudogene |
| chr5_-_164502469 | 0.99 |
ENSRNOT00000051887
|
RGD1565622
|
RGD1565622 |
| chr13_+_90260783 | 0.98 |
ENSRNOT00000050547
|
Cd84
|
CD84 molecule |
| chr1_+_189432604 | 0.97 |
ENSRNOT00000034610
|
Acsm4
|
acyl-CoA synthetase medium-chain family member 4 |
| chr13_-_91735361 | 0.96 |
ENSRNOT00000058090
|
Fcer1a
|
Fc fragment of IgE receptor Ia |
| chr15_+_44441856 | 0.91 |
ENSRNOT00000018006
|
Gnrh1
|
gonadotropin releasing hormone 1 |
| chr2_+_150061636 | 0.90 |
ENSRNOT00000057820
|
AC111231.1
|
|
| chr8_-_60570058 | 0.86 |
ENSRNOT00000009169
|
Scaper
|
S-phase cyclin A-associated protein in the ER |
| chr18_+_30474947 | 0.75 |
ENSRNOT00000027188
|
Pcdhb9
|
protocadherin beta 9 |
| chr11_-_70207361 | 0.75 |
ENSRNOT00000002444
|
Muc13
|
mucin 13, cell surface associated |
| chr5_-_24489468 | 0.74 |
ENSRNOT00000081395
|
Ints8
|
integrator complex subunit 8 |
| chr9_-_7891514 | 0.73 |
ENSRNOT00000072684
|
Pot1b
|
protection of telomeres 1B |
| chr12_+_4248808 | 0.70 |
ENSRNOT00000042410
|
AABR07035089.1
|
|
| chr4_+_148286858 | 0.67 |
ENSRNOT00000017294
ENSRNOT00000092294 ENSRNOT00000092477 |
March8
|
membrane associated ring-CH-type finger 8 |
| chr8_-_102149912 | 0.67 |
ENSRNOT00000011263
|
RGD1309079
|
similar to Ab2-095 |
| chr6_-_77848434 | 0.67 |
ENSRNOT00000034342
|
Slc25a21
|
solute carrier family 25 member 21 |
| chr9_+_66888393 | 0.64 |
ENSRNOT00000023536
|
Carf
|
calcium responsive transcription factor |
| chr3_+_78876609 | 0.63 |
ENSRNOT00000049936
|
Olr726
|
olfactory receptor 726 |
| chr1_-_86263534 | 0.61 |
ENSRNOT00000044825
|
Fpr-rs6
|
formyl peptide receptor, related sequence 6 |
| chr3_+_73307900 | 0.55 |
ENSRNOT00000051690
|
Olr469
|
olfactory receptor 469 |
| chr1_+_230811800 | 0.53 |
ENSRNOT00000041509
|
Olr384
|
olfactory receptor 384 |
| chr1_-_172215730 | 0.53 |
ENSRNOT00000055175
|
Olr244
|
olfactory receptor 244 |
| chr7_+_9279620 | 0.49 |
ENSRNOT00000011225
|
Olr1064
|
olfactory receptor 1064 |
| chr2_-_199038702 | 0.47 |
ENSRNOT00000000106
|
Gpr89b
|
G protein-coupled receptor 89B |
| chr3_-_104675457 | 0.47 |
ENSRNOT00000041537
|
Hmgn4
|
high mobility group nucleosomal binding domain 4 |
| chr17_+_45078556 | 0.44 |
ENSRNOT00000088280
|
Zfp192
|
zinc finger protein 192 |
| chr16_-_14360555 | 0.40 |
ENSRNOT00000065460
|
LOC290595
|
hypothetical gene supported by AF152002 |
| chr8_+_82878941 | 0.39 |
ENSRNOT00000014846
|
Bmp5
|
bone morphogenetic protein 5 |
| chr1_+_266451021 | 0.39 |
ENSRNOT00000027196
|
Borcs7
|
BLOC-1 related complex subunit 7 |
| chr11_-_28842287 | 0.39 |
ENSRNOT00000061610
|
Krtap19-5
|
keratin associated protein 19-5 |
| chr4_-_148437961 | 0.38 |
ENSRNOT00000082907
|
Alox5
|
arachidonate 5-lipoxygenase |
| chr7_-_9136515 | 0.37 |
ENSRNOT00000081964
|
Olr1059
|
olfactory receptor 1059 |
| chr7_+_117519075 | 0.36 |
ENSRNOT00000029768
|
Scx
|
scleraxis bHLH transcription factor |
| chr15_+_34751550 | 0.32 |
ENSRNOT00000089559
ENSRNOT00000027918 ENSRNOT00000027895 ENSRNOT00000041631 |
Mcpt4
|
mast cell protease 4 |
| chr14_+_69800156 | 0.29 |
ENSRNOT00000072746
|
Lcorl
|
ligand dependent nuclear receptor corepressor-like |
| chr9_+_66889028 | 0.28 |
ENSRNOT00000087194
|
Carf
|
calcium responsive transcription factor |
| chr4_-_179512471 | 0.27 |
ENSRNOT00000012588
|
Kras
|
KRAS proto-oncogene, GTPase |
| chr16_-_48692476 | 0.25 |
ENSRNOT00000013118
|
Irf2
|
interferon regulatory factor 2 |
| chr18_+_58325319 | 0.23 |
ENSRNOT00000065802
ENSRNOT00000077726 |
Napg
|
NSF attachment protein gamma |
| chr3_-_154490851 | 0.23 |
ENSRNOT00000017213
|
Tti1
|
TELO2 interacting protein 1 |
| chr7_-_71048383 | 0.21 |
ENSRNOT00000005693
|
Gpr182
|
G protein-coupled receptor 182 |
| chr4_+_166911595 | 0.18 |
ENSRNOT00000030813
|
Tas2r124
|
taste receptor, type 2, member 124 |
| chr8_-_126495347 | 0.15 |
ENSRNOT00000013467
|
Cmc1
|
C-x(9)-C motif containing 1 |
| chr1_+_150492239 | 0.14 |
ENSRNOT00000047771
ENSRNOT00000048404 |
AABR07004684.1
|
|
| chr1_+_230703713 | 0.08 |
ENSRNOT00000064835
|
AC126957.1
|
|
| chr6_-_103958859 | 0.08 |
ENSRNOT00000073196
|
AABR07065013.1
|
|
| chr4_+_40161285 | 0.07 |
ENSRNOT00000050722
|
LOC500035
|
hypothetical protein LOC500035 |
| chr8_+_102304095 | 0.06 |
ENSRNOT00000011358
|
Slc9a9
|
solute carrier family 9 member A9 |
| chr2_-_26870421 | 0.06 |
ENSRNOT00000088791
|
AABR07007744.2
|
|
| chr10_+_4312863 | 0.05 |
ENSRNOT00000091610
|
LOC100911685
|
eukaryotic peptide chain release factor GTP-binding subunit ERF3B-like |
| chr11_+_43281458 | 0.05 |
ENSRNOT00000050197
|
Olr1538
|
olfactory receptor 1538 |
| chr3_-_73040049 | 0.03 |
ENSRNOT00000012629
|
Olr448
|
olfactory receptor 448 |
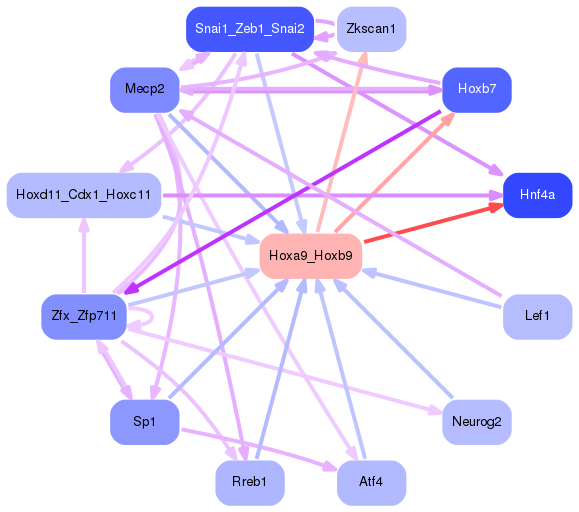
Network of associatons between targets according to the STRING database.

First level regulatory network of Hoxa9_Hoxb9
Gene Ontology Analysis
Gene overrepresentation in biological process category:
| Log-likelihood per target | Total log-likelihood | Term | Description |
|---|---|---|---|
| 18.5 | 55.4 | GO:0006116 | NADH oxidation(GO:0006116) |
| 10.0 | 40.1 | GO:1902569 | regulation of activation of JAK2 kinase activity(GO:0010534) activation of JAK2 kinase activity(GO:0042977) negative regulation of activation of JAK2 kinase activity(GO:1902569) |
| 4.7 | 28.3 | GO:0046874 | quinolinate metabolic process(GO:0046874) |
| 4.3 | 12.8 | GO:1903943 | negative regulation of myoblast fusion(GO:1901740) regulation of hepatocyte apoptotic process(GO:1903943) negative regulation of hepatocyte apoptotic process(GO:1903944) |
| 4.2 | 12.6 | GO:0006579 | amino-acid betaine catabolic process(GO:0006579) |
| 2.8 | 2.8 | GO:2000417 | negative regulation of eosinophil migration(GO:2000417) |
| 2.8 | 13.9 | GO:0060014 | granulosa cell differentiation(GO:0060014) |
| 2.2 | 37.1 | GO:1902358 | sulfate transmembrane transport(GO:1902358) |
| 2.1 | 8.5 | GO:1905235 | carbohydrate export(GO:0033231) daunorubicin transport(GO:0043215) response to borneol(GO:1905230) cellular response to borneol(GO:1905231) response to codeine(GO:1905233) response to quercetin(GO:1905235) drug transport across blood-brain barrier(GO:1990962) establishment of blood-retinal barrier(GO:1990963) |
| 1.9 | 5.6 | GO:0090249 | cell motility involved in somitogenic axis elongation(GO:0090247) regulation of cell motility involved in somitogenic axis elongation(GO:0090249) |
| 1.8 | 33.4 | GO:0015701 | bicarbonate transport(GO:0015701) |
| 1.5 | 4.4 | GO:0070433 | negative regulation of nucleotide-binding oligomerization domain containing signaling pathway(GO:0070425) negative regulation of nucleotide-binding oligomerization domain containing 2 signaling pathway(GO:0070433) |
| 1.3 | 3.9 | GO:0043323 | positive regulation of natural killer cell degranulation(GO:0043323) |
| 1.3 | 5.1 | GO:1903225 | negative regulation of endodermal cell differentiation(GO:1903225) |
| 1.2 | 4.9 | GO:0035694 | mitochondrial protein catabolic process(GO:0035694) |
| 1.2 | 8.4 | GO:2000371 | phosphatidylserine exposure on apoptotic cell surface(GO:0070782) regulation of DNA topoisomerase (ATP-hydrolyzing) activity(GO:2000371) positive regulation of DNA topoisomerase (ATP-hydrolyzing) activity(GO:2000373) |
| 1.2 | 34.1 | GO:0042036 | negative regulation of cytokine biosynthetic process(GO:0042036) |
| 1.1 | 3.2 | GO:0001969 | activation of membrane attack complex(GO:0001905) regulation of activation of membrane attack complex(GO:0001969) |
| 1.0 | 3.1 | GO:0033869 | coenzyme A catabolic process(GO:0015938) nucleoside bisphosphate catabolic process(GO:0033869) ribonucleoside bisphosphate catabolic process(GO:0034031) purine nucleoside bisphosphate catabolic process(GO:0034034) acetyl-CoA catabolic process(GO:0046356) |
| 0.9 | 4.4 | GO:0015801 | aromatic amino acid transport(GO:0015801) |
| 0.8 | 6.9 | GO:0060174 | limb bud formation(GO:0060174) |
| 0.8 | 4.6 | GO:1900041 | negative regulation of interleukin-2 secretion(GO:1900041) |
| 0.8 | 6.8 | GO:0052697 | xenobiotic glucuronidation(GO:0052697) |
| 0.8 | 4.5 | GO:0098912 | membrane depolarization during atrial cardiac muscle cell action potential(GO:0098912) |
| 0.8 | 3.0 | GO:0051643 | endoplasmic reticulum localization(GO:0051643) |
| 0.6 | 2.6 | GO:0061107 | seminal vesicle development(GO:0061107) |
| 0.6 | 1.7 | GO:0036066 | protein O-linked fucosylation(GO:0036066) |
| 0.5 | 8.0 | GO:0048681 | negative regulation of axon regeneration(GO:0048681) |
| 0.5 | 3.1 | GO:0048386 | positive regulation of retinoic acid receptor signaling pathway(GO:0048386) |
| 0.5 | 2.4 | GO:0000707 | meiotic DNA recombinase assembly(GO:0000707) |
| 0.5 | 8.0 | GO:0003334 | keratinocyte development(GO:0003334) |
| 0.5 | 3.3 | GO:0006824 | cobalt ion transport(GO:0006824) |
| 0.5 | 3.7 | GO:0090110 | cargo loading into COPII-coated vesicle(GO:0090110) |
| 0.5 | 12.8 | GO:0090190 | positive regulation of branching involved in ureteric bud morphogenesis(GO:0090190) |
| 0.4 | 4.1 | GO:0045144 | meiotic sister chromatid segregation(GO:0045144) meiotic sister chromatid cohesion(GO:0051177) |
| 0.4 | 4.0 | GO:0010459 | negative regulation of heart rate(GO:0010459) |
| 0.4 | 0.4 | GO:0021502 | neural fold elevation formation(GO:0021502) |
| 0.4 | 5.7 | GO:0042438 | melanin biosynthetic process(GO:0042438) |
| 0.4 | 1.1 | GO:0044726 | protection of DNA demethylation of female pronucleus(GO:0044726) |
| 0.4 | 4.2 | GO:0034975 | protein folding in endoplasmic reticulum(GO:0034975) |
| 0.3 | 1.0 | GO:0021530 | spinal cord oligodendrocyte cell differentiation(GO:0021529) spinal cord oligodendrocyte cell fate specification(GO:0021530) |
| 0.3 | 6.3 | GO:0001771 | immunological synapse formation(GO:0001771) |
| 0.3 | 1.0 | GO:0045425 | regulation of interleukin-3 production(GO:0032672) positive regulation of interleukin-3 production(GO:0032752) interleukin-3 biosynthetic process(GO:0042223) regulation of interleukin-3 biosynthetic process(GO:0045399) positive regulation of interleukin-3 biosynthetic process(GO:0045401) positive regulation of granulocyte macrophage colony-stimulating factor biosynthetic process(GO:0045425) |
| 0.3 | 5.2 | GO:0036159 | inner dynein arm assembly(GO:0036159) |
| 0.3 | 1.5 | GO:0060005 | vestibular reflex(GO:0060005) |
| 0.3 | 2.1 | GO:0072757 | cellular response to camptothecin(GO:0072757) |
| 0.3 | 1.2 | GO:0045226 | hyaluranon cable assembly(GO:0036118) extracellular polysaccharide biosynthetic process(GO:0045226) extracellular polysaccharide metabolic process(GO:0046379) regulation of hyaluranon cable assembly(GO:1900104) positive regulation of hyaluranon cable assembly(GO:1900106) |
| 0.3 | 7.1 | GO:2001224 | positive regulation of neuron migration(GO:2001224) |
| 0.3 | 2.4 | GO:0048194 | Golgi vesicle budding(GO:0048194) |
| 0.3 | 1.6 | GO:0050917 | sensory perception of umami taste(GO:0050917) |
| 0.2 | 1.0 | GO:0032701 | negative regulation of interleukin-18 production(GO:0032701) |
| 0.2 | 0.7 | GO:0072695 | negative regulation of DNA recombination at telomere(GO:0048239) regulation of DNA recombination at telomere(GO:0072695) |
| 0.2 | 6.0 | GO:0000188 | inactivation of MAPK activity(GO:0000188) |
| 0.2 | 2.9 | GO:0007320 | insemination(GO:0007320) |
| 0.2 | 16.1 | GO:0038083 | peptidyl-tyrosine autophosphorylation(GO:0038083) |
| 0.2 | 1.9 | GO:0019896 | axonal transport of mitochondrion(GO:0019896) |
| 0.2 | 1.9 | GO:0034454 | microtubule anchoring at centrosome(GO:0034454) |
| 0.2 | 3.7 | GO:0048268 | clathrin coat assembly(GO:0048268) |
| 0.2 | 0.9 | GO:2000354 | regulation of ovarian follicle development(GO:2000354) |
| 0.2 | 4.0 | GO:0006120 | mitochondrial electron transport, NADH to ubiquinone(GO:0006120) |
| 0.2 | 2.9 | GO:0031987 | locomotion involved in locomotory behavior(GO:0031987) |
| 0.2 | 0.7 | GO:0045347 | negative regulation of MHC class II biosynthetic process(GO:0045347) |
| 0.2 | 1.2 | GO:0070317 | negative regulation of G0 to G1 transition(GO:0070317) |
| 0.2 | 8.9 | GO:0006493 | protein O-linked glycosylation(GO:0006493) |
| 0.2 | 1.3 | GO:0010606 | positive regulation of cytoplasmic mRNA processing body assembly(GO:0010606) |
| 0.1 | 5.5 | GO:0042775 | mitochondrial ATP synthesis coupled electron transport(GO:0042775) |
| 0.1 | 2.9 | GO:0001833 | inner cell mass cell proliferation(GO:0001833) |
| 0.1 | 3.0 | GO:0046827 | positive regulation of protein export from nucleus(GO:0046827) |
| 0.1 | 0.4 | GO:0035993 | deltoid tuberosity development(GO:0035993) |
| 0.1 | 2.0 | GO:0006622 | protein targeting to lysosome(GO:0006622) |
| 0.1 | 0.4 | GO:0002540 | leukotriene production involved in inflammatory response(GO:0002540) |
| 0.1 | 0.3 | GO:0035022 | positive regulation of Rac protein signal transduction(GO:0035022) |
| 0.1 | 4.5 | GO:0008347 | glial cell migration(GO:0008347) |
| 0.1 | 0.9 | GO:0035865 | cellular response to potassium ion(GO:0035865) |
| 0.1 | 4.2 | GO:0010633 | negative regulation of epithelial cell migration(GO:0010633) |
| 0.1 | 0.7 | GO:0030277 | maintenance of gastrointestinal epithelium(GO:0030277) |
| 0.1 | 4.2 | GO:1902807 | negative regulation of cell cycle G1/S phase transition(GO:1902807) |
| 0.1 | 3.7 | GO:0045454 | cell redox homeostasis(GO:0045454) |
| 0.1 | 0.6 | GO:0002430 | complement receptor mediated signaling pathway(GO:0002430) |
| 0.1 | 1.7 | GO:0060441 | epithelial tube branching involved in lung morphogenesis(GO:0060441) |
| 0.0 | 1.7 | GO:0032212 | positive regulation of telomere maintenance via telomerase(GO:0032212) |
| 0.0 | 2.4 | GO:0043407 | negative regulation of MAP kinase activity(GO:0043407) |
| 0.0 | 3.3 | GO:1900181 | negative regulation of protein localization to nucleus(GO:1900181) |
| 0.0 | 9.5 | GO:0016197 | endosomal transport(GO:0016197) |
| 0.0 | 7.9 | GO:0090002 | establishment of protein localization to plasma membrane(GO:0090002) |
| 0.0 | 2.1 | GO:0045576 | mast cell activation(GO:0045576) |
| 0.0 | 15.3 | GO:0019221 | cytokine-mediated signaling pathway(GO:0019221) |
| 0.0 | 7.4 | GO:0030336 | negative regulation of cell migration(GO:0030336) |
| 0.0 | 0.7 | GO:0016180 | snRNA processing(GO:0016180) |
| 0.0 | 0.7 | GO:0060038 | cardiac muscle cell proliferation(GO:0060038) |
| 0.0 | 28.8 | GO:0006508 | proteolysis(GO:0006508) |
| 0.0 | 5.3 | GO:0032496 | response to lipopolysaccharide(GO:0032496) |
| 0.0 | 1.2 | GO:0016575 | histone deacetylation(GO:0016575) |
| 0.0 | 0.1 | GO:0002184 | cytoplasmic translational termination(GO:0002184) |
| 0.0 | 1.6 | GO:0002244 | hematopoietic progenitor cell differentiation(GO:0002244) |
Gene overrepresentation in cellular component category:
| Log-likelihood per target | Total log-likelihood | Term | Description |
|---|---|---|---|
| 11.1 | 55.4 | GO:0097425 | smooth endoplasmic reticulum membrane(GO:0030868) smooth endoplasmic reticulum part(GO:0097425) |
| 2.6 | 12.8 | GO:0031265 | CD95 death-inducing signaling complex(GO:0031265) |
| 1.4 | 11.4 | GO:0097197 | tetraspanin-enriched microdomain(GO:0097197) |
| 1.3 | 4.0 | GO:0005943 | phosphatidylinositol 3-kinase complex, class IA(GO:0005943) |
| 1.3 | 5.2 | GO:0036156 | inner dynein arm(GO:0036156) |
| 1.3 | 5.1 | GO:0005588 | collagen type V trimer(GO:0005588) |
| 1.1 | 4.6 | GO:0020005 | symbiont-containing vacuole membrane(GO:0020005) |
| 1.0 | 3.0 | GO:0042642 | actomyosin, myosin complex part(GO:0042642) |
| 1.0 | 14.1 | GO:0012510 | trans-Golgi network transport vesicle membrane(GO:0012510) |
| 1.0 | 3.9 | GO:0061474 | phagolysosome membrane(GO:0061474) |
| 0.7 | 8.5 | GO:0046581 | intercellular canaliculus(GO:0046581) |
| 0.6 | 5.7 | GO:0045009 | melanosome membrane(GO:0033162) chitosome(GO:0045009) |
| 0.5 | 7.4 | GO:0016580 | Sin3 complex(GO:0016580) |
| 0.5 | 2.4 | GO:0033063 | Rad51B-Rad51C-Rad51D-XRCC2 complex(GO:0033063) |
| 0.5 | 3.2 | GO:0005579 | membrane attack complex(GO:0005579) |
| 0.4 | 1.2 | GO:0036117 | hyaluranon cable(GO:0036117) |
| 0.4 | 4.2 | GO:0034663 | endoplasmic reticulum chaperone complex(GO:0034663) |
| 0.4 | 4.5 | GO:1990454 | L-type voltage-gated calcium channel complex(GO:1990454) |
| 0.3 | 3.3 | GO:0072546 | ER membrane protein complex(GO:0072546) |
| 0.3 | 1.3 | GO:0030015 | CCR4-NOT core complex(GO:0030015) |
| 0.2 | 5.1 | GO:0005671 | Ada2/Gcn5/Ada3 transcription activator complex(GO:0005671) |
| 0.2 | 0.9 | GO:1990005 | granular vesicle(GO:1990005) |
| 0.2 | 2.6 | GO:0031232 | extrinsic component of external side of plasma membrane(GO:0031232) |
| 0.2 | 8.7 | GO:0005834 | heterotrimeric G-protein complex(GO:0005834) |
| 0.2 | 4.4 | GO:0030056 | hemidesmosome(GO:0030056) |
| 0.2 | 5.6 | GO:0000159 | protein phosphatase type 2A complex(GO:0000159) |
| 0.2 | 1.2 | GO:0070822 | Sin3-type complex(GO:0070822) |
| 0.2 | 9.5 | GO:0045271 | mitochondrial respiratory chain complex I(GO:0005747) NADH dehydrogenase complex(GO:0030964) respiratory chain complex I(GO:0045271) |
| 0.2 | 2.9 | GO:0042589 | zymogen granule membrane(GO:0042589) |
| 0.2 | 4.9 | GO:0031307 | integral component of mitochondrial outer membrane(GO:0031307) |
| 0.2 | 8.0 | GO:0044295 | axonal growth cone(GO:0044295) |
| 0.2 | 33.5 | GO:0005770 | late endosome(GO:0005770) |
| 0.2 | 16.4 | GO:0031234 | extrinsic component of cytoplasmic side of plasma membrane(GO:0031234) |
| 0.1 | 35.5 | GO:0016323 | basolateral plasma membrane(GO:0016323) |
| 0.1 | 8.9 | GO:0005788 | endoplasmic reticulum lumen(GO:0005788) |
| 0.1 | 1.1 | GO:0001940 | male pronucleus(GO:0001940) |
| 0.1 | 1.5 | GO:0032426 | stereocilium tip(GO:0032426) |
| 0.1 | 5.4 | GO:0042470 | melanosome(GO:0042470) pigment granule(GO:0048770) |
| 0.1 | 3.8 | GO:0016235 | aggresome(GO:0016235) |
| 0.1 | 94.0 | GO:0005887 | integral component of plasma membrane(GO:0005887) |
| 0.1 | 33.5 | GO:0005667 | transcription factor complex(GO:0005667) |
| 0.1 | 4.1 | GO:0000795 | synaptonemal complex(GO:0000795) |
| 0.1 | 7.9 | GO:0005923 | bicellular tight junction(GO:0005923) |
| 0.1 | 1.4 | GO:0005614 | interstitial matrix(GO:0005614) |
| 0.1 | 4.4 | GO:0005913 | cell-cell adherens junction(GO:0005913) |
| 0.1 | 1.7 | GO:0016459 | myosin complex(GO:0016459) |
| 0.1 | 1.7 | GO:0005697 | telomerase holoenzyme complex(GO:0005697) |
| 0.1 | 0.4 | GO:0005641 | nuclear envelope lumen(GO:0005641) |
| 0.1 | 1.9 | GO:1904115 | axon cytoplasm(GO:1904115) |
| 0.1 | 1.5 | GO:0005763 | organellar small ribosomal subunit(GO:0000314) mitochondrial small ribosomal subunit(GO:0005763) |
| 0.1 | 0.7 | GO:0000783 | telomere cap complex(GO:0000782) nuclear telomere cap complex(GO:0000783) |
| 0.0 | 28.2 | GO:0098796 | membrane protein complex(GO:0098796) |
| 0.0 | 13.6 | GO:0005759 | mitochondrial matrix(GO:0005759) |
| 0.0 | 2.9 | GO:0032580 | Golgi cisterna membrane(GO:0032580) |
| 0.0 | 1.7 | GO:0005801 | cis-Golgi network(GO:0005801) |
| 0.0 | 0.7 | GO:0032039 | integrator complex(GO:0032039) |
| 0.0 | 0.2 | GO:0031931 | TORC1 complex(GO:0031931) |
| 0.0 | 3.0 | GO:0005884 | actin filament(GO:0005884) |
| 0.0 | 3.1 | GO:0016605 | PML body(GO:0016605) |
| 0.0 | 13.3 | GO:0016604 | nuclear body(GO:0016604) |
| 0.0 | 5.1 | GO:0031252 | cell leading edge(GO:0031252) |
| 0.0 | 2.1 | GO:0005802 | trans-Golgi network(GO:0005802) |
| 0.0 | 4.7 | GO:0005925 | focal adhesion(GO:0005925) |
| 0.0 | 6.0 | GO:0009986 | cell surface(GO:0009986) |
| 0.0 | 30.9 | GO:0070062 | extracellular exosome(GO:0070062) |
| 0.0 | 0.1 | GO:0018444 | translation release factor complex(GO:0018444) |
Gene overrepresentation in molecular function category:
| Log-likelihood per target | Total log-likelihood | Term | Description |
|---|---|---|---|
| 7.9 | 55.4 | GO:0004332 | fructose-bisphosphate aldolase activity(GO:0004332) |
| 5.6 | 33.4 | GO:0015106 | bicarbonate transmembrane transporter activity(GO:0015106) |
| 4.7 | 19.0 | GO:0016160 | amylase activity(GO:0016160) |
| 3.3 | 40.1 | GO:0016290 | palmitoyl-CoA hydrolase activity(GO:0016290) |
| 2.3 | 37.1 | GO:0008271 | secondary active sulfate transmembrane transporter activity(GO:0008271) |
| 1.9 | 15.5 | GO:0030368 | interleukin-17 receptor activity(GO:0030368) |
| 1.8 | 8.9 | GO:0016262 | protein N-acetylglucosaminyltransferase activity(GO:0016262) |
| 1.7 | 8.5 | GO:0090555 | phosphatidylethanolamine-translocating ATPase activity(GO:0090555) |
| 1.2 | 4.9 | GO:0019002 | GMP binding(GO:0019002) |
| 1.0 | 4.0 | GO:0043125 | ErbB-3 class receptor binding(GO:0043125) |
| 1.0 | 12.8 | GO:0097200 | cysteine-type endopeptidase activity involved in execution phase of apoptosis(GO:0097200) |
| 0.9 | 4.4 | GO:0005176 | ErbB-2 class receptor binding(GO:0005176) |
| 0.8 | 3.3 | GO:0015087 | cobalt ion transmembrane transporter activity(GO:0015087) |
| 0.8 | 12.6 | GO:0005542 | folic acid binding(GO:0005542) |
| 0.8 | 3.1 | GO:0003986 | acetyl-CoA hydrolase activity(GO:0003986) |
| 0.8 | 4.5 | GO:0086056 | voltage-gated calcium channel activity involved in AV node cell action potential(GO:0086056) |
| 0.7 | 4.4 | GO:0015173 | aromatic amino acid transmembrane transporter activity(GO:0015173) |
| 0.7 | 8.0 | GO:0039706 | co-receptor binding(GO:0039706) |
| 0.6 | 28.3 | GO:0016831 | carboxy-lyase activity(GO:0016831) |
| 0.6 | 8.4 | GO:0042609 | CD4 receptor binding(GO:0042609) |
| 0.6 | 7.1 | GO:0030215 | semaphorin receptor binding(GO:0030215) |
| 0.5 | 7.1 | GO:0042301 | phosphate ion binding(GO:0042301) |
| 0.5 | 6.9 | GO:0017154 | semaphorin receptor activity(GO:0017154) |
| 0.5 | 61.0 | GO:0004222 | metalloendopeptidase activity(GO:0004222) |
| 0.5 | 4.9 | GO:0016861 | intramolecular oxidoreductase activity, interconverting aldoses and ketoses(GO:0016861) |
| 0.5 | 6.0 | GO:0005225 | volume-sensitive anion channel activity(GO:0005225) |
| 0.4 | 3.1 | GO:0005173 | stem cell factor receptor binding(GO:0005173) |
| 0.4 | 3.7 | GO:0032050 | clathrin heavy chain binding(GO:0032050) |
| 0.4 | 2.9 | GO:0035375 | zymogen binding(GO:0035375) |
| 0.4 | 2.8 | GO:0004957 | prostaglandin E receptor activity(GO:0004957) |
| 0.4 | 2.4 | GO:0000150 | recombinase activity(GO:0000150) |
| 0.3 | 1.3 | GO:0001226 | RNA polymerase II transcription corepressor binding(GO:0001226) |
| 0.3 | 16.1 | GO:0004715 | non-membrane spanning protein tyrosine kinase activity(GO:0004715) |
| 0.3 | 4.2 | GO:0051787 | oxidoreductase activity, acting on a sulfur group of donors, disulfide as acceptor(GO:0016671) misfolded protein binding(GO:0051787) |
| 0.3 | 3.1 | GO:0019966 | interleukin-1 binding(GO:0019966) |
| 0.2 | 1.2 | GO:0050501 | hyaluronan synthase activity(GO:0050501) |
| 0.2 | 4.9 | GO:0098641 | cadherin binding involved in cell-cell adhesion(GO:0098641) |
| 0.2 | 6.8 | GO:0015020 | glucuronosyltransferase activity(GO:0015020) |
| 0.2 | 1.7 | GO:0003720 | telomerase activity(GO:0003720) RNA-directed DNA polymerase activity(GO:0003964) |
| 0.2 | 4.5 | GO:0004198 | calcium-dependent cysteine-type endopeptidase activity(GO:0004198) |
| 0.2 | 4.5 | GO:0005540 | hyaluronic acid binding(GO:0005540) |
| 0.2 | 2.9 | GO:0017017 | MAP kinase tyrosine/serine/threonine phosphatase activity(GO:0017017) |
| 0.2 | 9.4 | GO:0005160 | transforming growth factor beta receptor binding(GO:0005160) |
| 0.2 | 1.5 | GO:0008381 | mechanically-gated ion channel activity(GO:0008381) mechanically gated channel activity(GO:0022833) |
| 0.2 | 3.0 | GO:0043008 | ATP-dependent protein binding(GO:0043008) |
| 0.2 | 1.0 | GO:0019767 | IgE receptor activity(GO:0019767) |
| 0.1 | 4.0 | GO:0050136 | NADH dehydrogenase (ubiquinone) activity(GO:0008137) NADH dehydrogenase (quinone) activity(GO:0050136) |
| 0.1 | 34.8 | GO:0061630 | ubiquitin protein ligase activity(GO:0061630) |
| 0.1 | 2.0 | GO:0008484 | sulfuric ester hydrolase activity(GO:0008484) |
| 0.1 | 0.4 | GO:0070700 | BMP receptor binding(GO:0070700) |
| 0.1 | 0.4 | GO:0004051 | arachidonate 5-lipoxygenase activity(GO:0004051) |
| 0.1 | 1.0 | GO:0003996 | acyl-CoA ligase activity(GO:0003996) |
| 0.1 | 1.9 | GO:0050811 | GABA receptor binding(GO:0050811) |
| 0.1 | 2.4 | GO:0070273 | phosphatidylinositol-4-phosphate binding(GO:0070273) |
| 0.1 | 0.6 | GO:0004982 | N-formyl peptide receptor activity(GO:0004982) |
| 0.1 | 2.0 | GO:0005545 | 1-phosphatidylinositol binding(GO:0005545) |
| 0.1 | 5.1 | GO:0005201 | extracellular matrix structural constituent(GO:0005201) |
| 0.1 | 2.4 | GO:0031435 | mitogen-activated protein kinase kinase kinase binding(GO:0031435) |
| 0.1 | 0.2 | GO:0005483 | soluble NSF attachment protein activity(GO:0005483) |
| 0.1 | 10.4 | GO:0004497 | monooxygenase activity(GO:0004497) |
| 0.1 | 0.2 | GO:0001605 | adrenomedullin receptor activity(GO:0001605) |
| 0.1 | 1.7 | GO:0004190 | aspartic-type endopeptidase activity(GO:0004190) aspartic-type peptidase activity(GO:0070001) |
| 0.1 | 0.7 | GO:0043047 | single-stranded telomeric DNA binding(GO:0043047) |
| 0.1 | 3.8 | GO:0000049 | tRNA binding(GO:0000049) |
| 0.1 | 16.9 | GO:0003924 | GTPase activity(GO:0003924) |
| 0.0 | 1.4 | GO:0015269 | calcium-activated potassium channel activity(GO:0015269) |
| 0.0 | 4.2 | GO:0003777 | microtubule motor activity(GO:0003777) |
| 0.0 | 0.8 | GO:0005229 | intracellular calcium activated chloride channel activity(GO:0005229) |
| 0.0 | 12.7 | GO:0001077 | transcriptional activator activity, RNA polymerase II core promoter proximal region sequence-specific binding(GO:0001077) |
| 0.0 | 1.0 | GO:0071837 | HMG box domain binding(GO:0071837) |
| 0.0 | 1.2 | GO:0004407 | histone deacetylase activity(GO:0004407) |
| 0.0 | 0.7 | GO:0005310 | dicarboxylic acid transmembrane transporter activity(GO:0005310) |
| 0.0 | 0.5 | GO:0008308 | voltage-gated anion channel activity(GO:0008308) |
| 0.0 | 3.0 | GO:0017124 | SH3 domain binding(GO:0017124) |
| 0.0 | 5.1 | GO:0005085 | guanyl-nucleotide exchange factor activity(GO:0005085) |
| 0.0 | 2.3 | GO:0030674 | protein binding, bridging(GO:0030674) |
| 0.0 | 2.9 | GO:0008201 | heparin binding(GO:0008201) |
| 0.0 | 1.1 | GO:0035064 | methylated histone binding(GO:0035064) |
| 0.0 | 4.9 | GO:0051020 | GTPase binding(GO:0051020) |
| 0.0 | 4.7 | GO:0030246 | carbohydrate binding(GO:0030246) |
| 0.0 | 0.4 | GO:0001205 | transcriptional activator activity, RNA polymerase II distal enhancer sequence-specific binding(GO:0001205) |
| 0.0 | 1.7 | GO:0005096 | GTPase activator activity(GO:0005096) |
Gene overrepresentation in curated gene sets: canonical pathways category:
| Log-likelihood per target | Total log-likelihood | Term | Description |
|---|---|---|---|
| 1.7 | 95.6 | PID HNF3B PATHWAY | FOXA2 and FOXA3 transcription factor networks |
| 1.2 | 12.8 | SA FAS SIGNALING | The TNF-type receptor Fas induces apoptosis on ligand binding. |
| 0.6 | 34.1 | PID NFAT TFPATHWAY | Calcineurin-regulated NFAT-dependent transcription in lymphocytes |
| 0.3 | 19.5 | PID FGF PATHWAY | FGF signaling pathway |
| 0.3 | 17.7 | PID AJDISS 2PATHWAY | Posttranslational regulation of adherens junction stability and dissassembly |
| 0.3 | 59.1 | NABA ECM REGULATORS | Genes encoding enzymes and their regulators involved in the remodeling of the extracellular matrix |
| 0.2 | 4.5 | PID TOLL ENDOGENOUS PATHWAY | Endogenous TLR signaling |
| 0.1 | 5.5 | PID HNF3A PATHWAY | FOXA1 transcription factor network |
| 0.1 | 5.1 | PID SYNDECAN 1 PATHWAY | Syndecan-1-mediated signaling events |
| 0.1 | 2.5 | PID ARF 3PATHWAY | Arf1 pathway |
| 0.1 | 14.8 | NABA ECM AFFILIATED | Genes encoding proteins affiliated structurally or functionally to extracellular matrix proteins |
| 0.1 | 3.1 | PID KIT PATHWAY | Signaling events mediated by Stem cell factor receptor (c-Kit) |
| 0.1 | 3.9 | PID FCER1 PATHWAY | Fc-epsilon receptor I signaling in mast cells |
| 0.1 | 2.9 | PID P38 ALPHA BETA PATHWAY | Regulation of p38-alpha and p38-beta |
| 0.1 | 4.9 | PID HIF1 TFPATHWAY | HIF-1-alpha transcription factor network |
| 0.1 | 3.7 | PID PLK1 PATHWAY | PLK1 signaling events |
| 0.1 | 3.9 | PID ERA GENOMIC PATHWAY | Validated nuclear estrogen receptor alpha network |
| 0.1 | 0.9 | PID AR NONGENOMIC PATHWAY | Nongenotropic Androgen signaling |
| 0.1 | 2.4 | PID TCR PATHWAY | TCR signaling in naïve CD4+ T cells |
| 0.0 | 2.0 | PID BMP PATHWAY | BMP receptor signaling |
| 0.0 | 8.9 | NABA SECRETED FACTORS | Genes encoding secreted soluble factors |
Gene overrepresentation in curated gene sets: REACTOME pathways category:
| Log-likelihood per target | Total log-likelihood | Term | Description |
|---|---|---|---|
| 3.2 | 19.0 | REACTOME DIGESTION OF DIETARY CARBOHYDRATE | Genes involved in Digestion of dietary carbohydrate |
| 3.1 | 28.3 | REACTOME TRYPTOPHAN CATABOLISM | Genes involved in Tryptophan catabolism |
| 2.6 | 37.1 | REACTOME BILE SALT AND ORGANIC ANION SLC TRANSPORTERS | Genes involved in Bile salt and organic anion SLC transporters |
| 1.5 | 55.4 | REACTOME GLYCOLYSIS | Genes involved in Glycolysis |
| 1.5 | 40.1 | REACTOME REGULATION OF GENE EXPRESSION IN BETA CELLS | Genes involved in Regulation of gene expression in beta cells |
| 0.9 | 12.8 | REACTOME EXTRINSIC PATHWAY FOR APOPTOSIS | Genes involved in Extrinsic Pathway for Apoptosis |
| 0.8 | 14.1 | REACTOME OTHER SEMAPHORIN INTERACTIONS | Genes involved in Other semaphorin interactions |
| 0.5 | 6.9 | REACTOME CS DS DEGRADATION | Genes involved in CS/DS degradation |
| 0.4 | 3.7 | REACTOME GAP JUNCTION DEGRADATION | Genes involved in Gap junction degradation |
| 0.4 | 6.8 | REACTOME GLUCURONIDATION | Genes involved in Glucuronidation |
| 0.4 | 2.8 | REACTOME PROSTANOID LIGAND RECEPTORS | Genes involved in Prostanoid ligand receptors |
| 0.3 | 7.1 | REACTOME G BETA GAMMA SIGNALLING THROUGH PLC BETA | Genes involved in G beta:gamma signalling through PLC beta |
| 0.3 | 4.0 | REACTOME IL 7 SIGNALING | Genes involved in Interleukin-7 signaling |
| 0.2 | 8.0 | REACTOME MYOGENESIS | Genes involved in Myogenesis |
| 0.2 | 24.3 | REACTOME TRANSPORT OF INORGANIC CATIONS ANIONS AND AMINO ACIDS OLIGOPEPTIDES | Genes involved in Transport of inorganic cations/anions and amino acids/oligopeptides |
| 0.1 | 2.1 | REACTOME SIGNAL REGULATORY PROTEIN SIRP FAMILY INTERACTIONS | Genes involved in Signal regulatory protein (SIRP) family interactions |
| 0.1 | 15.8 | REACTOME SIGNALING BY FGFR | Genes involved in Signaling by FGFR |
| 0.1 | 5.1 | REACTOME NCAM1 INTERACTIONS | Genes involved in NCAM1 interactions |
| 0.1 | 3.0 | REACTOME INSULIN SYNTHESIS AND PROCESSING | Genes involved in Insulin Synthesis and Processing |
| 0.1 | 4.8 | REACTOME INTERFERON GAMMA SIGNALING | Genes involved in Interferon gamma signaling |
| 0.1 | 1.2 | REACTOME HYALURONAN METABOLISM | Genes involved in Hyaluronan metabolism |
| 0.1 | 5.5 | REACTOME RESPIRATORY ELECTRON TRANSPORT | Genes involved in Respiratory electron transport |
| 0.1 | 0.9 | REACTOME HORMONE LIGAND BINDING RECEPTORS | Genes involved in Hormone ligand-binding receptors |
| 0.1 | 2.0 | REACTOME SIGNALING BY BMP | Genes involved in Signaling by BMP |
| 0.1 | 1.3 | REACTOME DEADENYLATION OF MRNA | Genes involved in Deadenylation of mRNA |
| 0.0 | 0.7 | REACTOME TERMINATION OF O GLYCAN BIOSYNTHESIS | Genes involved in Termination of O-glycan biosynthesis |
| 0.0 | 5.1 | REACTOME FACTORS INVOLVED IN MEGAKARYOCYTE DEVELOPMENT AND PLATELET PRODUCTION | Genes involved in Factors involved in megakaryocyte development and platelet production |
| 0.0 | 1.4 | REACTOME COMPLEMENT CASCADE | Genes involved in Complement cascade |
| 0.0 | 1.7 | REACTOME MHC CLASS II ANTIGEN PRESENTATION | Genes involved in MHC class II antigen presentation |
| 0.0 | 3.4 | REACTOME GENERIC TRANSCRIPTION PATHWAY | Genes involved in Generic Transcription Pathway |