Project
GSE53960: rat RNA-Seq transcriptomic Bodymap
Navigation
Downloads
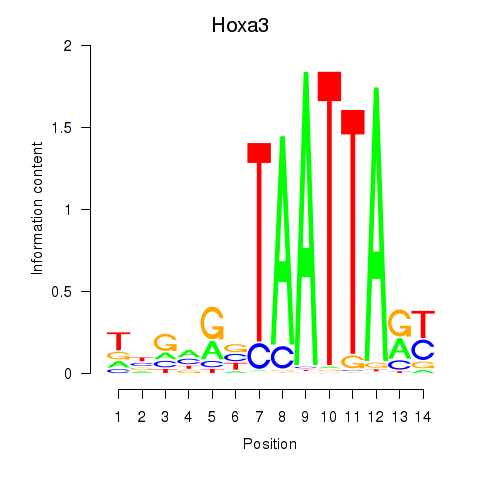
Results for Hoxa3
Z-value: 0.30
Motif logo
Transcription factors associated with Hoxa3
| Gene Symbol | Gene ID | Gene Info |
|---|---|---|
|
Hoxa3
|
ENSRNOG00000006281 | homeobox A3 |
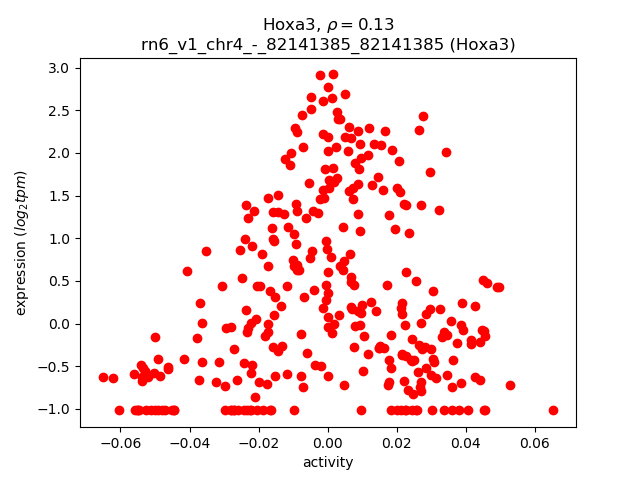
Activity-expression correlation:
| Gene | Promoter | Pearson corr. coef. | P-value | Plot |
|---|---|---|---|---|
| Hoxa3 | rn6_v1_chr4_-_82141385_82141385 | 0.13 | 2.4e-02 | Click! |
Activity profile of Hoxa3 motif
Sorted Z-values of Hoxa3 motif
| Promoter | Log-likelihood | Transcript | Gene | Gene Info |
|---|---|---|---|---|
| chr4_-_170740274 | 10.32 |
ENSRNOT00000012212
|
Gucy2c
|
guanylate cyclase 2C |
| chr9_-_119190698 | 7.89 |
ENSRNOT00000021534
|
Tgif1
|
TGFB-induced factor homeobox 1 |
| chr16_+_2634603 | 7.03 |
ENSRNOT00000019113
|
Hesx1
|
HESX homeobox 1 |
| chr17_-_84247038 | 6.45 |
ENSRNOT00000068553
|
Nebl
|
nebulette |
| chr8_+_22648323 | 5.77 |
ENSRNOT00000013165
|
Smarca4
|
SWI/SNF related, matrix associated, actin dependent regulator of chromatin, subfamily a, member 4 |
| chr12_-_45801842 | 5.76 |
ENSRNOT00000078837
|
AABR07036513.1
|
|
| chr1_-_101095594 | 5.63 |
ENSRNOT00000027944
|
Fcgrt
|
Fc fragment of IgG receptor and transporter |
| chr3_-_165537940 | 5.07 |
ENSRNOT00000071119
ENSRNOT00000070964 |
Sall4
|
spalt-like transcription factor 4 |
| chr7_-_73130740 | 4.58 |
ENSRNOT00000075584
|
9430069I07Rik
|
RIKEN cDNA 9430069I07 gene |
| chr12_-_47142852 | 3.97 |
ENSRNOT00000001591
|
Pop5
|
POP5 homolog, ribonuclease P/MRP subunit |
| chr2_+_266315036 | 3.74 |
ENSRNOT00000055245
|
Wls
|
wntless Wnt ligand secretion mediator |
| chr10_+_61685645 | 3.64 |
ENSRNOT00000003933
|
Mnt
|
MAX network transcriptional repressor |
| chr7_-_143016040 | 3.59 |
ENSRNOT00000029697
|
Krt80
|
keratin 80 |
| chr3_-_90751055 | 3.45 |
ENSRNOT00000040741
|
LOC499843
|
LRRGT00091 |
| chr20_+_45458558 | 2.80 |
ENSRNOT00000000713
|
Cdk19
|
cyclin-dependent kinase 19 |
| chr20_+_42966140 | 2.51 |
ENSRNOT00000000707
|
Marcks
|
myristoylated alanine rich protein kinase C substrate |
| chr10_-_87468711 | 2.27 |
ENSRNOT00000039983
|
Krtap3-3
|
keratin associated protein 3-3 |
| chr5_-_102743417 | 2.27 |
ENSRNOT00000067389
|
Bnc2
|
basonuclin 2 |
| chr7_-_126382449 | 2.18 |
ENSRNOT00000085540
|
7530416G11Rik
|
RIKEN cDNA 7530416G11 gene |
| chr6_+_80108655 | 2.12 |
ENSRNOT00000006137
|
Gemin2
|
gem (nuclear organelle) associated protein 2 |
| chr4_+_147832136 | 1.96 |
ENSRNOT00000064603
|
Rho
|
rhodopsin |
| chr4_-_88684415 | 1.80 |
ENSRNOT00000009001
|
LOC500148
|
similar to 40S ribosomal protein S7 (S8) |
| chr14_+_23405717 | 1.72 |
ENSRNOT00000029805
|
Tmprss11c
|
transmembrane protease, serine 11C |
| chr1_-_220938814 | 1.57 |
ENSRNOT00000028081
|
Ovol1
|
ovo like transcriptional repressor 1 |
| chr6_-_108660063 | 1.43 |
ENSRNOT00000006240
|
Arel1
|
apoptosis resistant E3 ubiquitin protein ligase 1 |
| chr2_-_158133861 | 1.17 |
ENSRNOT00000090700
|
Veph1
|
ventricular zone expressed PH domain-containing 1 |
| chr1_-_276228574 | 1.08 |
ENSRNOT00000021746
|
Gucy2g
|
guanylate cyclase 2G |
| chr2_-_185852759 | 0.69 |
ENSRNOT00000049461
|
Mab21l2
|
mab-21 like 2 |
| chr10_-_88000423 | 0.63 |
ENSRNOT00000076787
ENSRNOT00000046751 ENSRNOT00000091394 |
Krt32
|
keratin 32 |
| chr3_-_104018861 | 0.52 |
ENSRNOT00000008387
|
Chrm5
|
cholinergic receptor, muscarinic 5 |
| chr1_+_167758636 | 0.39 |
ENSRNOT00000024957
|
Olr46
|
olfactory receptor 46 |
| chr2_-_33025271 | 0.37 |
ENSRNOT00000074941
|
NEWGENE_1310139
|
microtubule associated serine/threonine kinase family member 4 |
| chr2_-_170301348 | 0.33 |
ENSRNOT00000088131
|
Si
|
sucrase-isomaltase |
| chr11_-_32550539 | 0.29 |
ENSRNOT00000002715
|
Rcan1
|
regulator of calcineurin 1 |
| chr18_+_16544508 | 0.23 |
ENSRNOT00000020601
|
Elp2
|
elongator acetyltransferase complex subunit 2 |
Network of associatons between targets according to the STRING database.

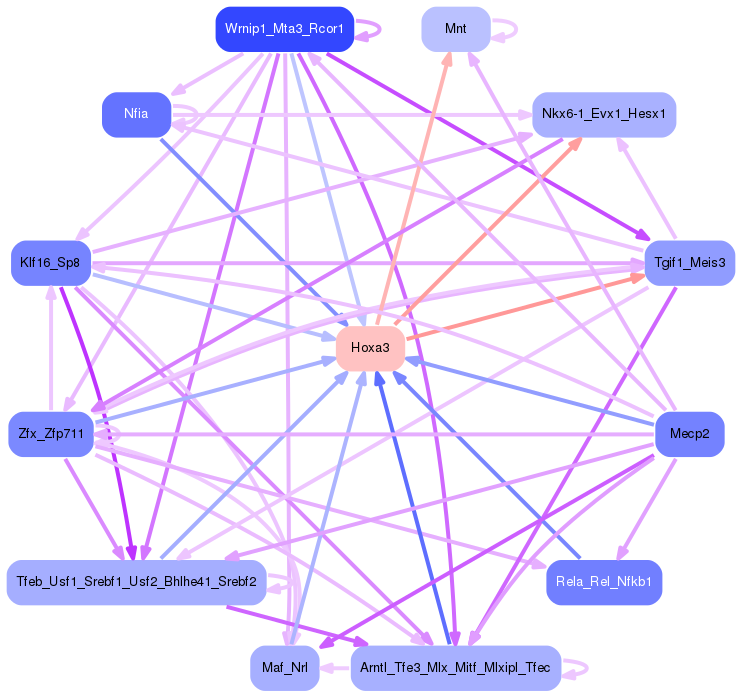
First level regulatory network of Hoxa3
Gene Ontology Analysis
Gene overrepresentation in biological process category:
| Log-likelihood per target | Total log-likelihood | Term | Description |
|---|---|---|---|
| 2.1 | 6.4 | GO:0071691 | cardiac muscle thin filament assembly(GO:0071691) |
| 1.9 | 5.8 | GO:1902659 | regulation of glucose mediated signaling pathway(GO:1902659) |
| 1.2 | 3.7 | GO:0061357 | positive regulation of Wnt protein secretion(GO:0061357) |
| 1.0 | 7.0 | GO:0030916 | otic vesicle formation(GO:0030916) |
| 0.9 | 7.9 | GO:0048387 | negative regulation of retinoic acid receptor signaling pathway(GO:0048387) |
| 0.4 | 5.6 | GO:0038094 | Fc-gamma receptor signaling pathway(GO:0038094) |
| 0.4 | 2.5 | GO:0031584 | activation of phospholipase D activity(GO:0031584) regulation of protein kinase C activity(GO:1900019) positive regulation of protein kinase C activity(GO:1900020) |
| 0.3 | 1.6 | GO:1901994 | negative regulation of meiotic cell cycle phase transition(GO:1901994) |
| 0.3 | 5.1 | GO:0001833 | inner cell mass cell proliferation(GO:0001833) |
| 0.2 | 2.0 | GO:0016056 | rhodopsin mediated signaling pathway(GO:0016056) |
| 0.2 | 11.4 | GO:0006182 | cGMP biosynthetic process(GO:0006182) |
| 0.2 | 1.7 | GO:0097264 | self proteolysis(GO:0097264) |
| 0.1 | 0.5 | GO:0007197 | adenylate cyclase-inhibiting G-protein coupled acetylcholine receptor signaling pathway(GO:0007197) phospholipase C-activating G-protein coupled acetylcholine receptor signaling pathway(GO:0007207) |
| 0.1 | 2.3 | GO:0003416 | endochondral bone growth(GO:0003416) |
| 0.1 | 2.1 | GO:0000387 | spliceosomal snRNP assembly(GO:0000387) |
| 0.1 | 4.0 | GO:0090502 | RNA phosphodiester bond hydrolysis, endonucleolytic(GO:0090502) |
| 0.0 | 3.4 | GO:0006334 | nucleosome assembly(GO:0006334) |
| 0.0 | 3.6 | GO:0007569 | cell aging(GO:0007569) |
| 0.0 | 0.7 | GO:0010172 | embryonic body morphogenesis(GO:0010172) |
| 0.0 | 0.3 | GO:0034285 | response to sucrose(GO:0009744) response to disaccharide(GO:0034285) |
| 0.0 | 2.8 | GO:0050729 | positive regulation of inflammatory response(GO:0050729) |
| 0.0 | 0.3 | GO:0007614 | short-term memory(GO:0007614) |
| 0.0 | 0.2 | GO:0043248 | proteasome assembly(GO:0043248) |
Gene overrepresentation in cellular component category:
| Log-likelihood per target | Total log-likelihood | Term | Description |
|---|---|---|---|
| 1.0 | 5.8 | GO:0005726 | perichromatin fibrils(GO:0005726) |
| 0.7 | 4.0 | GO:0005655 | nucleolar ribonuclease P complex(GO:0005655) ribonuclease P complex(GO:0030677) multimeric ribonuclease P complex(GO:0030681) |
| 0.6 | 2.5 | GO:0042585 | germinal vesicle(GO:0042585) dendritic branch(GO:0044307) |
| 0.5 | 11.4 | GO:0008074 | guanylate cyclase complex, soluble(GO:0008074) |
| 0.3 | 2.1 | GO:0097504 | Gemini of coiled bodies(GO:0097504) |
| 0.2 | 3.6 | GO:0030057 | desmosome(GO:0030057) |
| 0.1 | 2.0 | GO:0042622 | photoreceptor outer segment membrane(GO:0042622) |
| 0.1 | 3.7 | GO:0032839 | dendrite cytoplasm(GO:0032839) |
| 0.1 | 6.4 | GO:0001725 | stress fiber(GO:0001725) contractile actin filament bundle(GO:0097517) |
| 0.1 | 2.8 | GO:0016592 | mediator complex(GO:0016592) |
| 0.0 | 5.1 | GO:0000792 | heterochromatin(GO:0000792) |
| 0.0 | 0.2 | GO:0033588 | Elongator holoenzyme complex(GO:0033588) |
| 0.0 | 2.3 | GO:0045095 | keratin filament(GO:0045095) |
Gene overrepresentation in molecular function category:
| Log-likelihood per target | Total log-likelihood | Term | Description |
|---|---|---|---|
| 1.1 | 5.6 | GO:0019770 | IgG receptor activity(GO:0019770) |
| 0.7 | 5.8 | GO:0001163 | RNA polymerase I regulatory region sequence-specific DNA binding(GO:0001163) RNA polymerase I CORE element sequence-specific DNA binding(GO:0001164) |
| 0.5 | 10.3 | GO:0015643 | toxic substance binding(GO:0015643) |
| 0.5 | 3.7 | GO:0031852 | mu-type opioid receptor binding(GO:0031852) |
| 0.5 | 7.9 | GO:0070410 | co-SMAD binding(GO:0070410) |
| 0.4 | 4.0 | GO:0004526 | ribonuclease P activity(GO:0004526) |
| 0.4 | 6.4 | GO:0005523 | tropomyosin binding(GO:0005523) |
| 0.2 | 2.0 | GO:0009881 | photoreceptor activity(GO:0009881) |
| 0.1 | 0.3 | GO:0004574 | oligo-1,6-glucosidase activity(GO:0004574) |
| 0.1 | 0.5 | GO:0016907 | G-protein coupled acetylcholine receptor activity(GO:0016907) |
| 0.1 | 2.8 | GO:0004693 | cyclin-dependent protein serine/threonine kinase activity(GO:0004693) |
| 0.1 | 0.3 | GO:0008597 | calcium-dependent protein serine/threonine phosphatase regulator activity(GO:0008597) |
| 0.1 | 8.6 | GO:0001078 | transcriptional repressor activity, RNA polymerase II core promoter proximal region sequence-specific binding(GO:0001078) |
| 0.0 | 3.6 | GO:0001227 | transcriptional repressor activity, RNA polymerase II transcription regulatory region sequence-specific binding(GO:0001227) |
| 0.0 | 1.1 | GO:0004383 | guanylate cyclase activity(GO:0004383) |
| 0.0 | 2.5 | GO:0001786 | phosphatidylserine binding(GO:0001786) |
| 0.0 | 0.2 | GO:0061133 | endopeptidase activator activity(GO:0061133) |
| 0.0 | 8.3 | GO:0005198 | structural molecule activity(GO:0005198) |
Gene overrepresentation in curated gene sets: canonical pathways category:
| Log-likelihood per target | Total log-likelihood | Term | Description |
|---|---|---|---|
| 0.3 | 5.8 | PID ERB GENOMIC PATHWAY | Validated nuclear estrogen receptor beta network |
| 0.1 | 7.9 | PID AR PATHWAY | Coregulation of Androgen receptor activity |
| 0.1 | 2.0 | PID RHODOPSIN PATHWAY | Visual signal transduction: Rods |
| 0.1 | 5.1 | PID BETA CATENIN NUC PATHWAY | Regulation of nuclear beta catenin signaling and target gene transcription |
| 0.0 | 0.2 | ST INTERFERON GAMMA PATHWAY | Interferon gamma pathway. |
Gene overrepresentation in curated gene sets: REACTOME pathways category:
| Log-likelihood per target | Total log-likelihood | Term | Description |
|---|---|---|---|
| 0.3 | 7.9 | REACTOME DOWNREGULATION OF SMAD2 3 SMAD4 TRANSCRIPTIONAL ACTIVITY | Genes involved in Downregulation of SMAD2/3:SMAD4 transcriptional activity |
| 0.3 | 2.5 | REACTOME REGULATION OF INSULIN SECRETION BY ACETYLCHOLINE | Genes involved in Regulation of Insulin Secretion by Acetylcholine |
| 0.2 | 2.0 | REACTOME OPSINS | Genes involved in Opsins |
| 0.1 | 0.3 | REACTOME DIGESTION OF DIETARY CARBOHYDRATE | Genes involved in Digestion of dietary carbohydrate |
| 0.0 | 2.1 | REACTOME METABOLISM OF NON CODING RNA | Genes involved in Metabolism of non-coding RNA |
| 0.0 | 2.8 | REACTOME TRANSCRIPTIONAL REGULATION OF WHITE ADIPOCYTE DIFFERENTIATION | Genes involved in Transcriptional Regulation of White Adipocyte Differentiation |
| 0.0 | 0.5 | REACTOME AMINE LIGAND BINDING RECEPTORS | Genes involved in Amine ligand-binding receptors |