Project
GSE53960: rat RNA-Seq transcriptomic Bodymap
Navigation
Downloads
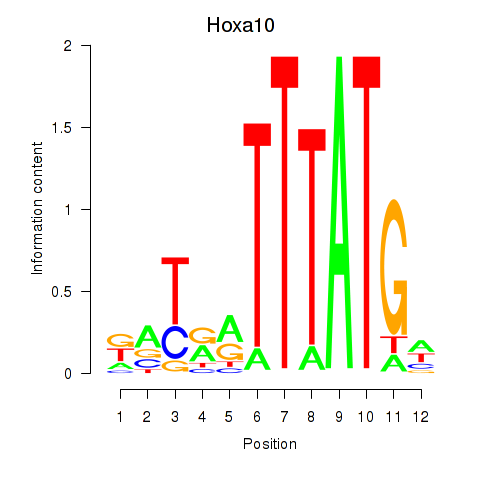
Results for Hoxa10
Z-value: 0.87
Motif logo
Transcription factors associated with Hoxa10
| Gene Symbol | Gene ID | Gene Info |
|---|---|---|
|
Hoxa10
|
ENSRNOG00000057650 | homeobox A10 |
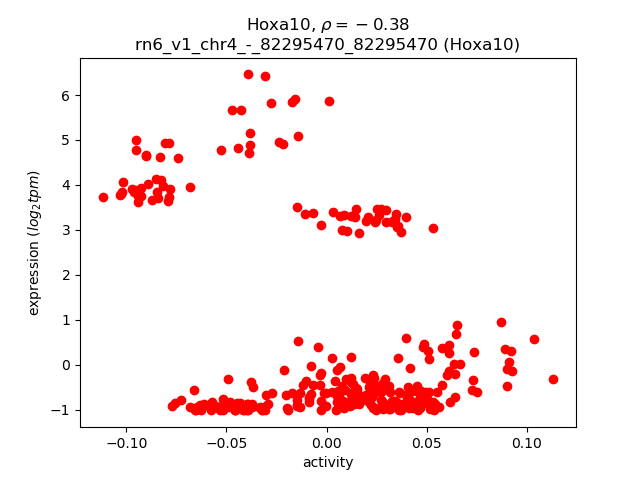
Activity-expression correlation:
| Gene | Promoter | Pearson corr. coef. | P-value | Plot |
|---|---|---|---|---|
| Hoxa10 | rn6_v1_chr4_-_82295470_82295470 | -0.38 | 2.2e-12 | Click! |
Activity profile of Hoxa10 motif
Sorted Z-values of Hoxa10 motif
| Promoter | Log-likelihood | Transcript | Gene | Gene Info |
|---|---|---|---|---|
| chr4_+_14151343 | 32.06 |
ENSRNOT00000061687
ENSRNOT00000076573 ENSRNOT00000077219 ENSRNOT00000008319 |
Cd36
|
CD36 molecule |
| chr1_-_197821936 | 24.05 |
ENSRNOT00000055027
|
Cd19
|
CD19 molecule |
| chr11_-_54514441 | 23.13 |
ENSRNOT00000002673
|
Retnlg
|
resistin-like gamma |
| chr4_+_98370797 | 22.28 |
ENSRNOT00000031991
|
AABR07060872.1
|
|
| chr2_+_88217188 | 21.91 |
ENSRNOT00000014267
|
Car1
|
carbonic anhydrase I |
| chr6_-_140880070 | 20.40 |
ENSRNOT00000073779
|
LOC691828
|
uncharacterized LOC691828 |
| chr4_+_14071507 | 20.35 |
ENSRNOT00000066224
ENSRNOT00000075962 |
Cd36
RGD1565355
|
CD36 molecule similar to fatty acid translocase/CD36 |
| chr4_+_14213587 | 18.97 |
ENSRNOT00000067543
|
LOC103690020
|
platelet glycoprotein 4-like |
| chr7_+_83373022 | 18.78 |
ENSRNOT00000057146
ENSRNOT00000005958 |
Pkhd1l1
|
polycystic kidney and hepatic disease 1-like 1 |
| chr5_-_58198782 | 17.32 |
ENSRNOT00000023951
|
Ccl21
|
C-C motif chemokine ligand 21 |
| chr14_-_62595854 | 17.07 |
ENSRNOT00000003024
|
Yipf7
|
Yip1 domain family, member 7 |
| chr18_-_77317969 | 17.03 |
ENSRNOT00000090369
|
Nfatc1
|
nuclear factor of activated T-cells 1 |
| chr3_+_18315320 | 15.82 |
ENSRNOT00000006954
|
AABR07051626.2
|
|
| chr4_-_163445302 | 14.89 |
ENSRNOT00000087106
|
Klrc3
|
killer cell lectin-like receptor subfamily C, member 3 |
| chr11_+_85263536 | 14.77 |
ENSRNOT00000046465
|
AABR07034729.1
|
|
| chr3_+_173969273 | 14.60 |
ENSRNOT00000083970
|
Cdh26
|
cadherin 26 |
| chr8_+_96551245 | 13.73 |
ENSRNOT00000039850
|
Bcl2a1
|
BCL2-related protein A1 |
| chr1_+_168945449 | 13.51 |
ENSRNOT00000087661
ENSRNOT00000019913 |
LOC103694855
|
hemoglobin subunit beta-2-like |
| chr2_+_248398917 | 13.42 |
ENSRNOT00000045855
|
Gbp1
|
guanylate binding protein 1 |
| chr3_-_118635268 | 13.20 |
ENSRNOT00000086357
|
Atp8b4
|
ATPase phospholipid transporting 8B4 (putative) |
| chr11_+_57108956 | 12.69 |
ENSRNOT00000035485
|
Cd96
|
CD96 molecule |
| chr5_-_115387377 | 12.65 |
ENSRNOT00000036030
ENSRNOT00000077492 |
RGD1560146
|
similar to hypothetical protein MGC34837 |
| chr5_+_61657507 | 12.20 |
ENSRNOT00000013228
|
Tmod1
|
tropomodulin 1 |
| chr11_-_45124423 | 12.09 |
ENSRNOT00000046383
|
Filip1l
|
filamin A interacting protein 1-like |
| chr13_+_53351717 | 11.43 |
ENSRNOT00000012038
|
Kif14
|
kinesin family member 14 |
| chr4_-_165192647 | 11.18 |
ENSRNOT00000086461
|
Klra5
|
killer cell lectin-like receptor, subfamily A, member 5 |
| chr11_+_85508300 | 10.95 |
ENSRNOT00000038646
|
AABR07034730.3
|
|
| chr3_-_60166013 | 10.05 |
ENSRNOT00000024922
|
Wipf1
|
WAS/WASL interacting protein family, member 1 |
| chr10_-_67401836 | 9.87 |
ENSRNOT00000073071
|
Crlf3
|
cytokine receptor-like factor 3 |
| chr11_-_60819249 | 9.28 |
ENSRNOT00000043917
ENSRNOT00000042447 |
Cd200r1l
|
CD200 receptor 1-like |
| chr16_-_48692476 | 9.19 |
ENSRNOT00000013118
|
Irf2
|
interferon regulatory factor 2 |
| chr4_-_103024841 | 9.08 |
ENSRNOT00000090283
|
AABR07061036.1
|
|
| chr4_+_61924013 | 8.97 |
ENSRNOT00000090717
|
Bpgm
|
bisphosphoglycerate mutase |
| chr2_+_231941794 | 8.64 |
ENSRNOT00000091475
|
AABR07013288.4
|
|
| chr13_+_90116843 | 8.60 |
ENSRNOT00000006306
|
Cd48
|
Cd48 molecule |
| chr6_-_140715174 | 8.46 |
ENSRNOT00000085345
|
AABR07065773.1
|
|
| chr17_+_81922329 | 8.44 |
ENSRNOT00000031542
|
Cacnb2
|
calcium voltage-gated channel auxiliary subunit beta 2 |
| chr17_-_86657473 | 8.23 |
ENSRNOT00000078827
|
AABR07028795.1
|
|
| chr6_+_55465782 | 8.09 |
ENSRNOT00000006682
|
Agr2
|
anterior gradient 2, protein disulphide isomerase family member |
| chr4_+_162493908 | 7.61 |
ENSRNOT00000072064
|
Clec2d
|
C-type lectin domain family 2, member D |
| chr10_+_87759769 | 7.13 |
ENSRNOT00000017378
ENSRNOT00000046526 |
Krtap9-1
|
keratin associated protein 9-1 |
| chrX_-_104984341 | 7.03 |
ENSRNOT00000077996
|
Xkrx
|
XK related, X-linked |
| chr4_+_69386698 | 6.81 |
ENSRNOT00000091655
|
Trbv13-2
|
T cell receptor beta, variable 13-2 |
| chr20_+_6351458 | 6.68 |
ENSRNOT00000091731
|
Cdkn1a
|
cyclin-dependent kinase inhibitor 1A |
| chr2_+_231884337 | 6.57 |
ENSRNOT00000014695
|
Zgrf1
|
zinc finger, GRF-type containing 1 |
| chr9_-_65736852 | 6.53 |
ENSRNOT00000087458
|
Trak2
|
trafficking kinesin protein 2 |
| chr8_+_117347029 | 6.45 |
ENSRNOT00000047717
|
Impdh2
|
inosine monophosphate dehydrogenase 2 |
| chr16_-_7412150 | 6.37 |
ENSRNOT00000047252
|
RGD1564325
|
similar to ribosomal protein S24 |
| chr13_-_51784639 | 6.34 |
ENSRNOT00000089068
|
Ppp1r12b
|
protein phosphatase 1, regulatory subunit 12B |
| chr10_+_75088422 | 6.15 |
ENSRNOT00000081951
|
Mpo
|
myeloperoxidase |
| chr3_-_16753987 | 6.00 |
ENSRNOT00000091257
|
AABR07051548.1
|
|
| chr13_+_90260783 | 5.90 |
ENSRNOT00000050547
|
Cd84
|
CD84 molecule |
| chr13_-_83425641 | 5.70 |
ENSRNOT00000063870
|
Tbx19
|
T-box 19 |
| chr12_-_18303041 | 5.61 |
ENSRNOT00000032844
|
LOC288521
|
similar to Leukosialin precursor (Leucocyte sialoglycoprotein) (Sialophorin) (CD43) (W3/13 antigen) |
| chr7_-_15852930 | 5.54 |
ENSRNOT00000009270
|
LOC691422
|
similar to zinc finger protein 101 |
| chr9_-_53315915 | 5.53 |
ENSRNOT00000038093
|
Mstn
|
myostatin |
| chr1_+_84304228 | 5.43 |
ENSRNOT00000024771
|
Prx
|
periaxin |
| chr14_-_81023682 | 5.39 |
ENSRNOT00000081570
|
Rgs12
|
regulator of G-protein signaling 12 |
| chr18_+_47613854 | 5.29 |
ENSRNOT00000025270
|
Zfp474
|
zinc finger protein 474 |
| chr9_-_121725716 | 5.26 |
ENSRNOT00000087405
|
Adcyap1
|
adenylate cyclase activating polypeptide 1 |
| chr3_+_113918629 | 5.01 |
ENSRNOT00000078978
ENSRNOT00000037168 |
Ctdspl2
|
CTD small phosphatase like 2 |
| chr3_+_5709236 | 4.98 |
ENSRNOT00000061201
ENSRNOT00000070887 |
Dbh
|
dopamine beta-hydroxylase |
| chr14_+_91557601 | 4.95 |
ENSRNOT00000038733
|
RGD1309870
|
hypothetical LOC289778 |
| chr3_-_20518105 | 4.95 |
ENSRNOT00000050435
|
AABR07051735.1
|
|
| chr2_+_242882306 | 4.95 |
ENSRNOT00000013661
|
Ddit4l
|
DNA-damage-inducible transcript 4-like |
| chr15_+_29208606 | 4.79 |
ENSRNOT00000073722
ENSRNOT00000086054 |
LOC100911980
|
uncharacterized LOC100911980 |
| chr4_-_165118062 | 4.76 |
ENSRNOT00000087219
|
LOC502908
|
Ly49s8 |
| chr9_-_52238564 | 4.57 |
ENSRNOT00000005073
|
Col5a2
|
collagen type V alpha 2 chain |
| chr4_-_176909075 | 4.56 |
ENSRNOT00000067489
|
Abcc9
|
ATP binding cassette subfamily C member 9 |
| chr13_+_48455923 | 4.45 |
ENSRNOT00000009280
|
Rab7b
|
Rab7b, member RAS oncogene family |
| chr7_-_104486710 | 4.45 |
ENSRNOT00000084764
|
Gsdmc
|
gasdermin C |
| chr1_-_7443863 | 4.45 |
ENSRNOT00000088558
|
Phactr2
|
phosphatase and actin regulator 2 |
| chr20_-_32296840 | 4.42 |
ENSRNOT00000080727
|
Stox1
|
storkhead box 1 |
| chr8_-_128521109 | 4.42 |
ENSRNOT00000034025
|
Scn11a
|
sodium voltage-gated channel alpha subunit 11 |
| chr4_+_136078391 | 4.42 |
ENSRNOT00000048672
|
AABR07061614.1
|
|
| chr7_-_122329443 | 4.40 |
ENSRNOT00000032232
|
Mkl1
|
megakaryoblastic leukemia (translocation) 1 |
| chr9_-_65737538 | 4.33 |
ENSRNOT00000014939
|
Trak2
|
trafficking kinesin protein 2 |
| chr17_-_15566332 | 4.25 |
ENSRNOT00000093743
|
Ecm2
|
extracellular matrix protein 2 |
| chr5_+_147257678 | 4.20 |
ENSRNOT00000066268
|
Rnf19b
|
ring finger protein 19B |
| chrX_+_77076106 | 4.19 |
ENSRNOT00000091527
ENSRNOT00000089381 |
Atp7a
|
ATPase copper transporting alpha |
| chr11_-_54545230 | 4.17 |
ENSRNOT00000002676
|
Retnla
|
resistin like alpha |
| chr2_-_59084059 | 4.15 |
ENSRNOT00000086323
ENSRNOT00000088701 |
Spef2
|
sperm flagellar 2 |
| chr9_-_88534710 | 4.04 |
ENSRNOT00000020880
|
Tm4sf20
|
transmembrane 4 L six family member 20 |
| chr8_-_58253688 | 3.93 |
ENSRNOT00000010956
|
Cul5
|
cullin 5 |
| chr5_-_16995304 | 3.87 |
ENSRNOT00000061780
|
Sdr16c6
|
short chain dehydrogenase/reductase family 16C, member 6 |
| chr11_+_85633243 | 3.84 |
ENSRNOT00000045807
|
LOC682352
|
Ig lambda chain V-VI region AR-like |
| chr3_-_153321352 | 3.78 |
ENSRNOT00000064824
|
Rbl1
|
RB transcriptional corepressor like 1 |
| chr15_-_108326907 | 3.74 |
ENSRNOT00000016848
|
Gpr18
|
G protein-coupled receptor 18 |
| chr1_+_42121636 | 3.72 |
ENSRNOT00000025616
|
Myct1
|
myc target 1 |
| chr1_-_197801634 | 3.70 |
ENSRNOT00000090200
|
Nfatc2ip
|
nuclear factor of activated T-cells 2 interacting protein |
| chr13_-_84759098 | 3.70 |
ENSRNOT00000058683
|
LOC685351
|
similar to flavin containing monooxygenase 5 |
| chr10_-_74413745 | 3.69 |
ENSRNOT00000038296
|
Prr11
|
proline rich 11 |
| chr20_+_17750744 | 3.63 |
ENSRNOT00000000745
|
RGD1559903
|
similar to RIKEN cDNA 1700049L16 |
| chr20_+_3146856 | 3.62 |
ENSRNOT00000050159
|
RT1-N2
|
RT1 class Ib, locus N2 |
| chr5_-_16995521 | 3.61 |
ENSRNOT00000080197
|
Sdr16c6
|
short chain dehydrogenase/reductase family 16C, member 6 |
| chr14_-_45863877 | 3.60 |
ENSRNOT00000002977
|
Pgm2
|
phosphoglucomutase 2 |
| chr8_-_68275720 | 3.60 |
ENSRNOT00000079122
|
Map2k5
|
mitogen activated protein kinase kinase 5 |
| chr15_+_31417147 | 3.59 |
ENSRNOT00000092182
|
AABR07017824.2
|
|
| chr15_-_49467174 | 3.56 |
ENSRNOT00000019209
|
Adam7
|
ADAM metallopeptidase domain 7 |
| chr1_-_7322424 | 3.53 |
ENSRNOT00000066725
ENSRNOT00000081112 |
Zc2hc1b
|
zinc finger, C2HC-type containing 1B |
| chr8_-_18762922 | 3.50 |
ENSRNOT00000008423
|
Olr1122
|
olfactory receptor 1122 |
| chr9_+_17734345 | 3.49 |
ENSRNOT00000067104
|
Capn11
|
calpain 11 |
| chr15_-_29761117 | 3.49 |
ENSRNOT00000075194
|
AABR07017658.2
|
|
| chr2_+_4989295 | 3.32 |
ENSRNOT00000041541
|
Fam172a
|
family with sequence similarity 172, member A |
| chr2_+_147006830 | 3.24 |
ENSRNOT00000080780
|
AABR07010672.1
|
|
| chr4_-_170186942 | 3.20 |
ENSRNOT00000082235
|
Wbp11l1
|
WW domain-binding protein 11-like 1 |
| chrX_+_26440584 | 3.20 |
ENSRNOT00000087293
ENSRNOT00000005328 |
Amelx
|
amelogenin, X-linked |
| chr19_+_49462129 | 3.19 |
ENSRNOT00000015158
|
Cenpn
|
centromere protein N |
| chr12_+_41200718 | 3.17 |
ENSRNOT00000038426
ENSRNOT00000048450 ENSRNOT00000067176 |
Oas1a
|
2'-5' oligoadenylate synthetase 1A |
| chr1_+_168378637 | 3.14 |
ENSRNOT00000028936
|
Olr86
|
olfactory receptor 86 |
| chr3_-_71798531 | 3.05 |
ENSRNOT00000088170
|
Calcrl
|
calcitonin receptor like receptor |
| chr6_-_86223052 | 3.02 |
ENSRNOT00000046828
|
Fscb
|
fibrous sheath CABYR binding protein |
| chr1_-_236900904 | 3.01 |
ENSRNOT00000066846
|
AABR07006480.1
|
|
| chr14_-_21553949 | 2.92 |
ENSRNOT00000031642
|
Smr3b
|
submaxillary gland androgen regulated protein 3B |
| chr1_-_141504111 | 2.76 |
ENSRNOT00000040164
|
Snrpep2
|
small nuclear ribonucleoprotein polypeptide E pseudogene 2 |
| chr1_-_227392054 | 2.70 |
ENSRNOT00000054806
|
Ms4a13-ps1
|
membrane-spanning 4-domains, subfamily A, member 13, pseudogene 1 |
| chr1_-_90151405 | 2.69 |
ENSRNOT00000028688
|
RGD1308428
|
similar to RIKEN cDNA 4931406P16 |
| chr13_+_71322759 | 2.64 |
ENSRNOT00000071815
|
Teddm1
|
transmembrane epididymal protein 1 |
| chr2_-_137153551 | 2.62 |
ENSRNOT00000083443
|
AABR07010476.1
|
|
| chr3_-_76926151 | 2.60 |
ENSRNOT00000049517
|
Olr641
|
olfactory receptor 641 |
| chr14_+_42007312 | 2.56 |
ENSRNOT00000063985
|
Atp8a1
|
ATPase phospholipid transporting 8A1 |
| chrX_+_119390013 | 2.50 |
ENSRNOT00000074269
|
Agtr2
|
angiotensin II receptor, type 2 |
| chr17_+_39544281 | 2.39 |
ENSRNOT00000022871
|
Prl2b1
|
Prolactin family 2, subfamily b, member 1 |
| chr11_-_43099412 | 2.27 |
ENSRNOT00000002281
|
Gabrr3
|
gamma-aminobutyric acid type A receptor rho3 subunit |
| chr12_+_38368693 | 2.24 |
ENSRNOT00000083261
|
Clip1
|
CAP-GLY domain containing linker protein 1 |
| chr2_-_256154584 | 2.24 |
ENSRNOT00000072487
|
AABR07013776.1
|
|
| chr13_-_82295123 | 2.21 |
ENSRNOT00000090120
|
LOC498265
|
similar to hypothetical protein FLJ10706 |
| chr12_+_703281 | 2.20 |
ENSRNOT00000001464
ENSRNOT00000064951 ENSRNOT00000050733 |
Pds5b
|
PDS5 cohesin associated factor B |
| chr7_+_74350479 | 2.17 |
ENSRNOT00000089034
|
AABR07057495.1
|
|
| chr19_+_56803382 | 2.17 |
ENSRNOT00000036042
|
Urb2
|
URB2 ribosome biogenesis 2 homolog (S. cerevisiae) |
| chr2_+_260039651 | 2.16 |
ENSRNOT00000073873
|
Asb17
|
ankyrin repeat and SOCS box-containing 17 |
| chrX_-_118513061 | 2.15 |
ENSRNOT00000043338
|
Il13ra2
|
interleukin 13 receptor subunit alpha 2 |
| chr9_+_17784468 | 2.13 |
ENSRNOT00000026831
|
Slc29a1
|
solute carrier family 29 member 1 |
| chr8_-_32431987 | 2.04 |
ENSRNOT00000048460
|
RGD1563958
|
similar to 60S ribosomal protein L32 |
| chr2_-_43067956 | 2.02 |
ENSRNOT00000090616
|
Gpbp1
|
GC-rich promoter binding protein 1 |
| chr16_+_71242470 | 2.01 |
ENSRNOT00000030489
|
Letm2
|
leucine zipper and EF-hand containing transmembrane protein 2 |
| chr11_-_23058456 | 1.99 |
ENSRNOT00000073285
|
LOC103693533
|
olfactory receptor 6C6-like |
| chr5_+_116420690 | 1.99 |
ENSRNOT00000087089
|
Nfia
|
nuclear factor I/A |
| chr6_-_77848434 | 1.95 |
ENSRNOT00000034342
|
Slc25a21
|
solute carrier family 25 member 21 |
| chr3_-_13896838 | 1.92 |
ENSRNOT00000025399
|
Fbxw2
|
F-box and WD repeat domain containing 2 |
| chr8_+_122197027 | 1.91 |
ENSRNOT00000013050
|
Ubp1
|
upstream binding protein 1 (LBP-1a) |
| chr7_+_120161091 | 1.91 |
ENSRNOT00000013764
|
Nol12
|
nucleolar protein 12 |
| chr13_+_110372164 | 1.87 |
ENSRNOT00000049634
|
RGD1560186
|
similar to ribosomal protein L37 |
| chr13_-_67688477 | 1.85 |
ENSRNOT00000068148
|
Prg4
|
proteoglycan 4 |
| chr1_-_246010594 | 1.80 |
ENSRNOT00000023762
|
Rfx3
|
regulatory factor X3 |
| chr20_+_3167079 | 1.80 |
ENSRNOT00000001035
|
RT1-N3
|
RT1 class Ib, locus N3 |
| chr8_+_36850324 | 1.79 |
ENSRNOT00000060448
|
Pate2
|
prostate and testis expressed 2 |
| chr3_+_103597194 | 1.77 |
ENSRNOT00000073004
|
LOC502660
|
similar to olfactory receptor 1318 |
| chr20_-_29558321 | 1.72 |
ENSRNOT00000000702
|
Anapc16
|
anaphase promoting complex subunit 16 |
| chr4_+_160020472 | 1.55 |
ENSRNOT00000078802
|
Parp11
|
poly (ADP-ribose) polymerase family, member 11 |
| chrX_+_123912361 | 1.55 |
ENSRNOT00000092622
|
Rhox5
|
reproductive homeobox 5 |
| chr5_-_113880911 | 1.53 |
ENSRNOT00000029441
|
Eqtn
|
equatorin |
| chr9_+_44681494 | 1.52 |
ENSRNOT00000035785
|
Eif5b
|
eukaryotic translation initiation factor 5B |
| chr7_+_132378273 | 1.52 |
ENSRNOT00000010990
|
LOC690142
|
hypothetical protein LOC690142 |
| chr9_+_72933304 | 1.51 |
ENSRNOT00000041632
|
Crygf
|
crystallin, gamma F |
| chr14_+_83889089 | 1.44 |
ENSRNOT00000078980
|
Morc2
|
MORC family CW-type zinc finger 2 |
| chr2_+_193627243 | 1.40 |
ENSRNOT00000082934
|
AABR07012331.1
|
|
| chr16_+_68586235 | 1.39 |
ENSRNOT00000039592
|
LOC103693984
|
uncharacterized LOC103693984 |
| chr4_-_58006839 | 1.37 |
ENSRNOT00000076645
|
Cep41
|
centrosomal protein 41 |
| chr16_+_51730452 | 1.34 |
ENSRNOT00000078614
|
Adam34l
|
a disintegrin and metalloprotease domain 34-like |
| chr9_-_44617210 | 1.33 |
ENSRNOT00000074343
|
Lyg1
|
lysozyme G1 |
| chr18_+_30904498 | 1.33 |
ENSRNOT00000026969
|
Pcdhga11
|
protocadherin gamma subfamily A, 11 |
| chr11_-_29638922 | 1.30 |
ENSRNOT00000048888
|
LOC100359671
|
ribosomal protein L29-like |
| chr9_-_43454078 | 1.27 |
ENSRNOT00000023550
|
Tmem131
|
transmembrane protein 131 |
| chrX_-_70938489 | 1.26 |
ENSRNOT00000041731
|
Tex11
|
testis expressed 11 |
| chr3_-_74567685 | 1.23 |
ENSRNOT00000068048
|
Olr532
|
olfactory receptor 532 |
| chr19_-_11669578 | 1.20 |
ENSRNOT00000026373
|
Gnao1
|
G protein subunit alpha o1 |
| chrX_+_43745604 | 1.18 |
ENSRNOT00000040825
|
LOC100362173
|
rCG36365-like |
| chr4_+_113918740 | 1.15 |
ENSRNOT00000086359
|
Lbx2
|
ladybird homeobox 2 |
| chr15_-_27077160 | 1.14 |
ENSRNOT00000016721
|
Olr1611
|
olfactory receptor 1611 |
| chr1_+_129255396 | 1.13 |
ENSRNOT00000040147
|
Fam169b
|
family with sequence similarity 169, member B |
| chr1_+_164705604 | 1.11 |
ENSRNOT00000051450
ENSRNOT00000071384 |
Olr36
|
olfactory receptor 36 |
| chr4_-_177039677 | 1.10 |
ENSRNOT00000055538
ENSRNOT00000075667 |
RGD1561551
|
similar to Hypothetical protein MGC75664 |
| chr19_+_26184545 | 1.06 |
ENSRNOT00000005656
|
Dhps
|
deoxyhypusine synthase |
| chr4_+_114784408 | 1.06 |
ENSRNOT00000011189
|
LOC103692168
|
transcription factor LBX2 |
| chr18_-_32670665 | 1.05 |
ENSRNOT00000019409
|
Nr3c1
|
nuclear receptor subfamily 3, group C, member 1 |
| chr3_-_72808425 | 1.01 |
ENSRNOT00000048581
|
Olr441
|
olfactory receptor 441 |
| chr8_+_40707068 | 1.00 |
ENSRNOT00000074529
|
Olr1214
|
olfactory receptor 1214 |
| chr3_-_57957346 | 0.99 |
ENSRNOT00000036728
|
Slc25a12
|
solute carrier family 25 member 12 |
| chr3_-_78429583 | 0.97 |
ENSRNOT00000042658
|
Olr705
|
olfactory receptor 705 |
| chr8_-_18408179 | 0.96 |
ENSRNOT00000040032
|
AABR07069371.1
|
|
| chrX_+_45614888 | 0.94 |
ENSRNOT00000058473
|
LOC100909677
|
uncharacterized LOC100909677 |
| chr8_+_41358307 | 0.93 |
ENSRNOT00000071307
|
LOC100911801
|
olfactory receptor 143-like |
| chr20_+_1021594 | 0.92 |
ENSRNOT00000071933
|
LOC100910936
|
olfactory receptor 14J1-like |
| chr13_-_98023829 | 0.90 |
ENSRNOT00000075426
|
Kif28p
|
kinesin family member 28, pseudogene |
| chr9_-_121972055 | 0.84 |
ENSRNOT00000089735
|
AABR07068851.1
|
clusterin-like protein 1 |
| chr8_-_19386384 | 0.83 |
ENSRNOT00000051572
|
Olr1145
|
olfactory receptor 1145 |
| chr2_+_115272156 | 0.83 |
ENSRNOT00000075059
|
LOC100909993
|
olfactory receptor 146-like |
| chr5_-_128839433 | 0.80 |
ENSRNOT00000065280
|
Osbpl9
|
oxysterol binding protein-like 9 |
| chr13_+_73661131 | 0.79 |
ENSRNOT00000068548
|
RGD1561738
|
similar to interferon induced transmembrane protein 2 (1-8D) |
| chr8_-_4003593 | 0.77 |
ENSRNOT00000072660
|
Vom2r24
|
vomeronasal 2 receptor, 24 |
| chr4_+_71512695 | 0.77 |
ENSRNOT00000037220
|
Tas2r139
|
taste receptor, type 2, member 139 |
| chr3_+_75809445 | 0.76 |
ENSRNOT00000049950
|
Olr581
|
olfactory receptor 581 |
| chr7_+_58570579 | 0.74 |
ENSRNOT00000081227
|
A930009A15Rik
|
RIKEN cDNA A930009A15 gene |
| chr3_-_176197753 | 0.73 |
ENSRNOT00000013189
|
Dido1
|
death inducer-obliterator 1 |
| chrX_-_97262013 | 0.68 |
ENSRNOT00000040168
|
Cldn34c4
|
claudin 34C4 |
| chr8_+_40345160 | 0.67 |
ENSRNOT00000076308
|
Olr1200
|
olfactory receptor 1200 |
| chr1_+_148862493 | 0.65 |
ENSRNOT00000073451
|
LOC100912097
|
olfactory receptor 10A5-like |
| chr1_+_266844480 | 0.64 |
ENSRNOT00000027482
|
Taf5
|
TATA-box binding protein associated factor 5 |
| chr3_-_78663607 | 0.63 |
ENSRNOT00000073134
|
Olr718
|
olfactory receptor 718 |
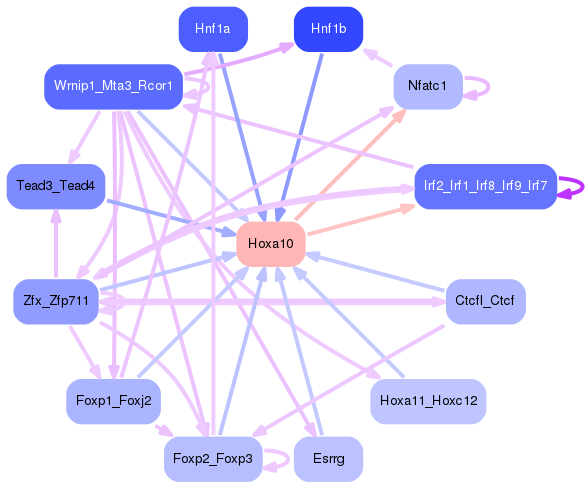
Network of associatons between targets according to the STRING database.

First level regulatory network of Hoxa10
Gene Ontology Analysis
Gene overrepresentation in biological process category:
| Log-likelihood per target | Total log-likelihood | Term | Description |
|---|---|---|---|
| 8.7 | 52.4 | GO:2000334 | blood microparticle formation(GO:0072564) regulation of blood microparticle formation(GO:2000332) positive regulation of blood microparticle formation(GO:2000334) |
| 8.1 | 40.4 | GO:0002408 | myeloid dendritic cell chemotaxis(GO:0002408) |
| 4.3 | 17.0 | GO:0002337 | B-1a B cell differentiation(GO:0002337) |
| 3.8 | 11.4 | GO:0021698 | cerebellar cortex structural organization(GO:0021698) |
| 3.6 | 10.9 | GO:0098972 | dendritic transport of mitochondrion(GO:0098939) anterograde dendritic transport of mitochondrion(GO:0098972) |
| 2.8 | 8.4 | GO:1904879 | positive regulation of calcium ion transmembrane transport via high voltage-gated calcium channel(GO:1904879) |
| 2.2 | 13.4 | GO:1900041 | negative regulation of interleukin-2 secretion(GO:1900041) |
| 2.0 | 6.1 | GO:0002148 | hypochlorous acid metabolic process(GO:0002148) hypochlorous acid biosynthetic process(GO:0002149) |
| 2.0 | 12.2 | GO:0014866 | skeletal myofibril assembly(GO:0014866) |
| 1.8 | 12.7 | GO:0002370 | natural killer cell cytokine production(GO:0002370) regulation of natural killer cell cytokine production(GO:0002727) |
| 1.8 | 5.4 | GO:0032290 | peripheral nervous system myelin formation(GO:0032290) |
| 1.7 | 24.0 | GO:0006968 | cellular defense response(GO:0006968) |
| 1.7 | 5.0 | GO:0046333 | octopamine biosynthetic process(GO:0006589) octopamine metabolic process(GO:0046333) |
| 1.5 | 4.5 | GO:0034499 | late endosome to Golgi transport(GO:0034499) |
| 1.5 | 5.9 | GO:0032701 | negative regulation of interleukin-18 production(GO:0032701) |
| 1.3 | 8.1 | GO:1903896 | positive regulation of IRE1-mediated unfolded protein response(GO:1903896) positive regulation of PERK-mediated unfolded protein response(GO:1903899) |
| 1.3 | 5.3 | GO:0002877 | regulation of acute inflammatory response to non-antigenic stimulus(GO:0002877) |
| 1.3 | 6.5 | GO:0006177 | GMP biosynthetic process(GO:0006177) |
| 1.3 | 9.0 | GO:0043456 | regulation of pentose-phosphate shunt(GO:0043456) |
| 1.2 | 3.6 | GO:2000342 | negative regulation of chemokine (C-X-C motif) ligand 2 production(GO:2000342) |
| 1.1 | 4.6 | GO:1903225 | negative regulation of endodermal cell differentiation(GO:1903225) |
| 1.0 | 4.2 | GO:0034760 | negative regulation of iron ion transmembrane transport(GO:0034760) elastin biosynthetic process(GO:0051542) regulation of cytochrome-c oxidase activity(GO:1904959) |
| 1.0 | 6.7 | GO:0060574 | intestinal epithelial cell maturation(GO:0060574) |
| 0.9 | 4.6 | GO:0060327 | cytoplasmic actin-based contraction involved in cell motility(GO:0060327) |
| 0.9 | 13.5 | GO:0015671 | oxygen transport(GO:0015671) |
| 0.9 | 5.4 | GO:0023021 | termination of signal transduction(GO:0023021) |
| 0.9 | 2.6 | GO:0061092 | regulation of phospholipid translocation(GO:0061091) positive regulation of phospholipid translocation(GO:0061092) |
| 0.8 | 2.5 | GO:0035566 | G-protein coupled receptor signaling pathway coupled to cGMP nucleotide second messenger(GO:0007199) regulation of metanephros size(GO:0035566) |
| 0.8 | 5.5 | GO:0014816 | skeletal muscle satellite cell differentiation(GO:0014816) negative regulation of skeletal muscle cell differentiation(GO:2001015) |
| 0.7 | 2.1 | GO:0015864 | pyrimidine nucleoside transport(GO:0015864) |
| 0.7 | 15.1 | GO:0046827 | positive regulation of protein export from nucleus(GO:0046827) |
| 0.6 | 4.4 | GO:0071500 | cellular response to nitrosative stress(GO:0071500) |
| 0.6 | 1.8 | GO:2000078 | glandular epithelial cell maturation(GO:0002071) positive regulation of type B pancreatic cell development(GO:2000078) |
| 0.6 | 21.9 | GO:0006730 | one-carbon metabolic process(GO:0006730) |
| 0.5 | 4.4 | GO:0010735 | positive regulation of transcription via serum response element binding(GO:0010735) |
| 0.5 | 18.8 | GO:0071526 | semaphorin-plexin signaling pathway(GO:0071526) |
| 0.4 | 2.2 | GO:0044861 | protein transport into plasma membrane raft(GO:0044861) |
| 0.4 | 3.9 | GO:0021942 | radial glia guided migration of Purkinje cell(GO:0021942) |
| 0.3 | 1.3 | GO:0016998 | cell wall macromolecule catabolic process(GO:0016998) |
| 0.3 | 1.9 | GO:0045409 | negative regulation of interleukin-6 biosynthetic process(GO:0045409) |
| 0.3 | 1.5 | GO:0060478 | acrosomal vesicle exocytosis(GO:0060478) |
| 0.3 | 4.1 | GO:0007288 | sperm axoneme assembly(GO:0007288) |
| 0.3 | 2.1 | GO:0043305 | negative regulation of mast cell degranulation(GO:0043305) |
| 0.3 | 3.7 | GO:0043374 | CD8-positive, alpha-beta T cell differentiation(GO:0043374) |
| 0.3 | 1.1 | GO:1900170 | negative regulation of glucocorticoid mediated signaling pathway(GO:1900170) |
| 0.3 | 1.3 | GO:0035822 | meiotic gene conversion(GO:0006311) gene conversion(GO:0035822) |
| 0.2 | 1.0 | GO:0070778 | malate-aspartate shuttle(GO:0043490) L-aspartate transport(GO:0070778) L-aspartate transmembrane transport(GO:0089712) |
| 0.2 | 3.0 | GO:0034285 | response to sucrose(GO:0009744) response to disaccharide(GO:0034285) |
| 0.2 | 4.2 | GO:0072643 | interferon-gamma secretion(GO:0072643) |
| 0.2 | 9.9 | GO:0071158 | positive regulation of cell cycle arrest(GO:0071158) |
| 0.2 | 1.4 | GO:0018095 | protein polyglutamylation(GO:0018095) |
| 0.2 | 3.2 | GO:0070166 | enamel mineralization(GO:0070166) |
| 0.2 | 3.2 | GO:0045292 | mRNA cis splicing, via spliceosome(GO:0045292) |
| 0.2 | 1.1 | GO:0006598 | polyamine catabolic process(GO:0006598) |
| 0.1 | 2.0 | GO:0072189 | ureter development(GO:0072189) |
| 0.1 | 11.2 | GO:0030101 | natural killer cell activation(GO:0030101) |
| 0.1 | 8.6 | GO:0045576 | mast cell activation(GO:0045576) |
| 0.1 | 3.2 | GO:0034508 | centromere complex assembly(GO:0034508) |
| 0.1 | 5.4 | GO:0002474 | antigen processing and presentation of peptide antigen via MHC class I(GO:0002474) |
| 0.1 | 7.3 | GO:0051930 | regulation of sensory perception of pain(GO:0051930) regulation of sensory perception(GO:0051931) |
| 0.1 | 0.5 | GO:0001831 | trophectodermal cellular morphogenesis(GO:0001831) |
| 0.1 | 5.7 | GO:0021983 | pituitary gland development(GO:0021983) |
| 0.1 | 13.7 | GO:0021987 | cerebral cortex development(GO:0021987) |
| 0.1 | 3.7 | GO:0016925 | protein sumoylation(GO:0016925) |
| 0.1 | 2.2 | GO:0007064 | mitotic sister chromatid cohesion(GO:0007064) |
| 0.1 | 0.5 | GO:1903527 | positive regulation of membrane tubulation(GO:1903527) |
| 0.1 | 1.4 | GO:0035404 | histone-serine phosphorylation(GO:0035404) |
| 0.1 | 0.3 | GO:1990414 | replication-born double-strand break repair via sister chromatid exchange(GO:1990414) |
| 0.0 | 2.1 | GO:0043550 | regulation of lipid kinase activity(GO:0043550) |
| 0.0 | 0.4 | GO:0032277 | negative regulation of gonadotropin secretion(GO:0032277) |
| 0.0 | 4.2 | GO:0010811 | positive regulation of cell-substrate adhesion(GO:0010811) |
| 0.0 | 3.7 | GO:0007050 | cell cycle arrest(GO:0007050) |
| 0.0 | 3.6 | GO:0007229 | integrin-mediated signaling pathway(GO:0007229) |
| 0.0 | 4.5 | GO:0007156 | homophilic cell adhesion via plasma membrane adhesion molecules(GO:0007156) |
| 0.0 | 1.5 | GO:0006998 | nuclear envelope organization(GO:0006998) |
| 0.0 | 0.8 | GO:0001580 | detection of chemical stimulus involved in sensory perception of bitter taste(GO:0001580) |
| 0.0 | 1.2 | GO:0007212 | dopamine receptor signaling pathway(GO:0007212) |
| 0.0 | 0.5 | GO:0060218 | hematopoietic stem cell differentiation(GO:0060218) |
| 0.0 | 0.6 | GO:0045109 | intermediate filament organization(GO:0045109) |
| 0.0 | 0.3 | GO:0050912 | detection of chemical stimulus involved in sensory perception of taste(GO:0050912) |
| 0.0 | 1.5 | GO:0006446 | regulation of translational initiation(GO:0006446) |
| 0.0 | 1.5 | GO:0002088 | lens development in camera-type eye(GO:0002088) |
| 0.0 | 0.6 | GO:0070979 | protein K11-linked ubiquitination(GO:0070979) |
| 0.0 | 3.2 | GO:0051607 | defense response to virus(GO:0051607) |
| 0.0 | 0.6 | GO:0034629 | cellular protein complex localization(GO:0034629) |
| 0.0 | 0.9 | GO:0072384 | organelle transport along microtubule(GO:0072384) |
| 0.0 | 0.4 | GO:0046854 | phosphatidylinositol phosphorylation(GO:0046854) |
Gene overrepresentation in cellular component category:
| Log-likelihood per target | Total log-likelihood | Term | Description |
|---|---|---|---|
| 3.4 | 13.4 | GO:0020005 | symbiont-containing vacuole membrane(GO:0020005) |
| 2.2 | 6.7 | GO:0070557 | PCNA-p21 complex(GO:0070557) |
| 1.2 | 5.0 | GO:0034774 | secretory granule lumen(GO:0034774) |
| 1.2 | 13.5 | GO:0005833 | hemoglobin complex(GO:0005833) |
| 1.1 | 4.6 | GO:0005588 | collagen type V trimer(GO:0005588) |
| 1.1 | 4.6 | GO:0008282 | ATP-sensitive potassium channel complex(GO:0008282) |
| 1.1 | 4.4 | GO:0044299 | C-fiber(GO:0044299) |
| 0.7 | 8.4 | GO:1990454 | L-type voltage-gated calcium channel complex(GO:1990454) |
| 0.6 | 56.6 | GO:0031526 | brush border membrane(GO:0031526) |
| 0.5 | 4.2 | GO:0044194 | cytolytic granule(GO:0044194) |
| 0.5 | 3.9 | GO:0031466 | Cul5-RING ubiquitin ligase complex(GO:0031466) |
| 0.4 | 6.1 | GO:0042582 | primary lysosome(GO:0005766) azurophil granule(GO:0042582) |
| 0.4 | 1.5 | GO:0002079 | inner acrosomal membrane(GO:0002079) |
| 0.4 | 4.1 | GO:0002177 | manchette(GO:0002177) |
| 0.3 | 11.4 | GO:0051233 | spindle midzone(GO:0051233) |
| 0.3 | 12.2 | GO:0008180 | COP9 signalosome(GO:0008180) |
| 0.2 | 2.2 | GO:0044354 | pinosome(GO:0044352) macropinosome(GO:0044354) |
| 0.2 | 7.4 | GO:0032839 | dendrite cytoplasm(GO:0032839) |
| 0.2 | 4.2 | GO:0005614 | interstitial matrix(GO:0005614) |
| 0.2 | 3.0 | GO:0035686 | sperm fibrous sheath(GO:0035686) |
| 0.1 | 41.9 | GO:0009897 | external side of plasma membrane(GO:0009897) |
| 0.1 | 6.3 | GO:0031672 | A band(GO:0031672) |
| 0.1 | 2.3 | GO:0005680 | anaphase-promoting complex(GO:0005680) |
| 0.1 | 1.3 | GO:0000801 | central element(GO:0000801) |
| 0.1 | 10.1 | GO:0005884 | actin filament(GO:0005884) |
| 0.1 | 0.5 | GO:0030289 | protein phosphatase 4 complex(GO:0030289) |
| 0.1 | 1.4 | GO:0031588 | nucleotide-activated protein kinase complex(GO:0031588) |
| 0.1 | 0.6 | GO:0061700 | GATOR2 complex(GO:0061700) |
| 0.1 | 4.5 | GO:0045335 | phagocytic vesicle(GO:0045335) |
| 0.1 | 0.5 | GO:0005827 | polar microtubule(GO:0005827) |
| 0.1 | 4.3 | GO:0005778 | peroxisomal membrane(GO:0005778) microbody membrane(GO:0031903) |
| 0.1 | 19.9 | GO:0005667 | transcription factor complex(GO:0005667) |
| 0.0 | 3.0 | GO:0000777 | condensed chromosome kinetochore(GO:0000777) |
| 0.0 | 2.2 | GO:0016235 | aggresome(GO:0016235) |
| 0.0 | 1.2 | GO:0005834 | heterotrimeric G-protein complex(GO:0005834) |
| 0.0 | 13.1 | GO:0005578 | proteinaceous extracellular matrix(GO:0005578) |
| 0.0 | 19.0 | GO:0005929 | cilium(GO:0005929) |
| 0.0 | 3.5 | GO:0001669 | acrosomal vesicle(GO:0001669) |
| 0.0 | 0.5 | GO:0030663 | COPI-coated vesicle membrane(GO:0030663) |
| 0.0 | 0.9 | GO:0005871 | kinesin complex(GO:0005871) |
| 0.0 | 0.4 | GO:0090545 | NuRD complex(GO:0016581) CHD-type complex(GO:0090545) |
| 0.0 | 0.5 | GO:0002102 | podosome(GO:0002102) |
| 0.0 | 3.7 | GO:0005938 | cell cortex(GO:0005938) |
| 0.0 | 3.2 | GO:0005681 | spliceosomal complex(GO:0005681) |
| 0.0 | 0.4 | GO:0030867 | rough endoplasmic reticulum membrane(GO:0030867) |
Gene overrepresentation in molecular function category:
| Log-likelihood per target | Total log-likelihood | Term | Description |
|---|---|---|---|
| 10.5 | 52.4 | GO:0070892 | lipoteichoic acid receptor activity(GO:0070892) |
| 4.3 | 17.0 | GO:0001225 | RNA polymerase II transcription coactivator binding(GO:0001225) |
| 3.4 | 13.4 | GO:0019002 | GMP binding(GO:0019002) |
| 2.2 | 9.0 | GO:0046538 | bisphosphoglycerate mutase activity(GO:0004082) phosphoglycerate mutase activity(GO:0004619) 2,3-bisphosphoglycerate-dependent phosphoglycerate mutase activity(GO:0046538) |
| 2.2 | 6.7 | GO:0019912 | cyclin-dependent protein kinase activating kinase activity(GO:0019912) |
| 1.7 | 21.9 | GO:0004089 | carbonate dehydratase activity(GO:0004089) |
| 1.7 | 5.0 | GO:0004500 | dopamine beta-monooxygenase activity(GO:0004500) |
| 1.5 | 4.6 | GO:0008281 | sulfonylurea receptor activity(GO:0008281) |
| 1.4 | 8.4 | GO:0086056 | voltage-gated calcium channel activity involved in AV node cell action potential(GO:0086056) |
| 1.3 | 18.8 | GO:0017154 | semaphorin receptor activity(GO:0017154) |
| 1.0 | 3.0 | GO:0001605 | adrenomedullin receptor activity(GO:0001605) |
| 0.9 | 13.5 | GO:0005344 | oxygen transporter activity(GO:0005344) |
| 0.9 | 13.7 | GO:0051400 | BH domain binding(GO:0051400) |
| 0.8 | 4.2 | GO:0070052 | collagen V binding(GO:0070052) |
| 0.8 | 4.2 | GO:0032767 | copper-exporting ATPase activity(GO:0004008) copper-dependent protein binding(GO:0032767) copper-transporting ATPase activity(GO:0043682) |
| 0.8 | 3.2 | GO:0030345 | extracellular matrix structural constituent conferring compression resistance(GO:0030021) structural constituent of tooth enamel(GO:0030345) |
| 0.7 | 3.6 | GO:0004614 | phosphoglucomutase activity(GO:0004614) |
| 0.7 | 11.4 | GO:0008574 | ATP-dependent microtubule motor activity, plus-end-directed(GO:0008574) |
| 0.7 | 12.2 | GO:0005523 | tropomyosin binding(GO:0005523) |
| 0.5 | 2.5 | GO:0004945 | angiotensin type II receptor activity(GO:0004945) |
| 0.5 | 3.7 | GO:0031386 | protein tag(GO:0031386) |
| 0.4 | 15.6 | GO:0008009 | chemokine activity(GO:0008009) CCR chemokine receptor binding(GO:0048020) |
| 0.4 | 3.9 | GO:0005000 | vasopressin receptor activity(GO:0005000) |
| 0.4 | 3.2 | GO:0001730 | 2'-5'-oligoadenylate synthetase activity(GO:0001730) |
| 0.4 | 8.1 | GO:0002162 | dystroglycan binding(GO:0002162) |
| 0.3 | 3.7 | GO:0004499 | N,N-dimethylaniline monooxygenase activity(GO:0004499) |
| 0.3 | 3.6 | GO:0004708 | MAP kinase kinase activity(GO:0004708) |
| 0.3 | 4.4 | GO:0043522 | leucine zipper domain binding(GO:0043522) |
| 0.3 | 6.5 | GO:0051428 | peptide hormone receptor binding(GO:0051428) |
| 0.2 | 4.1 | GO:0050811 | GABA receptor binding(GO:0050811) |
| 0.2 | 32.4 | GO:0005179 | hormone activity(GO:0005179) |
| 0.2 | 1.0 | GO:0015183 | L-aspartate transmembrane transporter activity(GO:0015183) |
| 0.2 | 4.4 | GO:0005248 | voltage-gated sodium channel activity(GO:0005248) voltage-gated ion channel activity involved in regulation of postsynaptic membrane potential(GO:1905030) |
| 0.2 | 2.2 | GO:0051010 | microtubule plus-end binding(GO:0051010) |
| 0.2 | 0.5 | GO:0031208 | POZ domain binding(GO:0031208) |
| 0.1 | 4.5 | GO:0004864 | protein phosphatase inhibitor activity(GO:0004864) |
| 0.1 | 6.1 | GO:0004601 | peroxidase activity(GO:0004601) |
| 0.1 | 14.0 | GO:0003823 | antigen binding(GO:0003823) |
| 0.1 | 3.5 | GO:0004198 | calcium-dependent cysteine-type endopeptidase activity(GO:0004198) |
| 0.1 | 5.4 | GO:0001965 | G-protein alpha-subunit binding(GO:0001965) |
| 0.1 | 20.6 | GO:0005057 | receptor signaling protein activity(GO:0005057) |
| 0.1 | 2.6 | GO:0004012 | phospholipid-translocating ATPase activity(GO:0004012) |
| 0.1 | 5.5 | GO:0005160 | transforming growth factor beta receptor binding(GO:0005160) |
| 0.1 | 3.8 | GO:1990841 | promoter-specific chromatin binding(GO:1990841) |
| 0.1 | 1.1 | GO:1990239 | steroid hormone binding(GO:1990239) |
| 0.1 | 4.2 | GO:0031624 | ubiquitin conjugating enzyme binding(GO:0031624) |
| 0.1 | 1.3 | GO:0003796 | lysozyme activity(GO:0003796) |
| 0.1 | 1.4 | GO:0004679 | AMP-activated protein kinase activity(GO:0004679) |
| 0.1 | 0.4 | GO:0004430 | 1-phosphatidylinositol 4-kinase activity(GO:0004430) |
| 0.1 | 1.9 | GO:0030247 | pattern binding(GO:0001871) polysaccharide binding(GO:0030247) |
| 0.1 | 4.6 | GO:0005201 | extracellular matrix structural constituent(GO:0005201) |
| 0.1 | 10.5 | GO:0017124 | SH3 domain binding(GO:0017124) |
| 0.1 | 1.5 | GO:0005212 | structural constituent of eye lens(GO:0005212) |
| 0.1 | 1.5 | GO:0003950 | NAD+ ADP-ribosyltransferase activity(GO:0003950) |
| 0.1 | 1.2 | GO:0005337 | nucleoside transmembrane transporter activity(GO:0005337) |
| 0.1 | 0.8 | GO:0033038 | bitter taste receptor activity(GO:0033038) |
| 0.1 | 15.0 | GO:0030246 | carbohydrate binding(GO:0030246) |
| 0.0 | 5.7 | GO:0001158 | enhancer sequence-specific DNA binding(GO:0001158) |
| 0.0 | 6.5 | GO:0016616 | oxidoreductase activity, acting on the CH-OH group of donors, NAD or NADP as acceptor(GO:0016616) |
| 0.0 | 0.3 | GO:0009378 | four-way junction helicase activity(GO:0009378) |
| 0.0 | 2.0 | GO:0043022 | ribosome binding(GO:0043022) |
| 0.0 | 1.9 | GO:0019843 | rRNA binding(GO:0019843) |
| 0.0 | 16.5 | GO:0000977 | RNA polymerase II regulatory region sequence-specific DNA binding(GO:0000977) |
| 0.0 | 0.4 | GO:0043422 | protein kinase B binding(GO:0043422) |
| 0.0 | 1.5 | GO:0003743 | translation initiation factor activity(GO:0003743) |
| 0.0 | 0.3 | GO:0008527 | taste receptor activity(GO:0008527) |
| 0.0 | 1.1 | GO:0008146 | sulfotransferase activity(GO:0008146) |
| 0.0 | 0.9 | GO:0003777 | microtubule motor activity(GO:0003777) |
| 0.0 | 0.5 | GO:0001046 | core promoter sequence-specific DNA binding(GO:0001046) |
| 0.0 | 0.1 | GO:0046965 | retinoid X receptor binding(GO:0046965) |
| 0.0 | 0.6 | GO:0004402 | histone acetyltransferase activity(GO:0004402) |
Gene overrepresentation in curated gene sets: canonical pathways category:
| Log-likelihood per target | Total log-likelihood | Term | Description |
|---|---|---|---|
| 0.7 | 41.1 | SIG BCR SIGNALING PATHWAY | Members of the BCR signaling pathway |
| 0.7 | 6.7 | SA G2 AND M PHASES | Cdc25 activates the cdc2/cyclin B complex to induce the G2/M transition. |
| 0.3 | 2.1 | ST IL 13 PATHWAY | Interleukin 13 (IL-13) Pathway |
| 0.2 | 10.1 | PID FCER1 PATHWAY | Fc-epsilon receptor I signaling in mast cells |
| 0.2 | 10.3 | PID BCR 5PATHWAY | BCR signaling pathway |
| 0.2 | 6.1 | PID IL23 PATHWAY | IL23-mediated signaling events |
| 0.2 | 3.6 | ST GA12 PATHWAY | G alpha 12 Pathway |
| 0.1 | 11.1 | PID ERA GENOMIC PATHWAY | Validated nuclear estrogen receptor alpha network |
| 0.1 | 1.2 | PID S1P S1P4 PATHWAY | S1P4 pathway |
| 0.1 | 4.6 | PID SYNDECAN 1 PATHWAY | Syndecan-1-mediated signaling events |
| 0.1 | 30.5 | NABA SECRETED FACTORS | Genes encoding secreted soluble factors |
| 0.1 | 4.4 | PID RHOA PATHWAY | RhoA signaling pathway |
| 0.1 | 2.2 | PID LIS1 PATHWAY | Lissencephaly gene (LIS1) in neuronal migration and development |
| 0.1 | 2.0 | PID HNF3A PATHWAY | FOXA1 transcription factor network |
| 0.1 | 4.8 | PID SMAD2 3NUCLEAR PATHWAY | Regulation of nuclear SMAD2/3 signaling |
| 0.1 | 0.5 | PID WNT CANONICAL PATHWAY | Canonical Wnt signaling pathway |
| 0.0 | 7.3 | NABA ECM AFFILIATED | Genes encoding proteins affiliated structurally or functionally to extracellular matrix proteins |
| 0.0 | 3.7 | PID MYC ACTIV PATHWAY | Validated targets of C-MYC transcriptional activation |
| 0.0 | 1.9 | NABA PROTEOGLYCANS | Genes encoding proteoglycans |
| 0.0 | 1.9 | WNT SIGNALING | Genes related to Wnt-mediated signal transduction |
| 0.0 | 0.5 | PID ARF 3PATHWAY | Arf1 pathway |
| 0.0 | 0.4 | PID AVB3 INTEGRIN PATHWAY | Integrins in angiogenesis |
Gene overrepresentation in curated gene sets: REACTOME pathways category:
| Log-likelihood per target | Total log-likelihood | Term | Description |
|---|---|---|---|
| 2.0 | 3.9 | REACTOME VIF MEDIATED DEGRADATION OF APOBEC3G | Genes involved in Vif-mediated degradation of APOBEC3G |
| 0.7 | 36.7 | REACTOME IMMUNOREGULATORY INTERACTIONS BETWEEN A LYMPHOID AND A NON LYMPHOID CELL | Genes involved in Immunoregulatory interactions between a Lymphoid and a non-Lymphoid cell |
| 0.7 | 49.1 | REACTOME ANTIGEN PROCESSING CROSS PRESENTATION | Genes involved in Antigen processing-Cross presentation |
| 0.5 | 6.5 | REACTOME PURINE RIBONUCLEOSIDE MONOPHOSPHATE BIOSYNTHESIS | Genes involved in Purine ribonucleoside monophosphate biosynthesis |
| 0.4 | 6.7 | REACTOME SCFSKP2 MEDIATED DEGRADATION OF P27 P21 | Genes involved in SCF(Skp2)-mediated degradation of p27/p21 |
| 0.4 | 22.6 | REACTOME INTERFERON GAMMA SIGNALING | Genes involved in Interferon gamma signaling |
| 0.4 | 19.9 | REACTOME ION TRANSPORT BY P TYPE ATPASES | Genes involved in Ion transport by P-type ATPases |
| 0.3 | 9.6 | REACTOME INHIBITION OF INSULIN SECRETION BY ADRENALINE NORADRENALINE | Genes involved in Inhibition of Insulin Secretion by Adrenaline/Noradrenaline |
| 0.3 | 12.2 | REACTOME STRIATED MUSCLE CONTRACTION | Genes involved in Striated Muscle Contraction |
| 0.3 | 15.6 | REACTOME CHEMOKINE RECEPTORS BIND CHEMOKINES | Genes involved in Chemokine receptors bind chemokines |
| 0.3 | 5.0 | REACTOME AMINE DERIVED HORMONES | Genes involved in Amine-derived hormones |
| 0.2 | 5.3 | REACTOME GLUCAGON TYPE LIGAND RECEPTORS | Genes involved in Glucagon-type ligand receptors |
| 0.2 | 4.6 | REACTOME INWARDLY RECTIFYING K CHANNELS | Genes involved in Inwardly rectifying K+ channels |
| 0.2 | 3.8 | REACTOME G0 AND EARLY G1 | Genes involved in G0 and Early G1 |
| 0.1 | 4.6 | REACTOME NCAM1 INTERACTIONS | Genes involved in NCAM1 interactions |
| 0.1 | 8.6 | REACTOME CELL SURFACE INTERACTIONS AT THE VASCULAR WALL | Genes involved in Cell surface interactions at the vascular wall |
| 0.1 | 11.5 | REACTOME G ALPHA I SIGNALLING EVENTS | Genes involved in G alpha (i) signalling events |
| 0.1 | 1.7 | REACTOME GLYCOGEN BREAKDOWN GLYCOGENOLYSIS | Genes involved in Glycogen breakdown (glycogenolysis) |
| 0.1 | 3.2 | REACTOME DEPOSITION OF NEW CENPA CONTAINING NUCLEOSOMES AT THE CENTROMERE | Genes involved in Deposition of New CENPA-containing Nucleosomes at the Centromere |
| 0.1 | 2.1 | REACTOME TRANSPORT OF VITAMINS NUCLEOSIDES AND RELATED MOLECULES | Genes involved in Transport of vitamins, nucleosides, and related molecules |
| 0.1 | 3.0 | REACTOME CLASS B 2 SECRETIN FAMILY RECEPTORS | Genes involved in Class B/2 (Secretin family receptors) |
| 0.1 | 1.1 | REACTOME PTM GAMMA CARBOXYLATION HYPUSINE FORMATION AND ARYLSULFATASE ACTIVATION | Genes involved in PTM: gamma carboxylation, hypusine formation and arylsulfatase activation |
| 0.0 | 0.6 | REACTOME AUTODEGRADATION OF CDH1 BY CDH1 APC C | Genes involved in Autodegradation of Cdh1 by Cdh1:APC/C |
| 0.0 | 0.4 | REACTOME ROLE OF DCC IN REGULATING APOPTOSIS | Genes involved in Role of DCC in regulating apoptosis |
| 0.0 | 3.6 | REACTOME NGF SIGNALLING VIA TRKA FROM THE PLASMA MEMBRANE | Genes involved in NGF signalling via TRKA from the plasma membrane |
| 0.0 | 1.0 | REACTOME GLUCONEOGENESIS | Genes involved in Gluconeogenesis |
| 0.0 | 1.4 | REACTOME LOSS OF NLP FROM MITOTIC CENTROSOMES | Genes involved in Loss of Nlp from mitotic centrosomes |
| 0.0 | 0.7 | REACTOME MEIOTIC SYNAPSIS | Genes involved in Meiotic Synapsis |
| 0.0 | 2.0 | REACTOME MITOTIC PROMETAPHASE | Genes involved in Mitotic Prometaphase |
| 0.0 | 2.6 | REACTOME ANTIGEN PROCESSING UBIQUITINATION PROTEASOME DEGRADATION | Genes involved in Antigen processing: Ubiquitination & Proteasome degradation |
| 0.0 | 0.6 | REACTOME RNA POL II TRANSCRIPTION PRE INITIATION AND PROMOTER OPENING | Genes involved in RNA Polymerase II Transcription Pre-Initiation And Promoter Opening |
| 0.0 | 1.1 | REACTOME NUCLEAR RECEPTOR TRANSCRIPTION PATHWAY | Genes involved in Nuclear Receptor transcription pathway |
| 0.0 | 2.0 | REACTOME METABOLISM OF AMINO ACIDS AND DERIVATIVES | Genes involved in Metabolism of amino acids and derivatives |
| 0.0 | 0.4 | REACTOME ASSOCIATION OF TRIC CCT WITH TARGET PROTEINS DURING BIOSYNTHESIS | Genes involved in Association of TriC/CCT with target proteins during biosynthesis |