Project
GSE53960: rat RNA-Seq transcriptomic Bodymap
Navigation
Downloads
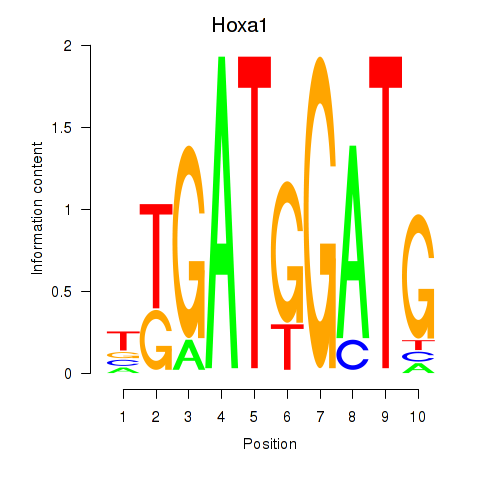
Results for Hoxa1
Z-value: 1.37
Motif logo
Transcription factors associated with Hoxa1
| Gene Symbol | Gene ID | Gene Info |
|---|---|---|
|
Hoxa1
|
ENSRNOG00000005628 | homeo box A1 |
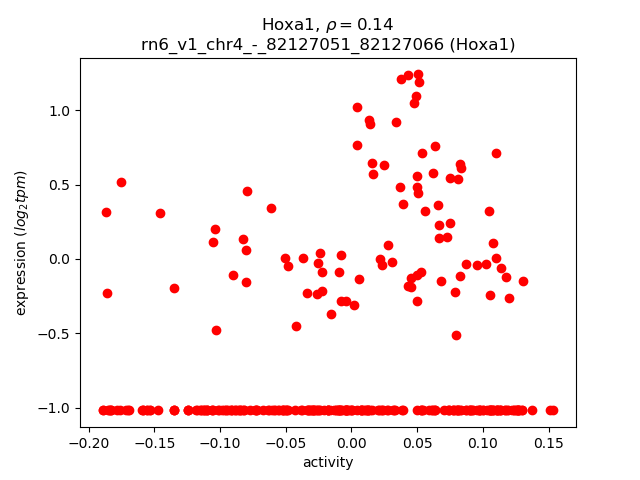
Activity-expression correlation:
| Gene | Promoter | Pearson corr. coef. | P-value | Plot |
|---|---|---|---|---|
| Hoxa1 | rn6_v1_chr4_-_82127051_82127066 | 0.14 | 1.3e-02 | Click! |
Activity profile of Hoxa1 motif
Sorted Z-values of Hoxa1 motif
| Promoter | Log-likelihood | Transcript | Gene | Gene Info |
|---|---|---|---|---|
| chr10_-_96131880 | 78.49 |
ENSRNOT00000004578
|
Cacng5
|
calcium voltage-gated channel auxiliary subunit gamma 5 |
| chr4_-_184096806 | 74.49 |
ENSRNOT00000055433
|
LOC100362344
|
mKIAA1238 protein-like |
| chr9_-_88256115 | 73.28 |
ENSRNOT00000076472
|
Col4a4
|
collagen type IV alpha 4 chain |
| chr8_+_13796021 | 72.75 |
ENSRNOT00000013927
|
Vstm5
|
V-set and transmembrane domain containing 5 |
| chr3_+_154863072 | 58.49 |
ENSRNOT00000055200
|
Snhg11
|
small nucleolar RNA host gene 11 |
| chr11_-_64421248 | 54.15 |
ENSRNOT00000066997
|
Igsf11
|
immunoglobulin superfamily, member 11 |
| chr3_+_51883559 | 42.63 |
ENSRNOT00000007197
|
Csrnp3
|
cysteine and serine rich nuclear protein 3 |
| chr15_-_88036354 | 41.88 |
ENSRNOT00000014747
|
Ednrb
|
endothelin receptor type B |
| chr1_-_170397191 | 41.19 |
ENSRNOT00000090181
|
Apbb1
|
amyloid beta precursor protein binding family B member 1 |
| chr4_-_155275161 | 40.17 |
ENSRNOT00000032690
|
Rimklb
|
ribosomal modification protein rimK-like family member B |
| chr20_-_4489281 | 39.08 |
ENSRNOT00000031548
|
Cyp21a1
|
cytochrome P450, family 21, subfamily a, polypeptide 1 |
| chr13_+_46169963 | 36.84 |
ENSRNOT00000005212
|
Thsd7b
|
thrombospondin type 1 domain containing 7B |
| chr8_-_2045817 | 35.71 |
ENSRNOT00000009542
ENSRNOT00000081171 ENSRNOT00000078765 |
Gria4
|
glutamate ionotropic receptor AMPA type subunit 4 |
| chr4_-_4473307 | 33.88 |
ENSRNOT00000045773
|
Dpp6
|
dipeptidyl peptidase like 6 |
| chr13_+_77485113 | 28.03 |
ENSRNOT00000080254
|
Tnr
|
tenascin R |
| chr10_+_42614713 | 26.14 |
ENSRNOT00000081136
ENSRNOT00000073148 |
Gria1
|
glutamate ionotropic receptor AMPA type subunit 1 |
| chr9_+_118849302 | 25.66 |
ENSRNOT00000087592
|
Dlgap1
|
DLG associated protein 1 |
| chr16_+_46731403 | 25.44 |
ENSRNOT00000017624
|
Tenm3
|
teneurin transmembrane protein 3 |
| chr9_-_60255746 | 24.66 |
ENSRNOT00000093710
|
Dnah7
|
dynein, axonemal, heavy chain 7 |
| chr5_-_126395668 | 24.08 |
ENSRNOT00000010396
|
Acot11
|
acyl-CoA thioesterase 11 |
| chr15_+_43007908 | 23.23 |
ENSRNOT00000084753
ENSRNOT00000091567 ENSRNOT00000087709 |
Stmn4
|
stathmin 4 |
| chr1_-_7443863 | 21.96 |
ENSRNOT00000088558
|
Phactr2
|
phosphatase and actin regulator 2 |
| chr1_-_260992291 | 20.56 |
ENSRNOT00000035415
ENSRNOT00000034758 |
Slit1
|
slit guidance ligand 1 |
| chr2_+_3662763 | 19.18 |
ENSRNOT00000017828
|
Mctp1
|
multiple C2 and transmembrane domain containing 1 |
| chr7_+_123482255 | 17.86 |
ENSRNOT00000064487
|
LOC688613
|
hypothetical protein LOC688613 |
| chr2_+_145174876 | 17.26 |
ENSRNOT00000040631
|
Mab21l1
|
mab-21 like 1 |
| chr4_-_170860225 | 16.24 |
ENSRNOT00000007577
|
Mgp
|
matrix Gla protein |
| chr8_+_82257849 | 16.24 |
ENSRNOT00000011963
ENSRNOT00000075708 |
Gnb5
|
G protein subunit beta 5 |
| chr3_-_158328881 | 16.18 |
ENSRNOT00000044466
|
Ptprt
|
protein tyrosine phosphatase, receptor type, T |
| chr1_+_264796812 | 15.58 |
ENSRNOT00000021171
|
Sfxn3
|
sideroflexin 3 |
| chr5_+_124021366 | 15.15 |
ENSRNOT00000009977
|
Dab1
|
DAB1, reelin adaptor protein |
| chr7_+_70753101 | 13.69 |
ENSRNOT00000090001
|
R3hdm2
|
R3H domain containing 2 |
| chr7_+_29435444 | 12.94 |
ENSRNOT00000008613
|
Slc5a8
|
solute carrier family 5 member 8 |
| chr6_+_26387877 | 12.24 |
ENSRNOT00000076105
|
Fndc4
|
|
| chr17_+_4846789 | 12.07 |
ENSRNOT00000073271
|
Gas1
|
growth arrest-specific 1 |
| chr20_-_31956649 | 11.95 |
ENSRNOT00000072429
|
Hk1
|
hexokinase 1 |
| chr7_+_124680294 | 11.86 |
ENSRNOT00000014720
|
Mpped1
|
metallophosphoesterase domain containing 1 |
| chr13_+_84474319 | 11.82 |
ENSRNOT00000031367
ENSRNOT00000072244 ENSRNOT00000072897 ENSRNOT00000064168 ENSRNOT00000074954 ENSRNOT00000073696 |
Ildr2
|
immunoglobulin-like domain containing receptor 2 |
| chr15_+_41448064 | 11.40 |
ENSRNOT00000019551
|
Sacs
|
sacsin molecular chaperone |
| chr12_+_11179329 | 11.34 |
ENSRNOT00000001302
|
Zfp394
|
zinc finger protein 394 |
| chr10_-_25910298 | 10.83 |
ENSRNOT00000065633
ENSRNOT00000079646 |
Ccng1
|
cyclin G1 |
| chr5_-_7941822 | 10.48 |
ENSRNOT00000079917
|
Prex2
|
phosphatidylinositol-3,4,5-trisphosphate-dependent Rac exchange factor 2 |
| chr12_+_49419582 | 10.05 |
ENSRNOT00000082998
|
RGD1306556
|
similar to hypothetical protein A530094D01 |
| chr14_+_3506339 | 9.82 |
ENSRNOT00000002867
|
Tgfbr3
|
transforming growth factor beta receptor 3 |
| chr10_-_14443010 | 9.79 |
ENSRNOT00000022142
|
Tmem204
|
transmembrane protein 204 |
| chr5_-_6083083 | 9.64 |
ENSRNOT00000072411
|
Sulf1
|
sulfatase 1 |
| chr10_+_84200880 | 9.39 |
ENSRNOT00000011213
|
Hoxb2
|
homeobox B2 |
| chr19_-_39267928 | 9.19 |
ENSRNOT00000027686
|
Tmed6
|
transmembrane p24 trafficking protein 6 |
| chr12_+_13323547 | 8.74 |
ENSRNOT00000074138
|
Zfp853
|
zinc finger protein 853 |
| chr11_-_25078740 | 8.70 |
ENSRNOT00000002109
|
Cyyr1
|
cysteine and tyrosine rich 1 |
| chr12_+_17735740 | 8.56 |
ENSRNOT00000001775
|
Pdgfa
|
platelet derived growth factor subunit A |
| chr3_-_133122691 | 8.56 |
ENSRNOT00000083637
|
Tasp1
|
taspase 1 |
| chr13_+_71107465 | 8.41 |
ENSRNOT00000003239
|
Rgs8
|
regulator of G-protein signaling 8 |
| chr10_-_8498422 | 8.18 |
ENSRNOT00000082332
|
Rbfox1
|
RNA binding protein, fox-1 homolog 1 |
| chrX_+_82143789 | 7.50 |
ENSRNOT00000003724
|
Pou3f4
|
POU class 3 homeobox 4 |
| chr16_+_24980723 | 7.41 |
ENSRNOT00000082142
|
Tma16
|
translation machinery associated 16 homolog |
| chr4_+_31333970 | 7.28 |
ENSRNOT00000064866
|
LOC100911994
|
coiled-coil domain-containing protein 132-like |
| chr15_-_18675431 | 7.20 |
ENSRNOT00000080794
|
Abhd6
|
abhydrolase domain containing 6 |
| chr16_+_4997461 | 7.19 |
ENSRNOT00000071042
|
LOC102547963
|
leucine-rich repeat and transmembrane domain-containing protein 1-like |
| chr10_-_87153982 | 6.35 |
ENSRNOT00000014414
|
Krt222
|
keratin 222 |
| chr12_+_13810180 | 5.70 |
ENSRNOT00000084865
ENSRNOT00000038203 |
Tnrc18
|
trinucleotide repeat containing 18 |
| chr1_+_243375981 | 5.11 |
ENSRNOT00000080689
|
Kank1
|
KN motif and ankyrin repeat domains 1 |
| chr1_-_215838209 | 4.81 |
ENSRNOT00000050760
|
Igf2
|
insulin-like growth factor 2 |
| chr20_-_6556350 | 4.03 |
ENSRNOT00000035819
|
Lemd2
|
LEM domain containing 2 |
| chr1_-_222350173 | 3.93 |
ENSRNOT00000030625
|
Flrt1
|
fibronectin leucine rich transmembrane protein 1 |
| chr5_+_168078748 | 3.43 |
ENSRNOT00000024798
|
Uts2
|
urotensin 2 |
| chr10_-_95062987 | 3.10 |
ENSRNOT00000019781
|
Smurf2
|
SMAD specific E3 ubiquitin protein ligase 2 |
| chr2_+_248398917 | 2.94 |
ENSRNOT00000045855
|
Gbp1
|
guanylate binding protein 1 |
| chr3_+_148438939 | 2.84 |
ENSRNOT00000064196
|
Ttll9
|
tubulin tyrosine ligase like 9 |
| chr6_+_145546595 | 2.62 |
ENSRNOT00000007112
|
Rapgef5
|
Rap guanine nucleotide exchange factor 5 |
| chr8_-_19386384 | 2.54 |
ENSRNOT00000051572
|
Olr1145
|
olfactory receptor 1145 |
| chr13_+_75059927 | 2.25 |
ENSRNOT00000080801
|
LOC680254
|
hypothetical protein LOC680254 |
| chr5_-_155381732 | 2.08 |
ENSRNOT00000033670
|
Zbtb40
|
zinc finger and BTB domain containing 40 |
| chr16_-_62241361 | 1.94 |
ENSRNOT00000090036
|
Gsr
|
glutathione-disulfide reductase |
| chr16_+_83522162 | 1.89 |
ENSRNOT00000057386
|
Col4a1
|
collagen type IV alpha 1 chain |
| chr16_+_34795971 | 1.85 |
ENSRNOT00000043510
|
LOC100912321
|
myeloid-associated differentiation marker-like |
| chr1_+_230030914 | 1.69 |
ENSRNOT00000075730
|
Olr354
|
olfactory receptor 354 |
| chr1_+_229443102 | 1.58 |
ENSRNOT00000067320
|
Olr334
|
olfactory receptor 334 |
| chr1_+_229480184 | 1.36 |
ENSRNOT00000044115
|
Olr387
|
olfactory receptor 387 |
| chr17_-_66397653 | 1.30 |
ENSRNOT00000024098
|
Actn2
|
actinin alpha 2 |
| chr2_+_205488182 | 1.16 |
ENSRNOT00000024270
|
Sike1
|
suppressor of IKBKE 1 |
| chr2_-_209582627 | 0.97 |
ENSRNOT00000024351
|
Olr392
|
olfactory receptor 392 |
| chr4_+_149908375 | 0.95 |
ENSRNOT00000019504
|
LOC100909657
|
uncharacterized LOC100909657 |
| chr1_+_167811491 | 0.79 |
ENSRNOT00000072109
|
LOC684171
|
similar to olfactory receptor 555 |
| chr2_+_92549479 | 0.70 |
ENSRNOT00000082912
|
tGap1
|
GTPase activating protein testicular GAP1 |
| chr6_+_26566494 | 0.62 |
ENSRNOT00000079292
|
Gtf3c2
|
general transcription factor IIIC subunit 2 |
| chr10_-_62366044 | 0.38 |
ENSRNOT00000045673
|
Olr1474
|
olfactory receptor 1474 |
| chr16_-_20640720 | 0.37 |
ENSRNOT00000083254
|
AABR07024877.1
|
|
| chr10_-_65507581 | 0.21 |
ENSRNOT00000016759
|
Supt6h
|
SPT6 homolog, histone chaperone |
| chr8_+_20535478 | 0.05 |
ENSRNOT00000049066
|
Olr1174
|
olfactory receptor 1174 |
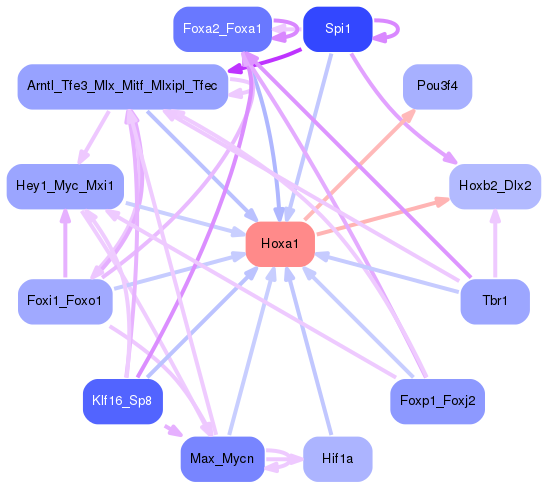
Network of associatons between targets according to the STRING database.

First level regulatory network of Hoxa1
Gene Ontology Analysis
Gene overrepresentation in biological process category:
| Log-likelihood per target | Total log-likelihood | Term | Description |
|---|---|---|---|
| 10.5 | 41.9 | GO:0014826 | vein smooth muscle contraction(GO:0014826) |
| 6.4 | 82.9 | GO:0032836 | glomerular basement membrane development(GO:0032836) |
| 5.1 | 20.6 | GO:0021834 | chemorepulsion involved in embryonic olfactory bulb interneuron precursor migration(GO:0021834) |
| 5.0 | 15.1 | GO:0021589 | hindbrain structural organization(GO:0021577) cerebellum structural organization(GO:0021589) neuronal-glial interaction involved in cerebral cortex radial glia guided migration(GO:0021812) |
| 4.7 | 28.0 | GO:0048690 | axon extension involved in regeneration(GO:0048677) sprouting of injured axon(GO:0048682) regulation of sprouting of injured axon(GO:0048686) regulation of axon extension involved in regeneration(GO:0048690) |
| 3.7 | 26.1 | GO:0099566 | regulation of postsynaptic cytosolic calcium ion concentration(GO:0099566) |
| 3.3 | 9.8 | GO:0060939 | transforming growth factor beta receptor complex assembly(GO:0007181) cardiac fibroblast cell differentiation(GO:0060935) cardiac fibroblast cell development(GO:0060936) epicardium-derived cardiac fibroblast cell differentiation(GO:0060938) epicardium-derived cardiac fibroblast cell development(GO:0060939) |
| 3.2 | 25.7 | GO:0070842 | aggresome assembly(GO:0070842) |
| 3.1 | 9.4 | GO:0021570 | rhombomere 3 development(GO:0021569) rhombomere 4 development(GO:0021570) |
| 3.1 | 15.6 | GO:0006842 | tricarboxylic acid transport(GO:0006842) |
| 2.9 | 78.5 | GO:2000311 | regulation of alpha-amino-3-hydroxy-5-methyl-4-isoxazole propionate selective glutamate receptor activity(GO:2000311) |
| 2.9 | 8.6 | GO:1990401 | regulation of branching involved in salivary gland morphogenesis by epithelial-mesenchymal signaling(GO:0060683) embryonic lung development(GO:1990401) |
| 2.8 | 39.1 | GO:0006705 | mineralocorticoid biosynthetic process(GO:0006705) |
| 2.3 | 25.4 | GO:0097264 | self proteolysis(GO:0097264) |
| 2.0 | 11.9 | GO:0072656 | maintenance of protein location in mitochondrion(GO:0072656) |
| 1.8 | 7.2 | GO:2000124 | regulation of endocannabinoid signaling pathway(GO:2000124) |
| 1.6 | 35.7 | GO:0060992 | response to fungicide(GO:0060992) |
| 1.5 | 24.7 | GO:0036159 | inner dynein arm assembly(GO:0036159) |
| 1.3 | 5.1 | GO:2000393 | negative regulation of lamellipodium morphogenesis(GO:2000393) |
| 1.2 | 12.1 | GO:0042473 | outer ear morphogenesis(GO:0042473) |
| 1.1 | 3.4 | GO:0010841 | positive regulation of circadian sleep/wake cycle, wakefulness(GO:0010841) |
| 1.0 | 11.4 | GO:0090084 | negative regulation of inclusion body assembly(GO:0090084) |
| 1.0 | 3.1 | GO:1901165 | positive regulation of trophoblast cell migration(GO:1901165) |
| 1.0 | 16.2 | GO:1901386 | negative regulation of voltage-gated calcium channel activity(GO:1901386) |
| 0.8 | 35.2 | GO:1901381 | positive regulation of potassium ion transmembrane transport(GO:1901381) |
| 0.8 | 8.4 | GO:0060159 | regulation of dopamine receptor signaling pathway(GO:0060159) |
| 0.7 | 41.2 | GO:0045739 | positive regulation of DNA repair(GO:0045739) |
| 0.7 | 4.8 | GO:0038028 | insulin receptor signaling pathway via phosphatidylinositol 3-kinase(GO:0038028) |
| 0.6 | 7.5 | GO:2001054 | negative regulation of mesenchymal cell apoptotic process(GO:2001054) |
| 0.5 | 2.9 | GO:1900041 | negative regulation of interleukin-2 secretion(GO:1900041) |
| 0.5 | 42.6 | GO:0010923 | negative regulation of phosphatase activity(GO:0010923) |
| 0.4 | 5.7 | GO:0031507 | heterochromatin assembly(GO:0031507) |
| 0.4 | 10.8 | GO:0031572 | mitotic G2 DNA damage checkpoint(GO:0007095) G2 DNA damage checkpoint(GO:0031572) |
| 0.4 | 8.2 | GO:2001014 | regulation of skeletal muscle cell differentiation(GO:2001014) |
| 0.4 | 9.8 | GO:0030947 | regulation of vascular endothelial growth factor receptor signaling pathway(GO:0030947) |
| 0.4 | 1.9 | GO:0061304 | retinal blood vessel morphogenesis(GO:0061304) |
| 0.4 | 4.0 | GO:0097240 | meiotic telomere tethering at nuclear periphery(GO:0044821) meiotic attachment of telomere to nuclear envelope(GO:0070197) chromosome attachment to the nuclear envelope(GO:0097240) |
| 0.4 | 23.2 | GO:0007019 | microtubule depolymerization(GO:0007019) |
| 0.3 | 24.1 | GO:0009409 | response to cold(GO:0009409) |
| 0.2 | 11.8 | GO:0048873 | homeostasis of number of cells within a tissue(GO:0048873) |
| 0.2 | 16.2 | GO:0030500 | regulation of bone mineralization(GO:0030500) |
| 0.2 | 10.5 | GO:0032007 | negative regulation of TOR signaling(GO:0032007) |
| 0.2 | 1.9 | GO:0010041 | response to iron(III) ion(GO:0010041) |
| 0.1 | 16.2 | GO:0035335 | peptidyl-tyrosine dephosphorylation(GO:0035335) |
| 0.1 | 11.1 | GO:0051965 | positive regulation of synapse assembly(GO:0051965) |
| 0.1 | 43.4 | GO:0040008 | regulation of growth(GO:0040008) |
| 0.1 | 17.3 | GO:0043010 | camera-type eye development(GO:0043010) |
| 0.1 | 0.2 | GO:0070827 | chromatin maintenance(GO:0070827) |
| 0.0 | 19.2 | GO:0043086 | negative regulation of catalytic activity(GO:0043086) |
| 0.0 | 79.1 | GO:0036211 | cellular protein modification process(GO:0006464) protein modification process(GO:0036211) |
| 0.0 | 0.6 | GO:0006383 | transcription from RNA polymerase III promoter(GO:0006383) |
Gene overrepresentation in cellular component category:
| Log-likelihood per target | Total log-likelihood | Term | Description |
|---|---|---|---|
| 10.3 | 41.2 | GO:1990761 | growth cone lamellipodium(GO:1990761) growth cone filopodium(GO:1990812) |
| 9.4 | 75.2 | GO:0098645 | collagen type IV trimer(GO:0005587) network-forming collagen trimer(GO:0098642) collagen network(GO:0098645) |
| 6.2 | 24.7 | GO:0036156 | inner dynein arm(GO:0036156) |
| 6.0 | 35.7 | GO:0032983 | kainate selective glutamate receptor complex(GO:0032983) |
| 5.6 | 28.0 | GO:0072534 | perineuronal net(GO:0072534) |
| 4.4 | 26.1 | GO:0044308 | axonal spine(GO:0044308) |
| 3.3 | 9.8 | GO:0034673 | inhibin-betaglycan-ActRII complex(GO:0034673) |
| 2.8 | 85.7 | GO:0032281 | AMPA glutamate receptor complex(GO:0032281) |
| 0.7 | 2.9 | GO:0020005 | symbiont-containing vacuole membrane(GO:0020005) |
| 0.6 | 5.7 | GO:0005677 | chromatin silencing complex(GO:0005677) |
| 0.4 | 12.3 | GO:0032809 | neuronal cell body membrane(GO:0032809) |
| 0.4 | 16.2 | GO:0005834 | heterotrimeric G-protein complex(GO:0005834) |
| 0.4 | 11.9 | GO:0097228 | sperm principal piece(GO:0097228) |
| 0.3 | 33.9 | GO:0008076 | voltage-gated potassium channel complex(GO:0008076) |
| 0.3 | 12.1 | GO:0046658 | anchored component of plasma membrane(GO:0046658) |
| 0.2 | 4.0 | GO:0031229 | integral component of nuclear inner membrane(GO:0005639) intrinsic component of nuclear inner membrane(GO:0031229) |
| 0.1 | 23.2 | GO:0030426 | growth cone(GO:0030426) |
| 0.1 | 40.8 | GO:0014069 | postsynaptic density(GO:0014069) |
| 0.1 | 51.5 | GO:0098857 | membrane raft(GO:0045121) membrane microdomain(GO:0098857) |
| 0.1 | 8.6 | GO:0005902 | microvillus(GO:0005902) |
| 0.1 | 5.1 | GO:0032587 | ruffle membrane(GO:0032587) |
| 0.1 | 0.6 | GO:0000127 | transcription factor TFIIIC complex(GO:0000127) |
| 0.1 | 43.2 | GO:0005789 | endoplasmic reticulum membrane(GO:0005789) |
| 0.0 | 8.2 | GO:0005802 | trans-Golgi network(GO:0005802) |
| 0.0 | 6.4 | GO:0005882 | intermediate filament(GO:0005882) |
| 0.0 | 92.1 | GO:0070062 | extracellular exosome(GO:0070062) |
| 0.0 | 15.6 | GO:0031966 | mitochondrial membrane(GO:0031966) |
| 0.0 | 10.8 | GO:0043025 | neuronal cell body(GO:0043025) |
| 0.0 | 3.1 | GO:0000151 | ubiquitin ligase complex(GO:0000151) |
| 0.0 | 10.3 | GO:0005615 | extracellular space(GO:0005615) |
| 0.0 | 0.2 | GO:0035327 | transcriptionally active chromatin(GO:0035327) |
| 0.0 | 78.9 | GO:0016021 | integral component of membrane(GO:0016021) |
| 0.0 | 3.5 | GO:0005840 | ribosome(GO:0005840) |
| 0.0 | 82.1 | GO:0005737 | cytoplasm(GO:0005737) |
Gene overrepresentation in molecular function category:
| Log-likelihood per target | Total log-likelihood | Term | Description |
|---|---|---|---|
| 38.2 | 114.7 | GO:0072590 | N-acetyl-L-aspartate-L-glutamate ligase activity(GO:0072590) |
| 12.4 | 61.8 | GO:0004971 | AMPA glutamate receptor activity(GO:0004971) |
| 8.4 | 41.9 | GO:0004962 | endothelin receptor activity(GO:0004962) |
| 3.4 | 33.9 | GO:0008239 | dipeptidyl-peptidase activity(GO:0008239) |
| 3.1 | 15.6 | GO:0015142 | tricarboxylic acid transmembrane transporter activity(GO:0015142) |
| 2.9 | 20.6 | GO:0048495 | Roundabout binding(GO:0048495) |
| 2.4 | 9.6 | GO:0008449 | N-acetylglucosamine-6-sulfatase activity(GO:0008449) |
| 2.0 | 11.9 | GO:0004340 | glucokinase activity(GO:0004340) hexokinase activity(GO:0004396) fructokinase activity(GO:0008865) mannokinase activity(GO:0019158) |
| 2.0 | 25.7 | GO:0098879 | structural constituent of postsynaptic specialization(GO:0098879) structural constituent of postsynaptic density(GO:0098919) |
| 2.0 | 41.2 | GO:0048156 | tau protein binding(GO:0048156) |
| 1.4 | 78.5 | GO:0005245 | voltage-gated calcium channel activity(GO:0005245) |
| 1.4 | 91.3 | GO:0005201 | extracellular matrix structural constituent(GO:0005201) |
| 1.4 | 39.1 | GO:0008395 | steroid hydroxylase activity(GO:0008395) |
| 1.2 | 16.2 | GO:0070097 | alpha-catenin binding(GO:0045294) delta-catenin binding(GO:0070097) |
| 1.1 | 8.6 | GO:0048407 | platelet-derived growth factor binding(GO:0048407) |
| 1.0 | 9.8 | GO:0005114 | type II transforming growth factor beta receptor binding(GO:0005114) |
| 0.9 | 16.2 | GO:0032794 | GTPase activating protein binding(GO:0032794) |
| 0.7 | 7.5 | GO:0003680 | AT DNA binding(GO:0003680) |
| 0.7 | 2.9 | GO:0019002 | GMP binding(GO:0019002) |
| 0.7 | 22.0 | GO:0004864 | protein phosphatase inhibitor activity(GO:0004864) |
| 0.6 | 11.4 | GO:0070628 | proteasome binding(GO:0070628) |
| 0.6 | 7.2 | GO:0047372 | acylglycerol lipase activity(GO:0047372) |
| 0.5 | 10.5 | GO:0030676 | Rac guanyl-nucleotide exchange factor activity(GO:0030676) |
| 0.3 | 8.6 | GO:0070003 | threonine-type endopeptidase activity(GO:0004298) threonine-type peptidase activity(GO:0070003) |
| 0.3 | 15.1 | GO:0043548 | phosphatidylinositol 3-kinase binding(GO:0043548) |
| 0.3 | 2.6 | GO:0017034 | Rap guanyl-nucleotide exchange factor activity(GO:0017034) |
| 0.3 | 19.2 | GO:0005544 | calcium-dependent phospholipid binding(GO:0005544) |
| 0.3 | 1.9 | GO:0015038 | glutathione disulfide oxidoreductase activity(GO:0015038) |
| 0.3 | 4.8 | GO:0005159 | insulin-like growth factor receptor binding(GO:0005159) |
| 0.3 | 1.3 | GO:0051373 | FATZ binding(GO:0051373) |
| 0.3 | 28.0 | GO:0005178 | integrin binding(GO:0005178) |
| 0.3 | 8.4 | GO:0001965 | G-protein alpha-subunit binding(GO:0001965) |
| 0.1 | 3.9 | GO:0005104 | fibroblast growth factor receptor binding(GO:0005104) |
| 0.1 | 11.4 | GO:0003777 | microtubule motor activity(GO:0003777) |
| 0.1 | 5.1 | GO:0008013 | beta-catenin binding(GO:0008013) |
| 0.1 | 23.2 | GO:0015631 | tubulin binding(GO:0015631) |
| 0.1 | 36.3 | GO:0001228 | transcriptional activator activity, RNA polymerase II transcription regulatory region sequence-specific binding(GO:0001228) |
| 0.1 | 3.1 | GO:0005160 | transforming growth factor beta receptor binding(GO:0005160) |
| 0.1 | 0.2 | GO:0000991 | transcription factor activity, core RNA polymerase II binding(GO:0000991) |
| 0.0 | 21.7 | GO:0046982 | protein heterodimerization activity(GO:0046982) |
| 0.0 | 8.2 | GO:0008022 | protein C-terminus binding(GO:0008022) |
| 0.0 | 3.4 | GO:0005179 | hormone activity(GO:0005179) |
| 0.0 | 5.7 | GO:0000976 | transcription regulatory region sequence-specific DNA binding(GO:0000976) |
| 0.0 | 8.1 | GO:0003700 | nucleic acid binding transcription factor activity(GO:0001071) transcription factor activity, sequence-specific DNA binding(GO:0003700) |
| 0.0 | 1.2 | GO:0031490 | chromatin DNA binding(GO:0031490) |
| 0.0 | 2.8 | GO:0016874 | ligase activity(GO:0016874) |
Gene overrepresentation in curated gene sets: canonical pathways category:
| Log-likelihood per target | Total log-likelihood | Term | Description |
|---|---|---|---|
| 1.5 | 75.0 | PID SYNDECAN 1 PATHWAY | Syndecan-1-mediated signaling events |
| 0.7 | 41.9 | PID ARF6 TRAFFICKING PATHWAY | Arf6 trafficking events |
| 0.6 | 16.2 | PID RHODOPSIN PATHWAY | Visual signal transduction: Rods |
| 0.5 | 12.1 | PID HEDGEHOG 2PATHWAY | Signaling events mediated by the Hedgehog family |
| 0.5 | 41.2 | PID ERA GENOMIC PATHWAY | Validated nuclear estrogen receptor alpha network |
| 0.4 | 15.1 | PID REELIN PATHWAY | Reelin signaling pathway |
| 0.4 | 25.4 | PID AJDISS 2PATHWAY | Posttranslational regulation of adherens junction stability and dissassembly |
| 0.4 | 15.3 | PID FRA PATHWAY | Validated transcriptional targets of AP1 family members Fra1 and Fra2 |
| 0.4 | 16.3 | PID EPHB FWD PATHWAY | EPHB forward signaling |
| 0.2 | 10.5 | PID RAC1 REG PATHWAY | Regulation of RAC1 activity |
| 0.2 | 15.6 | PID MYC REPRESS PATHWAY | Validated targets of C-MYC transcriptional repression |
| 0.2 | 12.9 | PID TGFBR PATHWAY | TGF-beta receptor signaling |
| 0.2 | 11.9 | PID HIF1 TFPATHWAY | HIF-1-alpha transcription factor network |
| 0.2 | 8.6 | PID CERAMIDE PATHWAY | Ceramide signaling pathway |
| 0.1 | 28.0 | NABA ECM GLYCOPROTEINS | Genes encoding structural ECM glycoproteins |
| 0.1 | 10.8 | PID P53 DOWNSTREAM PATHWAY | Direct p53 effectors |
| 0.0 | 9.6 | NABA ECM REGULATORS | Genes encoding enzymes and their regulators involved in the remodeling of the extracellular matrix |
Gene overrepresentation in curated gene sets: REACTOME pathways category:
| Log-likelihood per target | Total log-likelihood | Term | Description |
|---|---|---|---|
| 3.5 | 63.2 | REACTOME UNBLOCKING OF NMDA RECEPTOR GLUTAMATE BINDING AND ACTIVATION | Genes involved in Unblocking of NMDA receptor, glutamate binding and activation |
| 1.7 | 75.0 | REACTOME NCAM1 INTERACTIONS | Genes involved in NCAM1 interactions |
| 0.7 | 16.2 | REACTOME G BETA GAMMA SIGNALLING THROUGH PLC BETA | Genes involved in G beta:gamma signalling through PLC beta |
| 0.4 | 20.6 | REACTOME NETRIN1 SIGNALING | Genes involved in Netrin-1 signaling |
| 0.3 | 45.3 | REACTOME G ALPHA Q SIGNALLING EVENTS | Genes involved in G alpha (q) signalling events |
| 0.2 | 11.9 | REACTOME GLUCOSE TRANSPORT | Genes involved in Glucose transport |
| 0.2 | 4.8 | REACTOME REGULATION OF INSULIN LIKE GROWTH FACTOR IGF ACTIVITY BY INSULIN LIKE GROWTH FACTOR BINDING PROTEINS IGFBPS | Genes involved in Regulation of Insulin-like Growth Factor (IGF) Activity by Insulin-like Growth Factor Binding Proteins (IGFBPs) |
| 0.2 | 12.9 | REACTOME AMINO ACID AND OLIGOPEPTIDE SLC TRANSPORTERS | Genes involved in Amino acid and oligopeptide SLC transporters |
| 0.1 | 3.1 | REACTOME DOWNREGULATION OF SMAD2 3 SMAD4 TRANSCRIPTIONAL ACTIVITY | Genes involved in Downregulation of SMAD2/3:SMAD4 transcriptional activity |
| 0.1 | 1.9 | REACTOME SYNTHESIS AND INTERCONVERSION OF NUCLEOTIDE DI AND TRIPHOSPHATES | Genes involved in Synthesis and interconversion of nucleotide di- and triphosphates |
| 0.1 | 8.6 | REACTOME RESPONSE TO ELEVATED PLATELET CYTOSOLIC CA2 | Genes involved in Response to elevated platelet cytosolic Ca2+ |
| 0.1 | 1.2 | REACTOME TRAF3 DEPENDENT IRF ACTIVATION PATHWAY | Genes involved in TRAF3-dependent IRF activation pathway |
| 0.1 | 2.9 | REACTOME INTERFERON GAMMA SIGNALING | Genes involved in Interferon gamma signaling |
| 0.1 | 8.4 | REACTOME G ALPHA I SIGNALLING EVENTS | Genes involved in G alpha (i) signalling events |
| 0.0 | 0.6 | REACTOME RNA POL III TRANSCRIPTION INITIATION FROM TYPE 2 PROMOTER | Genes involved in RNA Polymerase III Transcription Initiation From Type 2 Promoter |