Project
GSE53960: rat RNA-Seq transcriptomic Bodymap
Navigation
Downloads
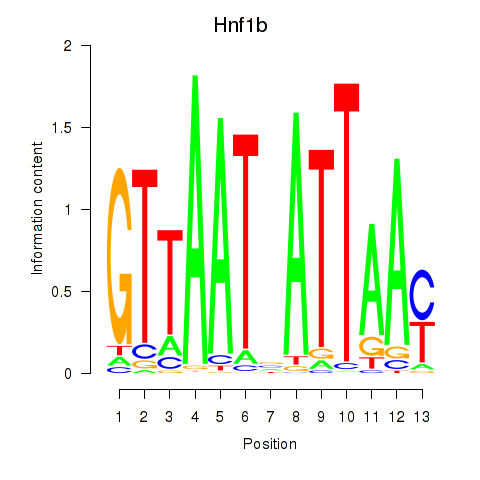
Results for Hnf1b
Z-value: 6.05
Motif logo
Transcription factors associated with Hnf1b
| Gene Symbol | Gene ID | Gene Info |
|---|---|---|
|
Hnf1b
|
ENSRNOG00000002598 | HNF1 homeobox B |
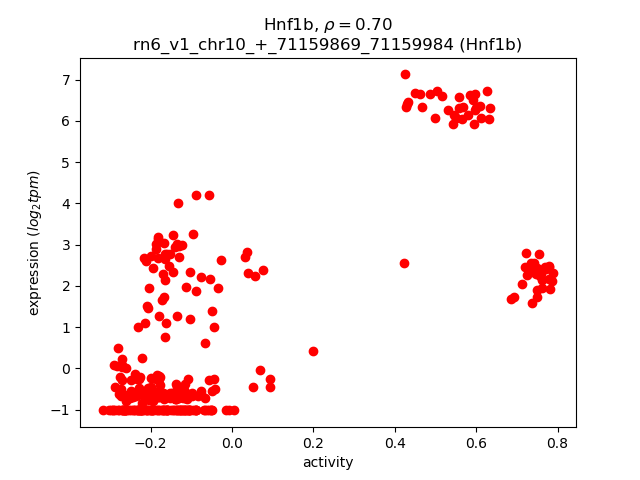
Activity-expression correlation:
| Gene | Promoter | Pearson corr. coef. | P-value | Plot |
|---|---|---|---|---|
| Hnf1b | rn6_v1_chr10_+_71159869_71159984 | 0.70 | 2.4e-48 | Click! |
Activity profile of Hnf1b motif
Sorted Z-values of Hnf1b motif
| Promoter | Log-likelihood | Transcript | Gene | Gene Info |
|---|---|---|---|---|
| chr13_-_91427575 | 662.96 |
ENSRNOT00000012092
|
Apcs
|
amyloid P component, serum |
| chr14_-_19132208 | 605.47 |
ENSRNOT00000060535
|
Afm
|
afamin |
| chr14_+_20266891 | 572.17 |
ENSRNOT00000004174
|
Gc
|
group specific component |
| chr17_+_69588085 | 566.81 |
ENSRNOT00000064884
|
Akr1c12l1
|
aldo-keto reductase family 1, member C12-like 1 |
| chr1_+_189289957 | 493.73 |
ENSRNOT00000020587
|
Acsm1
|
acyl-CoA synthetase medium-chain family member 1 |
| chr11_-_81639872 | 466.41 |
ENSRNOT00000047595
ENSRNOT00000090031 ENSRNOT00000081864 |
Hrg
|
histidine-rich glycoprotein |
| chr17_-_69711689 | 451.98 |
ENSRNOT00000041925
|
Akr1c12
|
aldo-keto reductase family 1, member C12 |
| chr6_+_80188943 | 451.28 |
ENSRNOT00000059335
|
Mia2
|
melanoma inhibitory activity 2 |
| chr17_-_43543172 | 434.42 |
ENSRNOT00000080684
ENSRNOT00000029626 ENSRNOT00000082719 |
Slc17a3
|
solute carrier family 17 member 3 |
| chr3_+_159936856 | 429.68 |
ENSRNOT00000078703
|
Hnf4a
|
hepatocyte nuclear factor 4, alpha |
| chr10_+_89285855 | 415.65 |
ENSRNOT00000028033
|
G6pc
|
glucose-6-phosphatase, catalytic subunit |
| chr20_-_5123073 | 395.90 |
ENSRNOT00000001126
|
Apom
|
apolipoprotein M |
| chr10_+_89286047 | 387.65 |
ENSRNOT00000085831
|
G6pc
|
glucose-6-phosphatase, catalytic subunit |
| chr6_+_127743971 | 379.31 |
ENSRNOT00000013045
|
Serpina4
|
serpin family A member 4 |
| chr3_-_14229067 | 378.99 |
ENSRNOT00000025534
ENSRNOT00000092865 |
C5
|
complement C5 |
| chr1_+_88955440 | 378.19 |
ENSRNOT00000091101
|
Prodh2
|
proline dehydrogenase 2 |
| chr10_+_96639924 | 373.90 |
ENSRNOT00000004756
|
Apoh
|
apolipoprotein H |
| chr1_+_88955135 | 367.91 |
ENSRNOT00000083550
|
Prodh2
|
proline dehydrogenase 2 |
| chr17_+_69634890 | 366.39 |
ENSRNOT00000029049
|
Akr1c13
|
aldo-keto reductase family 1, member C13 |
| chr13_-_56958549 | 362.48 |
ENSRNOT00000017293
ENSRNOT00000083912 |
RGD1564614
|
similar to complement factor H-related protein |
| chr18_-_38185812 | 361.26 |
ENSRNOT00000017969
|
Spink1l
|
serine peptidase inhibitor, Kazal type 1-like |
| chr3_+_159902441 | 351.67 |
ENSRNOT00000089893
ENSRNOT00000011978 |
Hnf4a
|
hepatocyte nuclear factor 4, alpha |
| chr18_-_35071619 | 349.12 |
ENSRNOT00000075695
|
LOC100911558
|
serine protease inhibitor Kazal-type 3-like |
| chr1_+_263554453 | 347.95 |
ENSRNOT00000070861
|
Abcc2
|
ATP binding cassette subfamily C member 2 |
| chr2_-_182035032 | 346.01 |
ENSRNOT00000009813
|
Fgb
|
fibrinogen beta chain |
| chr2_+_182006242 | 344.69 |
ENSRNOT00000064091
|
Fga
|
fibrinogen alpha chain |
| chr17_-_43584152 | 336.00 |
ENSRNOT00000023241
|
Slc17a2
|
solute carrier family 17, member 2 |
| chr20_+_30690810 | 330.09 |
ENSRNOT00000000687
|
Pcbd1
|
pterin-4 alpha-carbinolamine dehydratase 1 |
| chr14_-_19191863 | 324.82 |
ENSRNOT00000003921
|
Alb
|
albumin |
| chr14_+_87448692 | 319.64 |
ENSRNOT00000077177
|
Igfbp1
|
insulin-like growth factor binding protein 1 |
| chr1_-_48563776 | 304.98 |
ENSRNOT00000023368
|
Plg
|
plasminogen |
| chr2_-_243407608 | 299.89 |
ENSRNOT00000014631
|
Mttp
|
microsomal triglyceride transfer protein |
| chr13_+_56598957 | 298.60 |
ENSRNOT00000016944
ENSRNOT00000080335 ENSRNOT00000089913 |
F13b
|
coagulation factor XIII B chain |
| chr2_+_235264219 | 291.68 |
ENSRNOT00000086245
|
Cfi
|
complement factor I |
| chr5_+_134492756 | 287.56 |
ENSRNOT00000012888
ENSRNOT00000057095 ENSRNOT00000051385 |
Cyp4a1
|
cytochrome P450, family 4, subfamily a, polypeptide 1 |
| chr14_-_19159923 | 285.72 |
ENSRNOT00000003879
|
Afp
|
alpha-fetoprotein |
| chr11_-_66034573 | 282.49 |
ENSRNOT00000003645
|
Hgd
|
homogentisate 1, 2-dioxygenase |
| chr5_-_126053726 | 282.14 |
ENSRNOT00000008535
|
Pcsk9
|
proprotein convertase subtilisin/kexin type 9 |
| chr14_-_19072677 | 271.46 |
ENSRNOT00000060548
|
LOC360919
|
similar to alpha-fetoprotein |
| chr5_-_79008363 | 267.24 |
ENSRNOT00000010040
|
Kif12
|
kinesin family member 12 |
| chr9_+_95256627 | 262.36 |
ENSRNOT00000025291
|
Ugt1a5
|
UDP glucuronosyltransferase family 1 member A5 |
| chr1_+_250426158 | 260.63 |
ENSRNOT00000067643
|
A1cf
|
APOBEC1 complementation factor |
| chr9_+_95295701 | 252.46 |
ENSRNOT00000025045
|
Ugt1a5
|
UDP glucuronosyltransferase family 1 member A5 |
| chr4_+_68849033 | 252.27 |
ENSRNOT00000016912
|
Mgam
|
maltase-glucoamylase |
| chr6_-_127508452 | 247.23 |
ENSRNOT00000073709
|
LOC100909524
|
protein Z-dependent protease inhibitor-like |
| chr13_-_47377703 | 245.57 |
ENSRNOT00000005461
|
C4bpa
|
complement component 4 binding protein, alpha |
| chr3_-_127500709 | 244.83 |
ENSRNOT00000006330
|
Hao1
|
hydroxyacid oxidase 1 |
| chr2_+_23289374 | 242.45 |
ENSRNOT00000090666
ENSRNOT00000032783 |
Dmgdh
|
dimethylglycine dehydrogenase |
| chr7_-_30105132 | 237.73 |
ENSRNOT00000091227
|
Nr1h4
|
nuclear receptor subfamily 1, group H, member 4 |
| chr20_-_27117663 | 235.49 |
ENSRNOT00000000434
|
Pbld1
|
phenazine biosynthesis-like protein domain containing 1 |
| chr9_+_95161157 | 235.09 |
ENSRNOT00000071200
|
Ugt1a5
|
UDP glucuronosyltransferase family 1 member A5 |
| chr13_-_50549981 | 231.95 |
ENSRNOT00000003918
ENSRNOT00000080486 |
Golt1a
|
golgi transport 1A |
| chr5_-_124403195 | 230.79 |
ENSRNOT00000067850
|
C8a
|
complement C8 alpha chain |
| chr2_-_216443518 | 227.92 |
ENSRNOT00000022496
|
Amy1a
|
amylase, alpha 1A |
| chr8_-_77398156 | 227.89 |
ENSRNOT00000091858
ENSRNOT00000085349 ENSRNOT00000082763 |
Lipc
|
lipase C, hepatic type |
| chrX_-_32153794 | 223.08 |
ENSRNOT00000005348
|
Tmem27
|
transmembrane protein 27 |
| chr1_+_189328246 | 221.07 |
ENSRNOT00000084260
|
Acsm1
|
acyl-CoA synthetase medium-chain family member 1 |
| chr9_+_95274707 | 216.58 |
ENSRNOT00000045163
|
Ugt1a5
|
UDP glucuronosyltransferase family 1 member A5 |
| chr1_+_32221636 | 215.97 |
ENSRNOT00000022346
ENSRNOT00000089941 |
Slc6a18
|
solute carrier family 6 member 18 |
| chr3_-_48372583 | 213.10 |
ENSRNOT00000040482
ENSRNOT00000077788 ENSRNOT00000085426 |
Dpp4
|
dipeptidylpeptidase 4 |
| chr1_+_277068761 | 213.05 |
ENSRNOT00000044183
ENSRNOT00000022382 |
Habp2
|
hyaluronan binding protein 2 |
| chr1_+_261291870 | 213.00 |
ENSRNOT00000049914
|
Hoga1
|
4-hydroxy-2-oxoglutarate aldolase 1 |
| chr5_+_33784715 | 209.79 |
ENSRNOT00000035685
|
Slc7a13
|
solute carrier family 7 member 13 |
| chr14_-_80973456 | 203.39 |
ENSRNOT00000013257
|
Hgfac
|
HGF activator |
| chr2_-_88763733 | 199.47 |
ENSRNOT00000059424
|
LOC688389
|
similar to solute carrier family 7 (cationic amino acid transporter, y+ system), member 12 |
| chr5_+_137356801 | 181.33 |
ENSRNOT00000027432
|
RGD1305347
|
similar to RIKEN cDNA 2610528J11 |
| chrX_-_110232179 | 180.11 |
ENSRNOT00000014739
|
Serpina7
|
serpin family A member 7 |
| chr4_-_176381477 | 179.78 |
ENSRNOT00000048367
|
Slco1a6
|
solute carrier organic anion transporter family, member 1a6 |
| chr3_+_117421604 | 171.37 |
ENSRNOT00000008860
ENSRNOT00000008857 |
Slc12a1
|
solute carrier family 12 member 1 |
| chr6_-_26385761 | 170.95 |
ENSRNOT00000073228
|
Gckr
|
glucokinase regulator |
| chr14_-_44613904 | 170.28 |
ENSRNOT00000003811
|
Klb
|
klotho beta |
| chr1_+_189514553 | 168.67 |
ENSRNOT00000020039
|
Acsm3
|
acyl-CoA synthetase medium-chain family member 3 |
| chr14_+_22251499 | 168.18 |
ENSRNOT00000087991
ENSRNOT00000002705 |
Ugt2a1
|
UDP glucuronosyltransferase 2 family, polypeptide A1 |
| chr20_-_45126062 | 167.95 |
ENSRNOT00000000720
|
RGD1310495
|
similar to KIAA1919 protein |
| chr4_-_65818521 | 167.42 |
ENSRNOT00000064201
|
Atp6v0a4
|
ATPase H+ transporting V0 subunit a4 |
| chr5_+_117698764 | 166.54 |
ENSRNOT00000011486
|
Angptl3
|
angiopoietin-like 3 |
| chr8_-_84320714 | 164.38 |
ENSRNOT00000079356
ENSRNOT00000088487 |
Tinag
|
tubulointerstitial nephritis antigen |
| chr14_-_91996774 | 164.06 |
ENSRNOT00000005851
|
Ddc
|
dopa decarboxylase |
| chr11_-_80981415 | 162.13 |
ENSRNOT00000002499
ENSRNOT00000002496 |
St6gal1
|
ST6 beta-galactoside alpha-2,6-sialyltransferase 1 |
| chr19_+_568287 | 161.44 |
ENSRNOT00000016419
|
Cdh16
|
cadherin 16 |
| chr4_+_172119331 | 158.33 |
ENSRNOT00000010579
|
Mgst1
|
microsomal glutathione S-transferase 1 |
| chr8_+_103337472 | 153.98 |
ENSRNOT00000049729
|
Paqr9
|
progestin and adipoQ receptor family member 9 |
| chr1_+_107262659 | 151.68 |
ENSRNOT00000022499
|
Gas2
|
growth arrest-specific 2 |
| chr14_+_22724070 | 148.58 |
ENSRNOT00000089471
|
Ugt2b10
|
UDP glucuronosyltransferase 2 family, polypeptide B10 |
| chr2_-_100372252 | 142.77 |
ENSRNOT00000011890
|
Hnf4g
|
hepatocyte nuclear factor 4, gamma |
| chr10_-_65692016 | 141.39 |
ENSRNOT00000085074
ENSRNOT00000038690 |
Slc13a2
|
solute carrier family 13 member 2 |
| chr8_+_49713190 | 120.56 |
ENSRNOT00000022074
|
Fxyd2
|
FXYD domain-containing ion transport regulator 2 |
| chr14_+_77067503 | 117.25 |
ENSRNOT00000085275
|
Slc2a9
|
solute carrier family 2 member 9 |
| chr8_+_22856539 | 117.23 |
ENSRNOT00000015381
|
Angptl8
|
angiopoietin-like 8 |
| chr4_-_51199570 | 110.98 |
ENSRNOT00000010788
|
Slc13a1
|
solute carrier family 13 member 1 |
| chr4_+_173732248 | 102.79 |
ENSRNOT00000041499
|
Pik3c2g
|
phosphatidylinositol-4-phosphate 3-kinase, catalytic subunit type 2 gamma |
| chr2_+_222021103 | 102.70 |
ENSRNOT00000086125
|
Dpyd
|
dihydropyrimidine dehydrogenase |
| chr2_-_158156444 | 102.28 |
ENSRNOT00000088559
|
Veph1
|
ventricular zone expressed PH domain-containing 1 |
| chr2_-_158156150 | 101.90 |
ENSRNOT00000016621
|
Veph1
|
ventricular zone expressed PH domain-containing 1 |
| chr5_+_124476168 | 100.80 |
ENSRNOT00000077754
|
RGD1564074
|
similar to novel protein |
| chr17_+_69761118 | 98.11 |
ENSRNOT00000023739
|
Akr1c3
|
aldo-keto reductase family 1, member C3 |
| chr13_+_42008842 | 97.08 |
ENSRNOT00000038811
|
Gpr39
|
G protein-coupled receptor 39 |
| chr2_-_88660449 | 96.63 |
ENSRNOT00000051741
|
Slc7a12
|
solute carrier family 7 (cationic amino acid transporter, y+ system), member 12 |
| chr16_+_7758996 | 96.24 |
ENSRNOT00000061063
|
Btd
|
biotinidase |
| chr8_-_127900463 | 95.68 |
ENSRNOT00000078303
|
Slc22a13
|
solute carrier family 22 member 13 |
| chr7_-_68549763 | 94.21 |
ENSRNOT00000078014
|
Slc16a7
|
solute carrier family 16 member 7 |
| chr7_-_120518653 | 91.65 |
ENSRNOT00000016362
|
Baiap2l2
|
BAI1-associated protein 2-like 2 |
| chr3_-_146396299 | 87.24 |
ENSRNOT00000040188
ENSRNOT00000008931 |
Apmap
|
adipocyte plasma membrane associated protein |
| chr8_-_52937972 | 85.11 |
ENSRNOT00000007789
|
Nnmt
|
nicotinamide N-methyltransferase |
| chr7_+_29435444 | 83.76 |
ENSRNOT00000008613
|
Slc5a8
|
solute carrier family 5 member 8 |
| chr3_-_2453933 | 83.68 |
ENSRNOT00000014060
|
Slc34a3
|
solute carrier family 34 member 3 |
| chr14_+_2892753 | 83.66 |
ENSRNOT00000061630
|
Evi5
|
ecotropic viral integration site 5 |
| chr1_-_266428239 | 77.52 |
ENSRNOT00000027160
|
Cyp17a1
|
cytochrome P450, family 17, subfamily a, polypeptide 1 |
| chr13_-_102756174 | 76.48 |
ENSRNOT00000029439
|
Marc2
|
mitochondrial amidoxime reducing component 2 |
| chr4_-_82295470 | 76.15 |
ENSRNOT00000091073
|
Hoxa10
|
homeobox A10 |
| chr4_-_82209933 | 75.48 |
ENSRNOT00000091106
|
LOC100912608
|
homeobox protein Hox-A10-like |
| chr10_-_103848035 | 71.30 |
ENSRNOT00000029001
|
Fads6
|
fatty acid desaturase 6 |
| chr10_-_71491743 | 69.10 |
ENSRNOT00000038955
|
LOC102552988
|
uncharacterized LOC102552988 |
| chr2_-_166682325 | 68.42 |
ENSRNOT00000091198
ENSRNOT00000012422 |
Sptssb
|
serine palmitoyltransferase, small subunit B |
| chr15_+_104026601 | 66.54 |
ENSRNOT00000013520
ENSRNOT00000083269 ENSRNOT00000093403 |
Cldn10
|
claudin 10 |
| chr1_-_87147308 | 65.07 |
ENSRNOT00000027773
ENSRNOT00000089305 ENSRNOT00000090402 |
Actn4
|
actinin alpha 4 |
| chr7_-_97071968 | 64.75 |
ENSRNOT00000006596
|
Slc22a22
|
solute carrier family 22 (organic cation transporter), member 22 |
| chr2_-_88553086 | 63.14 |
ENSRNOT00000042494
|
LOC361914
|
similar to solute carrier family 7 (cationic amino acid transporter, y+ system), member 12 |
| chr20_+_32717564 | 60.94 |
ENSRNOT00000030642
|
Rfx6
|
regulatory factor X, 6 |
| chr11_-_82810014 | 58.07 |
ENSRNOT00000083539
|
Map3k13
|
mitogen-activated protein kinase kinase kinase 13 |
| chr10_+_56822756 | 57.63 |
ENSRNOT00000025372
|
Slc16a11
|
solute carrier family 16, member 11 |
| chr19_-_39267928 | 56.06 |
ENSRNOT00000027686
|
Tmed6
|
transmembrane p24 trafficking protein 6 |
| chr15_+_56756661 | 55.90 |
ENSRNOT00000013324
|
Esd
|
esterase D |
| chr5_+_138685624 | 54.14 |
ENSRNOT00000011867
|
Guca2a
|
guanylate cyclase activator 2A |
| chr1_-_15374850 | 51.53 |
ENSRNOT00000016728
|
Pex7
|
peroxisomal biogenesis factor 7 |
| chr13_+_47454591 | 51.17 |
ENSRNOT00000005791
|
LOC498222
|
similar to specifically androgen-regulated protein |
| chr5_-_131860637 | 50.33 |
ENSRNOT00000064569
ENSRNOT00000080242 |
Slc5a9
|
solute carrier family 5 member 9 |
| chr5_-_158439078 | 49.69 |
ENSRNOT00000025517
|
Klhdc7a
|
kelch domain containing 7A |
| chr4_-_149988295 | 49.45 |
ENSRNOT00000019649
|
Fxyd4
|
FXYD domain-containing ion transport regulator 4 |
| chr13_-_53870428 | 48.25 |
ENSRNOT00000000812
|
Nr5a2
|
nuclear receptor subfamily 5, group A, member 2 |
| chr9_-_42839837 | 47.86 |
ENSRNOT00000038610
|
Neurl3
|
neuralized E3 ubiquitin protein ligase 3 |
| chr5_+_157416897 | 46.81 |
ENSRNOT00000023358
|
Rnf186
|
ring finger protein 186 |
| chr14_+_80195715 | 44.03 |
ENSRNOT00000010784
|
Sh3tc1
|
SH3 domain and tetratricopeptide repeats 1 |
| chr5_-_138697641 | 42.48 |
ENSRNOT00000012062
|
Guca2b
|
guanylate cyclase activator 2B |
| chr8_-_127912860 | 39.81 |
ENSRNOT00000040498
|
LOC685081
|
similar to solute carrier family 22 (organic cation transporter), member 13 |
| chr4_-_120559078 | 39.68 |
ENSRNOT00000085730
ENSRNOT00000079575 |
Kbtbd12
|
kelch repeat and BTB domain containing 12 |
| chr9_-_88356716 | 37.54 |
ENSRNOT00000077503
|
Col4a4
|
collagen type IV alpha 4 chain |
| chr1_+_83965608 | 36.43 |
ENSRNOT00000079995
|
Cyp2t1
|
cytochrome P450, family 2, subfamily t, polypeptide 1 |
| chr7_+_76059386 | 36.39 |
ENSRNOT00000009337
|
Grhl2
|
grainyhead-like transcription factor 2 |
| chr1_-_101095594 | 34.23 |
ENSRNOT00000027944
|
Fcgrt
|
Fc fragment of IgG receptor and transporter |
| chr11_+_77644541 | 31.59 |
ENSRNOT00000074688
|
Tmem207
|
transmembrane protein 207 |
| chr16_-_75179089 | 31.47 |
ENSRNOT00000058061
|
Defb9
|
defensin beta 9 |
| chr7_-_120077612 | 30.77 |
ENSRNOT00000011750
|
Lgals2
|
galectin 2 |
| chr6_-_142418779 | 26.39 |
ENSRNOT00000072280
ENSRNOT00000065808 |
AABR07065814.1
|
|
| chr4_-_155051429 | 26.32 |
ENSRNOT00000020094
|
Klrg1
|
killer cell lectin like receptor G1 |
| chr7_-_98270110 | 24.59 |
ENSRNOT00000064847
|
Anxa13
|
annexin A13 |
| chr2_+_185846232 | 24.38 |
ENSRNOT00000023418
|
Lrba
|
LPS responsive beige-like anchor protein |
| chr7_-_140291620 | 24.20 |
ENSRNOT00000088323
|
Adcy6
|
adenylate cyclase 6 |
| chr1_+_31124825 | 24.13 |
ENSRNOT00000092105
|
AABR07000989.1
|
|
| chr1_-_53802658 | 24.12 |
ENSRNOT00000032667
|
Afdn
|
afadin, adherens junction formation factor |
| chr4_-_30380119 | 23.38 |
ENSRNOT00000036460
|
Pon2
|
paraoxonase 2 |
| chr9_-_92524739 | 23.31 |
ENSRNOT00000089889
|
Slc16a14
|
solute carrier family 16, member 14 |
| chr17_-_10004321 | 22.96 |
ENSRNOT00000042394
|
Fgfr4
|
fibroblast growth factor receptor 4 |
| chr10_-_13446135 | 22.14 |
ENSRNOT00000084991
|
Kctd5
|
potassium channel tetramerization domain containing 5 |
| chr1_-_199341302 | 21.48 |
ENSRNOT00000073596
|
Vkorc1
|
vitamin K epoxide reductase complex, subunit 1 |
| chr3_-_9807328 | 19.80 |
ENSRNOT00000064660
|
Tor1a
|
torsin family 1, member A |
| chr13_+_90514336 | 19.07 |
ENSRNOT00000088996
ENSRNOT00000085377 |
Pex19
|
peroxisomal biogenesis factor 19 |
| chr16_+_29674793 | 17.88 |
ENSRNOT00000059724
|
Anxa10
|
annexin A10 |
| chr4_+_78263866 | 17.05 |
ENSRNOT00000033807
|
AI854703
|
expressed sequence AI854703 |
| chr11_+_81796891 | 16.74 |
ENSRNOT00000058402
|
Crygs
|
crystallin, gamma S |
| chr3_+_103597194 | 16.22 |
ENSRNOT00000073004
|
LOC502660
|
similar to olfactory receptor 1318 |
| chr5_+_116420690 | 15.92 |
ENSRNOT00000087089
|
Nfia
|
nuclear factor I/A |
| chr6_-_44363915 | 15.48 |
ENSRNOT00000085925
|
Id2
|
inhibitor of DNA binding 2, HLH protein |
| chr17_+_77167740 | 15.24 |
ENSRNOT00000042881
|
Optn
|
optineurin |
| chrX_+_33443186 | 14.33 |
ENSRNOT00000005622
|
S100g
|
S100 calcium binding protein G |
| chr7_-_3707226 | 13.53 |
ENSRNOT00000064380
|
Olr879
|
olfactory receptor 879 |
| chr4_+_156324922 | 12.94 |
ENSRNOT00000039463
|
Vom2r48
|
vomeronasal 2 receptor, 48 |
| chr1_-_172395872 | 12.83 |
ENSRNOT00000055174
|
Olr252
|
olfactory receptor 252 |
| chr1_+_164705604 | 11.75 |
ENSRNOT00000051450
ENSRNOT00000071384 |
Olr36
|
olfactory receptor 36 |
| chr1_-_172567846 | 10.96 |
ENSRNOT00000012974
|
Olr259
|
olfactory receptor 259 |
| chr3_-_167759273 | 10.03 |
ENSRNOT00000049457
|
AABR07054721.1
|
|
| chr1_-_101819478 | 9.55 |
ENSRNOT00000056181
|
Grwd1
|
glutamate-rich WD repeat containing 1 |
| chr11_+_18454144 | 9.27 |
ENSRNOT00000072550
|
AABR07033357.1
|
|
| chr15_-_55277713 | 9.12 |
ENSRNOT00000023037
|
Itm2b
|
integral membrane protein 2B |
| chr6_-_142385773 | 8.93 |
ENSRNOT00000071555
|
AABR07065814.7
|
|
| chr1_-_167893061 | 8.60 |
ENSRNOT00000049401
|
Olr60
|
olfactory receptor 60 |
| chr2_+_149843282 | 8.30 |
ENSRNOT00000074805
|
RGD1561998
|
similar to hypothetical protein C130079G13 |
| chr7_-_50034932 | 8.17 |
ENSRNOT00000081885
|
Ptprq
|
protein tyrosine phosphatase, receptor type, Q |
| chr11_+_28724341 | 7.62 |
ENSRNOT00000049858
|
LOC100363287
|
RIKEN cDNA 2310034C09-like |
| chr3_-_103301388 | 7.58 |
ENSRNOT00000046162
|
Olr788
|
olfactory receptor 788 |
| chr8_+_73682887 | 7.56 |
ENSRNOT00000057522
|
Vps13c
|
vacuolar protein sorting 13C |
| chr15_+_35685009 | 7.53 |
ENSRNOT00000085764
|
LOC100911127
|
olfactory receptor 144-like |
| chr18_-_71614980 | 7.42 |
ENSRNOT00000032563
|
LOC102548286
|
peroxisomal biogenesis factor 19-like |
| chr7_-_9427506 | 7.36 |
ENSRNOT00000041565
|
Olr1068
|
olfactory receptor 1068 |
| chr5_-_16995304 | 7.22 |
ENSRNOT00000061780
|
Sdr16c6
|
short chain dehydrogenase/reductase family 16C, member 6 |
| chr8_-_19586811 | 7.12 |
ENSRNOT00000091744
|
Olr1149
|
olfactory receptor 1149 |
| chr11_-_23058456 | 7.03 |
ENSRNOT00000073285
|
LOC103693533
|
olfactory receptor 6C6-like |
| chr4_+_72388568 | 6.97 |
ENSRNOT00000038359
|
Olr809
|
olfactory receptor 809 |
| chr4_+_166222451 | 6.30 |
ENSRNOT00000045884
|
Prp15
|
proline-rich protein 15 |
| chr18_-_31749647 | 5.81 |
ENSRNOT00000044287
|
Nr3c1
|
nuclear receptor subfamily 3, group C, member 1 |
| chr16_+_2634603 | 5.80 |
ENSRNOT00000019113
|
Hesx1
|
HESX homeobox 1 |
| chr4_+_166211646 | 5.58 |
ENSRNOT00000007139
ENSRNOT00000007119 |
Prp15
|
proline-rich protein 15 |
| chr1_+_168390615 | 5.23 |
ENSRNOT00000039822
|
Olr87
|
olfactory receptor 87 |
| chr10_+_111770168 | 4.29 |
ENSRNOT00000074598
|
Vom2r65
|
vomeronasal 2 receptor, 65 |
| chr1_+_168326922 | 4.28 |
ENSRNOT00000046793
|
Olr83
|
olfactory receptor 83 |
| chr7_+_6215743 | 4.10 |
ENSRNOT00000050967
|
Olr1002
|
olfactory receptor 1002 |
| chr3_-_78974631 | 4.07 |
ENSRNOT00000087245
|
Olr733
|
olfactory receptor 733 |
| chr10_+_112056994 | 4.03 |
ENSRNOT00000073032
|
Vom2r65
|
vomeronasal 2 receptor, 65 |
| chr15_+_39638510 | 3.80 |
ENSRNOT00000037800
|
Rcbtb1
|
RCC1 and BTB domain containing protein 1 |
| chr17_+_42695322 | 3.77 |
ENSRNOT00000073558
|
AABR07027730.1
|
|
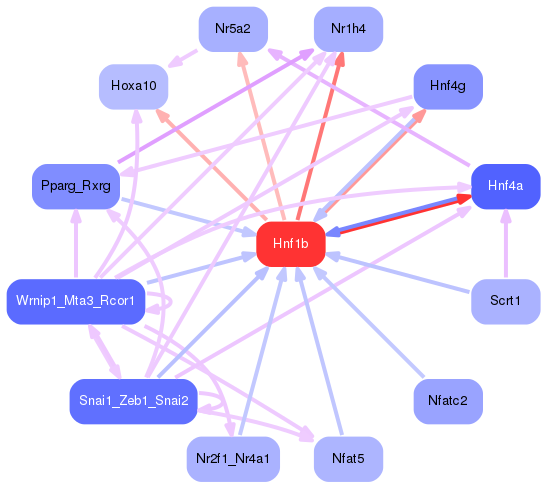
Network of associatons between targets according to the STRING database.

First level regulatory network of Hnf1b
Gene Ontology Analysis
Gene overrepresentation in biological process category:
| Log-likelihood per target | Total log-likelihood | Term | Description |
|---|---|---|---|
| 248.7 | 746.1 | GO:0010133 | proline catabolic process to glutamate(GO:0010133) |
| 244.8 | 244.8 | GO:0009441 | glycolate metabolic process(GO:0009441) |
| 195.3 | 781.3 | GO:0042977 | regulation of activation of JAK2 kinase activity(GO:0010534) activation of JAK2 kinase activity(GO:0042977) negative regulation of activation of JAK2 kinase activity(GO:1902569) |
| 165.7 | 663.0 | GO:0052422 | modulation of catalytic activity in other organism involved in symbiotic interaction(GO:0052203) modulation by host of symbiont catalytic activity(GO:0052422) regulation of exo-alpha-sialidase activity(GO:1903015) |
| 155.5 | 466.4 | GO:0097037 | heme export(GO:0097037) |
| 138.1 | 690.7 | GO:0043152 | induction of bacterial agglutination(GO:0043152) |
| 132.0 | 395.9 | GO:0034444 | regulation of plasma lipoprotein particle oxidation(GO:0034444) negative regulation of plasma lipoprotein particle oxidation(GO:0034445) |
| 107.4 | 966.5 | GO:0052697 | xenobiotic glucuronidation(GO:0052697) |
| 101.8 | 305.4 | GO:0010034 | response to acetate(GO:0010034) |
| 101.7 | 305.0 | GO:0052047 | interaction with other organism via secreted substance involved in symbiotic interaction(GO:0052047) |
| 93.5 | 373.9 | GO:0007597 | blood coagulation, intrinsic pathway(GO:0007597) |
| 87.0 | 348.0 | GO:0050787 | detoxification of mercury ion(GO:0050787) |
| 81.9 | 245.6 | GO:0045959 | negative regulation of complement activation, classical pathway(GO:0045959) |
| 80.8 | 242.4 | GO:0006579 | amino-acid betaine catabolic process(GO:0006579) |
| 80.3 | 803.3 | GO:0015760 | hexose phosphate transport(GO:0015712) glucose-6-phosphate transport(GO:0015760) |
| 79.2 | 237.7 | GO:0034971 | histone H3-R17 methylation(GO:0034971) |
| 78.5 | 235.5 | GO:0060392 | negative regulation of SMAD protein import into nucleus(GO:0060392) |
| 75.2 | 451.3 | GO:0070973 | protein localization to endoplasmic reticulum exit site(GO:0070973) |
| 71.9 | 287.6 | GO:0048252 | lauric acid metabolic process(GO:0048252) |
| 71.0 | 213.1 | GO:0061744 | motor behavior(GO:0061744) |
| 70.5 | 282.1 | GO:0032805 | positive regulation of low-density lipoprotein particle receptor catabolic process(GO:0032805) |
| 65.2 | 260.6 | GO:0016554 | mRNA localization resulting in posttranscriptional regulation of gene expression(GO:0010609) cytidine to uridine editing(GO:0016554) |
| 63.2 | 379.0 | GO:0010760 | negative regulation of macrophage chemotaxis(GO:0010760) |
| 61.3 | 612.6 | GO:0006558 | L-phenylalanine metabolic process(GO:0006558) erythrose 4-phosphate/phosphoenolpyruvate family amino acid metabolic process(GO:1902221) |
| 57.1 | 171.4 | GO:0032978 | protein insertion into membrane from inner side(GO:0032978) |
| 54.1 | 324.8 | GO:0001907 | killing by symbiont of host cells(GO:0001907) disruption by symbiont of host cell(GO:0044004) response to platinum ion(GO:0070541) |
| 54.0 | 162.1 | GO:1990743 | protein sialylation(GO:1990743) |
| 53.3 | 213.1 | GO:1904975 | response to bleomycin(GO:1904975) |
| 53.2 | 213.0 | GO:0009436 | glyoxylate catabolic process(GO:0009436) |
| 50.2 | 854.1 | GO:0035435 | phosphate ion transmembrane transport(GO:0035435) |
| 42.8 | 299.9 | GO:0034196 | acylglycerol transport(GO:0034196) triglyceride transport(GO:0034197) |
| 42.0 | 168.2 | GO:0052695 | cellular glucuronidation(GO:0052695) |
| 41.0 | 164.1 | GO:0052314 | phytoalexin metabolic process(GO:0052314) |
| 36.8 | 699.5 | GO:1902572 | negative regulation of serine-type endopeptidase activity(GO:1900004) negative regulation of serine-type peptidase activity(GO:1902572) |
| 34.2 | 102.7 | GO:0006214 | thymidine catabolic process(GO:0006214) pyrimidine deoxyribonucleoside catabolic process(GO:0046127) |
| 34.2 | 171.0 | GO:0009732 | detection of carbohydrate stimulus(GO:0009730) detection of hexose stimulus(GO:0009732) negative regulation of glucokinase activity(GO:0033132) detection of monosaccharide stimulus(GO:0034287) detection of glucose(GO:0051594) negative regulation of hexokinase activity(GO:1903300) |
| 34.1 | 170.3 | GO:0090080 | positive regulation of MAPKKK cascade by fibroblast growth factor receptor signaling pathway(GO:0090080) |
| 33.3 | 166.5 | GO:0051005 | negative regulation of lipoprotein lipase activity(GO:0051005) |
| 32.7 | 98.1 | GO:0019747 | response to jasmonic acid(GO:0009753) sesquiterpenoid catabolic process(GO:0016107) farnesol metabolic process(GO:0016487) farnesol catabolic process(GO:0016488) regulation of isoprenoid metabolic process(GO:0019747) cellular response to jasmonic acid stimulus(GO:0071395) |
| 32.4 | 97.1 | GO:0035483 | gastric emptying(GO:0035483) |
| 29.8 | 595.1 | GO:0042359 | vitamin D metabolic process(GO:0042359) |
| 24.8 | 223.1 | GO:0035542 | regulation of SNARE complex assembly(GO:0035542) |
| 22.0 | 285.7 | GO:0042448 | progesterone metabolic process(GO:0042448) |
| 19.1 | 76.5 | GO:0042126 | nitrate metabolic process(GO:0042126) |
| 18.8 | 94.2 | GO:1901475 | pyruvate transmembrane transport(GO:1901475) |
| 18.0 | 180.1 | GO:0070327 | thyroid hormone transport(GO:0070327) |
| 17.1 | 68.4 | GO:1904220 | regulation of serine C-palmitoyltransferase activity(GO:1904220) |
| 16.2 | 64.8 | GO:0071718 | sodium-independent icosanoid transport(GO:0071718) |
| 15.1 | 605.5 | GO:0051180 | vitamin transport(GO:0051180) |
| 14.1 | 297.0 | GO:0055090 | acylglycerol homeostasis(GO:0055090) triglyceride homeostasis(GO:0070328) |
| 13.0 | 65.1 | GO:0048549 | positive regulation of pinocytosis(GO:0048549) |
| 12.9 | 167.4 | GO:0070072 | vacuolar proton-transporting V-type ATPase complex assembly(GO:0070072) |
| 12.3 | 491.1 | GO:1902475 | L-alpha-amino acid transmembrane transport(GO:1902475) |
| 11.3 | 135.5 | GO:0043252 | sodium-independent organic anion transport(GO:0043252) |
| 10.7 | 117.3 | GO:0046415 | urate metabolic process(GO:0046415) |
| 10.4 | 522.5 | GO:0006956 | complement activation(GO:0006956) |
| 10.4 | 291.5 | GO:0043567 | regulation of insulin-like growth factor receptor signaling pathway(GO:0043567) |
| 10.3 | 883.5 | GO:0006637 | acyl-CoA metabolic process(GO:0006637) thioester metabolic process(GO:0035383) |
| 9.9 | 158.3 | GO:0071447 | cellular response to hydroperoxide(GO:0071447) |
| 9.7 | 48.3 | GO:0061113 | pancreas morphogenesis(GO:0061113) |
| 9.6 | 48.0 | GO:1901503 | ether lipid biosynthetic process(GO:0008611) glycerol ether biosynthetic process(GO:0046504) ether biosynthetic process(GO:1901503) |
| 9.3 | 55.9 | GO:0046292 | formaldehyde metabolic process(GO:0046292) |
| 9.1 | 36.4 | GO:0060672 | epithelial cell differentiation involved in embryonic placenta development(GO:0060671) epithelial cell morphogenesis involved in placental branching(GO:0060672) |
| 8.8 | 96.6 | GO:0031284 | positive regulation of guanylate cyclase activity(GO:0031284) |
| 7.1 | 120.6 | GO:0010248 | establishment or maintenance of transmembrane electrochemical gradient(GO:0010248) |
| 6.9 | 111.0 | GO:1902358 | sulfate transmembrane transport(GO:1902358) |
| 6.5 | 123.1 | GO:0016339 | calcium-dependent cell-cell adhesion via plasma membrane cell adhesion molecules(GO:0016339) |
| 6.1 | 91.7 | GO:0051764 | actin crosslink formation(GO:0051764) |
| 6.1 | 60.9 | GO:0003310 | pancreatic A cell differentiation(GO:0003310) |
| 5.7 | 102.8 | GO:0036092 | phosphatidylinositol-3-phosphate biosynthetic process(GO:0036092) |
| 5.4 | 21.5 | GO:0018214 | peptidyl-glutamic acid carboxylation(GO:0017187) protein carboxylation(GO:0018214) |
| 5.3 | 85.1 | GO:0001887 | selenium compound metabolic process(GO:0001887) |
| 5.2 | 15.5 | GO:0001966 | thigmotaxis(GO:0001966) |
| 5.0 | 216.0 | GO:0006972 | hyperosmotic response(GO:0006972) |
| 4.8 | 24.1 | GO:0034334 | adherens junction maintenance(GO:0034334) |
| 4.0 | 24.2 | GO:0072658 | maintenance of protein location in membrane(GO:0072658) maintenance of protein location in plasma membrane(GO:0072660) |
| 3.8 | 19.1 | GO:0016557 | peroxisome membrane biogenesis(GO:0016557) |
| 3.3 | 19.8 | GO:0051584 | regulation of dopamine uptake involved in synaptic transmission(GO:0051584) regulation of catecholamine uptake involved in synaptic transmission(GO:0051940) |
| 3.0 | 96.2 | GO:0006767 | water-soluble vitamin metabolic process(GO:0006767) |
| 2.9 | 37.5 | GO:0032836 | glomerular basement membrane development(GO:0032836) |
| 2.6 | 34.2 | GO:0038094 | Fc-gamma receptor signaling pathway(GO:0038094) |
| 2.6 | 481.9 | GO:0007596 | blood coagulation(GO:0007596) |
| 2.3 | 22.8 | GO:0061734 | parkin-mediated mitophagy in response to mitochondrial depolarization(GO:0061734) |
| 2.3 | 9.1 | GO:0042985 | negative regulation of amyloid precursor protein biosynthetic process(GO:0042985) |
| 2.2 | 76.1 | GO:0060065 | uterus development(GO:0060065) |
| 2.1 | 100.8 | GO:0033627 | cell adhesion mediated by integrin(GO:0033627) |
| 1.6 | 15.9 | GO:0072189 | ureter development(GO:0072189) |
| 1.6 | 379.3 | GO:0010951 | negative regulation of endopeptidase activity(GO:0010951) |
| 1.5 | 252.7 | GO:0043401 | steroid hormone mediated signaling pathway(GO:0043401) |
| 1.5 | 5.8 | GO:1900170 | negative regulation of glucocorticoid mediated signaling pathway(GO:1900170) |
| 1.4 | 83.7 | GO:0031338 | regulation of vesicle fusion(GO:0031338) |
| 1.3 | 36.4 | GO:0019373 | epoxygenase P450 pathway(GO:0019373) |
| 1.2 | 1147.5 | GO:0055114 | oxidation-reduction process(GO:0055114) |
| 1.1 | 49.4 | GO:2000649 | regulation of sodium ion transmembrane transporter activity(GO:2000649) |
| 1.0 | 5.8 | GO:0030916 | otic vesicle formation(GO:0030916) |
| 0.9 | 9.5 | GO:0006337 | nucleosome disassembly(GO:0006337) |
| 0.7 | 141.4 | GO:0098656 | anion transmembrane transport(GO:0098656) |
| 0.5 | 32.9 | GO:0000186 | activation of MAPKK activity(GO:0000186) |
| 0.4 | 8.2 | GO:0050910 | detection of mechanical stimulus involved in sensory perception of sound(GO:0050910) |
| 0.4 | 103.3 | GO:0007018 | microtubule-based movement(GO:0007018) |
| 0.4 | 2.8 | GO:0042976 | activation of Janus kinase activity(GO:0042976) |
| 0.3 | 72.8 | GO:0006898 | receptor-mediated endocytosis(GO:0006898) |
| 0.2 | 2.7 | GO:0031468 | nuclear envelope reassembly(GO:0031468) |
| 0.1 | 2.2 | GO:0070166 | enamel mineralization(GO:0070166) |
| 0.1 | 23.4 | GO:0009636 | response to toxic substance(GO:0009636) |
| 0.1 | 22.1 | GO:0051260 | protein homooligomerization(GO:0051260) |
| 0.1 | 44.7 | GO:0005975 | carbohydrate metabolic process(GO:0005975) |
| 0.1 | 3.4 | GO:0050909 | sensory perception of taste(GO:0050909) |
| 0.0 | 3.4 | GO:0007601 | visual perception(GO:0007601) |
| 0.0 | 3.0 | GO:0030326 | embryonic limb morphogenesis(GO:0030326) embryonic appendage morphogenesis(GO:0035113) |
| 0.0 | 1.2 | GO:0060038 | cardiac muscle cell proliferation(GO:0060038) |
Gene overrepresentation in cellular component category:
| Log-likelihood per target | Total log-likelihood | Term | Description |
|---|---|---|---|
| 116.6 | 466.4 | GO:0061474 | phagolysosome membrane(GO:0061474) |
| 101.7 | 305.0 | GO:0044279 | other organism cell membrane(GO:0044218) other organism membrane(GO:0044279) |
| 87.1 | 609.8 | GO:0005579 | membrane attack complex(GO:0005579) |
| 86.3 | 690.7 | GO:0005577 | fibrinogen complex(GO:0005577) |
| 79.2 | 395.9 | GO:0034365 | discoidal high-density lipoprotein particle(GO:0034365) |
| 49.1 | 245.6 | GO:0043159 | acrosomal matrix(GO:0043159) |
| 43.2 | 561.0 | GO:0046581 | intercellular canaliculus(GO:0046581) |
| 41.5 | 373.9 | GO:0042627 | chylomicron(GO:0042627) |
| 37.2 | 260.6 | GO:0045293 | mRNA editing complex(GO:0045293) |
| 33.5 | 167.4 | GO:0000220 | vacuolar proton-transporting V-type ATPase, V0 domain(GO:0000220) |
| 27.3 | 3109.3 | GO:0072562 | blood microparticle(GO:0072562) |
| 23.1 | 439.5 | GO:0070971 | endoplasmic reticulum exit site(GO:0070971) |
| 18.0 | 162.1 | GO:0000138 | Golgi trans cisterna(GO:0000138) |
| 16.3 | 227.9 | GO:0034364 | high-density lipoprotein particle(GO:0034364) |
| 13.0 | 324.1 | GO:0031528 | microvillus membrane(GO:0031528) |
| 10.0 | 120.6 | GO:0005890 | sodium:potassium-exchanging ATPase complex(GO:0005890) |
| 9.2 | 91.7 | GO:0071439 | clathrin complex(GO:0071439) |
| 8.6 | 68.4 | GO:0031211 | serine C-palmitoyltransferase complex(GO:0017059) endoplasmic reticulum palmitoyltransferase complex(GO:0031211) |
| 7.4 | 237.7 | GO:0005719 | nuclear euchromatin(GO:0005719) |
| 7.2 | 282.1 | GO:0030134 | ER to Golgi transport vesicle(GO:0030134) |
| 5.9 | 65.1 | GO:0031143 | pseudopodium(GO:0031143) |
| 5.8 | 741.3 | GO:0030176 | integral component of endoplasmic reticulum membrane(GO:0030176) |
| 5.7 | 439.8 | GO:0031526 | brush border membrane(GO:0031526) |
| 5.0 | 699.5 | GO:0001669 | acrosomal vesicle(GO:0001669) |
| 4.9 | 102.8 | GO:0005942 | phosphatidylinositol 3-kinase complex(GO:0005942) |
| 4.7 | 37.5 | GO:0098642 | collagen type IV trimer(GO:0005587) network-forming collagen trimer(GO:0098642) collagen network(GO:0098645) |
| 4.5 | 58.1 | GO:0008385 | IkappaB kinase complex(GO:0008385) |
| 4.0 | 19.8 | GO:0042406 | extrinsic component of endoplasmic reticulum membrane(GO:0042406) |
| 3.9 | 267.2 | GO:0005871 | kinesin complex(GO:0005871) |
| 3.2 | 538.6 | GO:0042579 | peroxisome(GO:0005777) microbody(GO:0042579) |
| 2.0 | 2645.4 | GO:0005615 | extracellular space(GO:0005615) |
| 1.9 | 632.3 | GO:0016324 | apical plasma membrane(GO:0016324) |
| 1.8 | 689.9 | GO:0005667 | transcription factor complex(GO:0005667) |
| 1.6 | 380.8 | GO:0005759 | mitochondrial matrix(GO:0005759) |
| 1.6 | 700.4 | GO:0005743 | mitochondrial inner membrane(GO:0005743) |
| 1.2 | 39.1 | GO:0001772 | immunological synapse(GO:0001772) |
| 1.0 | 71.8 | GO:0031463 | Cul3-RING ubiquitin ligase complex(GO:0031463) |
| 0.9 | 2.7 | GO:1990730 | VCP-NSFL1C complex(GO:1990730) |
| 0.9 | 1842.8 | GO:0070062 | extracellular exosome(GO:0070062) |
| 0.8 | 419.2 | GO:0005789 | endoplasmic reticulum membrane(GO:0005789) |
| 0.6 | 548.6 | GO:0005887 | integral component of plasma membrane(GO:0005887) |
| 0.5 | 24.1 | GO:0043296 | apical junction complex(GO:0043296) |
| 0.4 | 193.6 | GO:0005576 | extracellular region(GO:0005576) |
| 0.3 | 15.2 | GO:0005776 | autophagosome(GO:0005776) |
| 0.3 | 8.2 | GO:0032421 | stereocilium bundle(GO:0032421) |
| 0.3 | 212.3 | GO:0005739 | mitochondrion(GO:0005739) |
| 0.1 | 536.8 | GO:0016021 | integral component of membrane(GO:0016021) |
| 0.1 | 24.4 | GO:0000323 | lytic vacuole(GO:0000323) lysosome(GO:0005764) |
Gene overrepresentation in molecular function category:
| Log-likelihood per target | Total log-likelihood | Term | Description |
|---|---|---|---|
| 248.7 | 746.1 | GO:0004657 | proline dehydrogenase activity(GO:0004657) |
| 160.7 | 803.3 | GO:0050309 | glucose-6-phosphatase activity(GO:0004346) sugar-terminal-phosphatase activity(GO:0050309) |
| 126.3 | 379.0 | GO:0031714 | C5a anaphylatoxin chemotactic receptor binding(GO:0031714) |
| 124.6 | 373.9 | GO:0060230 | lipoprotein lipase activator activity(GO:0060230) |
| 120.0 | 480.2 | GO:0016160 | amylase activity(GO:0016160) |
| 110.4 | 883.5 | GO:0003996 | acyl-CoA ligase activity(GO:0003996) |
| 110.0 | 330.1 | GO:0004505 | phenylalanine 4-monooxygenase activity(GO:0004505) |
| 97.8 | 586.5 | GO:0005499 | vitamin D binding(GO:0005499) |
| 94.7 | 663.0 | GO:0001849 | complement component C1q binding(GO:0001849) |
| 79.2 | 237.7 | GO:0038181 | bile acid receptor activity(GO:0038181) |
| 75.2 | 451.3 | GO:0042954 | lipoprotein transporter activity(GO:0042954) |
| 71.9 | 287.6 | GO:0018685 | alkane 1-monooxygenase activity(GO:0018685) |
| 71.2 | 854.1 | GO:0005436 | sodium:phosphate symporter activity(GO:0005436) |
| 65.1 | 781.3 | GO:0016290 | palmitoyl-CoA hydrolase activity(GO:0016290) |
| 61.2 | 244.8 | GO:0003973 | (S)-2-hydroxy-acid oxidase activity(GO:0003973) |
| 57.1 | 171.4 | GO:0008511 | sodium:potassium:chloride symporter activity(GO:0008511) |
| 55.8 | 223.1 | GO:0008241 | peptidyl-dipeptidase activity(GO:0008241) |
| 54.7 | 164.1 | GO:0004058 | aromatic-L-amino-acid decarboxylase activity(GO:0004058) L-dopa decarboxylase activity(GO:0036468) |
| 53.2 | 213.0 | GO:0016833 | oxo-acid-lyase activity(GO:0016833) |
| 53.1 | 1114.9 | GO:0034185 | apolipoprotein binding(GO:0034185) |
| 40.5 | 162.1 | GO:0003835 | beta-galactoside alpha-2,6-sialyltransferase activity(GO:0003835) |
| 40.1 | 1242.5 | GO:0015020 | glucuronosyltransferase activity(GO:0015020) |
| 39.7 | 476.4 | GO:0001848 | complement binding(GO:0001848) |
| 35.5 | 319.6 | GO:0031995 | insulin-like growth factor II binding(GO:0031995) |
| 34.2 | 102.7 | GO:0017113 | dihydrouracil dehydrogenase (NAD+) activity(GO:0004159) dihydropyrimidine dehydrogenase (NADP+) activity(GO:0017113) |
| 32.7 | 98.1 | GO:0045550 | geranylgeranyl reductase activity(GO:0045550) delta4-3-oxosteroid 5beta-reductase activity(GO:0047787) |
| 32.1 | 96.2 | GO:0047708 | biotinidase activity(GO:0047708) |
| 28.4 | 85.1 | GO:0098603 | selenol Se-methyltransferase activity(GO:0098603) |
| 25.0 | 200.2 | GO:0015347 | sodium-independent organic anion transmembrane transporter activity(GO:0015347) |
| 24.4 | 171.0 | GO:0070095 | fructose-6-phosphate binding(GO:0070095) |
| 22.5 | 180.1 | GO:0015349 | thyroid hormone transmembrane transporter activity(GO:0015349) |
| 21.8 | 435.5 | GO:0043395 | heparan sulfate proteoglycan binding(GO:0043395) |
| 21.3 | 213.1 | GO:0008239 | dipeptidyl-peptidase activity(GO:0008239) |
| 19.1 | 76.5 | GO:0008940 | nitrate reductase activity(GO:0008940) |
| 18.8 | 94.2 | GO:0050833 | pyruvate transmembrane transporter activity(GO:0050833) |
| 18.5 | 166.5 | GO:0004859 | phospholipase inhibitor activity(GO:0004859) |
| 17.1 | 324.8 | GO:0015643 | toxic substance binding(GO:0015643) |
| 16.2 | 242.4 | GO:0005542 | folic acid binding(GO:0005542) |
| 15.8 | 110.6 | GO:0004064 | arylesterase activity(GO:0004064) |
| 14.7 | 117.3 | GO:1901702 | urate transmembrane transporter activity(GO:0015143) salt transmembrane transporter activity(GO:1901702) |
| 13.8 | 96.6 | GO:0030250 | cyclase activator activity(GO:0010853) guanylate cyclase activator activity(GO:0030250) |
| 13.7 | 68.4 | GO:0004758 | serine C-palmitoyltransferase activity(GO:0004758) C-palmitoyltransferase activity(GO:0016454) |
| 12.8 | 102.8 | GO:0035005 | 1-phosphatidylinositol-4-phosphate 3-kinase activity(GO:0035005) |
| 11.7 | 1326.0 | GO:0004867 | serine-type endopeptidase inhibitor activity(GO:0004867) |
| 10.1 | 70.6 | GO:0000268 | peroxisome targeting sequence binding(GO:0000268) |
| 9.3 | 120.6 | GO:0005391 | sodium:potassium-exchanging ATPase activity(GO:0005391) |
| 9.1 | 209.2 | GO:0016702 | oxidoreductase activity, acting on single donors with incorporation of molecular oxygen, incorporation of two atoms of oxygen(GO:0016702) |
| 8.8 | 158.3 | GO:0043295 | glutathione binding(GO:0043295) |
| 8.6 | 605.5 | GO:0019842 | vitamin binding(GO:0019842) |
| 8.0 | 167.4 | GO:0046961 | proton-transporting ATPase activity, rotational mechanism(GO:0046961) |
| 7.3 | 389.4 | GO:0005044 | scavenger receptor activity(GO:0005044) |
| 7.2 | 21.5 | GO:0047057 | oxidoreductase activity, acting on the CH-OH group of donors, disulfide as acceptor(GO:0016900) vitamin-K-epoxide reductase (warfarin-sensitive) activity(GO:0047057) |
| 6.9 | 111.0 | GO:0008271 | secondary active sulfate transmembrane transporter activity(GO:0008271) |
| 6.8 | 34.2 | GO:0019770 | IgG receptor activity(GO:0019770) |
| 6.4 | 193.2 | GO:0017134 | fibroblast growth factor binding(GO:0017134) |
| 6.4 | 514.8 | GO:0015297 | antiporter activity(GO:0015297) |
| 6.2 | 166.7 | GO:0005328 | neurotransmitter:sodium symporter activity(GO:0005328) |
| 5.5 | 77.5 | GO:0016832 | aldehyde-lyase activity(GO:0016832) |
| 5.1 | 667.5 | GO:0030674 | protein binding, bridging(GO:0030674) |
| 4.8 | 395.9 | GO:0016209 | antioxidant activity(GO:0016209) |
| 4.0 | 24.2 | GO:0008294 | calcium- and calmodulin-responsive adenylate cyclase activity(GO:0008294) |
| 3.8 | 30.8 | GO:0016936 | galactoside binding(GO:0016936) |
| 3.5 | 24.6 | GO:1901611 | phosphatidylglycerol binding(GO:1901611) |
| 3.4 | 287.2 | GO:0003707 | steroid hormone receptor activity(GO:0003707) |
| 3.1 | 260.6 | GO:0003725 | double-stranded RNA binding(GO:0003725) |
| 3.0 | 267.2 | GO:0003777 | microtubule motor activity(GO:0003777) |
| 3.0 | 36.4 | GO:0001161 | intronic transcription regulatory region sequence-specific DNA binding(GO:0001161) intronic transcription regulatory region DNA binding(GO:0044213) |
| 3.0 | 344.4 | GO:0042626 | ATPase activity, coupled to transmembrane movement of substances(GO:0042626) |
| 2.7 | 65.1 | GO:0042974 | retinoic acid receptor binding(GO:0042974) |
| 2.2 | 58.1 | GO:0004709 | MAP kinase kinase kinase activity(GO:0004709) |
| 2.1 | 36.4 | GO:0019825 | oxygen binding(GO:0019825) |
| 2.1 | 1381.7 | GO:0016491 | oxidoreductase activity(GO:0016491) |
| 1.9 | 401.1 | GO:0004252 | serine-type endopeptidase activity(GO:0004252) |
| 1.8 | 55.9 | GO:0016790 | thiolester hydrolase activity(GO:0016790) |
| 1.6 | 19.8 | GO:0051787 | misfolded protein binding(GO:0051787) |
| 1.3 | 22.1 | GO:0097602 | cullin family protein binding(GO:0097602) |
| 1.2 | 172.5 | GO:0016853 | isomerase activity(GO:0016853) |
| 0.8 | 16.7 | GO:0005212 | structural constituent of eye lens(GO:0005212) |
| 0.7 | 2.2 | GO:0046848 | hydroxyapatite binding(GO:0046848) |
| 0.7 | 111.6 | GO:0005179 | hormone activity(GO:0005179) |
| 0.7 | 9.5 | GO:0003688 | DNA replication origin binding(GO:0003688) |
| 0.7 | 52.1 | GO:0051117 | ATPase binding(GO:0051117) |
| 0.6 | 37.5 | GO:0005201 | extracellular matrix structural constituent(GO:0005201) |
| 0.3 | 37.3 | GO:0042826 | histone deacetylase binding(GO:0042826) |
| 0.3 | 9.1 | GO:0001540 | beta-amyloid binding(GO:0001540) |
| 0.3 | 3.4 | GO:0005223 | intracellular cGMP activated cation channel activity(GO:0005223) |
| 0.1 | 15.5 | GO:0044325 | ion channel binding(GO:0044325) |
| 0.1 | 21.9 | GO:0008017 | microtubule binding(GO:0008017) |
| 0.1 | 24.1 | GO:0045296 | cadherin binding(GO:0045296) |
| 0.0 | 18.1 | GO:0001228 | transcriptional activator activity, RNA polymerase II transcription regulatory region sequence-specific binding(GO:0001228) |
| 0.0 | 5.8 | GO:0008022 | protein C-terminus binding(GO:0008022) |
Gene overrepresentation in curated gene sets: canonical pathways category:
| Log-likelihood per target | Total log-likelihood | Term | Description |
|---|---|---|---|
| 45.8 | 2520.6 | PID HNF3B PATHWAY | FOXA2 and FOXA3 transcription factor networks |
| 22.3 | 690.7 | PID INTEGRIN2 PATHWAY | Beta2 integrin cell surface interactions |
| 11.5 | 379.3 | ST INTERLEUKIN 4 PATHWAY | Interleukin 4 (IL-4) Pathway |
| 7.4 | 305.0 | PID SYNDECAN 4 PATHWAY | Syndecan-4-mediated signaling events |
| 6.6 | 245.6 | PID CD40 PATHWAY | CD40/CD40L signaling |
| 4.7 | 1091.5 | NABA ECM REGULATORS | Genes encoding enzymes and their regulators involved in the remodeling of the extracellular matrix |
| 4.0 | 174.1 | PID RXR VDR PATHWAY | RXR and RAR heterodimerization with other nuclear receptor |
| 3.3 | 193.2 | PID FGF PATHWAY | FGF signaling pathway |
| 3.3 | 102.8 | ST DIFFERENTIATION PATHWAY IN PC12 CELLS | Differentiation Pathway in PC12 Cells; this is a specific case of PAC1 Receptor Pathway. |
| 2.5 | 76.1 | PID HDAC CLASSIII PATHWAY | Signaling events mediated by HDAC Class III |
| 2.3 | 160.4 | PID AVB3 INTEGRIN PATHWAY | Integrins in angiogenesis |
| 1.6 | 58.1 | ST JNK MAPK PATHWAY | JNK MAPK Pathway |
| 1.3 | 24.2 | PID LPA4 PATHWAY | LPA4-mediated signaling events |
| 1.1 | 51.8 | PID AURORA B PATHWAY | Aurora B signaling |
| 0.7 | 136.1 | NABA ECM GLYCOPROTEINS | Genes encoding structural ECM glycoproteins |
| 0.6 | 26.3 | PID FCER1 PATHWAY | Fc-epsilon receptor I signaling in mast cells |
| 0.6 | 19.8 | PID ALPHA SYNUCLEIN PATHWAY | Alpha-synuclein signaling |
| 0.4 | 15.9 | PID HNF3A PATHWAY | FOXA1 transcription factor network |
| 0.4 | 18.2 | PID CASPASE PATHWAY | Caspase cascade in apoptosis |
| 0.3 | 30.1 | PID PDGFRB PATHWAY | PDGFR-beta signaling pathway |
| 0.3 | 15.5 | PID HIF1 TFPATHWAY | HIF-1-alpha transcription factor network |
| 0.2 | 53.8 | NABA SECRETED FACTORS | Genes encoding secreted soluble factors |
| 0.1 | 3.4 | PID CONE PATHWAY | Visual signal transduction: Cones |
Gene overrepresentation in curated gene sets: REACTOME pathways category:
| Log-likelihood per target | Total log-likelihood | Term | Description |
|---|---|---|---|
| 72.9 | 437.2 | REACTOME DIGESTION OF DIETARY CARBOHYDRATE | Genes involved in Digestion of dietary carbohydrate |
| 67.5 | 1283.2 | REACTOME GLUCURONIDATION | Genes involved in Glucuronidation |
| 61.8 | 989.3 | REACTOME COMMON PATHWAY | Genes involved in Common Pathway |
| 41.3 | 537.2 | REACTOME REGULATION OF COMPLEMENT CASCADE | Genes involved in Regulation of Complement cascade |
| 34.2 | 924.1 | REACTOME REGULATION OF GENE EXPRESSION IN BETA CELLS | Genes involved in Regulation of gene expression in beta cells |
| 32.5 | 324.8 | REACTOME TRANSPORT OF ORGANIC ANIONS | Genes involved in Transport of organic anions |
| 31.2 | 624.6 | REACTOME REGULATION OF INSULIN LIKE GROWTH FACTOR IGF ACTIVITY BY INSULIN LIKE GROWTH FACTOR BINDING PROTEINS IGFBPS | Genes involved in Regulation of Insulin-like Growth Factor (IGF) Activity by Insulin-like Growth Factor Binding Proteins (IGFBPs) |
| 31.0 | 527.8 | REACTOME CHYLOMICRON MEDIATED LIPID TRANSPORT | Genes involved in Chylomicron-mediated lipid transport |
| 29.0 | 609.8 | REACTOME COMPLEMENT CASCADE | Genes involved in Complement cascade |
| 24.8 | 346.6 | REACTOME BILE SALT AND ORGANIC ANION SLC TRANSPORTERS | Genes involved in Bile salt and organic anion SLC transporters |
| 21.6 | 974.2 | REACTOME GLUCOSE TRANSPORT | Genes involved in Glucose transport |
| 19.7 | 649.7 | REACTOME STEROID HORMONES | Genes involved in Steroid hormones |
| 17.8 | 213.1 | REACTOME SYNTHESIS SECRETION AND INACTIVATION OF GIP | Genes involved in Synthesis, Secretion, and Inactivation of Glucose-dependent Insulinotropic Polypeptide (GIP) |
| 15.2 | 958.2 | REACTOME PHASE II CONJUGATION | Genes involved in Phase II conjugation |
| 13.5 | 538.6 | REACTOME AMYLOIDS | Genes involved in Amyloids |
| 13.0 | 117.3 | REACTOME FACILITATIVE NA INDEPENDENT GLUCOSE TRANSPORTERS | Genes involved in Facilitative Na+-independent glucose transporters |
| 10.9 | 164.1 | REACTOME AMINE DERIVED HORMONES | Genes involved in Amine-derived hormones |
| 10.8 | 162.1 | REACTOME TERMINATION OF O GLYCAN BIOSYNTHESIS | Genes involved in Termination of O-glycan biosynthesis |
| 9.8 | 363.4 | REACTOME ABC FAMILY PROTEINS MEDIATED TRANSPORT | Genes involved in ABC-family proteins mediated transport |
| 7.9 | 102.7 | REACTOME PYRIMIDINE CATABOLISM | Genes involved in Pyrimidine catabolism |
| 7.4 | 193.2 | REACTOME FGFR LIGAND BINDING AND ACTIVATION | Genes involved in FGFR ligand binding and activation |
| 7.2 | 166.7 | REACTOME NA CL DEPENDENT NEUROTRANSMITTER TRANSPORTERS | Genes involved in Na+/Cl- dependent neurotransmitter transporters |
| 6.4 | 167.4 | REACTOME INSULIN RECEPTOR RECYCLING | Genes involved in Insulin receptor recycling |
| 6.1 | 531.5 | REACTOME RESPONSE TO ELEVATED PLATELET CYTOSOLIC CA2 | Genes involved in Response to elevated platelet cytosolic Ca2+ |
| 5.6 | 151.7 | REACTOME CASPASE MEDIATED CLEAVAGE OF CYTOSKELETAL PROTEINS | Genes involved in Caspase-mediated cleavage of cytoskeletal proteins |
| 4.7 | 837.4 | REACTOME METABOLISM OF AMINO ACIDS AND DERIVATIVES | Genes involved in Metabolism of amino acids and derivatives |
| 4.4 | 48.3 | REACTOME REGULATION OF BETA CELL DEVELOPMENT | Genes involved in Regulation of beta-cell development |
| 4.1 | 77.9 | REACTOME SYNTHESIS OF PIPS AT THE GOLGI MEMBRANE | Genes involved in Synthesis of PIPs at the Golgi membrane |
| 3.6 | 21.5 | REACTOME GAMMA CARBOXYLATION TRANSPORT AND AMINO TERMINAL CLEAVAGE OF PROTEINS | Genes involved in Gamma-carboxylation, transport, and amino-terminal cleavage of proteins |
| 3.0 | 315.1 | REACTOME TRANSPORT OF INORGANIC CATIONS ANIONS AND AMINO ACIDS OLIGOPEPTIDES | Genes involved in Transport of inorganic cations/anions and amino acids/oligopeptides |
| 2.0 | 66.5 | REACTOME TIGHT JUNCTION INTERACTIONS | Genes involved in Tight junction interactions |
| 1.6 | 24.2 | REACTOME ADENYLATE CYCLASE ACTIVATING PATHWAY | Genes involved in Adenylate cyclase activating pathway |
| 1.6 | 75.2 | REACTOME ION TRANSPORT BY P TYPE ATPASES | Genes involved in Ion transport by P-type ATPases |
| 1.0 | 156.4 | REACTOME MRNA PROCESSING | Genes involved in mRNA Processing |
| 0.4 | 20.8 | REACTOME COLLAGEN FORMATION | Genes involved in Collagen formation |
| 0.3 | 97.1 | REACTOME CLASS A1 RHODOPSIN LIKE RECEPTORS | Genes involved in Class A/1 (Rhodopsin-like receptors) |
| 0.2 | 5.8 | REACTOME BMAL1 CLOCK NPAS2 ACTIVATES CIRCADIAN EXPRESSION | Genes involved in BMAL1:CLOCK/NPAS2 Activates Circadian Expression |