Project
GSE53960: rat RNA-Seq transcriptomic Bodymap
Navigation
Downloads
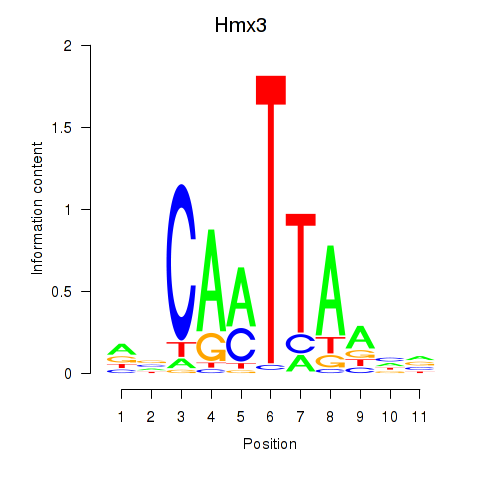
Results for Hmx3
Z-value: 0.34
Motif logo
Transcription factors associated with Hmx3
| Gene Symbol | Gene ID | Gene Info |
|---|---|---|
|
Hmx3
|
ENSRNOG00000020637 | H6 family homeobox 3 |
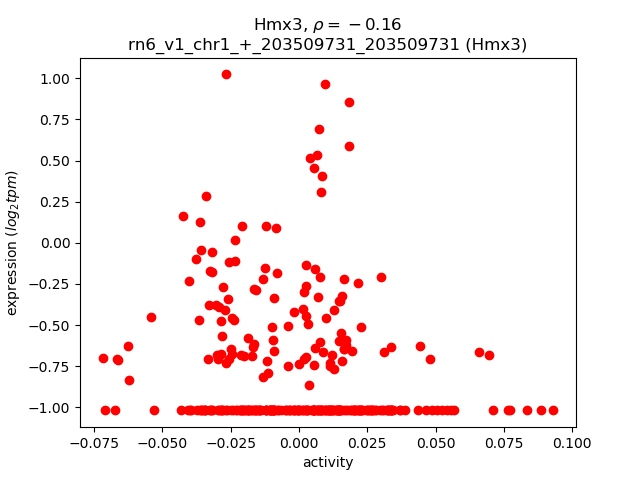
Activity-expression correlation:
| Gene | Promoter | Pearson corr. coef. | P-value | Plot |
|---|---|---|---|---|
| Hmx3 | rn6_v1_chr1_+_203509731_203509731 | -0.16 | 4.0e-03 | Click! |
Activity profile of Hmx3 motif
Sorted Z-values of Hmx3 motif
| Promoter | Log-likelihood | Transcript | Gene | Gene Info |
|---|---|---|---|---|
| chr7_-_118108864 | 11.61 |
ENSRNOT00000006184
|
Mb
|
myoglobin |
| chr2_-_138833933 | 10.96 |
ENSRNOT00000013343
|
Pcdh18
|
protocadherin 18 |
| chrX_-_23139694 | 7.29 |
ENSRNOT00000033656
|
Pfkfb1
|
6-phosphofructo-2-kinase/fructose-2,6-biphosphatase 1 |
| chr7_+_143122269 | 5.92 |
ENSRNOT00000082542
ENSRNOT00000045495 ENSRNOT00000081386 ENSRNOT00000067422 |
Krt86
|
keratin 86 |
| chr6_+_73553210 | 5.39 |
ENSRNOT00000006562
|
Akap6
|
A-kinase anchoring protein 6 |
| chrX_+_105500173 | 4.55 |
ENSRNOT00000040476
|
Armcx4
|
armadillo repeat containing, X-linked 4 |
| chr6_-_106971250 | 4.45 |
ENSRNOT00000010926
|
Dpf3
|
double PHD fingers 3 |
| chr12_+_12738812 | 4.02 |
ENSRNOT00000092233
ENSRNOT00000001379 |
Aimp2
|
aminoacyl tRNA synthetase complex-interacting multifunctional protein 2 |
| chr3_+_61620192 | 3.87 |
ENSRNOT00000065426
|
Hoxd9
|
homeo box D9 |
| chr2_+_188745503 | 3.86 |
ENSRNOT00000056652
|
Shc1
|
SHC adaptor protein 1 |
| chr3_+_44025300 | 3.82 |
ENSRNOT00000006319
|
Galnt5
|
polypeptide N-acetylgalactosaminyltransferase 5 |
| chr17_-_78735324 | 3.61 |
ENSRNOT00000036299
|
Cdnf
|
cerebral dopamine neurotrophic factor |
| chrX_+_78042859 | 3.61 |
ENSRNOT00000003286
|
Lpar4
|
lysophosphatidic acid receptor 4 |
| chr2_+_58724855 | 3.60 |
ENSRNOT00000089609
|
Capsl
|
calcyphosine-like |
| chr10_+_56445647 | 3.32 |
ENSRNOT00000056870
|
Tmem256
|
transmembrane protein 256 |
| chrX_+_6273733 | 3.28 |
ENSRNOT00000074275
|
Ndp
|
NDP, norrin cystine knot growth factor |
| chr11_-_59110562 | 2.80 |
ENSRNOT00000047907
ENSRNOT00000042024 |
Lsamp
|
limbic system-associated membrane protein |
| chr2_-_188745144 | 2.54 |
ENSRNOT00000055533
|
Cks1b
|
CDC28 protein kinase regulatory subunit 1B |
| chrX_+_110789269 | 2.44 |
ENSRNOT00000086014
|
Rnf128
|
ring finger protein 128, E3 ubiquitin protein ligase |
| chr7_-_143167772 | 2.10 |
ENSRNOT00000011374
|
Krt85
|
keratin 85 |
| chrM_+_9451 | 2.01 |
ENSRNOT00000041241
|
Mt-nd3
|
mitochondrially encoded NADH dehydrogenase 3 |
| chr8_+_22967054 | 1.74 |
ENSRNOT00000090202
|
Swsap1
|
SWIM-type zinc finger 7 associated protein 1 |
| chr11_-_29710849 | 1.67 |
ENSRNOT00000029345
|
Krtap11-1
|
keratin associated protein 11-1 |
| chr9_-_100306194 | 1.28 |
ENSRNOT00000087584
|
RGD1563692
|
similar to hypothetical protein FLJ22671 |
| chr1_-_64147251 | 1.15 |
ENSRNOT00000088502
|
Cnot3
|
CCR4-NOT transcription complex, subunit 3 |
| chr2_+_51672722 | 1.03 |
ENSRNOT00000016485
|
Fgf10
|
fibroblast growth factor 10 |
| chr8_+_20213109 | 0.75 |
ENSRNOT00000047442
|
Olr1164
|
olfactory receptor 1164 |
| chr2_+_189609800 | 0.73 |
ENSRNOT00000089016
|
Slc39a1
|
solute carrier family 39 member 1 |
| chr20_+_46519431 | 0.55 |
ENSRNOT00000077765
|
AABR07045405.1
|
|
| chr4_-_66955732 | 0.51 |
ENSRNOT00000084282
|
Kdm7a
|
lysine (K)-specific demethylase 7A |
| chr6_-_128149220 | 0.50 |
ENSRNOT00000014204
|
Gsc
|
goosecoid homeobox |
| chr9_+_40817654 | 0.39 |
ENSRNOT00000037392
|
AABR07067339.1
|
|
| chr1_+_261180007 | 0.28 |
ENSRNOT00000072181
|
Zdhhc16
|
zinc finger, DHHC-type containing 16 |
| chr12_-_12738620 | 0.24 |
ENSRNOT00000078603
ENSRNOT00000067021 |
Pms2
|
PMS1 homolog 2, mismatch repair system component |
| chr4_-_1686845 | 0.10 |
ENSRNOT00000073139
|
LOC100912507
|
olfactory receptor 8B3-like |
| chr4_+_1658278 | 0.10 |
ENSRNOT00000073845
|
Olr1250
|
olfactory receptor 1250 |
| chr6_+_8219385 | 0.09 |
ENSRNOT00000040509
|
Ppm1b
|
protein phosphatase, Mg2+/Mn2+ dependent, 1B |
| chr13_-_111972603 | 0.04 |
ENSRNOT00000007870
|
Hsd11b1
|
hydroxysteroid 11-beta dehydrogenase 1 |
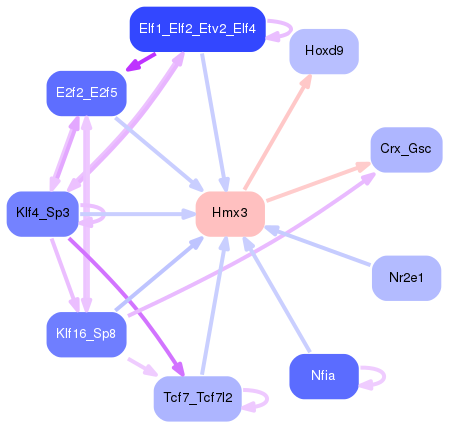
Network of associatons between targets according to the STRING database.

First level regulatory network of Hmx3
Gene Ontology Analysis
Gene overrepresentation in biological process category:
| Log-likelihood per target | Total log-likelihood | Term | Description |
|---|---|---|---|
| 3.9 | 11.6 | GO:0031444 | slow-twitch skeletal muscle fiber contraction(GO:0031444) |
| 1.3 | 5.4 | GO:1902261 | positive regulation of delayed rectifier potassium channel activity(GO:1902261) |
| 1.3 | 4.0 | GO:1903630 | regulation of aminoacyl-tRNA ligase activity(GO:1903630) |
| 0.9 | 7.3 | GO:0033133 | positive regulation of glucokinase activity(GO:0033133) |
| 0.5 | 3.3 | GO:0035426 | extracellular matrix-cell signaling(GO:0035426) |
| 0.3 | 1.0 | GO:0071338 | mammary gland bud morphogenesis(GO:0060648) submandibular salivary gland formation(GO:0060661) positive regulation of hair follicle cell proliferation(GO:0071338) |
| 0.3 | 3.9 | GO:0048935 | peripheral nervous system neuron differentiation(GO:0048934) peripheral nervous system neuron development(GO:0048935) |
| 0.1 | 2.8 | GO:0035641 | locomotory exploration behavior(GO:0035641) |
| 0.1 | 3.6 | GO:0035025 | positive regulation of Rho protein signal transduction(GO:0035025) |
| 0.1 | 0.5 | GO:0071557 | histone H3-K27 demethylation(GO:0071557) |
| 0.1 | 2.0 | GO:0009642 | response to light intensity(GO:0009642) |
| 0.1 | 2.4 | GO:0042036 | negative regulation of cytokine biosynthetic process(GO:0042036) |
| 0.1 | 3.6 | GO:0071542 | dopaminergic neuron differentiation(GO:0071542) |
| 0.1 | 3.9 | GO:0045907 | positive regulation of vasoconstriction(GO:0045907) |
| 0.1 | 2.5 | GO:0045737 | positive regulation of cyclin-dependent protein serine/threonine kinase activity(GO:0045737) |
| 0.1 | 9.0 | GO:0007156 | homophilic cell adhesion via plasma membrane adhesion molecules(GO:0007156) |
| 0.1 | 0.5 | GO:0014029 | neural crest formation(GO:0014029) |
| 0.0 | 1.1 | GO:0001829 | trophectodermal cell differentiation(GO:0001829) |
| 0.0 | 0.7 | GO:0071577 | zinc II ion transmembrane transport(GO:0071577) |
| 0.0 | 0.2 | GO:0016446 | somatic hypermutation of immunoglobulin genes(GO:0016446) |
| 0.0 | 0.1 | GO:0006499 | N-terminal protein myristoylation(GO:0006499) |
| 0.0 | 3.8 | GO:0043413 | protein glycosylation(GO:0006486) macromolecule glycosylation(GO:0043413) |
| 0.0 | 1.7 | GO:0000724 | double-strand break repair via homologous recombination(GO:0000724) |
| 0.0 | 0.0 | GO:0006713 | glucocorticoid catabolic process(GO:0006713) |
Gene overrepresentation in cellular component category:
| Log-likelihood per target | Total log-likelihood | Term | Description |
|---|---|---|---|
| 1.8 | 5.4 | GO:0014701 | junctional sarcoplasmic reticulum membrane(GO:0014701) |
| 0.4 | 1.7 | GO:0097196 | Shu complex(GO:0097196) |
| 0.3 | 4.0 | GO:0017101 | aminoacyl-tRNA synthetase multienzyme complex(GO:0017101) |
| 0.3 | 4.4 | GO:0071565 | nBAF complex(GO:0071565) |
| 0.2 | 1.1 | GO:0030015 | CCR4-NOT core complex(GO:0030015) |
| 0.1 | 9.7 | GO:0045095 | keratin filament(GO:0045095) |
| 0.1 | 2.5 | GO:0000307 | cyclin-dependent protein kinase holoenzyme complex(GO:0000307) |
| 0.0 | 0.2 | GO:0032389 | MutLalpha complex(GO:0032389) |
| 0.0 | 2.0 | GO:0030964 | mitochondrial respiratory chain complex I(GO:0005747) NADH dehydrogenase complex(GO:0030964) respiratory chain complex I(GO:0045271) |
| 0.0 | 7.3 | GO:0061695 | transferase complex, transferring phosphorus-containing groups(GO:0061695) |
| 0.0 | 2.8 | GO:0031225 | anchored component of membrane(GO:0031225) |
Gene overrepresentation in molecular function category:
| Log-likelihood per target | Total log-likelihood | Term | Description |
|---|---|---|---|
| 1.0 | 7.3 | GO:0070095 | fructose-6-phosphate binding(GO:0070095) |
| 1.0 | 3.9 | GO:0048408 | epidermal growth factor binding(GO:0048408) |
| 0.9 | 3.6 | GO:0070915 | lysophosphatidic acid binding(GO:0035727) lysophosphatidic acid receptor activity(GO:0070915) |
| 0.8 | 11.6 | GO:0005344 | oxygen transporter activity(GO:0005344) |
| 0.6 | 2.5 | GO:0061575 | cyclin-dependent protein serine/threonine kinase activator activity(GO:0061575) |
| 0.6 | 5.4 | GO:0043495 | protein anchor(GO:0043495) |
| 0.3 | 3.8 | GO:0004653 | polypeptide N-acetylgalactosaminyltransferase activity(GO:0004653) |
| 0.2 | 1.0 | GO:0005111 | type 2 fibroblast growth factor receptor binding(GO:0005111) |
| 0.1 | 0.5 | GO:0071558 | histone demethylase activity (H3-K27 specific)(GO:0071558) |
| 0.1 | 3.3 | GO:0005109 | frizzled binding(GO:0005109) |
| 0.1 | 2.0 | GO:0050136 | NADH dehydrogenase (ubiquinone) activity(GO:0008137) NADH dehydrogenase (quinone) activity(GO:0050136) |
| 0.1 | 0.2 | GO:0032138 | single base insertion or deletion binding(GO:0032138) |
| 0.1 | 4.0 | GO:0032947 | protein complex scaffold(GO:0032947) |
| 0.0 | 3.6 | GO:0008083 | growth factor activity(GO:0008083) |
| 0.0 | 4.4 | GO:0001227 | transcriptional repressor activity, RNA polymerase II transcription regulatory region sequence-specific binding(GO:0001227) |
| 0.0 | 12.6 | GO:0005509 | calcium ion binding(GO:0005509) |
| 0.0 | 0.0 | GO:0003845 | 11-beta-hydroxysteroid dehydrogenase [NAD(P)] activity(GO:0003845) |
| 0.0 | 2.4 | GO:0061630 | ubiquitin protein ligase activity(GO:0061630) |
| 0.0 | 7.0 | GO:0005198 | structural molecule activity(GO:0005198) |
Gene overrepresentation in curated gene sets: canonical pathways category:
| Log-likelihood per target | Total log-likelihood | Term | Description |
|---|---|---|---|
| 0.2 | 3.9 | SA PTEN PATHWAY | PTEN is a tumor suppressor that dephosphorylates the lipid messenger phosphatidylinositol triphosphate. |
| 0.2 | 3.6 | PID LPA4 PATHWAY | LPA4-mediated signaling events |
| 0.0 | 2.4 | PID NFAT TFPATHWAY | Calcineurin-regulated NFAT-dependent transcription in lymphocytes |
Gene overrepresentation in curated gene sets: REACTOME pathways category:
| Log-likelihood per target | Total log-likelihood | Term | Description |
|---|---|---|---|
| 0.3 | 3.6 | REACTOME P2Y RECEPTORS | Genes involved in P2Y receptors |
| 0.3 | 3.9 | REACTOME SIGNAL ATTENUATION | Genes involved in Signal attenuation |
| 0.2 | 7.3 | REACTOME GLYCOLYSIS | Genes involved in Glycolysis |
| 0.1 | 4.0 | REACTOME CYTOSOLIC TRNA AMINOACYLATION | Genes involved in Cytosolic tRNA aminoacylation |
| 0.1 | 3.8 | REACTOME O LINKED GLYCOSYLATION OF MUCINS | Genes involved in O-linked glycosylation of mucins |
| 0.1 | 1.0 | REACTOME FGFR1 LIGAND BINDING AND ACTIVATION | Genes involved in FGFR1 ligand binding and activation |
| 0.1 | 2.5 | REACTOME G1 PHASE | Genes involved in G1 Phase |
| 0.0 | 1.1 | REACTOME DEADENYLATION OF MRNA | Genes involved in Deadenylation of mRNA |
| 0.0 | 0.7 | REACTOME ZINC TRANSPORTERS | Genes involved in Zinc transporters |