Project
GSE53960: rat RNA-Seq transcriptomic Bodymap
Navigation
Downloads
Results for Hlx
Z-value: 0.16
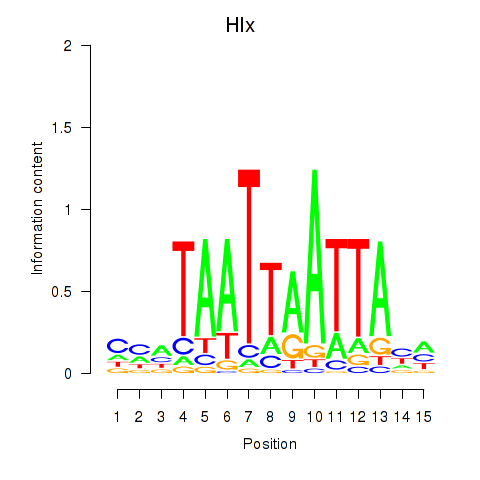
Motif logo
Transcription factors associated with Hlx
| Gene Symbol | Gene ID | Gene Info |
|---|---|---|
|
Hlx
|
ENSRNOG00000002309 | H2.0-like homeobox |
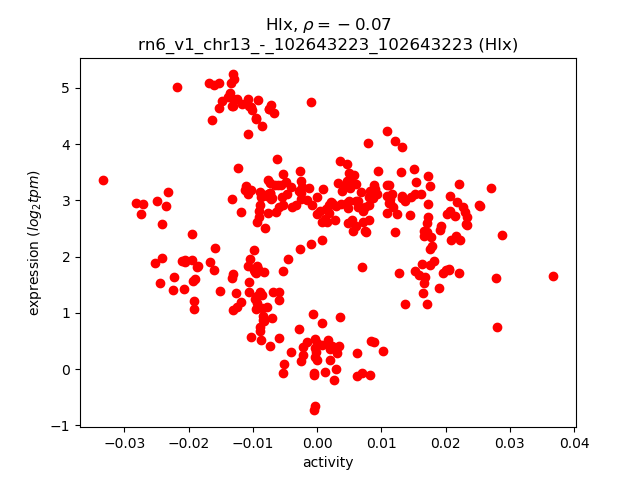
Activity-expression correlation:
| Gene | Promoter | Pearson corr. coef. | P-value | Plot |
|---|---|---|---|---|
| Hlx | rn6_v1_chr13_-_102643223_102643223 | -0.07 | 2.3e-01 | Click! |
Activity profile of Hlx motif
Sorted Z-values of Hlx motif
| Promoter | Log-likelihood | Transcript | Gene | Gene Info |
|---|---|---|---|---|
| chr1_-_264975132 | 3.75 |
ENSRNOT00000021748
|
Lbx1
|
ladybird homeobox 1 |
| chr4_-_180234804 | 3.39 |
ENSRNOT00000070957
|
Bhlhe41
|
basic helix-loop-helix family, member e41 |
| chr4_+_33638709 | 1.50 |
ENSRNOT00000009888
ENSRNOT00000034719 ENSRNOT00000052333 |
Tac1
|
tachykinin, precursor 1 |
| chr8_+_5790034 | 1.06 |
ENSRNOT00000061887
|
Mmp27
|
matrix metallopeptidase 27 |
| chr4_+_57925323 | 0.91 |
ENSRNOT00000085798
|
Cpa5
|
carboxypeptidase A5 |
| chrX_-_115175299 | 0.89 |
ENSRNOT00000074322
|
Dcx
|
doublecortin |
| chr14_+_23405717 | 0.87 |
ENSRNOT00000029805
|
Tmprss11c
|
transmembrane protease, serine 11C |
| chr1_-_166912524 | 0.70 |
ENSRNOT00000092952
|
Inppl1
|
inositol polyphosphate phosphatase-like 1 |
| chr1_-_101819478 | 0.57 |
ENSRNOT00000056181
|
Grwd1
|
glutamate-rich WD repeat containing 1 |
| chr3_-_90751055 | 0.38 |
ENSRNOT00000040741
|
LOC499843
|
LRRGT00091 |
| chr17_+_52938980 | 0.16 |
ENSRNOT00000081052
|
Gabpb1l
|
GA binding protein transcription factor, beta subunit 1-like |
| chr1_-_101095594 | 0.02 |
ENSRNOT00000027944
|
Fcgrt
|
Fc fragment of IgG receptor and transporter |
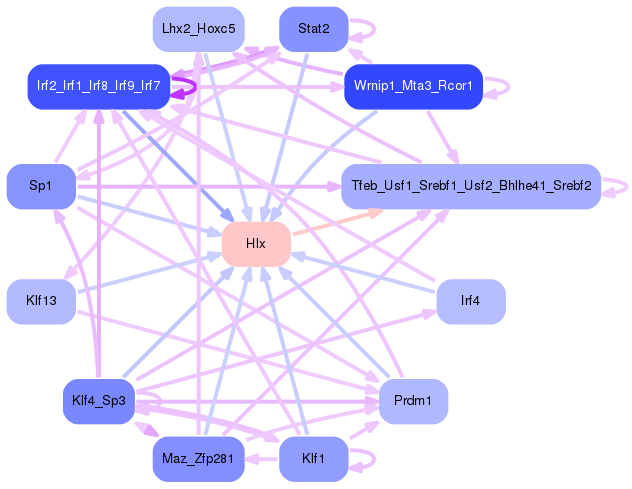
Network of associatons between targets according to the STRING database.

First level regulatory network of Hlx
Gene Ontology Analysis
Gene overrepresentation in biological process category:
| Log-likelihood per target | Total log-likelihood | Term | Description |
|---|---|---|---|
| 0.3 | 3.7 | GO:0048664 | neuron fate determination(GO:0048664) |
| 0.3 | 3.4 | GO:0010944 | negative regulation of transcription by competitive promoter binding(GO:0010944) |
| 0.3 | 1.5 | GO:2000851 | positive regulation of saliva secretion(GO:0046878) positive regulation of glucocorticoid secretion(GO:2000851) |
| 0.1 | 0.9 | GO:0097264 | self proteolysis(GO:0097264) |
| 0.1 | 0.7 | GO:0043569 | negative regulation of insulin-like growth factor receptor signaling pathway(GO:0043569) |
| 0.0 | 0.9 | GO:0021860 | pyramidal neuron development(GO:0021860) |
| 0.0 | 0.6 | GO:0006337 | nucleosome disassembly(GO:0006337) |
Gene overrepresentation in cellular component category:
| Log-likelihood per target | Total log-likelihood | Term | Description |
|---|---|---|---|
| 0.2 | 1.1 | GO:0042406 | extrinsic component of endoplasmic reticulum membrane(GO:0042406) |
Gene overrepresentation in molecular function category:
| Log-likelihood per target | Total log-likelihood | Term | Description |
|---|---|---|---|
| 0.5 | 3.4 | GO:0043426 | MRF binding(GO:0043426) |
| 0.1 | 0.7 | GO:0004445 | inositol-polyphosphate 5-phosphatase activity(GO:0004445) |
| 0.0 | 0.6 | GO:0003688 | DNA replication origin binding(GO:0003688) |
| 0.0 | 1.5 | GO:0071855 | neuropeptide receptor binding(GO:0071855) |
| 0.0 | 0.9 | GO:0004181 | metallocarboxypeptidase activity(GO:0004181) |
Gene overrepresentation in curated gene sets: canonical pathways category:
| Log-likelihood per target | Total log-likelihood | Term | Description |
|---|---|---|---|
| 0.0 | 3.4 | PID HIF1 TFPATHWAY | HIF-1-alpha transcription factor network |
| 0.0 | 0.9 | PID LIS1 PATHWAY | Lissencephaly gene (LIS1) in neuronal migration and development |
| 0.0 | 0.7 | PID EPHA2 FWD PATHWAY | EPHA2 forward signaling |
Gene overrepresentation in curated gene sets: REACTOME pathways category:
| Log-likelihood per target | Total log-likelihood | Term | Description |
|---|---|---|---|
| 0.1 | 3.4 | REACTOME BMAL1 CLOCK NPAS2 ACTIVATES CIRCADIAN EXPRESSION | Genes involved in BMAL1:CLOCK/NPAS2 Activates Circadian Expression |
| 0.0 | 0.7 | REACTOME SYNTHESIS OF PIPS AT THE PLASMA MEMBRANE | Genes involved in Synthesis of PIPs at the plasma membrane |