Project
GSE53960: rat RNA-Seq transcriptomic Bodymap
Navigation
Downloads
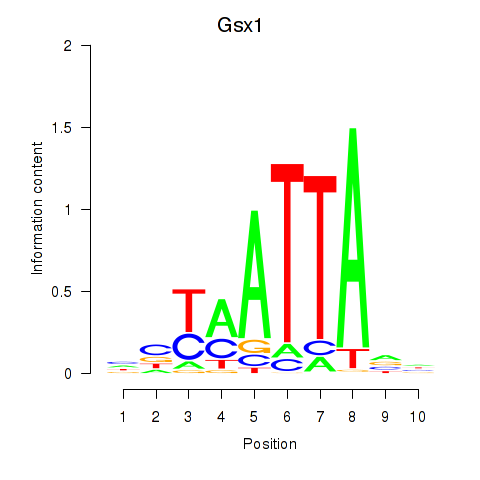
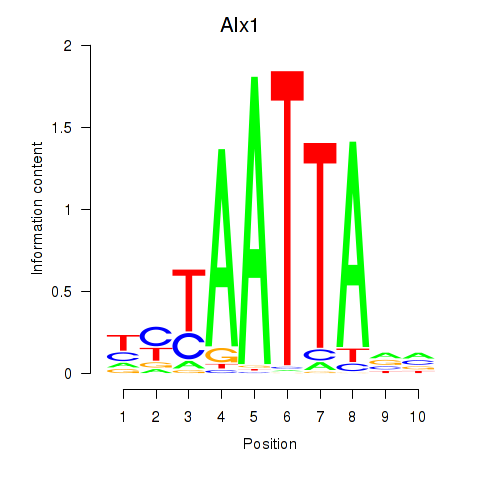
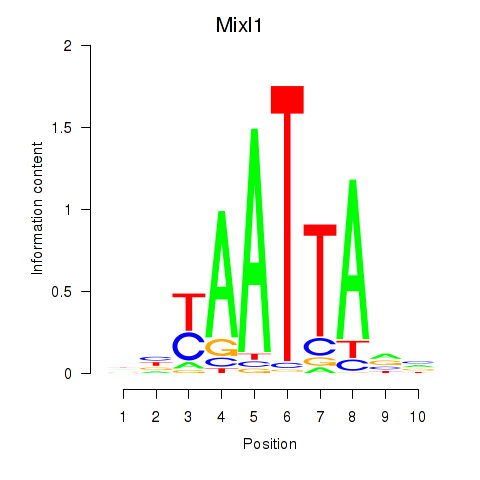
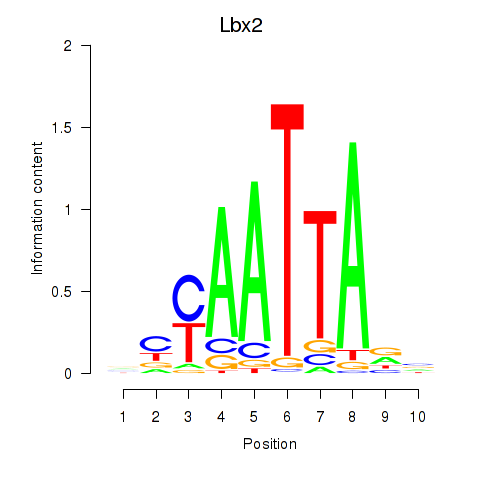
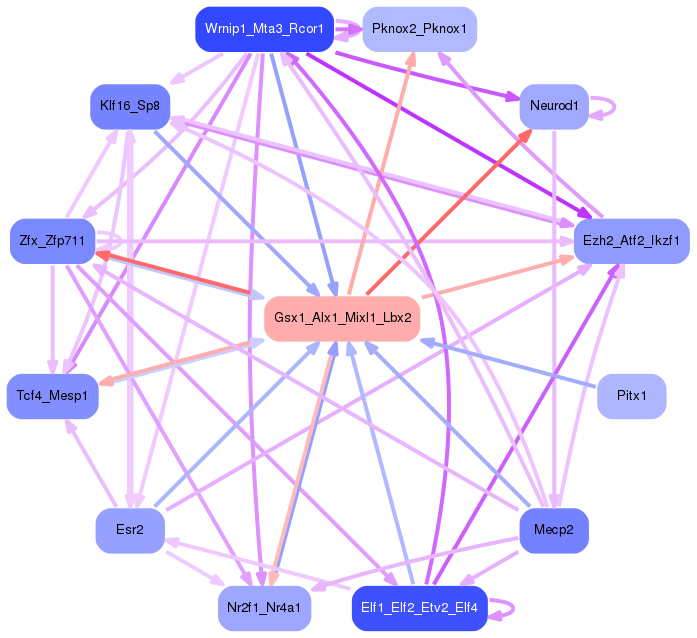
Results for Gsx1_Alx1_Mixl1_Lbx2
Z-value: 0.93
Motif logo
Transcription factors associated with Gsx1_Alx1_Mixl1_Lbx2
| Gene Symbol | Gene ID | Gene Info |
|---|---|---|
|
Gsx1
|
ENSRNOG00000000952 | GS homeobox 1 |
|
Alx1
|
ENSRNOG00000004390 | ALX homeobox 1 |
|
Mixl1
|
ENSRNOG00000003176 | Mix paired-like homeobox 1 |
|
Lbx2
|
ENSRNOG00000052374 | ladybird homeobox 2 |
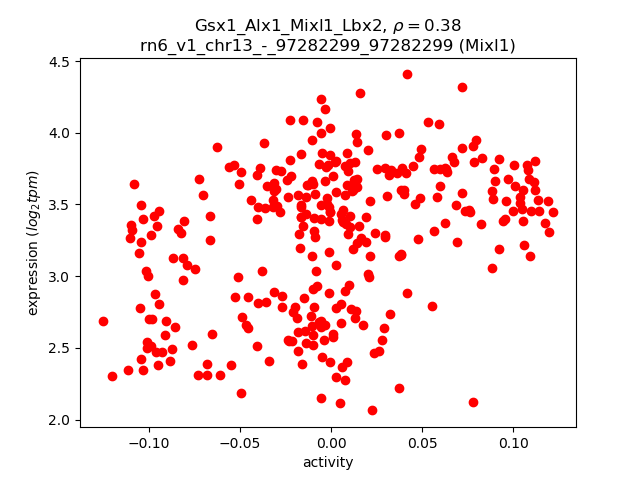
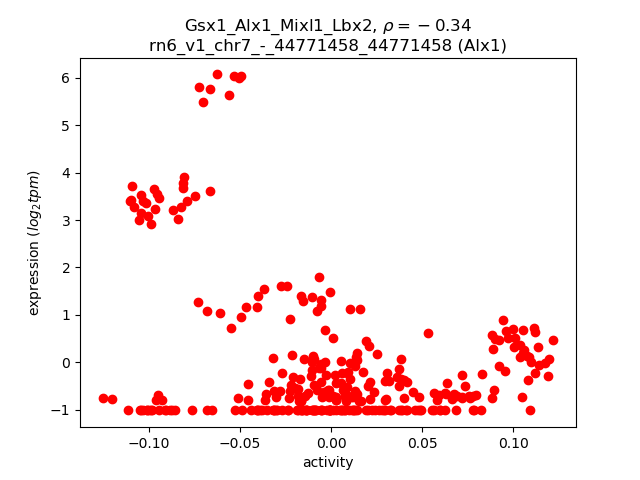
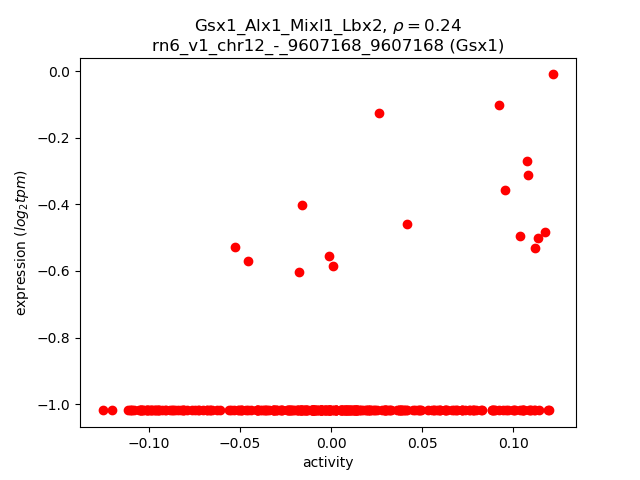
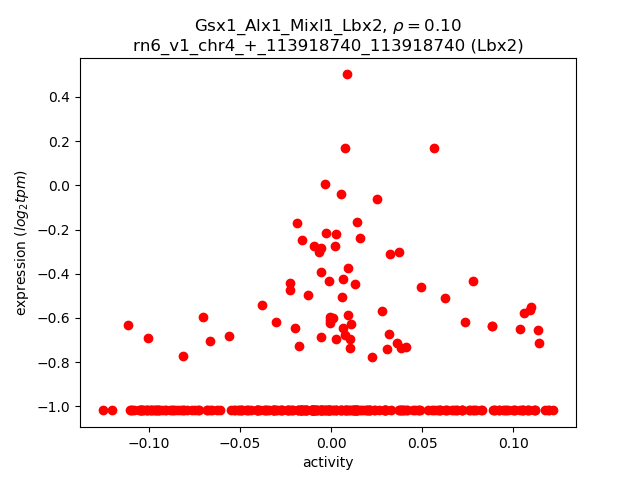
Activity-expression correlation:
| Gene | Promoter | Pearson corr. coef. | P-value | Plot |
|---|---|---|---|---|
| Mixl1 | rn6_v1_chr13_-_97282299_97282299 | 0.38 | 2.6e-12 | Click! |
| Alx1 | rn6_v1_chr7_-_44771458_44771458 | -0.34 | 2.4e-10 | Click! |
| Gsx1 | rn6_v1_chr12_-_9607168_9607168 | 0.24 | 1.5e-05 | Click! |
| Lbx2 | rn6_v1_chr4_+_113918740_113918740 | 0.10 | 7.1e-02 | Click! |
Activity profile of Gsx1_Alx1_Mixl1_Lbx2 motif
Sorted Z-values of Gsx1_Alx1_Mixl1_Lbx2 motif
| Promoter | Log-likelihood | Transcript | Gene | Gene Info |
|---|---|---|---|---|
| chrX_+_118197217 | 72.40 |
ENSRNOT00000090922
|
Htr2c
|
5-hydroxytryptamine receptor 2C |
| chr9_-_30844199 | 68.45 |
ENSRNOT00000017169
|
Col19a1
|
collagen type XIX alpha 1 chain |
| chr12_-_2174131 | 54.66 |
ENSRNOT00000001313
|
Pcp2
|
Purkinje cell protein 2 |
| chr11_+_58624198 | 46.11 |
ENSRNOT00000002091
|
Gap43
|
growth associated protein 43 |
| chr4_-_55011415 | 43.40 |
ENSRNOT00000056996
|
Grm8
|
glutamate metabotropic receptor 8 |
| chr1_+_198383201 | 39.90 |
ENSRNOT00000037405
|
Sez6l2
|
seizure related 6 homolog like 2 |
| chr9_+_73418607 | 38.93 |
ENSRNOT00000092547
|
Map2
|
microtubule-associated protein 2 |
| chr13_-_76049363 | 36.29 |
ENSRNOT00000075865
ENSRNOT00000007455 |
Brinp2
|
BMP/retinoic acid inducible neural specific 2 |
| chr7_-_28711761 | 35.10 |
ENSRNOT00000006249
|
Parpbp
|
PARP1 binding protein |
| chr17_-_43807540 | 32.89 |
ENSRNOT00000074763
|
LOC684762
|
similar to CG31613-PA |
| chr1_-_215033460 | 32.01 |
ENSRNOT00000044565
|
Dusp8
|
dual specificity phosphatase 8 |
| chr8_-_84506328 | 30.86 |
ENSRNOT00000064754
|
Mlip
|
muscular LMNA-interacting protein |
| chr4_+_94696965 | 29.89 |
ENSRNOT00000064696
|
Grid2
|
glutamate ionotropic receptor delta type subunit 2 |
| chr9_-_85243001 | 29.34 |
ENSRNOT00000020219
|
Scg2
|
secretogranin II |
| chr2_-_35104963 | 27.78 |
ENSRNOT00000018058
|
Rgs7bp
|
regulator of G-protein signaling 7-binding protein |
| chr15_-_95514259 | 26.66 |
ENSRNOT00000038433
|
Slitrk6
|
SLIT and NTRK-like family, member 6 |
| chr7_+_78558701 | 25.62 |
ENSRNOT00000006393
|
Rims2
|
regulating synaptic membrane exocytosis 2 |
| chr2_+_66940057 | 24.58 |
ENSRNOT00000043050
|
Cdh9
|
cadherin 9 |
| chr17_+_47721977 | 24.41 |
ENSRNOT00000080800
|
LOC100910792
|
amphiphysin-like |
| chr2_-_188559882 | 23.54 |
ENSRNOT00000088199
|
Trim46
|
tripartite motif-containing 46 |
| chr12_-_35979193 | 23.11 |
ENSRNOT00000071104
|
Tmem132b
|
transmembrane protein 132B |
| chr2_-_57935334 | 22.27 |
ENSRNOT00000022319
ENSRNOT00000085599 ENSRNOT00000077790 ENSRNOT00000035821 |
Slc1a3
|
solute carrier family 1 member 3 |
| chr3_-_66417741 | 21.73 |
ENSRNOT00000007662
|
Neurod1
|
neuronal differentiation 1 |
| chrX_+_84064427 | 21.25 |
ENSRNOT00000046364
|
Zfp711
|
zinc finger protein 711 |
| chr5_-_17061837 | 20.86 |
ENSRNOT00000011892
|
Penk
|
proenkephalin |
| chr6_-_114476723 | 20.56 |
ENSRNOT00000005162
|
Dio2
|
deiodinase, iodothyronine, type II |
| chr3_-_51612397 | 18.43 |
ENSRNOT00000081401
|
Scn3a
|
sodium voltage-gated channel alpha subunit 3 |
| chr4_-_17594598 | 18.21 |
ENSRNOT00000008936
|
Sema3e
|
semaphorin 3E |
| chr11_-_4332255 | 17.90 |
ENSRNOT00000087133
|
Cadm2
|
cell adhesion molecule 2 |
| chr4_-_157304653 | 17.72 |
ENSRNOT00000051613
|
Lrrc23
|
leucine rich repeat containing 23 |
| chr8_+_97291580 | 17.59 |
ENSRNOT00000018794
|
Rasgrf1
|
RAS protein-specific guanine nucleotide-releasing factor 1 |
| chr8_+_122076759 | 17.44 |
ENSRNOT00000012545
|
Clasp2
|
cytoplasmic linker associated protein 2 |
| chr10_-_74679858 | 17.24 |
ENSRNOT00000003859
|
Ppm1e
|
protein phosphatase, Mg2+/Mn2+ dependent, 1E |
| chr5_-_17061361 | 17.09 |
ENSRNOT00000089318
|
Penk
|
proenkephalin |
| chr8_+_33239139 | 16.64 |
ENSRNOT00000011589
|
Arhgap32
|
Rho GTPase activating protein 32 |
| chr2_+_72006099 | 15.84 |
ENSRNOT00000034044
|
Cdh12
|
cadherin 12 |
| chr4_+_158088505 | 15.54 |
ENSRNOT00000026643
|
Vwf
|
von Willebrand factor |
| chr12_-_5682608 | 14.81 |
ENSRNOT00000076483
|
Fry
|
FRY microtubule binding protein |
| chr2_-_219262901 | 14.62 |
ENSRNOT00000037068
|
Gpr88
|
G-protein coupled receptor 88 |
| chr8_-_120446455 | 14.43 |
ENSRNOT00000085161
ENSRNOT00000042854 ENSRNOT00000037199 |
Arpp21
|
cAMP regulated phosphoprotein 21 |
| chr7_+_44009069 | 14.13 |
ENSRNOT00000005523
|
Mgat4c
|
MGAT4 family, member C |
| chr10_-_66848388 | 14.10 |
ENSRNOT00000018891
|
Omg
|
oligodendrocyte-myelin glycoprotein |
| chr15_+_56666012 | 13.97 |
ENSRNOT00000013408
|
Htr2a
|
5-hydroxytryptamine receptor 2A |
| chr2_-_265300868 | 13.74 |
ENSRNOT00000066024
ENSRNOT00000016073 ENSRNOT00000033502 |
Lrrc7
|
leucine rich repeat containing 7 |
| chr2_-_256154584 | 13.70 |
ENSRNOT00000072487
|
AABR07013776.1
|
|
| chrX_+_62727755 | 13.02 |
ENSRNOT00000077055
|
Pcyt1b
|
phosphate cytidylyltransferase 1, choline, beta |
| chr16_-_73152921 | 12.97 |
ENSRNOT00000048602
|
Zmat4
|
zinc finger, matrin type 4 |
| chr5_-_12526962 | 12.89 |
ENSRNOT00000092104
|
St18
|
suppression of tumorigenicity 18 |
| chr10_-_87248572 | 12.76 |
ENSRNOT00000066637
ENSRNOT00000085677 |
Krt26
|
keratin 26 |
| chrX_+_65040934 | 12.43 |
ENSRNOT00000044006
|
Zc3h12b
|
zinc finger CCCH-type containing 12B |
| chr14_+_37116492 | 12.20 |
ENSRNOT00000002921
|
Sgcb
|
sarcoglycan, beta |
| chr15_+_1054937 | 12.12 |
ENSRNOT00000008154
|
AABR07016841.1
|
|
| chr13_-_32427177 | 11.98 |
ENSRNOT00000044628
|
Cdh19
|
cadherin 19 |
| chr2_+_198417619 | 11.86 |
ENSRNOT00000085945
|
Hist2h3c2
|
histone cluster 2, H3c2 |
| chr10_+_55940533 | 11.75 |
ENSRNOT00000012061
|
RGD1563441
|
similar to RIKEN cDNA A030009H04 |
| chr8_+_104106740 | 11.71 |
ENSRNOT00000015015
|
Tfdp2
|
transcription factor Dp-2 |
| chrX_+_131381134 | 11.65 |
ENSRNOT00000007474
|
AABR07041481.1
|
|
| chr7_+_28654733 | 11.56 |
ENSRNOT00000006174
|
Pmch
|
pro-melanin-concentrating hormone |
| chr4_+_33638709 | 11.48 |
ENSRNOT00000009888
ENSRNOT00000034719 ENSRNOT00000052333 |
Tac1
|
tachykinin, precursor 1 |
| chr4_-_119327822 | 11.45 |
ENSRNOT00000012645
|
Arhgap25
|
Rho GTPase activating protein 25 |
| chr3_+_173799833 | 11.44 |
ENSRNOT00000081235
|
Phactr3
|
phosphatase and actin regulator 3 |
| chr3_-_52447622 | 11.43 |
ENSRNOT00000083552
|
Scn1a
|
sodium voltage-gated channel alpha subunit 1 |
| chr9_-_11027506 | 11.37 |
ENSRNOT00000071107
|
Chaf1a
|
chromatin assembly factor 1 subunit A |
| chr11_-_4397361 | 11.27 |
ENSRNOT00000046370
|
Cadm2
|
cell adhesion molecule 2 |
| chr3_+_48106099 | 11.03 |
ENSRNOT00000007218
|
Slc4a10
|
solute carrier family 4 member 10 |
| chr18_+_62852303 | 11.01 |
ENSRNOT00000087673
|
Gnal
|
G protein subunit alpha L |
| chrX_+_65040775 | 11.00 |
ENSRNOT00000081354
|
Zc3h12b
|
zinc finger CCCH-type containing 12B |
| chr15_-_93748742 | 10.87 |
ENSRNOT00000093370
|
Mycbp2
|
MYC binding protein 2, E3 ubiquitin protein ligase |
| chr18_-_24057917 | 10.80 |
ENSRNOT00000023874
|
Rit2
|
Ras-like without CAAX 2 |
| chr18_-_67224566 | 10.60 |
ENSRNOT00000064947
|
Dcc
|
DCC netrin 1 receptor |
| chr3_-_151032302 | 10.55 |
ENSRNOT00000025315
|
Ggt7
|
gamma-glutamyltransferase 7 |
| chr2_-_170301348 | 10.49 |
ENSRNOT00000088131
|
Si
|
sucrase-isomaltase |
| chr6_+_73553210 | 10.46 |
ENSRNOT00000006562
|
Akap6
|
A-kinase anchoring protein 6 |
| chr10_-_87232723 | 10.36 |
ENSRNOT00000015150
|
Krt25
|
keratin 25 |
| chr13_-_90405591 | 10.19 |
ENSRNOT00000006849
|
Vangl2
|
VANGL planar cell polarity protein 2 |
| chr13_-_111581018 | 10.18 |
ENSRNOT00000083072
ENSRNOT00000077981 |
Sertad4
|
SERTA domain containing 4 |
| chr1_+_240355149 | 10.14 |
ENSRNOT00000018521
|
Trpm3
|
transient receptor potential cation channel, subfamily M, member 3 |
| chr3_+_110855000 | 10.14 |
ENSRNOT00000081613
|
Knl1
|
kinetochore scaffold 1 |
| chr9_+_20241062 | 10.06 |
ENSRNOT00000071593
|
LOC100911585
|
leucine-rich repeat-containing protein 23-like |
| chr2_-_139528162 | 9.99 |
ENSRNOT00000014317
|
Slc7a11
|
solute carrier family 7 member 11 |
| chr7_+_42269784 | 9.91 |
ENSRNOT00000008471
ENSRNOT00000007231 |
Kitlg
|
KIT ligand |
| chr1_+_8310577 | 9.86 |
ENSRNOT00000015131
|
Hivep2
|
human immunodeficiency virus type I enhancer binding protein 2 |
| chr7_-_73130740 | 9.57 |
ENSRNOT00000075584
|
9430069I07Rik
|
RIKEN cDNA 9430069I07 gene |
| chr11_-_43022565 | 9.42 |
ENSRNOT00000002285
|
Riox2
|
ribosomal oxygenase 2 |
| chr5_-_168734296 | 9.32 |
ENSRNOT00000066120
|
Camta1
|
calmodulin binding transcription activator 1 |
| chr7_-_143353925 | 9.17 |
ENSRNOT00000068533
|
Krt71
|
keratin 71 |
| chr18_-_6781841 | 9.16 |
ENSRNOT00000077606
ENSRNOT00000048109 |
Aqp4
|
aquaporin 4 |
| chr19_+_39229754 | 9.14 |
ENSRNOT00000050612
|
Vps4a
|
vacuolar protein sorting 4 homolog A |
| chr2_-_231648122 | 9.02 |
ENSRNOT00000014962
|
Ank2
|
ankyrin 2 |
| chr1_-_43638161 | 9.01 |
ENSRNOT00000024460
|
Ipcef1
|
interaction protein for cytohesin exchange factors 1 |
| chr3_+_128828331 | 8.91 |
ENSRNOT00000045393
|
Plcb4
|
phospholipase C, beta 4 |
| chr5_+_139790395 | 8.77 |
ENSRNOT00000015033
|
Rims3
|
regulating synaptic membrane exocytosis 3 |
| chr4_+_138441332 | 8.71 |
ENSRNOT00000090847
|
Cntn4
|
contactin 4 |
| chr17_+_44794130 | 8.63 |
ENSRNOT00000077571
|
Hist1h2ac
|
histone cluster 1, H2ac |
| chr9_+_10941613 | 8.42 |
ENSRNOT00000070794
|
Sema6b
|
semaphorin 6B |
| chr8_+_102304095 | 8.27 |
ENSRNOT00000011358
|
Slc9a9
|
solute carrier family 9 member A9 |
| chr10_+_66942398 | 8.16 |
ENSRNOT00000018986
|
Rab11fip4
|
RAB11 family interacting protein 4 |
| chr17_+_24416651 | 8.03 |
ENSRNOT00000024458
|
Cd83
|
CD83 molecule |
| chr11_-_11585078 | 7.98 |
ENSRNOT00000088878
|
Robo2
|
roundabout guidance receptor 2 |
| chr6_+_22696397 | 7.88 |
ENSRNOT00000011630
|
Alk
|
anaplastic lymphoma receptor tyrosine kinase |
| chrX_-_124464963 | 7.72 |
ENSRNOT00000036472
ENSRNOT00000077697 |
Tmem255a
|
transmembrane protein 255A |
| chr7_+_133856101 | 7.70 |
ENSRNOT00000038686
|
Pdzrn4
|
PDZ domain containing RING finger 4 |
| chr2_-_96509424 | 7.66 |
ENSRNOT00000090866
|
Zc2hc1a
|
zinc finger, C2HC-type containing 1A |
| chr3_-_26056818 | 7.64 |
ENSRNOT00000044209
|
Lrp1b
|
LDL receptor related protein 1B |
| chrX_+_6273733 | 7.63 |
ENSRNOT00000074275
|
Ndp
|
NDP, norrin cystine knot growth factor |
| chr1_-_48825364 | 7.48 |
ENSRNOT00000024213
|
Agpat4
|
1-acylglycerol-3-phosphate O-acyltransferase 4 |
| chr5_+_10178302 | 7.46 |
ENSRNOT00000009679
|
Sntg1
|
syntrophin, gamma 1 |
| chr13_-_82005741 | 7.41 |
ENSRNOT00000076404
|
Mettl11b
|
methyltransferase like 11B |
| chr5_+_18901039 | 7.31 |
ENSRNOT00000012066
|
Fam110b
|
family with sequence similarity 110, member B |
| chr10_-_16731898 | 7.25 |
ENSRNOT00000028186
|
Crebrf
|
CREB3 regulatory factor |
| chr5_+_133819726 | 7.24 |
ENSRNOT00000081075
|
Stil
|
Scl/Tal1 interrupting locus |
| chr7_+_136182224 | 7.16 |
ENSRNOT00000008159
|
Tmem117
|
transmembrane protein 117 |
| chr7_+_2752680 | 7.14 |
ENSRNOT00000033726
|
Cs
|
citrate synthase |
| chr13_-_51992693 | 7.14 |
ENSRNOT00000008282
|
Gpr37l1
|
G protein-coupled receptor 37-like 1 |
| chrX_+_158835811 | 7.14 |
ENSRNOT00000071888
ENSRNOT00000080110 |
Ints6l
|
integrator complex subunit 6 like |
| chr8_-_39551700 | 7.11 |
ENSRNOT00000091894
ENSRNOT00000076025 |
Pknox2
|
PBX/knotted 1 homeobox 2 |
| chr7_-_107616038 | 7.08 |
ENSRNOT00000088752
|
Sla
|
src-like adaptor |
| chr20_+_27366213 | 7.08 |
ENSRNOT00000000302
ENSRNOT00000057939 |
Tet1
|
tet methylcytosine dioxygenase 1 |
| chr13_-_107886476 | 7.04 |
ENSRNOT00000077282
|
Kcnk2
|
potassium two pore domain channel subfamily K member 2 |
| chr13_-_82006005 | 7.00 |
ENSRNOT00000039581
|
Mettl11b
|
methyltransferase like 11B |
| chrX_+_40460047 | 6.99 |
ENSRNOT00000010970
|
Phex
|
phosphate regulating endopeptidase homolog, X-linked |
| chr20_+_3830164 | 6.98 |
ENSRNOT00000045533
ENSRNOT00000084117 |
Col11a2
|
collagen type XI alpha 2 chain |
| chr18_+_31444472 | 6.96 |
ENSRNOT00000075159
|
Rnf14
|
ring finger protein 14 |
| chr11_+_13499164 | 6.95 |
ENSRNOT00000013159
|
LOC680121
|
similar to heat shock protein 8 |
| chr3_-_15278645 | 6.92 |
ENSRNOT00000032204
|
Ttll11
|
tubulin tyrosine ligase like11 |
| chr19_+_25043680 | 6.90 |
ENSRNOT00000043971
|
Adgrl1
|
adhesion G protein-coupled receptor L1 |
| chr3_+_177310753 | 6.80 |
ENSRNOT00000031448
|
Myt1
|
myelin transcription factor 1 |
| chr9_+_60039297 | 6.77 |
ENSRNOT00000016262
|
Slc39a10
|
solute carrier family 39 member 10 |
| chr13_+_78979321 | 6.75 |
ENSRNOT00000003857
|
Ankrd45
|
ankyrin repeat domain 45 |
| chr15_+_4209703 | 6.71 |
ENSRNOT00000082236
|
Ppp3cb
|
protein phosphatase 3 catalytic subunit beta |
| chr3_-_25212049 | 6.69 |
ENSRNOT00000040023
|
Lrp1b
|
LDL receptor related protein 1B |
| chr7_-_15073052 | 6.65 |
ENSRNOT00000037708
|
Zfp799
|
zinc finger protein 799 |
| chr18_+_65285318 | 6.64 |
ENSRNOT00000020431
|
Tcf4
|
transcription factor 4 |
| chr5_-_9035811 | 6.56 |
ENSRNOT00000082023
|
Mcmdc2
|
minichromosome maintenance domain containing 2 |
| chr8_-_33121002 | 6.56 |
ENSRNOT00000047211
|
LOC100362981
|
LRRGT00010-like |
| chr7_+_121841855 | 6.52 |
ENSRNOT00000024673
|
Grap2
|
GRB2-related adaptor protein 2 |
| chr5_+_122019301 | 6.51 |
ENSRNOT00000068158
|
Pde4b
|
phosphodiesterase 4B |
| chrX_-_104932508 | 6.47 |
ENSRNOT00000075325
|
Nox1
|
NADPH oxidase 1 |
| chr8_+_23193181 | 6.43 |
ENSRNOT00000071703
|
Zfp872
|
zinc finger protein 872 |
| chr14_+_91782354 | 6.42 |
ENSRNOT00000005902
|
Ikzf1
|
IKAROS family zinc finger 1 |
| chr12_-_46493203 | 6.41 |
ENSRNOT00000057036
|
Cit
|
citron rho-interacting serine/threonine kinase |
| chr19_+_6046665 | 6.37 |
ENSRNOT00000084126
|
Cdh8
|
cadherin 8 |
| chr1_-_120893997 | 6.36 |
ENSRNOT00000081028
|
AABR07003933.1
|
|
| chr10_-_91986632 | 6.33 |
ENSRNOT00000087824
|
Nsf
|
N-ethylmaleimide sensitive factor, vesicle fusing ATPase |
| chr17_-_43798383 | 6.14 |
ENSRNOT00000075069
|
LOC684828
|
similar to Histone H1.2 (H1 VAR.1) (H1c) |
| chr3_-_90751055 | 6.14 |
ENSRNOT00000040741
|
LOC499843
|
LRRGT00091 |
| chr6_-_115513354 | 6.07 |
ENSRNOT00000005881
|
Ston2
|
stonin 2 |
| chr14_-_45859908 | 5.98 |
ENSRNOT00000086994
|
Pgm2
|
phosphoglucomutase 2 |
| chr7_-_76488216 | 5.91 |
ENSRNOT00000080024
|
Ncald
|
neurocalcin delta |
| chr4_-_180234804 | 5.74 |
ENSRNOT00000070957
|
Bhlhe41
|
basic helix-loop-helix family, member e41 |
| chr18_-_53181503 | 5.73 |
ENSRNOT00000066548
|
Fbn2
|
fibrillin 2 |
| chr1_+_105284753 | 5.71 |
ENSRNOT00000041950
|
Slc6a5
|
solute carrier family 6 member 5 |
| chr3_-_111080705 | 5.70 |
ENSRNOT00000079339
|
Rhov
|
ras homolog family member V |
| chr13_-_102942863 | 5.65 |
ENSRNOT00000003198
|
Mark1
|
microtubule affinity regulating kinase 1 |
| chr7_+_144865608 | 5.63 |
ENSRNOT00000091596
ENSRNOT00000055285 |
Hnrnpa1
|
heterogeneous nuclear ribonucleoprotein A1 |
| chr15_+_87722221 | 5.63 |
ENSRNOT00000082688
|
Scel
|
sciellin |
| chr19_-_24614019 | 5.59 |
ENSRNOT00000005124
|
Scoc
|
short coiled-coil protein |
| chr17_+_11683862 | 5.56 |
ENSRNOT00000024766
|
Msx2
|
msh homeobox 2 |
| chrX_+_159158194 | 5.55 |
ENSRNOT00000043820
ENSRNOT00000001169 ENSRNOT00000083502 |
Fhl1
|
four and a half LIM domains 1 |
| chr11_+_46737892 | 5.52 |
ENSRNOT00000052182
|
AABR07033979.1
|
|
| chr4_+_180291389 | 5.50 |
ENSRNOT00000002465
|
Sspn
|
sarcospan |
| chr17_-_61332391 | 5.47 |
ENSRNOT00000034599
|
LOC100362965
|
SNRPN upstream reading frame protein-like |
| chrX_+_105147534 | 5.46 |
ENSRNOT00000046288
|
Cenpi
|
centromere protein I |
| chr4_-_168656673 | 5.43 |
ENSRNOT00000009341
|
Gpr19
|
G protein-coupled receptor 19 |
| chr1_+_13261876 | 5.36 |
ENSRNOT00000090703
|
Reps1
|
RALBP1 associated Eps domain containing 1 |
| chr18_+_16544508 | 5.35 |
ENSRNOT00000020601
|
Elp2
|
elongator acetyltransferase complex subunit 2 |
| chr14_+_104250617 | 5.31 |
ENSRNOT00000079874
|
Spred2
|
sprouty-related, EVH1 domain containing 2 |
| chr18_-_16542165 | 5.22 |
ENSRNOT00000079381
|
Slc39a6
|
solute carrier family 39 member 6 |
| chr3_+_47677720 | 5.22 |
ENSRNOT00000065340
|
Tbr1
|
T-box, brain, 1 |
| chr2_+_18354542 | 5.21 |
ENSRNOT00000042958
|
Hapln1
|
hyaluronan and proteoglycan link protein 1 |
| chr15_+_31950986 | 5.19 |
ENSRNOT00000080233
|
AABR07017868.4
|
|
| chr1_-_124803363 | 5.16 |
ENSRNOT00000066380
|
Klf13
|
Kruppel-like factor 13 |
| chr2_+_22950018 | 5.13 |
ENSRNOT00000071804
|
Homer1
|
homer scaffolding protein 1 |
| chr12_+_41486076 | 5.12 |
ENSRNOT00000057242
|
Rita1
|
RBPJ interacting and tubulin associated 1 |
| chr8_+_71514281 | 5.07 |
ENSRNOT00000022256
|
Ns5atp9
|
NS5A (hepatitis C virus) transactivated protein 9 |
| chrX_-_29556610 | 5.07 |
ENSRNOT00000068113
|
Trappc2
|
trafficking protein particle complex 2 |
| chrX_-_72034099 | 4.97 |
ENSRNOT00000004310
|
Ercc6l
|
ERCC excision repair 6 like, spindle assembly checkpoint helicase |
| chr15_+_12827707 | 4.88 |
ENSRNOT00000012452
|
Fezf2
|
Fez family zinc finger 2 |
| chr17_+_43632397 | 4.86 |
ENSRNOT00000013790
|
Hist1h2ah
|
histone cluster 1, H2ah |
| chr14_+_66631690 | 4.84 |
ENSRNOT00000079658
|
Kcnip4
|
potassium voltage-gated channel interacting protein 4 |
| chr15_-_37831031 | 4.81 |
ENSRNOT00000091562
|
Eef1akmt1
|
eukaryotic translation elongation factor 1 alpha lysine methyltransferase 1 |
| chr9_-_53315915 | 4.80 |
ENSRNOT00000038093
|
Mstn
|
myostatin |
| chr1_+_140792049 | 4.79 |
ENSRNOT00000049681
|
Acan
|
aggrecan |
| chr5_-_7941822 | 4.70 |
ENSRNOT00000079917
|
Prex2
|
phosphatidylinositol-3,4,5-trisphosphate-dependent Rac exchange factor 2 |
| chr2_-_250923744 | 4.68 |
ENSRNOT00000084996
|
Clca1
|
chloride channel accessory 1 |
| chr16_+_10417185 | 4.67 |
ENSRNOT00000082186
|
Anxa8
|
annexin A8 |
| chrX_+_92131209 | 4.65 |
ENSRNOT00000004462
|
Pabpc5
|
poly A binding protein, cytoplasmic 5 |
| chr4_+_22898527 | 4.63 |
ENSRNOT00000072455
ENSRNOT00000076123 |
Dbf4
|
DBF4 zinc finger |
| chr7_-_104801045 | 4.63 |
ENSRNOT00000079524
|
Asap1
|
ArfGAP with SH3 domain, ankyrin repeat and PH domain 1 |
| chr1_+_15834779 | 4.60 |
ENSRNOT00000079069
ENSRNOT00000083012 |
Bclaf1
|
BCL2-associated transcription factor 1 |
| chr18_+_30023828 | 4.55 |
ENSRNOT00000079008
|
Pcdha4
|
protocadherin alpha 4 |
| chr12_+_47551935 | 4.54 |
ENSRNOT00000056932
|
RGD1560398
|
RGD1560398 |
| chr1_-_38586563 | 4.54 |
ENSRNOT00000070999
ENSRNOT00000071758 |
LOC501406
|
similar to regulator of sex-limitation candidate 1 |
| chr2_-_58534211 | 4.47 |
ENSRNOT00000089178
|
Skp2
|
S-phase kinase associated protein 2 |
| chr2_-_38110567 | 4.41 |
ENSRNOT00000072212
|
Ipo11
|
importin 11 |
| chr8_-_83280888 | 4.37 |
ENSRNOT00000052341
|
Gfral
|
GDNF family receptor alpha like |
| chr17_-_43640387 | 4.33 |
ENSRNOT00000087731
|
Hist1h1c
|
histone cluster 1 H1 family member c |
| chr10_+_1834518 | 4.31 |
ENSRNOT00000061709
|
Gm1758
|
predicted gene 1758 |
| chr10_-_67401836 | 4.28 |
ENSRNOT00000073071
|
Crlf3
|
cytokine receptor-like factor 3 |
| chr18_+_29960072 | 4.27 |
ENSRNOT00000071366
|
AC103179.1
|
|
Network of associatons between targets according to the STRING database.

First level regulatory network of Gsx1_Alx1_Mixl1_Lbx2
Gene Ontology Analysis
Gene overrepresentation in biological process category:
| Log-likelihood per target | Total log-likelihood | Term | Description |
|---|---|---|---|
| 28.8 | 86.4 | GO:0007208 | phospholipase C-activating serotonin receptor signaling pathway(GO:0007208) |
| 12.7 | 38.0 | GO:0051867 | general adaptation syndrome, behavioral process(GO:0051867) |
| 6.5 | 52.0 | GO:0016056 | rhodopsin mediated signaling pathway(GO:0016056) |
| 5.6 | 22.3 | GO:0043490 | malate-aspartate shuttle(GO:0043490) |
| 5.4 | 54.1 | GO:0016198 | axon choice point recognition(GO:0016198) |
| 5.3 | 26.7 | GO:0060005 | vestibular reflex(GO:0060005) |
| 4.8 | 14.4 | GO:0006480 | N-terminal protein amino acid methylation(GO:0006480) |
| 4.3 | 21.7 | GO:0060729 | intestinal epithelial structure maintenance(GO:0060729) |
| 3.9 | 43.4 | GO:0007196 | adenylate cyclase-inhibiting G-protein coupled glutamate receptor signaling pathway(GO:0007196) |
| 3.7 | 14.8 | GO:1904428 | negative regulation of tubulin deacetylation(GO:1904428) |
| 3.5 | 35.1 | GO:2000042 | negative regulation of double-strand break repair via homologous recombination(GO:2000042) |
| 3.4 | 10.2 | GO:0060489 | orthogonal dichotomous subdivision of terminal units involved in lung branching morphogenesis(GO:0060488) planar dichotomous subdivision of terminal units involved in lung branching morphogenesis(GO:0060489) lateral sprouting involved in lung morphogenesis(GO:0060490) |
| 3.2 | 6.5 | GO:0045726 | positive regulation of integrin biosynthetic process(GO:0045726) |
| 3.0 | 9.1 | GO:1903774 | multivesicular body assembly(GO:0036258) positive regulation of viral budding via host ESCRT complex(GO:1903774) |
| 2.9 | 14.6 | GO:0061743 | motor learning(GO:0061743) |
| 2.7 | 10.6 | GO:0021965 | spinal cord ventral commissure morphogenesis(GO:0021965) |
| 2.6 | 7.9 | GO:0090648 | response to environmental enrichment(GO:0090648) |
| 2.6 | 10.5 | GO:1902261 | positive regulation of delayed rectifier potassium channel activity(GO:1902261) |
| 2.4 | 7.3 | GO:1902211 | regulation of prolactin signaling pathway(GO:1902211) |
| 2.4 | 7.1 | GO:0090310 | negative regulation of methylation-dependent chromatin silencing(GO:0090310) |
| 2.3 | 7.0 | GO:1900039 | positive regulation of cellular response to hypoxia(GO:1900039) |
| 2.3 | 7.0 | GO:1904383 | response to sodium phosphate(GO:1904383) |
| 2.3 | 11.6 | GO:0032227 | negative regulation of synaptic transmission, dopaminergic(GO:0032227) |
| 2.3 | 11.5 | GO:0046878 | positive regulation of saliva secretion(GO:0046878) positive regulation of glucocorticoid secretion(GO:2000851) |
| 2.3 | 9.2 | GO:0060354 | negative regulation of cell adhesion molecule production(GO:0060354) |
| 2.3 | 20.6 | GO:0042447 | hormone catabolic process(GO:0042447) |
| 2.3 | 9.0 | GO:0036371 | protein localization to M-band(GO:0036309) protein localization to T-tubule(GO:0036371) |
| 2.2 | 6.7 | GO:0001915 | negative regulation of T cell mediated cytotoxicity(GO:0001915) |
| 2.1 | 29.9 | GO:0021707 | cerebellar granular layer formation(GO:0021684) cerebellar granule cell differentiation(GO:0021707) |
| 2.1 | 39.9 | GO:0090036 | regulation of protein kinase C signaling(GO:0090036) |
| 2.0 | 9.9 | GO:0070668 | negative regulation of mast cell apoptotic process(GO:0033026) mast cell proliferation(GO:0070662) regulation of mast cell proliferation(GO:0070666) positive regulation of mast cell proliferation(GO:0070668) |
| 2.0 | 25.6 | GO:0061669 | spontaneous neurotransmitter secretion(GO:0061669) spontaneous synaptic transmission(GO:0098814) |
| 1.9 | 5.6 | GO:0035880 | embryonic nail plate morphogenesis(GO:0035880) positive regulation of catagen(GO:0051795) positive regulation of mesenchymal cell apoptotic process(GO:2001055) |
| 1.8 | 18.4 | GO:0046684 | response to pyrethroid(GO:0046684) |
| 1.8 | 10.8 | GO:0032489 | regulation of Cdc42 protein signal transduction(GO:0032489) |
| 1.7 | 17.4 | GO:0090091 | positive regulation of extracellular matrix disassembly(GO:0090091) negative regulation of wound healing, spreading of epidermal cells(GO:1903690) |
| 1.7 | 15.5 | GO:0070417 | cellular response to cold(GO:0070417) |
| 1.7 | 27.3 | GO:0099612 | protein localization to axon(GO:0099612) |
| 1.7 | 10.1 | GO:1901898 | negative regulation of relaxation of cardiac muscle(GO:1901898) |
| 1.6 | 14.5 | GO:0019227 | neuronal action potential propagation(GO:0019227) action potential propagation(GO:0098870) |
| 1.6 | 6.4 | GO:0045658 | regulation of neutrophil differentiation(GO:0045658) |
| 1.6 | 6.3 | GO:0035494 | SNARE complex disassembly(GO:0035494) |
| 1.6 | 28.1 | GO:0050930 | induction of positive chemotaxis(GO:0050930) |
| 1.4 | 13.0 | GO:1904116 | response to vasopressin(GO:1904116) |
| 1.4 | 5.6 | GO:1903936 | cellular response to sodium arsenite(GO:1903936) |
| 1.4 | 11.0 | GO:0009405 | pathogenesis(GO:0009405) |
| 1.4 | 12.2 | GO:0097084 | vascular smooth muscle cell development(GO:0097084) |
| 1.3 | 8.0 | GO:1903527 | positive regulation of membrane tubulation(GO:1903527) |
| 1.3 | 10.6 | GO:0006751 | glutathione catabolic process(GO:0006751) |
| 1.3 | 6.6 | GO:1990918 | double-strand break repair involved in meiotic recombination(GO:1990918) |
| 1.3 | 10.5 | GO:0016584 | nucleosome positioning(GO:0016584) |
| 1.3 | 3.9 | GO:0071691 | cardiac muscle thin filament assembly(GO:0071691) |
| 1.3 | 7.6 | GO:0035426 | extracellular matrix-cell signaling(GO:0035426) |
| 1.2 | 2.4 | GO:0021530 | spinal cord oligodendrocyte cell differentiation(GO:0021529) spinal cord oligodendrocyte cell fate specification(GO:0021530) |
| 1.2 | 25.9 | GO:0000188 | inactivation of MAPK activity(GO:0000188) |
| 1.2 | 7.0 | GO:0007216 | G-protein coupled glutamate receptor signaling pathway(GO:0007216) |
| 1.2 | 7.0 | GO:0060023 | soft palate development(GO:0060023) |
| 1.2 | 35.7 | GO:0014741 | negative regulation of muscle hypertrophy(GO:0014741) |
| 1.1 | 8.0 | GO:0032713 | negative regulation of interleukin-4 production(GO:0032713) |
| 1.1 | 5.7 | GO:0071692 | protein localization to extracellular region(GO:0071692) maintenance of protein location in extracellular region(GO:0071694) |
| 1.1 | 38.9 | GO:0007026 | negative regulation of microtubule depolymerization(GO:0007026) |
| 1.1 | 5.7 | GO:0036233 | glycine import(GO:0036233) |
| 1.1 | 3.3 | GO:0042427 | serotonin biosynthetic process(GO:0042427) primary amino compound biosynthetic process(GO:1901162) |
| 1.1 | 12.0 | GO:0071578 | zinc II ion transmembrane import(GO:0071578) |
| 1.0 | 3.1 | GO:0071947 | protein deubiquitination involved in ubiquitin-dependent protein catabolic process(GO:0071947) protein K33-linked deubiquitination(GO:1990168) |
| 1.0 | 15.2 | GO:0035970 | peptidyl-threonine dephosphorylation(GO:0035970) |
| 1.0 | 3.0 | GO:0015692 | nickel cation transport(GO:0015675) vanadium ion transport(GO:0015676) lead ion transport(GO:0015692) nickel cation transmembrane transport(GO:0035444) |
| 1.0 | 17.6 | GO:2000310 | regulation of N-methyl-D-aspartate selective glutamate receptor activity(GO:2000310) |
| 1.0 | 2.9 | GO:1903544 | response to butyrate(GO:1903544) |
| 1.0 | 2.9 | GO:0090158 | endoplasmic reticulum membrane organization(GO:0090158) |
| 0.9 | 9.4 | GO:0070544 | histone H3-K36 demethylation(GO:0070544) |
| 0.9 | 2.8 | GO:0097156 | fasciculation of motor neuron axon(GO:0097156) |
| 0.9 | 12.1 | GO:0021785 | branchiomotor neuron axon guidance(GO:0021785) |
| 0.9 | 25.1 | GO:0006335 | DNA replication-dependent nucleosome assembly(GO:0006335) DNA replication-dependent nucleosome organization(GO:0034723) |
| 0.9 | 10.1 | GO:0021902 | commitment of neuronal cell to specific neuron type in forebrain(GO:0021902) |
| 0.9 | 3.6 | GO:0046985 | positive regulation of hemoglobin biosynthetic process(GO:0046985) |
| 0.9 | 7.2 | GO:0033504 | floor plate development(GO:0033504) |
| 0.9 | 2.7 | GO:2000721 | regulation of cell growth by extracellular stimulus(GO:0001560) negative regulation of beta-amyloid clearance(GO:1900222) positive regulation of vascular smooth muscle cell differentiation(GO:1905065) negative regulation of platelet-derived growth factor receptor-beta signaling pathway(GO:2000587) positive regulation of transcription from RNA polymerase II promoter involved in smooth muscle cell differentiation(GO:2000721) |
| 0.9 | 3.4 | GO:0051643 | endoplasmic reticulum localization(GO:0051643) |
| 0.8 | 3.4 | GO:0036324 | vascular endothelial growth factor receptor-2 signaling pathway(GO:0036324) |
| 0.8 | 7.5 | GO:0016024 | CDP-diacylglycerol biosynthetic process(GO:0016024) |
| 0.8 | 7.1 | GO:0021940 | positive regulation of cerebellar granule cell precursor proliferation(GO:0021940) |
| 0.8 | 4.7 | GO:0032429 | regulation of phospholipase A2 activity(GO:0032429) |
| 0.8 | 2.3 | GO:0034085 | establishment of sister chromatid cohesion(GO:0034085) cohesin loading(GO:0071921) regulation of cohesin loading(GO:0071922) regulation of hepatocyte apoptotic process(GO:1903943) negative regulation of hepatocyte apoptotic process(GO:1903944) |
| 0.7 | 10.5 | GO:0034285 | response to sucrose(GO:0009744) response to fructose(GO:0009750) response to disaccharide(GO:0034285) |
| 0.7 | 4.5 | GO:0071460 | cellular response to cell-matrix adhesion(GO:0071460) |
| 0.7 | 1.5 | GO:2001205 | negative regulation of osteoclast development(GO:2001205) |
| 0.7 | 4.4 | GO:0006610 | ribosomal protein import into nucleus(GO:0006610) |
| 0.7 | 19.5 | GO:0045109 | intermediate filament organization(GO:0045109) |
| 0.7 | 10.0 | GO:0089711 | L-glutamate transmembrane transport(GO:0089711) |
| 0.7 | 6.9 | GO:0018095 | protein polyglutamylation(GO:0018095) |
| 0.7 | 6.9 | GO:0090129 | positive regulation of synapse maturation(GO:0090129) |
| 0.7 | 5.5 | GO:0051970 | negative regulation of transmission of nerve impulse(GO:0051970) |
| 0.7 | 4.8 | GO:0060591 | chondroblast differentiation(GO:0060591) |
| 0.7 | 10.1 | GO:0034501 | protein localization to kinetochore(GO:0034501) |
| 0.6 | 11.0 | GO:0021860 | pyramidal neuron development(GO:0021860) |
| 0.6 | 8.3 | GO:1990118 | sodium ion import across plasma membrane(GO:0098719) sodium ion import into cell(GO:1990118) |
| 0.6 | 89.6 | GO:0007156 | homophilic cell adhesion via plasma membrane adhesion molecules(GO:0007156) |
| 0.6 | 18.4 | GO:0071526 | semaphorin-plexin signaling pathway(GO:0071526) |
| 0.6 | 1.9 | GO:0015808 | L-alanine transport(GO:0015808) |
| 0.6 | 3.1 | GO:0043418 | homocysteine catabolic process(GO:0043418) |
| 0.6 | 3.6 | GO:0035093 | spermatogenesis, exchange of chromosomal proteins(GO:0035093) |
| 0.6 | 1.8 | GO:0006421 | asparaginyl-tRNA aminoacylation(GO:0006421) |
| 0.6 | 6.9 | GO:0001778 | plasma membrane repair(GO:0001778) |
| 0.6 | 5.7 | GO:0010944 | negative regulation of transcription by competitive promoter binding(GO:0010944) |
| 0.6 | 2.9 | GO:0042264 | peptidyl-aspartic acid hydroxylation(GO:0042264) |
| 0.6 | 5.6 | GO:0061635 | regulation of protein complex stability(GO:0061635) |
| 0.6 | 6.6 | GO:0042118 | endothelial cell activation(GO:0042118) |
| 0.5 | 14.1 | GO:0048679 | regulation of axon regeneration(GO:0048679) |
| 0.5 | 36.3 | GO:0071300 | cellular response to retinoic acid(GO:0071300) |
| 0.5 | 2.1 | GO:0030397 | membrane disassembly(GO:0030397) nuclear envelope disassembly(GO:0051081) |
| 0.5 | 37.5 | GO:0006334 | nucleosome assembly(GO:0006334) |
| 0.5 | 5.2 | GO:0045647 | negative regulation of erythrocyte differentiation(GO:0045647) |
| 0.5 | 1.0 | GO:0051866 | general adaptation syndrome(GO:0051866) |
| 0.5 | 3.0 | GO:2000354 | regulation of ovarian follicle development(GO:2000354) |
| 0.5 | 1.9 | GO:2000574 | regulation of microtubule motor activity(GO:2000574) |
| 0.5 | 4.2 | GO:0015816 | glycine transport(GO:0015816) |
| 0.5 | 2.3 | GO:0006041 | glucosamine metabolic process(GO:0006041) |
| 0.5 | 4.1 | GO:0034983 | peptidyl-lysine deacetylation(GO:0034983) |
| 0.5 | 2.3 | GO:0006030 | chitin metabolic process(GO:0006030) chitin catabolic process(GO:0006032) glucosamine-containing compound catabolic process(GO:1901072) |
| 0.5 | 3.2 | GO:0045348 | response to cobalamin(GO:0033590) positive regulation of MHC class II biosynthetic process(GO:0045348) |
| 0.4 | 1.3 | GO:0019086 | late viral transcription(GO:0019086) |
| 0.4 | 7.5 | GO:0007602 | phototransduction(GO:0007602) |
| 0.4 | 0.9 | GO:2000342 | negative regulation of chemokine (C-X-C motif) ligand 2 production(GO:2000342) |
| 0.4 | 0.9 | GO:0015842 | aminergic neurotransmitter loading into synaptic vesicle(GO:0015842) |
| 0.4 | 4.2 | GO:0042699 | follicle-stimulating hormone signaling pathway(GO:0042699) |
| 0.4 | 7.1 | GO:0006107 | oxaloacetate metabolic process(GO:0006107) |
| 0.4 | 4.0 | GO:0007210 | serotonin receptor signaling pathway(GO:0007210) |
| 0.4 | 3.9 | GO:0050862 | positive regulation of T cell receptor signaling pathway(GO:0050862) |
| 0.4 | 3.9 | GO:0021796 | cerebral cortex regionalization(GO:0021796) |
| 0.4 | 1.5 | GO:0051684 | maintenance of Golgi location(GO:0051684) |
| 0.4 | 2.6 | GO:0070543 | response to linoleic acid(GO:0070543) |
| 0.4 | 1.5 | GO:2001206 | positive regulation of osteoclast development(GO:2001206) |
| 0.4 | 2.2 | GO:0035992 | tendon cell differentiation(GO:0035990) tendon formation(GO:0035992) |
| 0.4 | 2.2 | GO:0007221 | positive regulation of transcription of Notch receptor target(GO:0007221) |
| 0.4 | 2.9 | GO:0098789 | pre-mRNA cleavage required for polyadenylation(GO:0098789) |
| 0.3 | 1.0 | GO:0060355 | positive regulation of cell adhesion molecule production(GO:0060355) |
| 0.3 | 2.4 | GO:0000467 | exonucleolytic trimming involved in rRNA processing(GO:0000459) exonucleolytic trimming to generate mature 3'-end of 5.8S rRNA from tricistronic rRNA transcript (SSU-rRNA, 5.8S rRNA, LSU-rRNA)(GO:0000467) |
| 0.3 | 8.8 | GO:2000300 | regulation of synaptic vesicle exocytosis(GO:2000300) |
| 0.3 | 5.4 | GO:0043248 | proteasome assembly(GO:0043248) |
| 0.3 | 6.3 | GO:0031581 | hemidesmosome assembly(GO:0031581) |
| 0.3 | 1.0 | GO:0097026 | dendritic cell dendrite assembly(GO:0097026) |
| 0.3 | 0.9 | GO:0042357 | thiamine diphosphate metabolic process(GO:0042357) |
| 0.3 | 2.5 | GO:0007021 | tubulin complex assembly(GO:0007021) |
| 0.3 | 0.9 | GO:0036500 | ATF6-mediated unfolded protein response(GO:0036500) |
| 0.3 | 6.4 | GO:0050774 | negative regulation of dendrite morphogenesis(GO:0050774) |
| 0.3 | 1.2 | GO:0038110 | response to interleukin-3(GO:0036015) cellular response to interleukin-3(GO:0036016) interleukin-2-mediated signaling pathway(GO:0038110) |
| 0.3 | 1.5 | GO:0006564 | L-serine biosynthetic process(GO:0006564) |
| 0.3 | 3.3 | GO:0060211 | regulation of nuclear-transcribed mRNA poly(A) tail shortening(GO:0060211) positive regulation of nuclear-transcribed mRNA poly(A) tail shortening(GO:0060213) |
| 0.3 | 1.5 | GO:0098532 | histone H3-K27 trimethylation(GO:0098532) |
| 0.3 | 1.2 | GO:0000389 | mRNA 3'-splice site recognition(GO:0000389) |
| 0.3 | 7.0 | GO:0060765 | regulation of androgen receptor signaling pathway(GO:0060765) |
| 0.3 | 3.2 | GO:0051988 | regulation of attachment of spindle microtubules to kinetochore(GO:0051988) |
| 0.3 | 0.8 | GO:0036118 | hyaluranon cable assembly(GO:0036118) regulation of hyaluranon cable assembly(GO:1900104) positive regulation of hyaluranon cable assembly(GO:1900106) |
| 0.3 | 1.5 | GO:0031086 | nuclear-transcribed mRNA catabolic process, deadenylation-independent decay(GO:0031086) deadenylation-independent decapping of nuclear-transcribed mRNA(GO:0031087) |
| 0.2 | 0.7 | GO:0035928 | mitochondrial mRNA catabolic process(GO:0000958) positive regulation of mitochondrial RNA catabolic process(GO:0000962) rRNA import into mitochondrion(GO:0035928) polyadenylation-dependent RNA catabolic process(GO:0043633) |
| 0.2 | 2.0 | GO:1900264 | regulation of DNA-directed DNA polymerase activity(GO:1900262) positive regulation of DNA-directed DNA polymerase activity(GO:1900264) |
| 0.2 | 1.4 | GO:0032060 | bleb assembly(GO:0032060) |
| 0.2 | 1.6 | GO:0097264 | self proteolysis(GO:0097264) |
| 0.2 | 1.1 | GO:0000290 | deadenylation-dependent decapping of nuclear-transcribed mRNA(GO:0000290) |
| 0.2 | 2.0 | GO:0033234 | negative regulation of protein sumoylation(GO:0033234) |
| 0.2 | 3.5 | GO:0032288 | myelin assembly(GO:0032288) |
| 0.2 | 0.8 | GO:0042985 | negative regulation of amyloid precursor protein biosynthetic process(GO:0042985) |
| 0.2 | 4.4 | GO:0016048 | detection of temperature stimulus(GO:0016048) |
| 0.2 | 5.1 | GO:0045746 | negative regulation of Notch signaling pathway(GO:0045746) |
| 0.2 | 9.9 | GO:0034605 | cellular response to heat(GO:0034605) |
| 0.2 | 2.3 | GO:0042048 | olfactory behavior(GO:0042048) |
| 0.2 | 0.4 | GO:0045425 | positive regulation of interleukin-3 production(GO:0032752) interleukin-3 biosynthetic process(GO:0042223) regulation of interleukin-3 biosynthetic process(GO:0045399) positive regulation of interleukin-3 biosynthetic process(GO:0045401) positive regulation of granulocyte macrophage colony-stimulating factor biosynthetic process(GO:0045425) |
| 0.2 | 2.3 | GO:0033603 | positive regulation of dopamine secretion(GO:0033603) |
| 0.2 | 3.3 | GO:0007064 | mitotic sister chromatid cohesion(GO:0007064) |
| 0.2 | 1.9 | GO:0061302 | smooth muscle cell-matrix adhesion(GO:0061302) |
| 0.2 | 1.5 | GO:0010457 | centriole-centriole cohesion(GO:0010457) |
| 0.2 | 2.4 | GO:2001275 | positive regulation of glucose import in response to insulin stimulus(GO:2001275) |
| 0.2 | 2.6 | GO:0032674 | regulation of interleukin-5 production(GO:0032674) |
| 0.2 | 4.1 | GO:0043044 | ATP-dependent chromatin remodeling(GO:0043044) |
| 0.2 | 12.5 | GO:0006342 | chromatin silencing(GO:0006342) |
| 0.2 | 6.1 | GO:0048488 | synaptic vesicle endocytosis(GO:0048488) |
| 0.2 | 0.5 | GO:1904618 | transitional stage B cell differentiation(GO:0002332) transitional one stage B cell differentiation(GO:0002333) glomerular visceral epithelial cell apoptotic process(GO:1903210) regulation of actin filament binding(GO:1904529) positive regulation of actin filament binding(GO:1904531) regulation of actin binding(GO:1904616) positive regulation of actin binding(GO:1904618) activation of protein kinase C activity(GO:1990051) |
| 0.2 | 9.3 | GO:0050885 | neuromuscular process controlling balance(GO:0050885) |
| 0.1 | 2.8 | GO:0030502 | negative regulation of bone mineralization(GO:0030502) |
| 0.1 | 7.1 | GO:0038083 | peptidyl-tyrosine autophosphorylation(GO:0038083) |
| 0.1 | 2.3 | GO:0071044 | histone mRNA catabolic process(GO:0071044) |
| 0.1 | 3.1 | GO:0060285 | cilium or flagellum-dependent cell motility(GO:0001539) cilium-dependent cell motility(GO:0060285) |
| 0.1 | 5.6 | GO:0043268 | negative regulation of G2/M transition of mitotic cell cycle(GO:0010972) positive regulation of potassium ion transport(GO:0043268) |
| 0.1 | 1.4 | GO:0045059 | positive thymic T cell selection(GO:0045059) |
| 0.1 | 4.4 | GO:0071158 | positive regulation of cell cycle arrest(GO:0071158) |
| 0.1 | 3.6 | GO:0008053 | mitochondrial fusion(GO:0008053) |
| 0.1 | 1.9 | GO:0010880 | regulation of release of sequestered calcium ion into cytosol by sarcoplasmic reticulum(GO:0010880) |
| 0.1 | 1.2 | GO:0071493 | cellular response to UV-B(GO:0071493) response to phorbol 13-acetate 12-myristate(GO:1904627) cellular response to phorbol 13-acetate 12-myristate(GO:1904628) |
| 0.1 | 23.2 | GO:0007519 | skeletal muscle tissue development(GO:0007519) |
| 0.1 | 1.6 | GO:0007638 | mechanosensory behavior(GO:0007638) |
| 0.1 | 2.0 | GO:0051457 | maintenance of protein location in nucleus(GO:0051457) |
| 0.1 | 3.1 | GO:0035025 | positive regulation of Rho protein signal transduction(GO:0035025) |
| 0.1 | 1.5 | GO:0010172 | embryonic body morphogenesis(GO:0010172) |
| 0.1 | 4.8 | GO:1901379 | regulation of potassium ion transmembrane transport(GO:1901379) |
| 0.1 | 3.3 | GO:0000184 | nuclear-transcribed mRNA catabolic process, nonsense-mediated decay(GO:0000184) |
| 0.1 | 1.5 | GO:0022027 | interkinetic nuclear migration(GO:0022027) |
| 0.1 | 1.3 | GO:0060628 | regulation of ER to Golgi vesicle-mediated transport(GO:0060628) |
| 0.1 | 1.6 | GO:0006517 | protein deglycosylation(GO:0006517) |
| 0.1 | 1.7 | GO:0072673 | lamellipodium morphogenesis(GO:0072673) |
| 0.1 | 1.0 | GO:0010579 | regulation of adenylate cyclase activity involved in G-protein coupled receptor signaling pathway(GO:0010578) positive regulation of adenylate cyclase activity involved in G-protein coupled receptor signaling pathway(GO:0010579) |
| 0.1 | 7.2 | GO:2001022 | positive regulation of response to DNA damage stimulus(GO:2001022) |
| 0.1 | 9.7 | GO:0030010 | establishment of cell polarity(GO:0030010) |
| 0.1 | 1.0 | GO:0097435 | fibril organization(GO:0097435) |
| 0.1 | 3.9 | GO:0010501 | RNA secondary structure unwinding(GO:0010501) |
| 0.1 | 0.2 | GO:0060327 | cytoplasmic actin-based contraction involved in cell motility(GO:0060327) |
| 0.1 | 0.7 | GO:0071625 | vocalization behavior(GO:0071625) |
| 0.1 | 0.4 | GO:0034227 | tRNA thio-modification(GO:0034227) |
| 0.1 | 10.0 | GO:0007411 | axon guidance(GO:0007411) |
| 0.1 | 0.4 | GO:0071542 | dopaminergic neuron differentiation(GO:0071542) |
| 0.1 | 3.1 | GO:0006383 | transcription from RNA polymerase III promoter(GO:0006383) |
| 0.1 | 4.2 | GO:0031338 | regulation of vesicle fusion(GO:0031338) |
| 0.1 | 4.7 | GO:0008344 | adult locomotory behavior(GO:0008344) |
| 0.1 | 3.7 | GO:0048278 | vesicle docking(GO:0048278) |
| 0.1 | 1.1 | GO:0030521 | androgen receptor signaling pathway(GO:0030521) |
| 0.1 | 2.2 | GO:0006506 | GPI anchor biosynthetic process(GO:0006506) |
| 0.1 | 8.6 | GO:0090068 | positive regulation of cell cycle process(GO:0090068) |
| 0.1 | 4.7 | GO:0030216 | keratinocyte differentiation(GO:0030216) |
| 0.1 | 1.2 | GO:0045116 | protein neddylation(GO:0045116) |
| 0.1 | 2.0 | GO:0031122 | cytoplasmic microtubule organization(GO:0031122) |
| 0.1 | 5.0 | GO:0018022 | peptidyl-lysine methylation(GO:0018022) |
| 0.1 | 2.1 | GO:0061178 | regulation of insulin secretion involved in cellular response to glucose stimulus(GO:0061178) |
| 0.1 | 0.7 | GO:0042347 | negative regulation of NF-kappaB import into nucleus(GO:0042347) |
| 0.1 | 6.4 | GO:0042787 | protein ubiquitination involved in ubiquitin-dependent protein catabolic process(GO:0042787) |
| 0.0 | 0.3 | GO:0007379 | segment specification(GO:0007379) |
| 0.0 | 0.1 | GO:0038001 | paracrine signaling(GO:0038001) |
| 0.0 | 0.7 | GO:1901099 | negative regulation of signal transduction in absence of ligand(GO:1901099) negative regulation of extrinsic apoptotic signaling pathway in absence of ligand(GO:2001240) |
| 0.0 | 1.3 | GO:0006360 | transcription from RNA polymerase I promoter(GO:0006360) |
| 0.0 | 2.5 | GO:0000070 | mitotic sister chromatid segregation(GO:0000070) |
| 0.0 | 1.7 | GO:0090263 | positive regulation of canonical Wnt signaling pathway(GO:0090263) |
| 0.0 | 1.6 | GO:0032436 | positive regulation of proteasomal ubiquitin-dependent protein catabolic process(GO:0032436) |
| 0.0 | 3.3 | GO:0019722 | calcium-mediated signaling(GO:0019722) |
| 0.0 | 2.8 | GO:0030183 | B cell differentiation(GO:0030183) |
| 0.0 | 0.8 | GO:0000186 | activation of MAPKK activity(GO:0000186) |
| 0.0 | 1.3 | GO:0006305 | DNA alkylation(GO:0006305) DNA methylation(GO:0006306) |
| 0.0 | 3.0 | GO:0007409 | axonogenesis(GO:0007409) |
| 0.0 | 0.9 | GO:0033119 | negative regulation of RNA splicing(GO:0033119) |
| 0.0 | 0.6 | GO:1902042 | negative regulation of extrinsic apoptotic signaling pathway via death domain receptors(GO:1902042) |
| 0.0 | 1.6 | GO:2001243 | negative regulation of intrinsic apoptotic signaling pathway(GO:2001243) |
| 0.0 | 1.2 | GO:0042100 | B cell proliferation(GO:0042100) |
| 0.0 | 1.1 | GO:1900181 | negative regulation of protein localization to nucleus(GO:1900181) |
| 0.0 | 1.1 | GO:0035690 | cellular response to drug(GO:0035690) |
| 0.0 | 0.6 | GO:0051930 | regulation of sensory perception of pain(GO:0051930) regulation of sensory perception(GO:0051931) |
| 0.0 | 0.8 | GO:0000387 | spliceosomal snRNP assembly(GO:0000387) |
| 0.0 | 2.1 | GO:0046330 | positive regulation of JNK cascade(GO:0046330) |
| 0.0 | 1.9 | GO:0006888 | ER to Golgi vesicle-mediated transport(GO:0006888) |
| 0.0 | 0.9 | GO:0048041 | cell-substrate adherens junction assembly(GO:0007045) focal adhesion assembly(GO:0048041) |
| 0.0 | 1.2 | GO:0010811 | positive regulation of cell-substrate adhesion(GO:0010811) |
| 0.0 | 1.5 | GO:0000724 | double-strand break repair via homologous recombination(GO:0000724) recombinational repair(GO:0000725) |
| 0.0 | 7.7 | GO:0043547 | positive regulation of GTPase activity(GO:0043547) |
| 0.0 | 0.9 | GO:0006367 | transcription initiation from RNA polymerase II promoter(GO:0006367) |
| 0.0 | 0.4 | GO:0001658 | branching involved in ureteric bud morphogenesis(GO:0001658) |
| 0.0 | 0.6 | GO:0042733 | embryonic digit morphogenesis(GO:0042733) |
| 0.0 | 2.2 | GO:0010976 | positive regulation of neuron projection development(GO:0010976) |
| 0.0 | 0.7 | GO:0030901 | midbrain development(GO:0030901) |
| 0.0 | 0.1 | GO:0090083 | regulation of inclusion body assembly(GO:0090083) |
Gene overrepresentation in cellular component category:
| Log-likelihood per target | Total log-likelihood | Term | Description |
|---|---|---|---|
| 7.1 | 56.7 | GO:0032584 | growth cone membrane(GO:0032584) |
| 6.3 | 38.0 | GO:0032280 | symmetric synapse(GO:0032280) |
| 5.6 | 50.0 | GO:0097442 | CA3 pyramidal cell dendrite(GO:0097442) |
| 4.7 | 23.5 | GO:1990769 | proximal neuron projection(GO:1990769) |
| 3.8 | 11.4 | GO:0033186 | CAF-1 complex(GO:0033186) |
| 3.5 | 10.5 | GO:0014701 | junctional sarcoplasmic reticulum membrane(GO:0014701) |
| 3.4 | 10.2 | GO:0060187 | cell pole(GO:0060187) |
| 2.6 | 15.5 | GO:0033093 | Weibel-Palade body(GO:0033093) |
| 2.5 | 17.4 | GO:0030981 | cortical microtubule cytoskeleton(GO:0030981) |
| 2.3 | 7.0 | GO:0005592 | collagen type XI trimer(GO:0005592) |
| 2.0 | 12.2 | GO:0016012 | sarcoglycan complex(GO:0016012) |
| 2.0 | 29.3 | GO:0031045 | dense core granule(GO:0031045) |
| 1.9 | 5.6 | GO:1990826 | nucleoplasmic periphery of the nuclear pore complex(GO:1990826) |
| 1.5 | 30.5 | GO:0001518 | voltage-gated sodium channel complex(GO:0001518) |
| 1.3 | 9.1 | GO:0090543 | Flemming body(GO:0090543) |
| 1.1 | 3.4 | GO:1990032 | parallel fiber(GO:1990032) |
| 1.1 | 6.7 | GO:0005955 | calcineurin complex(GO:0005955) |
| 1.1 | 5.4 | GO:0033588 | Elongator holoenzyme complex(GO:0033588) |
| 1.0 | 14.0 | GO:0070852 | cell body fiber(GO:0070852) |
| 1.0 | 3.0 | GO:0070826 | paraferritin complex(GO:0070826) |
| 1.0 | 2.9 | GO:0005943 | phosphatidylinositol 3-kinase complex, class IA(GO:0005943) |
| 1.0 | 5.8 | GO:0005608 | laminin-3 complex(GO:0005608) |
| 1.0 | 4.8 | GO:0072534 | perineuronal net(GO:0072534) |
| 0.9 | 6.5 | GO:0071438 | invadopodium membrane(GO:0071438) |
| 0.9 | 7.0 | GO:0044305 | calyx of Held(GO:0044305) |
| 0.8 | 6.9 | GO:0005826 | actomyosin contractile ring(GO:0005826) |
| 0.8 | 75.9 | GO:0042734 | presynaptic membrane(GO:0042734) |
| 0.8 | 13.7 | GO:0043194 | axon initial segment(GO:0043194) |
| 0.7 | 29.2 | GO:0032809 | neuronal cell body membrane(GO:0032809) |
| 0.7 | 3.0 | GO:1990005 | granular vesicle(GO:1990005) |
| 0.7 | 72.4 | GO:0000786 | nucleosome(GO:0000786) |
| 0.7 | 17.6 | GO:0016327 | apicolateral plasma membrane(GO:0016327) |
| 0.6 | 1.9 | GO:0014801 | longitudinal sarcoplasmic reticulum(GO:0014801) |
| 0.6 | 6.7 | GO:0001527 | microfibril(GO:0001527) fibril(GO:0043205) |
| 0.6 | 11.7 | GO:0030673 | axolemma(GO:0030673) |
| 0.6 | 2.9 | GO:0071256 | Sec61 translocon complex(GO:0005784) translocon complex(GO:0071256) |
| 0.6 | 6.4 | GO:0043083 | synaptic cleft(GO:0043083) |
| 0.6 | 29.9 | GO:0008328 | ionotropic glutamate receptor complex(GO:0008328) neurotransmitter receptor complex(GO:0098878) |
| 0.5 | 5.5 | GO:0016010 | dystrophin-associated glycoprotein complex(GO:0016010) glycoprotein complex(GO:0090665) |
| 0.5 | 2.3 | GO:0000120 | RNA polymerase I transcription factor complex(GO:0000120) |
| 0.5 | 6.4 | GO:0031618 | nuclear pericentric heterochromatin(GO:0031618) |
| 0.5 | 14.9 | GO:0043034 | costamere(GO:0043034) |
| 0.4 | 2.2 | GO:0001674 | female germ cell nucleus(GO:0001674) |
| 0.4 | 3.1 | GO:0042406 | extrinsic component of endoplasmic reticulum membrane(GO:0042406) |
| 0.4 | 5.1 | GO:0030008 | TRAPP complex(GO:0030008) |
| 0.4 | 5.2 | GO:0031258 | lamellipodium membrane(GO:0031258) |
| 0.4 | 4.7 | GO:0042589 | zymogen granule membrane(GO:0042589) |
| 0.4 | 2.3 | GO:0035189 | Rb-E2F complex(GO:0035189) |
| 0.4 | 1.1 | GO:0033165 | interphotoreceptor matrix(GO:0033165) |
| 0.3 | 6.5 | GO:0000930 | gamma-tubulin complex(GO:0000930) |
| 0.3 | 33.1 | GO:0016605 | PML body(GO:0016605) |
| 0.3 | 2.0 | GO:0005663 | DNA replication factor C complex(GO:0005663) |
| 0.3 | 8.8 | GO:0048786 | presynaptic active zone(GO:0048786) |
| 0.3 | 14.0 | GO:0032153 | cell division site(GO:0032153) cell division site part(GO:0032155) |
| 0.3 | 2.5 | GO:0016272 | prefoldin complex(GO:0016272) |
| 0.3 | 6.3 | GO:0043198 | dendritic shaft(GO:0043198) |
| 0.3 | 3.5 | GO:0032593 | insulin-responsive compartment(GO:0032593) |
| 0.3 | 2.4 | GO:0071204 | histone pre-mRNA 3'end processing complex(GO:0071204) |
| 0.3 | 2.9 | GO:0032541 | cortical endoplasmic reticulum(GO:0032541) |
| 0.3 | 0.8 | GO:0036117 | hyaluranon cable(GO:0036117) |
| 0.2 | 2.2 | GO:0000506 | glycosylphosphatidylinositol-N-acetylglucosaminyltransferase (GPI-GnT) complex(GO:0000506) |
| 0.2 | 8.4 | GO:0005790 | smooth endoplasmic reticulum(GO:0005790) |
| 0.2 | 0.7 | GO:0045025 | mitochondrial degradosome(GO:0045025) |
| 0.2 | 1.2 | GO:0097452 | GAIT complex(GO:0097452) |
| 0.2 | 9.2 | GO:0009925 | basal plasma membrane(GO:0009925) |
| 0.2 | 3.7 | GO:0005665 | DNA-directed RNA polymerase II, core complex(GO:0005665) |
| 0.2 | 9.6 | GO:0005834 | heterotrimeric G-protein complex(GO:0005834) |
| 0.2 | 3.9 | GO:0042101 | T cell receptor complex(GO:0042101) |
| 0.2 | 57.9 | GO:0009897 | external side of plasma membrane(GO:0009897) |
| 0.2 | 8.0 | GO:0002102 | podosome(GO:0002102) |
| 0.2 | 1.7 | GO:0031209 | SCAR complex(GO:0031209) |
| 0.2 | 3.1 | GO:0071565 | nBAF complex(GO:0071565) |
| 0.2 | 24.6 | GO:0090575 | RNA polymerase II transcription factor complex(GO:0090575) |
| 0.2 | 138.9 | GO:0043025 | neuronal cell body(GO:0043025) |
| 0.2 | 3.1 | GO:0005666 | DNA-directed RNA polymerase III complex(GO:0005666) |
| 0.2 | 2.9 | GO:0005847 | mRNA cleavage and polyadenylation specificity factor complex(GO:0005847) |
| 0.2 | 2.3 | GO:0005892 | acetylcholine-gated channel complex(GO:0005892) |
| 0.2 | 8.8 | GO:0030175 | filopodium(GO:0030175) |
| 0.2 | 0.5 | GO:0030056 | hemidesmosome(GO:0030056) |
| 0.2 | 6.7 | GO:0034704 | calcium channel complex(GO:0034704) |
| 0.2 | 12.5 | GO:0030427 | site of polarized growth(GO:0030427) |
| 0.2 | 11.0 | GO:0005791 | rough endoplasmic reticulum(GO:0005791) |
| 0.2 | 14.8 | GO:0016363 | nuclear matrix(GO:0016363) |
| 0.1 | 1.6 | GO:0000176 | nuclear exosome (RNase complex)(GO:0000176) |
| 0.1 | 3.3 | GO:0035145 | exon-exon junction complex(GO:0035145) |
| 0.1 | 1.5 | GO:0042555 | MCM complex(GO:0042555) |
| 0.1 | 7.5 | GO:0032587 | ruffle membrane(GO:0032587) |
| 0.1 | 8.7 | GO:0031225 | anchored component of membrane(GO:0031225) |
| 0.1 | 3.2 | GO:0034451 | centriolar satellite(GO:0034451) |
| 0.1 | 30.3 | GO:0005667 | transcription factor complex(GO:0005667) |
| 0.1 | 4.1 | GO:0032391 | photoreceptor connecting cilium(GO:0032391) |
| 0.1 | 1.5 | GO:0033180 | proton-transporting V-type ATPase, V1 domain(GO:0033180) |
| 0.1 | 8.3 | GO:0031234 | extrinsic component of cytoplasmic side of plasma membrane(GO:0031234) |
| 0.1 | 1.7 | GO:0035098 | ESC/E(Z) complex(GO:0035098) |
| 0.1 | 35.5 | GO:0005578 | proteinaceous extracellular matrix(GO:0005578) |
| 0.1 | 1.4 | GO:0005890 | sodium:potassium-exchanging ATPase complex(GO:0005890) |
| 0.1 | 1.3 | GO:0017119 | Golgi transport complex(GO:0017119) |
| 0.1 | 2.3 | GO:0008074 | guanylate cyclase complex, soluble(GO:0008074) |
| 0.1 | 4.5 | GO:0005905 | clathrin-coated pit(GO:0005905) |
| 0.1 | 8.8 | GO:0005814 | centriole(GO:0005814) |
| 0.1 | 1.6 | GO:0019013 | viral nucleocapsid(GO:0019013) |
| 0.1 | 11.5 | GO:0001650 | fibrillar center(GO:0001650) |
| 0.1 | 2.0 | GO:0097546 | ciliary base(GO:0097546) |
| 0.1 | 8.0 | GO:0030018 | Z disc(GO:0030018) |
| 0.1 | 7.8 | GO:0005903 | brush border(GO:0005903) |
| 0.1 | 26.9 | GO:0000785 | chromatin(GO:0000785) |
| 0.1 | 0.8 | GO:0032797 | SMN complex(GO:0032797) |
| 0.1 | 2.8 | GO:0016592 | mediator complex(GO:0016592) |
| 0.1 | 3.0 | GO:0045171 | intercellular bridge(GO:0045171) |
| 0.1 | 3.3 | GO:0030136 | clathrin-coated vesicle(GO:0030136) |
| 0.1 | 0.2 | GO:0008282 | ATP-sensitive potassium channel complex(GO:0008282) |
| 0.1 | 5.2 | GO:0000776 | kinetochore(GO:0000776) |
| 0.1 | 3.5 | GO:0019005 | SCF ubiquitin ligase complex(GO:0019005) |
| 0.1 | 6.1 | GO:0031012 | extracellular matrix(GO:0031012) |
| 0.0 | 2.6 | GO:0005758 | mitochondrial intermembrane space(GO:0005758) |
| 0.0 | 0.6 | GO:0031519 | PcG protein complex(GO:0031519) |
| 0.0 | 1.1 | GO:0001533 | cornified envelope(GO:0001533) |
| 0.0 | 8.2 | GO:0000151 | ubiquitin ligase complex(GO:0000151) |
| 0.0 | 1.4 | GO:0005881 | cytoplasmic microtubule(GO:0005881) |
| 0.0 | 4.6 | GO:0043235 | receptor complex(GO:0043235) |
| 0.0 | 1.0 | GO:0005581 | collagen trimer(GO:0005581) |
| 0.0 | 5.2 | GO:0098857 | membrane raft(GO:0045121) membrane microdomain(GO:0098857) |
| 0.0 | 9.5 | GO:0045202 | synapse(GO:0045202) |
| 0.0 | 4.1 | GO:0030424 | axon(GO:0030424) |
| 0.0 | 1.2 | GO:0030532 | small nuclear ribonucleoprotein complex(GO:0030532) |
| 0.0 | 2.2 | GO:0005741 | mitochondrial outer membrane(GO:0005741) |
| 0.0 | 0.5 | GO:0030686 | 90S preribosome(GO:0030686) |
| 0.0 | 9.1 | GO:0005730 | nucleolus(GO:0005730) |
| 0.0 | 3.7 | GO:0016604 | nuclear body(GO:0016604) |
| 0.0 | 0.6 | GO:0022625 | cytosolic large ribosomal subunit(GO:0022625) |
Gene overrepresentation in molecular function category:
| Log-likelihood per target | Total log-likelihood | Term | Description |
|---|---|---|---|
| 28.8 | 86.4 | GO:0071886 | 1-(4-iodo-2,5-dimethoxyphenyl)propan-2-amine binding(GO:0071886) |
| 12.3 | 49.2 | GO:0035727 | lysophosphatidic acid binding(GO:0035727) |
| 10.8 | 43.4 | GO:0001642 | group III metabotropic glutamate receptor activity(GO:0001642) |
| 6.3 | 38.0 | GO:0001515 | opioid peptide activity(GO:0001515) |
| 5.2 | 15.7 | GO:0005294 | neutral L-amino acid secondary active transmembrane transporter activity(GO:0005294) |
| 4.8 | 14.4 | GO:0071885 | N-terminal protein N-methyltransferase activity(GO:0071885) |
| 4.5 | 22.3 | GO:0005314 | high-affinity glutamate transmembrane transporter activity(GO:0005314) |
| 3.5 | 10.5 | GO:0004574 | oligo-1,6-glucosidase activity(GO:0004574) |
| 3.2 | 41.7 | GO:0030215 | semaphorin receptor binding(GO:0030215) |
| 2.6 | 13.0 | GO:0004105 | choline-phosphate cytidylyltransferase activity(GO:0004105) |
| 2.5 | 56.4 | GO:0002162 | dystroglycan binding(GO:0002162) |
| 2.2 | 6.6 | GO:0001087 | transcription factor activity, sequence-specific DNA binding, RNA polymerase recruiting(GO:0001011) transcription factor activity, TFIIB-class binding(GO:0001087) |
| 2.2 | 15.2 | GO:0005173 | stem cell factor receptor binding(GO:0005173) |
| 2.1 | 10.6 | GO:0005042 | netrin receptor activity(GO:0005042) |
| 1.9 | 9.4 | GO:0051864 | histone demethylase activity (H3-K36 specific)(GO:0051864) |
| 1.8 | 7.1 | GO:0070579 | methylcytosine dioxygenase activity(GO:0070579) |
| 1.8 | 10.6 | GO:0003840 | gamma-glutamyltransferase activity(GO:0003840) glutathione hydrolase activity(GO:0036374) |
| 1.7 | 6.7 | GO:0033192 | calcium-dependent protein serine/threonine phosphatase activity(GO:0004723) calmodulin-dependent protein phosphatase activity(GO:0033192) |
| 1.4 | 7.1 | GO:0046912 | transferase activity, transferring acyl groups, acyl groups converted into alkyl on transfer(GO:0046912) |
| 1.4 | 11.4 | GO:0070087 | chromo shadow domain binding(GO:0070087) |
| 1.4 | 7.0 | GO:0022841 | potassium ion leak channel activity(GO:0022841) |
| 1.4 | 7.0 | GO:0031802 | type 5 metabotropic glutamate receptor binding(GO:0031802) |
| 1.3 | 29.9 | GO:0005234 | extracellular-glutamate-gated ion channel activity(GO:0005234) |
| 1.3 | 6.5 | GO:0015252 | hydrogen ion channel activity(GO:0015252) |
| 1.3 | 20.6 | GO:0017017 | MAP kinase tyrosine/serine/threonine phosphatase activity(GO:0017017) |
| 1.2 | 6.0 | GO:0004614 | phosphoglucomutase activity(GO:0004614) |
| 1.2 | 10.5 | GO:0043495 | protein anchor(GO:0043495) |
| 1.1 | 10.1 | GO:0015643 | toxic substance binding(GO:0015643) |
| 1.1 | 29.9 | GO:0031402 | sodium ion binding(GO:0031402) |
| 1.0 | 28.1 | GO:0042056 | chemoattractant activity(GO:0042056) |
| 1.0 | 3.0 | GO:0030977 | taurine binding(GO:0030977) |
| 1.0 | 3.0 | GO:0015094 | cadmium ion transmembrane transporter activity(GO:0015086) lead ion transmembrane transporter activity(GO:0015094) nickel cation transmembrane transporter activity(GO:0015099) vanadium ion transmembrane transporter activity(GO:0015100) ferrous iron uptake transmembrane transporter activity(GO:0015639) chromium ion transmembrane transporter activity(GO:0070835) |
| 0.8 | 8.3 | GO:0022821 | potassium:proton antiporter activity(GO:0015386) potassium ion antiporter activity(GO:0022821) |
| 0.8 | 5.7 | GO:0043426 | MRF binding(GO:0043426) |
| 0.8 | 5.6 | GO:0033592 | RNA strand annealing activity(GO:0033592) |
| 0.8 | 2.3 | GO:0097363 | protein O-GlcNAc transferase activity(GO:0097363) |
| 0.8 | 2.3 | GO:0002134 | UTP binding(GO:0002134) pyrimidine ribonucleoside binding(GO:0032551) |
| 0.8 | 5.4 | GO:0061133 | endopeptidase activator activity(GO:0061133) |
| 0.7 | 9.7 | GO:0050321 | tau-protein kinase activity(GO:0050321) |
| 0.7 | 8.2 | GO:0030306 | ADP-ribosylation factor binding(GO:0030306) |
| 0.7 | 8.0 | GO:0008046 | axon guidance receptor activity(GO:0008046) |
| 0.7 | 9.2 | GO:0015250 | water channel activity(GO:0015250) |
| 0.6 | 27.7 | GO:0001102 | RNA polymerase II activating transcription factor binding(GO:0001102) |
| 0.6 | 7.5 | GO:0003841 | 1-acylglycerol-3-phosphate O-acyltransferase activity(GO:0003841) |
| 0.6 | 3.6 | GO:0031698 | beta-2 adrenergic receptor binding(GO:0031698) |
| 0.6 | 23.4 | GO:0071855 | neuropeptide receptor binding(GO:0071855) |
| 0.6 | 2.9 | GO:0052813 | phosphatidylinositol-4,5-bisphosphate 3-kinase activity(GO:0046934) phosphatidylinositol bisphosphate kinase activity(GO:0052813) |
| 0.6 | 9.1 | GO:0008568 | microtubule-severing ATPase activity(GO:0008568) |
| 0.6 | 3.4 | GO:0035662 | Toll-like receptor 4 binding(GO:0035662) vascular endothelial growth factor receptor 2 binding(GO:0043184) |
| 0.5 | 2.7 | GO:0001729 | ceramide kinase activity(GO:0001729) |
| 0.5 | 3.9 | GO:0044323 | retinoic acid-responsive element binding(GO:0044323) |
| 0.5 | 2.4 | GO:0046935 | 1-phosphatidylinositol-3-kinase regulator activity(GO:0046935) |
| 0.5 | 3.3 | GO:0016714 | oxidoreductase activity, acting on paired donors, with incorporation or reduction of molecular oxygen, reduced pteridine as one donor, and incorporation of one atom of oxygen(GO:0016714) |
| 0.5 | 1.9 | GO:0015184 | L-cystine transmembrane transporter activity(GO:0015184) |
| 0.5 | 6.3 | GO:0031748 | D1 dopamine receptor binding(GO:0031748) |
| 0.4 | 14.2 | GO:0019212 | phosphatase inhibitor activity(GO:0019212) |
| 0.4 | 6.5 | GO:0004115 | 3',5'-cyclic-AMP phosphodiesterase activity(GO:0004115) |
| 0.4 | 3.5 | GO:0016308 | 1-phosphatidylinositol-4-phosphate 5-kinase activity(GO:0016308) |
| 0.4 | 8.9 | GO:0004435 | phosphatidylinositol phospholipase C activity(GO:0004435) |
| 0.4 | 11.0 | GO:0005452 | inorganic anion exchanger activity(GO:0005452) |
| 0.4 | 9.6 | GO:0031683 | G-protein beta/gamma-subunit complex binding(GO:0031683) |
| 0.4 | 11.1 | GO:0005540 | hyaluronic acid binding(GO:0005540) |
| 0.4 | 10.3 | GO:0005385 | zinc ion transmembrane transporter activity(GO:0005385) |
| 0.4 | 1.2 | GO:0000386 | second spliceosomal transesterification activity(GO:0000386) |
| 0.4 | 4.2 | GO:0015187 | glycine transmembrane transporter activity(GO:0015187) |
| 0.4 | 2.3 | GO:0004568 | chitinase activity(GO:0004568) |
| 0.4 | 2.2 | GO:0017176 | phosphatidylinositol N-acetylglucosaminyltransferase activity(GO:0017176) |
| 0.4 | 4.0 | GO:0051378 | serotonin binding(GO:0051378) |
| 0.4 | 33.5 | GO:0001191 | transcriptional repressor activity, RNA polymerase II transcription factor binding(GO:0001191) |
| 0.4 | 57.5 | GO:0044325 | ion channel binding(GO:0044325) |
| 0.4 | 2.8 | GO:1990430 | extracellular matrix protein binding(GO:1990430) |
| 0.3 | 4.1 | GO:0032041 | histone deacetylase activity (H3-K14 specific)(GO:0031078) NAD-dependent histone deacetylase activity (H3-K14 specific)(GO:0032041) |
| 0.3 | 17.6 | GO:0035254 | glutamate receptor binding(GO:0035254) |
| 0.3 | 2.8 | GO:0005004 | GPI-linked ephrin receptor activity(GO:0005004) |
| 0.3 | 0.9 | GO:0015222 | serotonin transmembrane transporter activity(GO:0015222) |
| 0.3 | 7.1 | GO:0003785 | actin monomer binding(GO:0003785) |
| 0.3 | 1.9 | GO:0038062 | protein tyrosine kinase collagen receptor activity(GO:0038062) |
| 0.3 | 78.5 | GO:0030695 | GTPase regulator activity(GO:0030695) |
| 0.3 | 5.9 | GO:0043014 | alpha-tubulin binding(GO:0043014) |
| 0.2 | 1.2 | GO:0070052 | collagen V binding(GO:0070052) |
| 0.2 | 3.9 | GO:0005523 | tropomyosin binding(GO:0005523) |
| 0.2 | 1.2 | GO:0005131 | growth hormone receptor binding(GO:0005131) |
| 0.2 | 7.0 | GO:0050681 | androgen receptor binding(GO:0050681) |
| 0.2 | 1.7 | GO:0046976 | histone methyltransferase activity (H3-K27 specific)(GO:0046976) |
| 0.2 | 45.3 | GO:0042393 | histone binding(GO:0042393) |
| 0.2 | 15.5 | GO:0005518 | collagen binding(GO:0005518) |
| 0.2 | 2.3 | GO:0004653 | polypeptide N-acetylgalactosaminyltransferase activity(GO:0004653) |
| 0.2 | 7.6 | GO:0005109 | frizzled binding(GO:0005109) |
| 0.2 | 3.1 | GO:0001056 | RNA polymerase III activity(GO:0001056) |
| 0.2 | 1.6 | GO:0034987 | immunoglobulin receptor binding(GO:0034987) |
| 0.2 | 2.0 | GO:0033170 | DNA clamp loader activity(GO:0003689) protein-DNA loading ATPase activity(GO:0033170) |
| 0.2 | 7.2 | GO:0001158 | enhancer sequence-specific DNA binding(GO:0001158) |
| 0.2 | 0.8 | GO:0030622 | U4atac snRNA binding(GO:0030622) |
| 0.2 | 4.0 | GO:0043325 | phosphatidylinositol-3,4-bisphosphate binding(GO:0043325) |
| 0.2 | 2.5 | GO:0023026 | MHC class II protein complex binding(GO:0023026) |
| 0.2 | 1.9 | GO:0004983 | neuropeptide Y receptor activity(GO:0004983) |
| 0.2 | 1.1 | GO:0008061 | chitin binding(GO:0008061) |
| 0.2 | 0.8 | GO:0050501 | hyaluronan synthase activity(GO:0050501) |
| 0.2 | 7.4 | GO:0004715 | non-membrane spanning protein tyrosine kinase activity(GO:0004715) |
| 0.1 | 4.1 | GO:0031492 | nucleosomal DNA binding(GO:0031492) |
| 0.1 | 2.3 | GO:0042166 | acetylcholine-gated cation channel activity(GO:0022848) acetylcholine binding(GO:0042166) |
| 0.1 | 0.9 | GO:0070181 | small ribosomal subunit rRNA binding(GO:0070181) |
| 0.1 | 6.7 | GO:0016278 | lysine N-methyltransferase activity(GO:0016278) protein-lysine N-methyltransferase activity(GO:0016279) |
| 0.1 | 8.1 | GO:0000979 | RNA polymerase II core promoter sequence-specific DNA binding(GO:0000979) |
| 0.1 | 2.6 | GO:0051861 | glycolipid binding(GO:0051861) |
| 0.1 | 1.1 | GO:0000340 | RNA 7-methylguanosine cap binding(GO:0000340) |
| 0.1 | 2.1 | GO:0005521 | lamin binding(GO:0005521) |
| 0.1 | 2.4 | GO:0004745 | retinol dehydrogenase activity(GO:0004745) |
| 0.1 | 2.7 | GO:0003899 | DNA-directed RNA polymerase activity(GO:0003899) |
| 0.1 | 1.8 | GO:0001594 | trace-amine receptor activity(GO:0001594) |
| 0.1 | 0.7 | GO:0034046 | poly(G) binding(GO:0034046) |
| 0.1 | 0.9 | GO:0017162 | aryl hydrocarbon receptor binding(GO:0017162) |
| 0.1 | 2.5 | GO:0043015 | gamma-tubulin binding(GO:0043015) |
| 0.1 | 0.4 | GO:0019863 | IgE binding(GO:0019863) |
| 0.1 | 9.8 | GO:0030165 | PDZ domain binding(GO:0030165) |
| 0.1 | 11.0 | GO:0004222 | metalloendopeptidase activity(GO:0004222) |
| 0.1 | 2.1 | GO:0070530 | K63-linked polyubiquitin binding(GO:0070530) |
| 0.1 | 1.8 | GO:0005229 | intracellular calcium activated chloride channel activity(GO:0005229) |
| 0.1 | 0.8 | GO:0043522 | leucine zipper domain binding(GO:0043522) |
| 0.1 | 1.7 | GO:0030296 | protein tyrosine kinase activator activity(GO:0030296) |
| 0.1 | 0.9 | GO:0004708 | MAP kinase kinase activity(GO:0004708) |
| 0.1 | 1.9 | GO:0015459 | potassium channel regulator activity(GO:0015459) |
| 0.1 | 3.2 | GO:0005164 | tumor necrosis factor receptor binding(GO:0005164) |
| 0.1 | 3.1 | GO:0004177 | aminopeptidase activity(GO:0004177) |
| 0.1 | 2.4 | GO:0036002 | pre-mRNA binding(GO:0036002) |
| 0.1 | 17.9 | GO:0001077 | transcriptional activator activity, RNA polymerase II core promoter proximal region sequence-specific binding(GO:0001077) |
| 0.1 | 16.8 | GO:0061630 | ubiquitin protein ligase activity(GO:0061630) |
| 0.1 | 27.7 | GO:0046982 | protein heterodimerization activity(GO:0046982) |
| 0.1 | 18.2 | GO:0003712 | transcription cofactor activity(GO:0003712) |
| 0.1 | 12.2 | GO:0016758 | transferase activity, transferring hexosyl groups(GO:0016758) |
| 0.1 | 3.5 | GO:0031490 | chromatin DNA binding(GO:0031490) |
| 0.1 | 1.1 | GO:0098641 | cadherin binding involved in cell-cell adhesion(GO:0098641) |
| 0.1 | 3.6 | GO:0004869 | cysteine-type endopeptidase inhibitor activity(GO:0004869) |
| 0.1 | 15.4 | GO:0031625 | ubiquitin protein ligase binding(GO:0031625) |
| 0.1 | 7.6 | GO:0004386 | helicase activity(GO:0004386) |
| 0.1 | 1.0 | GO:0008329 | signaling pattern recognition receptor activity(GO:0008329) pattern recognition receptor activity(GO:0038187) |
| 0.1 | 7.1 | GO:0008528 | G-protein coupled peptide receptor activity(GO:0008528) |
| 0.1 | 2.2 | GO:0015036 | disulfide oxidoreductase activity(GO:0015036) |
| 0.0 | 4.4 | GO:0008565 | protein transporter activity(GO:0008565) |
| 0.0 | 4.7 | GO:0016503 | pheromone receptor activity(GO:0016503) |
| 0.0 | 1.2 | GO:0070003 | threonine-type endopeptidase activity(GO:0004298) threonine-type peptidase activity(GO:0070003) |
| 0.0 | 7.1 | GO:0004842 | ubiquitin-protein transferase activity(GO:0004842) |
| 0.0 | 0.6 | GO:0005248 | voltage-gated sodium channel activity(GO:0005248) voltage-gated ion channel activity involved in regulation of postsynaptic membrane potential(GO:1905030) |
| 0.0 | 1.6 | GO:0004532 | exoribonuclease activity(GO:0004532) |
| 0.0 | 0.9 | GO:0004712 | protein serine/threonine/tyrosine kinase activity(GO:0004712) |
| 0.0 | 1.7 | GO:0005201 | extracellular matrix structural constituent(GO:0005201) |
| 0.0 | 0.8 | GO:0004709 | MAP kinase kinase kinase activity(GO:0004709) |
| 0.0 | 1.8 | GO:0004812 | aminoacyl-tRNA ligase activity(GO:0004812) ligase activity, forming carbon-oxygen bonds(GO:0016875) ligase activity, forming aminoacyl-tRNA and related compounds(GO:0016876) |
| 0.0 | 23.0 | GO:0008270 | zinc ion binding(GO:0008270) |
| 0.0 | 0.2 | GO:0008327 | methyl-CpG binding(GO:0008327) |
Gene overrepresentation in curated gene sets: canonical pathways category:
| Log-likelihood per target | Total log-likelihood | Term | Description |
|---|---|---|---|
| 1.5 | 75.0 | NABA COLLAGENS | Genes encoding collagen proteins |
| 1.0 | 49.0 | PID NCADHERIN PATHWAY | N-cadherin signaling events |
| 0.8 | 32.0 | PID P38 ALPHA BETA PATHWAY | Regulation of p38-alpha and p38-beta |
| 0.7 | 14.1 | PID LPA4 PATHWAY | LPA4-mediated signaling events |
| 0.6 | 38.9 | PID LKB1 PATHWAY | LKB1 signaling events |
| 0.6 | 6.5 | PID TCR JNK PATHWAY | JNK signaling in the CD4+ TCR pathway |
| 0.6 | 20.4 | PID RAS PATHWAY | Regulation of Ras family activation |
| 0.5 | 6.6 | ST INTERFERON GAMMA PATHWAY | Interferon gamma pathway. |
| 0.5 | 10.6 | PID NETRIN PATHWAY | Netrin-mediated signaling events |
| 0.4 | 11.7 | PID MAPK TRK PATHWAY | Trk receptor signaling mediated by the MAPK pathway |
| 0.4 | 9.9 | PID TCR CALCIUM PATHWAY | Calcium signaling in the CD4+ TCR pathway |
| 0.4 | 29.2 | PID AP1 PATHWAY | AP-1 transcription factor network |
| 0.4 | 2.6 | PID IL5 PATHWAY | IL5-mediated signaling events |
| 0.4 | 5.1 | SA PTEN PATHWAY | PTEN is a tumor suppressor that dephosphorylates the lipid messenger phosphatidylinositol triphosphate. |
| 0.4 | 7.2 | PID HEDGEHOG 2PATHWAY | Signaling events mediated by the Hedgehog family |
| 0.3 | 5.8 | PID INTEGRIN4 PATHWAY | Alpha6 beta4 integrin-ligand interactions |
| 0.3 | 8.6 | PID INTEGRIN A4B1 PATHWAY | Alpha4 beta1 integrin signaling events |
| 0.3 | 17.5 | PID TRKR PATHWAY | Neurotrophic factor-mediated Trk receptor signaling |
| 0.3 | 11.6 | PID KIT PATHWAY | Signaling events mediated by Stem cell factor receptor (c-Kit) |
| 0.3 | 10.5 | PID FAK PATHWAY | Signaling events mediated by focal adhesion kinase |
| 0.3 | 8.9 | ST G ALPHA I PATHWAY | G alpha i Pathway |
| 0.3 | 9.1 | PID FOXM1 PATHWAY | FOXM1 transcription factor network |
| 0.3 | 2.4 | PID ERBB1 RECEPTOR PROXIMAL PATHWAY | EGF receptor (ErbB1) signaling pathway |
| 0.3 | 14.1 | PID P75 NTR PATHWAY | p75(NTR)-mediated signaling |
| 0.3 | 3.0 | PID AR NONGENOMIC PATHWAY | Nongenotropic Androgen signaling |
| 0.3 | 11.1 | NABA PROTEOGLYCANS | Genes encoding proteoglycans |
| 0.2 | 6.4 | PID NFAT TFPATHWAY | Calcineurin-regulated NFAT-dependent transcription in lymphocytes |
| 0.2 | 1.2 | SA REG CASCADE OF CYCLIN EXPR | Expression of cyclins regulates progression through the cell cycle by activating cyclin-dependent kinases. |
| 0.2 | 15.1 | PID E2F PATHWAY | E2F transcription factor network |
| 0.2 | 1.6 | PID P38 MK2 PATHWAY | p38 signaling mediated by MAPKAP kinases |
| 0.2 | 9.1 | PID CXCR4 PATHWAY | CXCR4-mediated signaling events |
| 0.2 | 6.4 | PID RHOA PATHWAY | RhoA signaling pathway |
| 0.2 | 11.1 | PID AR PATHWAY | Coregulation of Androgen receptor activity |
| 0.2 | 2.6 | SA MMP CYTOKINE CONNECTION | Cytokines can induce activation of matrix metalloproteinases, which degrade extracellular matrix. |
| 0.2 | 2.8 | PID EPHA FWDPATHWAY | EPHA forward signaling |
| 0.2 | 3.0 | PID HIF2PATHWAY | HIF-2-alpha transcription factor network |
| 0.2 | 9.8 | PID PDGFRB PATHWAY | PDGFR-beta signaling pathway |
| 0.2 | 4.1 | PID HDAC CLASSII PATHWAY | Signaling events mediated by HDAC Class II |
| 0.2 | 1.4 | PID RAC1 PATHWAY | RAC1 signaling pathway |
| 0.1 | 4.7 | PID RAC1 REG PATHWAY | Regulation of RAC1 activity |
| 0.1 | 3.4 | ST WNT BETA CATENIN PATHWAY | Wnt/beta-catenin Pathway |
| 0.1 | 5.7 | PID PLK1 PATHWAY | PLK1 signaling events |
| 0.1 | 1.9 | PID AURORA A PATHWAY | Aurora A signaling |
| 0.1 | 1.6 | ST PHOSPHOINOSITIDE 3 KINASE PATHWAY | PI3K Pathway |
| 0.1 | 5.7 | PID HIF1 TFPATHWAY | HIF-1-alpha transcription factor network |
| 0.1 | 4.1 | PID HDAC CLASSI PATHWAY | Signaling events mediated by HDAC Class I |
| 0.1 | 1.2 | PID ERB GENOMIC PATHWAY | Validated nuclear estrogen receptor beta network |
| 0.1 | 2.6 | PID ARF6 TRAFFICKING PATHWAY | Arf6 trafficking events |
| 0.1 | 2.7 | PID HES HEY PATHWAY | Notch-mediated HES/HEY network |
| 0.1 | 2.0 | PID ATR PATHWAY | ATR signaling pathway |
| 0.1 | 1.3 | PID INSULIN GLUCOSE PATHWAY | Insulin-mediated glucose transport |
| 0.1 | 0.8 | PID RB 1PATHWAY | Regulation of retinoblastoma protein |
| 0.1 | 1.1 | PID ILK PATHWAY | Integrin-linked kinase signaling |
| 0.1 | 7.9 | NABA ECM AFFILIATED | Genes encoding proteins affiliated structurally or functionally to extracellular matrix proteins |
| 0.0 | 1.0 | PID NOTCH PATHWAY | Notch signaling pathway |
| 0.0 | 0.4 | PID FCER1 PATHWAY | Fc-epsilon receptor I signaling in mast cells |
| 0.0 | 0.2 | PID WNT NONCANONICAL PATHWAY | Noncanonical Wnt signaling pathway |
| 0.0 | 1.2 | WNT SIGNALING | Genes related to Wnt-mediated signal transduction |
| 0.0 | 0.4 | PID BETA CATENIN NUC PATHWAY | Regulation of nuclear beta catenin signaling and target gene transcription |
Gene overrepresentation in curated gene sets: REACTOME pathways category:
| Log-likelihood per target | Total log-likelihood | Term | Description |
|---|---|---|---|
| 6.2 | 86.4 | REACTOME SEROTONIN RECEPTORS | Genes involved in Serotonin receptors |
| 2.7 | 76.0 | REACTOME ADHERENS JUNCTIONS INTERACTIONS | Genes involved in Adherens junctions interactions |
| 1.9 | 42.5 | REACTOME CLASS C 3 METABOTROPIC GLUTAMATE PHEROMONE RECEPTORS | Genes involved in Class C/3 (Metabotropic glutamate/pheromone receptors) |
| 1.8 | 11.0 | REACTOME OLFACTORY SIGNALING PATHWAY | Genes involved in Olfactory Signaling Pathway |
| 1.7 | 10.5 | REACTOME DIGESTION OF DIETARY CARBOHYDRATE | Genes involved in Digestion of dietary carbohydrate |
| 1.3 | 75.0 | REACTOME COLLAGEN FORMATION | Genes involved in Collagen formation |
| 1.1 | 15.5 | REACTOME PLATELET ADHESION TO EXPOSED COLLAGEN | Genes involved in Platelet Adhesion to exposed collagen |
| 1.1 | 18.2 | REACTOME OTHER SEMAPHORIN INTERACTIONS | Genes involved in Other semaphorin interactions |
| 0.9 | 17.6 | REACTOME RAS ACTIVATION UOPN CA2 INFUX THROUGH NMDA RECEPTOR | Genes involved in Ras activation uopn Ca2+ infux through NMDA receptor |
| 0.9 | 24.1 | REACTOME REGULATION OF GENE EXPRESSION IN BETA CELLS | Genes involved in Regulation of gene expression in beta cells |
| 0.9 | 14.3 | REACTOME AMINE DERIVED HORMONES | Genes involved in Amine-derived hormones |
| 0.8 | 14.1 | REACTOME N GLYCAN ANTENNAE ELONGATION | Genes involved in N-Glycan antennae elongation |
| 0.8 | 10.6 | REACTOME ROLE OF SECOND MESSENGERS IN NETRIN1 SIGNALING | Genes involved in Role of second messengers in netrin-1 signaling |
| 0.8 | 9.2 | REACTOME PASSIVE TRANSPORT BY AQUAPORINS | Genes involved in Passive Transport by Aquaporins |
| 0.6 | 16.8 | REACTOME DARPP 32 EVENTS | Genes involved in DARPP-32 events |
| 0.6 | 10.8 | REACTOME SIGNALLING TO P38 VIA RIT AND RIN | Genes involved in Signalling to p38 via RIT and RIN |
| 0.5 | 7.0 | REACTOME TANDEM PORE DOMAIN POTASSIUM CHANNELS | Genes involved in Tandem pore domain potassium channels |
| 0.5 | 10.3 | REACTOME ZINC TRANSPORTERS | Genes involved in Zinc transporters |
| 0.5 | 9.9 | REACTOME REGULATION OF KIT SIGNALING | Genes involved in Regulation of KIT signaling |
| 0.5 | 13.0 | REACTOME SYNTHESIS OF PC | Genes involved in Synthesis of PC |
| 0.5 | 12.3 | REACTOME RNA POL I PROMOTER OPENING | Genes involved in RNA Polymerase I Promoter Opening |
| 0.5 | 5.9 | REACTOME IONOTROPIC ACTIVITY OF KAINATE RECEPTORS | Genes involved in Ionotropic activity of Kainate Receptors |
| 0.4 | 23.7 | REACTOME AMINO ACID AND OLIGOPEPTIDE SLC TRANSPORTERS | Genes involved in Amino acid and oligopeptide SLC transporters |
| 0.4 | 6.6 | REACTOME NA CL DEPENDENT NEUROTRANSMITTER TRANSPORTERS | Genes involved in Na+/Cl- dependent neurotransmitter transporters |
| 0.4 | 5.3 | REACTOME REGULATION OF SIGNALING BY CBL | Genes involved in Regulation of signaling by CBL |
| 0.4 | 7.1 | REACTOME CITRIC ACID CYCLE TCA CYCLE | Genes involved in Citric acid cycle (TCA cycle) |
| 0.4 | 4.3 | REACTOME APOPTOSIS INDUCED DNA FRAGMENTATION | Genes involved in Apoptosis induced DNA fragmentation |
| 0.4 | 9.1 | REACTOME ENDOSOMAL SORTING COMPLEX REQUIRED FOR TRANSPORT ESCRT | Genes involved in Endosomal Sorting Complex Required For Transport (ESCRT) |
| 0.4 | 6.3 | REACTOME TRAFFICKING OF GLUR2 CONTAINING AMPA RECEPTORS | Genes involved in Trafficking of GluR2-containing AMPA receptors |
| 0.3 | 4.8 | REACTOME KERATAN SULFATE DEGRADATION | Genes involved in Keratan sulfate degradation |
| 0.3 | 5.6 | REACTOME GLYCOGEN BREAKDOWN GLYCOGENOLYSIS | Genes involved in Glycogen breakdown (glycogenolysis) |
| 0.3 | 3.0 | REACTOME HORMONE LIGAND BINDING RECEPTORS | Genes involved in Hormone ligand-binding receptors |
| 0.3 | 46.7 | REACTOME PEPTIDE LIGAND BINDING RECEPTORS | Genes involved in Peptide ligand-binding receptors |
| 0.3 | 6.5 | REACTOME GENERATION OF SECOND MESSENGER MOLECULES | Genes involved in Generation of second messenger molecules |
| 0.3 | 3.1 | REACTOME P2Y RECEPTORS | Genes involved in P2Y receptors |
| 0.2 | 7.0 | REACTOME LIGAND GATED ION CHANNEL TRANSPORT | Genes involved in Ligand-gated ion channel transport |
| 0.2 | 7.5 | REACTOME SYNTHESIS OF PA | Genes involved in Synthesis of PA |
| 0.2 | 3.9 | REACTOME DOWNSTREAM TCR SIGNALING | Genes involved in Downstream TCR signaling |
| 0.2 | 5.5 | REACTOME DEPOSITION OF NEW CENPA CONTAINING NUCLEOSOMES AT THE CENTROMERE | Genes involved in Deposition of New CENPA-containing Nucleosomes at the Centromere |
| 0.2 | 2.7 | REACTOME NOTCH HLH TRANSCRIPTION PATHWAY | Genes involved in Notch-HLH transcription pathway |
| 0.2 | 6.8 | REACTOME MYOGENESIS | Genes involved in Myogenesis |
| 0.2 | 7.5 | REACTOME PLC BETA MEDIATED EVENTS | Genes involved in PLC beta mediated events |
| 0.2 | 8.1 | REACTOME ACTIVATION OF ATR IN RESPONSE TO REPLICATION STRESS | Genes involved in Activation of ATR in response to replication stress |
| 0.2 | 2.7 | REACTOME MRNA DECAY BY 3 TO 5 EXORIBONUCLEASE | Genes involved in mRNA Decay by 3' to 5' Exoribonuclease |
| 0.2 | 6.8 | REACTOME SIGNALING BY ROBO RECEPTOR | Genes involved in Signaling by Robo receptor |
| 0.2 | 2.3 | REACTOME PRESYNAPTIC NICOTINIC ACETYLCHOLINE RECEPTORS | Genes involved in Presynaptic nicotinic acetylcholine receptors |
| 0.2 | 14.9 | REACTOME P75 NTR RECEPTOR MEDIATED SIGNALLING | Genes involved in p75 NTR receptor-mediated signalling |
| 0.2 | 2.3 | REACTOME INHIBITION OF REPLICATION INITIATION OF DAMAGED DNA BY RB1 E2F1 | Genes involved in Inhibition of replication initiation of damaged DNA by RB1/E2F1 |
| 0.2 | 3.1 | REACTOME RNA POL III CHAIN ELONGATION | Genes involved in RNA Polymerase III Chain Elongation |
| 0.2 | 2.4 | REACTOME G0 AND EARLY G1 | Genes involved in G0 and Early G1 |
| 0.1 | 1.3 | REACTOME SEMA3A PAK DEPENDENT AXON REPULSION | Genes involved in Sema3A PAK dependent Axon repulsion |
| 0.1 | 2.9 | REACTOME PROCESSING OF INTRONLESS PRE MRNAS | Genes involved in Processing of Intronless Pre-mRNAs |
| 0.1 | 2.2 | REACTOME SYNTHESIS OF GLYCOSYLPHOSPHATIDYLINOSITOL GPI | Genes involved in Synthesis of glycosylphosphatidylinositol (GPI) |
| 0.1 | 1.5 | REACTOME RNA POL I TRANSCRIPTION TERMINATION | Genes involved in RNA Polymerase I Transcription Termination |
| 0.1 | 2.7 | REACTOME G1 PHASE | Genes involved in G1 Phase |
| 0.1 | 0.7 | REACTOME ACTIVATION OF NF KAPPAB IN B CELLS | Genes involved in Activation of NF-kappaB in B Cells |
| 0.1 | 1.2 | REACTOME IL 7 SIGNALING | Genes involved in Interleukin-7 signaling |
| 0.1 | 4.1 | REACTOME STRIATED MUSCLE CONTRACTION | Genes involved in Striated Muscle Contraction |
| 0.1 | 4.2 | REACTOME IMMUNOREGULATORY INTERACTIONS BETWEEN A LYMPHOID AND A NON LYMPHOID CELL | Genes involved in Immunoregulatory interactions between a Lymphoid and a non-Lymphoid cell |
| 0.1 | 4.1 | REACTOME NOTCH1 INTRACELLULAR DOMAIN REGULATES TRANSCRIPTION | Genes involved in NOTCH1 Intracellular Domain Regulates Transcription |
| 0.1 | 3.2 | REACTOME BMAL1 CLOCK NPAS2 ACTIVATES CIRCADIAN EXPRESSION | Genes involved in BMAL1:CLOCK/NPAS2 Activates Circadian Expression |
| 0.1 | 0.9 | REACTOME NGF SIGNALLING VIA TRKA FROM THE PLASMA MEMBRANE | Genes involved in NGF signalling via TRKA from the plasma membrane |
| 0.1 | 2.5 | REACTOME PREFOLDIN MEDIATED TRANSFER OF SUBSTRATE TO CCT TRIC | Genes involved in Prefoldin mediated transfer of substrate to CCT/TriC |
| 0.1 | 4.9 | REACTOME NUCLEAR RECEPTOR TRANSCRIPTION PATHWAY | Genes involved in Nuclear Receptor transcription pathway |
| 0.1 | 4.1 | REACTOME TRANSPORT OF INORGANIC CATIONS ANIONS AND AMINO ACIDS OLIGOPEPTIDES | Genes involved in Transport of inorganic cations/anions and amino acids/oligopeptides |
| 0.1 | 5.0 | REACTOME MITOTIC PROMETAPHASE | Genes involved in Mitotic Prometaphase |
| 0.1 | 0.9 | REACTOME ACTIVATION OF CHAPERONES BY ATF6 ALPHA | Genes involved in Activation of Chaperones by ATF6-alpha |
| 0.1 | 5.6 | REACTOME MRNA SPLICING | Genes involved in mRNA Splicing |
| 0.1 | 2.5 | REACTOME LOSS OF NLP FROM MITOTIC CENTROSOMES | Genes involved in Loss of Nlp from mitotic centrosomes |
| 0.1 | 0.9 | REACTOME RNA POL II TRANSCRIPTION PRE INITIATION AND PROMOTER OPENING | Genes involved in RNA Polymerase II Transcription Pre-Initiation And Promoter Opening |
| 0.0 | 2.3 | REACTOME O LINKED GLYCOSYLATION OF MUCINS | Genes involved in O-linked glycosylation of mucins |
| 0.0 | 1.5 | REACTOME MEIOTIC SYNAPSIS | Genes involved in Meiotic Synapsis |
| 0.0 | 0.8 | REACTOME HYALURONAN METABOLISM | Genes involved in Hyaluronan metabolism |
| 0.0 | 2.3 | REACTOME APC C CDH1 MEDIATED DEGRADATION OF CDC20 AND OTHER APC C CDH1 TARGETED PROTEINS IN LATE MITOSIS EARLY G1 | Genes involved in APC/C:Cdh1 mediated degradation of Cdc20 and other APC/C:Cdh1 targeted proteins in late mitosis/early G1 |
| 0.0 | 0.6 | REACTOME AMINO ACID SYNTHESIS AND INTERCONVERSION TRANSAMINATION | Genes involved in Amino acid synthesis and interconversion (transamination) |
| 0.0 | 1.9 | REACTOME MHC CLASS II ANTIGEN PRESENTATION | Genes involved in MHC class II antigen presentation |
| 0.0 | 1.7 | REACTOME TRANSCRIPTIONAL REGULATION OF WHITE ADIPOCYTE DIFFERENTIATION | Genes involved in Transcriptional Regulation of White Adipocyte Differentiation |
| 0.0 | 0.8 | REACTOME METABOLISM OF NON CODING RNA | Genes involved in Metabolism of non-coding RNA |
| 0.0 | 1.1 | REACTOME CELL JUNCTION ORGANIZATION | Genes involved in Cell junction organization |
| 0.0 | 1.4 | REACTOME PEPTIDE CHAIN ELONGATION | Genes involved in Peptide chain elongation |