Project
GSE53960: rat RNA-Seq transcriptomic Bodymap
Navigation
Downloads
Results for Grhl1
Z-value: 1.15
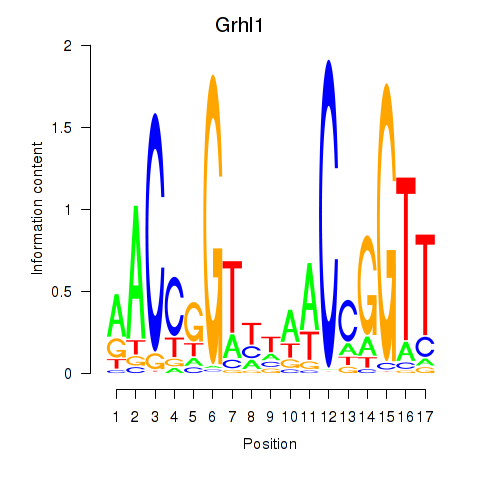
Motif logo
Transcription factors associated with Grhl1
| Gene Symbol | Gene ID | Gene Info |
|---|---|---|
|
Grhl1
|
ENSRNOG00000054989 | grainyhead-like transcription factor 1 |
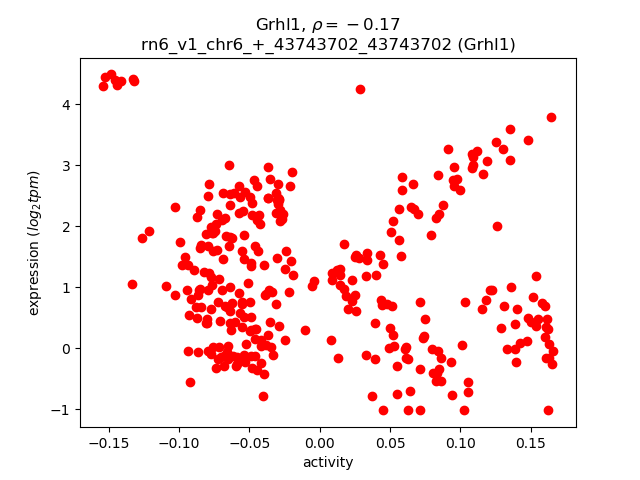
Activity-expression correlation:
| Gene | Promoter | Pearson corr. coef. | P-value | Plot |
|---|---|---|---|---|
| Grhl1 | rn6_v1_chr6_+_43743702_43743702 | -0.17 | 3.1e-03 | Click! |
Activity profile of Grhl1 motif
Sorted Z-values of Grhl1 motif
| Promoter | Log-likelihood | Transcript | Gene | Gene Info |
|---|---|---|---|---|
| chr18_-_28428117 | 72.38 |
ENSRNOT00000078202
|
Slc23a1
|
solute carrier family 23 member 1 |
| chr3_-_10371240 | 59.99 |
ENSRNOT00000012075
|
Ass1
|
argininosuccinate synthase 1 |
| chr2_-_187909394 | 55.05 |
ENSRNOT00000032355
|
Rab25
|
RAB25, member RAS oncogene family |
| chr1_+_214328071 | 49.01 |
ENSRNOT00000024725
|
Eps8l2
|
EPS8-like 2 |
| chr9_+_95295701 | 42.34 |
ENSRNOT00000025045
|
Ugt1a5
|
UDP glucuronosyltransferase family 1 member A5 |
| chr4_-_98342887 | 38.89 |
ENSRNOT00000010156
|
Tacstd2
|
tumor-associated calcium signal transducer 2 |
| chr12_-_23661009 | 33.56 |
ENSRNOT00000059451
|
Upk3bl
|
uroplakin 3B-like |
| chr13_+_52645257 | 33.34 |
ENSRNOT00000012801
|
Lad1
|
ladinin 1 |
| chr3_-_120106697 | 28.00 |
ENSRNOT00000020354
|
Prom2
|
prominin 2 |
| chr8_+_47674321 | 26.73 |
ENSRNOT00000026170
ENSRNOT00000078776 |
Trim29
|
tripartite motif-containing 29 |
| chr1_+_101541266 | 26.23 |
ENSRNOT00000028436
|
Hsd17b14
|
hydroxysteroid (17-beta) dehydrogenase 14 |
| chr2_+_93669765 | 25.95 |
ENSRNOT00000045438
|
Slc10a5
|
solute carrier family 10, member 5 |
| chr8_+_13796021 | 25.38 |
ENSRNOT00000013927
|
Vstm5
|
V-set and transmembrane domain containing 5 |
| chr11_+_47260641 | 25.14 |
ENSRNOT00000078856
|
Nfkbiz
|
NFKB inhibitor zeta |
| chr4_-_71763679 | 23.39 |
ENSRNOT00000024037
|
Epha1
|
Eph receptor A1 |
| chrX_-_84167717 | 22.55 |
ENSRNOT00000006415
|
Pof1b
|
premature ovarian failure 1B |
| chr10_+_28449335 | 18.85 |
ENSRNOT00000029118
|
Atp10b
|
ATPase phospholipid transporting 10B (putative) |
| chr1_+_166433109 | 18.80 |
ENSRNOT00000026428
|
Stard10
|
StAR-related lipid transfer domain containing 10 |
| chr6_-_42616548 | 18.30 |
ENSRNOT00000081433
|
Atp6v1c2
|
ATPase H+ transporting V1 subunit C2 |
| chr16_-_19777414 | 17.10 |
ENSRNOT00000022898
|
Nr2f6
|
nuclear receptor subfamily 2, group F, member 6 |
| chr2_+_227095487 | 16.78 |
ENSRNOT00000019647
|
LOC691807
|
hypothetical protein LOC691807 |
| chr20_-_3605638 | 16.71 |
ENSRNOT00000074460
|
Sfta2
|
surfactant associated 2 |
| chr11_-_28478360 | 16.06 |
ENSRNOT00000032663
|
Cldn17
|
claudin 17 |
| chr3_+_1385654 | 10.81 |
ENSRNOT00000091805
ENSRNOT00000007593 |
Il36rn
|
interleukin 36 receptor antagonist |
| chr1_-_234749447 | 10.65 |
ENSRNOT00000016930
|
Nmrk1
|
nicotinamide riboside kinase 1 |
| chr1_-_162713610 | 10.28 |
ENSRNOT00000018091
|
Aqp11
|
aquaporin 11 |
| chr9_+_11064605 | 10.00 |
ENSRNOT00000075121
|
Stap2
|
signal transducing adaptor family member 2 |
| chrX_-_112473822 | 9.16 |
ENSRNOT00000079180
|
Col4a6
|
collagen type IV alpha 6 chain |
| chr17_-_57984036 | 8.95 |
ENSRNOT00000022389
|
Idi1
|
isopentenyl-diphosphate delta isomerase 1 |
| chr9_-_42805673 | 8.58 |
ENSRNOT00000020558
|
Uggt1
|
UDP-glucose glycoprotein glucosyltransferase 1 |
| chr1_+_234749568 | 8.13 |
ENSRNOT00000016871
|
Ostf1
|
osteoclast stimulating factor 1 |
| chr18_+_35384743 | 7.13 |
ENSRNOT00000076143
ENSRNOT00000074593 |
LOC100911797
|
serine protease inhibitor Kazal-type 5-like |
| chr1_-_220938814 | 6.85 |
ENSRNOT00000028081
|
Ovol1
|
ovo like transcriptional repressor 1 |
| chr19_+_9622611 | 6.46 |
ENSRNOT00000061498
|
Slc38a7
|
solute carrier family 38, member 7 |
| chr20_-_3728844 | 6.04 |
ENSRNOT00000074958
|
Psors1c2
|
psoriasis susceptibility 1 candidate 2 |
| chr9_+_10885560 | 6.04 |
ENSRNOT00000072870
|
Mydgf
|
myeloid-derived growth factor |
| chr5_-_33574596 | 5.22 |
ENSRNOT00000008281
|
Cpne3
|
copine 3 |
| chr15_-_55277713 | 4.64 |
ENSRNOT00000023037
|
Itm2b
|
integral membrane protein 2B |
| chr1_-_87468288 | 4.62 |
ENSRNOT00000042207
|
Sipa1l3
|
signal-induced proliferation-associated 1 like 3 |
| chr9_+_53626592 | 4.23 |
ENSRNOT00000031267
|
Mfsd6
|
major facilitator superfamily domain containing 6 |
| chr16_+_20110148 | 3.98 |
ENSRNOT00000080146
ENSRNOT00000025312 |
Jak3
|
Janus kinase 3 |
| chr9_+_53627208 | 3.93 |
ENSRNOT00000083487
|
Mfsd6
|
major facilitator superfamily domain containing 6 |
| chr2_+_257633425 | 3.58 |
ENSRNOT00000071770
|
Zzz3
|
zinc finger, ZZ-type containing 3 |
| chr18_-_76753902 | 3.27 |
ENSRNOT00000078797
|
Hsbp1l1
|
heat shock factor binding protein 1-like 1 |
| chr11_+_67465236 | 3.17 |
ENSRNOT00000042374
|
Stfa2
|
stefin A2 |
| chr5_+_157434481 | 2.93 |
ENSRNOT00000088556
|
Tmco4
|
transmembrane and coiled-coil domains 4 |
| chr11_-_83546674 | 2.91 |
ENSRNOT00000044896
|
Ephb3
|
Eph receptor B3 |
| chr3_-_12502859 | 2.63 |
ENSRNOT00000022814
|
Zbtb43
|
zinc finger and BTB domain containing 43 |
| chr7_+_118490560 | 2.21 |
ENSRNOT00000064873
|
LOC108348145
|
zinc finger protein 7-like |
| chr1_+_169115981 | 1.64 |
ENSRNOT00000067478
|
Olr135
|
olfactory receptor 135 |
| chr20_-_27578244 | 1.51 |
ENSRNOT00000000708
|
Fam26d
|
family with sequence similarity 26, member D |
| chr17_+_1936163 | 1.18 |
ENSRNOT00000024466
|
Cdk20
|
cyclin-dependent kinase 20 |
| chr1_-_89007041 | 1.07 |
ENSRNOT00000032363
|
Proser3
|
proline and serine rich 3 |
| chrX_+_95344825 | 0.79 |
ENSRNOT00000047255
|
Olr10
|
olfactory receptor 10 |
| chr5_+_132005738 | 0.69 |
ENSRNOT00000041421
|
Skint4
|
selection and upkeep of intraepithelial T cells 4 |
| chr1_-_157494008 | 0.52 |
ENSRNOT00000013552
|
Pcf11
|
PCF11 cleavage and polyadenylation factor subunit |
| chr4_+_62780596 | 0.41 |
ENSRNOT00000073846
|
LOC689574
|
hypothetical protein LOC689574 |
| chr18_+_70192493 | 0.09 |
ENSRNOT00000020472
|
Cxxc1
|
CXXC finger protein 1 |
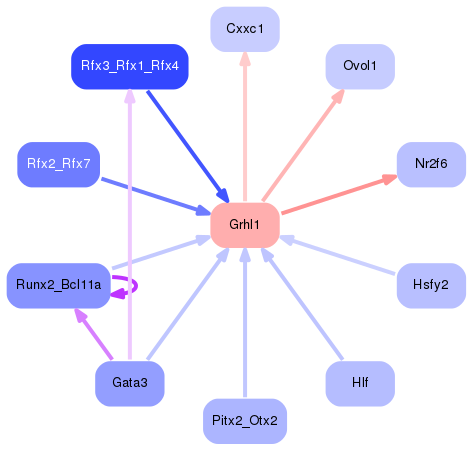
Network of associatons between targets according to the STRING database.

First level regulatory network of Grhl1
Gene Ontology Analysis
Gene overrepresentation in biological process category:
| Log-likelihood per target | Total log-likelihood | Term | Description |
|---|---|---|---|
| 24.1 | 72.4 | GO:0015882 | L-ascorbic acid transport(GO:0015882) transepithelial L-ascorbic acid transport(GO:0070904) |
| 20.0 | 60.0 | GO:0000053 | argininosuccinate metabolic process(GO:0000053) |
| 7.8 | 38.9 | GO:0090191 | negative regulation of branching involved in ureteric bud morphogenesis(GO:0090191) |
| 5.6 | 28.0 | GO:0048550 | negative regulation of pinocytosis(GO:0048550) |
| 4.9 | 49.0 | GO:1900029 | positive regulation of ruffle assembly(GO:1900029) |
| 4.7 | 42.3 | GO:0052697 | xenobiotic glucuronidation(GO:0052697) |
| 2.6 | 55.1 | GO:0031268 | pseudopodium organization(GO:0031268) |
| 2.4 | 18.8 | GO:0035360 | positive regulation of peroxisome proliferator activated receptor signaling pathway(GO:0035360) |
| 2.2 | 6.5 | GO:1902024 | histidine transport(GO:0015817) L-histidine transmembrane transport(GO:0089709) L-histidine transport(GO:1902024) |
| 2.1 | 8.6 | GO:0006011 | UDP-glucose metabolic process(GO:0006011) |
| 2.1 | 10.3 | GO:0015793 | glycerol transport(GO:0015793) |
| 1.8 | 10.8 | GO:1902714 | negative regulation of interferon-gamma secretion(GO:1902714) |
| 1.5 | 9.0 | GO:0009240 | isopentenyl diphosphate biosynthetic process(GO:0009240) isopentenyl diphosphate metabolic process(GO:0046490) |
| 1.3 | 4.0 | GO:0002731 | negative regulation of dendritic cell cytokine production(GO:0002731) FasL biosynthetic process(GO:0045210) |
| 1.3 | 5.2 | GO:0038128 | ERBB2 signaling pathway(GO:0038128) |
| 1.2 | 4.6 | GO:0042985 | negative regulation of amyloid precursor protein biosynthetic process(GO:0042985) |
| 1.1 | 6.9 | GO:1901994 | negative regulation of meiotic cell cycle phase transition(GO:1901994) |
| 0.9 | 26.2 | GO:0006706 | steroid catabolic process(GO:0006706) |
| 0.8 | 17.1 | GO:0050961 | detection of temperature stimulus involved in sensory perception(GO:0050961) detection of temperature stimulus involved in sensory perception of pain(GO:0050965) |
| 0.7 | 18.9 | GO:0045332 | phospholipid translocation(GO:0045332) |
| 0.7 | 10.6 | GO:0009435 | NAD biosynthetic process(GO:0009435) |
| 0.6 | 15.5 | GO:0015721 | bile acid and bile salt transport(GO:0015721) |
| 0.6 | 9.2 | GO:0038063 | collagen-activated tyrosine kinase receptor signaling pathway(GO:0038063) |
| 0.6 | 26.3 | GO:0048013 | ephrin receptor signaling pathway(GO:0048013) |
| 0.6 | 18.3 | GO:0015991 | ATP hydrolysis coupled proton transport(GO:0015991) |
| 0.3 | 26.7 | GO:1900181 | negative regulation of protein localization to nucleus(GO:1900181) |
| 0.1 | 4.6 | GO:0090162 | establishment of epithelial cell polarity(GO:0090162) |
| 0.1 | 0.5 | GO:0006369 | termination of RNA polymerase II transcription(GO:0006369) |
| 0.1 | 6.0 | GO:0001938 | positive regulation of endothelial cell proliferation(GO:0001938) |
| 0.0 | 25.1 | GO:0006954 | inflammatory response(GO:0006954) |
| 0.0 | 1.2 | GO:1904031 | positive regulation of cyclin-dependent protein kinase activity(GO:1904031) |
| 0.0 | 3.2 | GO:0010951 | negative regulation of endopeptidase activity(GO:0010951) |
Gene overrepresentation in cellular component category:
| Log-likelihood per target | Total log-likelihood | Term | Description |
|---|---|---|---|
| 7.0 | 28.0 | GO:0071914 | microspike(GO:0044393) prominosome(GO:0071914) |
| 4.2 | 55.1 | GO:0031143 | pseudopodium(GO:0031143) |
| 3.7 | 60.0 | GO:0070852 | cell body fiber(GO:0070852) |
| 3.7 | 18.3 | GO:0000221 | vacuolar proton-transporting V-type ATPase, V1 domain(GO:0000221) |
| 2.0 | 111.3 | GO:0009925 | basal plasma membrane(GO:0009925) |
| 1.4 | 18.8 | GO:0046581 | intercellular canaliculus(GO:0046581) |
| 1.1 | 9.2 | GO:0098642 | collagen type IV trimer(GO:0005587) network-forming collagen trimer(GO:0098642) collagen network(GO:0098645) |
| 1.0 | 22.6 | GO:0030057 | desmosome(GO:0030057) |
| 0.9 | 4.6 | GO:0061689 | tricellular tight junction(GO:0061689) |
| 0.5 | 49.0 | GO:0032587 | ruffle membrane(GO:0032587) |
| 0.3 | 33.3 | GO:0005604 | basement membrane(GO:0005604) |
| 0.2 | 23.6 | GO:0005913 | cell-cell adherens junction(GO:0005913) |
| 0.2 | 3.6 | GO:0005671 | Ada2/Gcn5/Ada3 transcription activator complex(GO:0005671) |
| 0.1 | 15.8 | GO:0000932 | cytoplasmic mRNA processing body(GO:0000932) |
| 0.1 | 16.1 | GO:0070160 | bicellular tight junction(GO:0005923) occluding junction(GO:0070160) |
| 0.1 | 8.6 | GO:0005788 | endoplasmic reticulum lumen(GO:0005788) |
| 0.1 | 4.6 | GO:0030660 | Golgi-associated vesicle membrane(GO:0030660) |
| 0.1 | 9.0 | GO:0005777 | peroxisome(GO:0005777) microbody(GO:0042579) |
| 0.0 | 4.0 | GO:0031234 | extrinsic component of cytoplasmic side of plasma membrane(GO:0031234) |
| 0.0 | 0.5 | GO:0005849 | mRNA cleavage factor complex(GO:0005849) |
| 0.0 | 136.5 | GO:0016021 | integral component of membrane(GO:0016021) |
| 0.0 | 5.2 | GO:0005925 | focal adhesion(GO:0005925) |
| 0.0 | 13.2 | GO:0005615 | extracellular space(GO:0005615) |
Gene overrepresentation in molecular function category:
| Log-likelihood per target | Total log-likelihood | Term | Description |
|---|---|---|---|
| 24.1 | 72.4 | GO:0070890 | L-ascorbate:sodium symporter activity(GO:0008520) L-ascorbic acid transporter activity(GO:0015229) sodium-dependent L-ascorbate transmembrane transporter activity(GO:0070890) |
| 8.7 | 26.2 | GO:0047045 | testosterone 17-beta-dehydrogenase (NADP+) activity(GO:0047045) |
| 3.9 | 23.4 | GO:0005005 | transmembrane-ephrin receptor activity(GO:0005005) |
| 3.2 | 60.0 | GO:0015643 | toxic substance binding(GO:0015643) |
| 2.6 | 15.5 | GO:0008508 | bile acid:sodium symporter activity(GO:0008508) |
| 2.2 | 9.0 | GO:0004452 | isopentenyl-diphosphate delta-isomerase activity(GO:0004452) |
| 2.2 | 49.0 | GO:0030676 | Rac guanyl-nucleotide exchange factor activity(GO:0030676) |
| 2.2 | 55.1 | GO:0031489 | myosin V binding(GO:0031489) |
| 2.2 | 6.5 | GO:0005290 | L-histidine transmembrane transporter activity(GO:0005290) |
| 2.0 | 18.3 | GO:0008553 | hydrogen-exporting ATPase activity, phosphorylative mechanism(GO:0008553) |
| 1.5 | 10.8 | GO:0048019 | receptor antagonist activity(GO:0048019) |
| 1.4 | 42.3 | GO:0015020 | glucuronosyltransferase activity(GO:0015020) |
| 1.3 | 26.7 | GO:0098641 | cadherin binding involved in cell-cell adhesion(GO:0098641) |
| 1.2 | 8.6 | GO:0035251 | UDP-glucosyltransferase activity(GO:0035251) |
| 0.9 | 18.9 | GO:0004012 | phospholipid-translocating ATPase activity(GO:0004012) |
| 0.7 | 10.3 | GO:0015250 | water channel activity(GO:0015250) |
| 0.6 | 28.0 | GO:0015485 | cholesterol binding(GO:0015485) |
| 0.4 | 1.2 | GO:0019912 | cyclin-dependent protein kinase activating kinase activity(GO:0019912) |
| 0.3 | 2.9 | GO:0008046 | axon guidance receptor activity(GO:0008046) |
| 0.2 | 17.1 | GO:0098531 | RNA polymerase II transcription factor activity, ligand-activated sequence-specific DNA binding(GO:0004879) transcription factor activity, direct ligand regulated sequence-specific DNA binding(GO:0098531) |
| 0.1 | 4.6 | GO:0001540 | beta-amyloid binding(GO:0001540) |
| 0.1 | 9.2 | GO:0005201 | extracellular matrix structural constituent(GO:0005201) |
| 0.1 | 31.8 | GO:0045296 | cadherin binding(GO:0045296) |
| 0.1 | 5.2 | GO:0030971 | receptor tyrosine kinase binding(GO:0030971) |
| 0.1 | 4.0 | GO:0004715 | non-membrane spanning protein tyrosine kinase activity(GO:0004715) |
| 0.1 | 8.1 | GO:0017124 | SH3 domain binding(GO:0017124) |
| 0.1 | 28.4 | GO:0003712 | transcription cofactor activity(GO:0003712) |
| 0.0 | 3.2 | GO:0004869 | cysteine-type endopeptidase inhibitor activity(GO:0004869) |
| 0.0 | 16.1 | GO:0005198 | structural molecule activity(GO:0005198) |
| 0.0 | 0.5 | GO:0000993 | RNA polymerase II core binding(GO:0000993) |
| 0.0 | 0.1 | GO:0045322 | unmethylated CpG binding(GO:0045322) |
| 0.0 | 4.6 | GO:0005096 | GTPase activator activity(GO:0005096) |
Gene overrepresentation in curated gene sets: canonical pathways category:
| Log-likelihood per target | Total log-likelihood | Term | Description |
|---|---|---|---|
| 0.6 | 23.4 | PID EPHA FWDPATHWAY | EPHA forward signaling |
| 0.4 | 4.0 | ST JAK STAT PATHWAY | Jak-STAT Pathway |
| 0.2 | 9.2 | PID SYNDECAN 1 PATHWAY | Syndecan-1-mediated signaling events |
| 0.1 | 16.7 | NABA ECM AFFILIATED | Genes encoding proteins affiliated structurally or functionally to extracellular matrix proteins |
| 0.1 | 2.9 | PID EPHB FWD PATHWAY | EPHB forward signaling |
| 0.0 | 9.7 | NABA SECRETED FACTORS | Genes encoding secreted soluble factors |
Gene overrepresentation in curated gene sets: REACTOME pathways category:
| Log-likelihood per target | Total log-likelihood | Term | Description |
|---|---|---|---|
| 2.2 | 42.3 | REACTOME GLUCURONIDATION | Genes involved in Glucuronidation |
| 1.2 | 72.4 | REACTOME METABOLISM OF VITAMINS AND COFACTORS | Genes involved in Metabolism of vitamins and cofactors |
| 0.9 | 8.6 | REACTOME N GLYCAN TRIMMING IN THE ER AND CALNEXIN CALRETICULIN CYCLE | Genes involved in N-glycan trimming in the ER and Calnexin/Calreticulin cycle |
| 0.7 | 18.3 | REACTOME INSULIN RECEPTOR RECYCLING | Genes involved in Insulin receptor recycling |
| 0.5 | 16.1 | REACTOME TIGHT JUNCTION INTERACTIONS | Genes involved in Tight junction interactions |
| 0.4 | 18.9 | REACTOME ION TRANSPORT BY P TYPE ATPASES | Genes involved in Ion transport by P-type ATPases |
| 0.4 | 9.0 | REACTOME CHOLESTEROL BIOSYNTHESIS | Genes involved in Cholesterol biosynthesis |
| 0.3 | 60.0 | REACTOME METABOLISM OF AMINO ACIDS AND DERIVATIVES | Genes involved in Metabolism of amino acids and derivatives |
| 0.3 | 4.0 | REACTOME IL 7 SIGNALING | Genes involved in Interleukin-7 signaling |
| 0.2 | 9.2 | REACTOME COLLAGEN FORMATION | Genes involved in Collagen formation |
| 0.1 | 4.6 | REACTOME AMYLOIDS | Genes involved in Amyloids |
| 0.0 | 2.9 | REACTOME NUCLEAR RECEPTOR TRANSCRIPTION PATHWAY | Genes involved in Nuclear Receptor transcription pathway |
| 0.0 | 0.5 | REACTOME PROCESSING OF INTRONLESS PRE MRNAS | Genes involved in Processing of Intronless Pre-mRNAs |