Project
GSE53960: rat RNA-Seq transcriptomic Bodymap
Navigation
Downloads
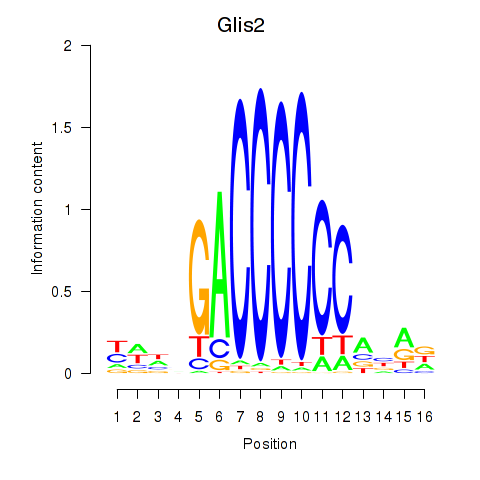
Results for Glis2
Z-value: 0.90
Motif logo
Transcription factors associated with Glis2
| Gene Symbol | Gene ID | Gene Info |
|---|---|---|
|
Glis2
|
ENSRNOG00000004766 | GLIS family zinc finger 2 |
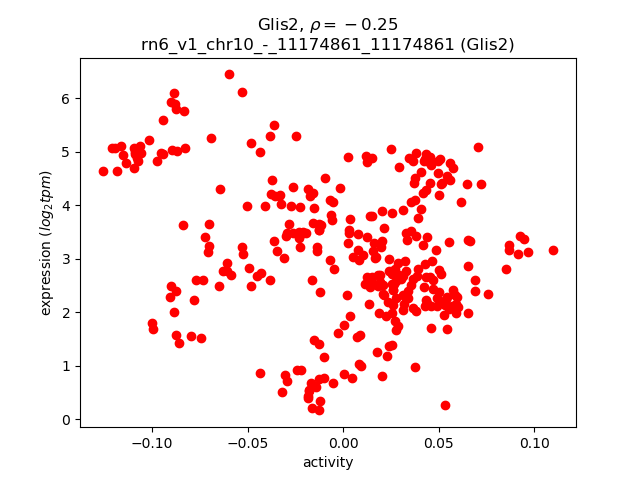
Activity-expression correlation:
| Gene | Promoter | Pearson corr. coef. | P-value | Plot |
|---|---|---|---|---|
| Glis2 | rn6_v1_chr10_-_11174861_11174861 | -0.25 | 6.2e-06 | Click! |
Activity profile of Glis2 motif
Sorted Z-values of Glis2 motif
| Promoter | Log-likelihood | Transcript | Gene | Gene Info |
|---|---|---|---|---|
| chr20_+_30791422 | 31.99 |
ENSRNOT00000047394
ENSRNOT00000000683 |
Tbata
|
thymus, brain and testes associated |
| chr14_-_78377825 | 23.71 |
ENSRNOT00000068104
|
AABR07015812.1
|
|
| chr6_-_138250089 | 19.45 |
ENSRNOT00000048378
|
Ighm
|
immunoglobulin heavy constant mu |
| chr12_+_9360672 | 16.93 |
ENSRNOT00000088957
|
Flt3
|
fms-related tyrosine kinase 3 |
| chr20_-_1980101 | 16.13 |
ENSRNOT00000084582
ENSRNOT00000085050 ENSRNOT00000082545 ENSRNOT00000088396 |
Gabbr1
|
gamma-aminobutyric acid type B receptor subunit 1 |
| chr7_-_119768082 | 15.82 |
ENSRNOT00000009612
|
Sstr3
|
somatostatin receptor 3 |
| chr12_+_25119355 | 15.79 |
ENSRNOT00000034629
|
Lat2
|
linker for activation of T cells family, member 2 |
| chr15_-_54906203 | 15.62 |
ENSRNOT00000020186
|
Cysltr2
|
cysteinyl leukotriene receptor 2 |
| chr17_-_44840131 | 15.34 |
ENSRNOT00000083417
|
Hist1h3b
|
histone cluster 1, H3b |
| chr3_+_148579920 | 15.02 |
ENSRNOT00000012432
|
Hck
|
HCK proto-oncogene, Src family tyrosine kinase |
| chr10_+_91710495 | 14.41 |
ENSRNOT00000033276
|
Rprml
|
reprimo-like |
| chr16_-_14348046 | 14.39 |
ENSRNOT00000018630
|
Cdhr1
|
cadherin-related family member 1 |
| chr9_-_54484533 | 14.27 |
ENSRNOT00000083514
|
Stat1
|
signal transducer and activator of transcription 1 |
| chr7_+_70364813 | 13.21 |
ENSRNOT00000084012
ENSRNOT00000031230 |
Agap2
|
ArfGAP with GTPase domain, ankyrin repeat and PH domain 2 |
| chr10_-_57436368 | 12.23 |
ENSRNOT00000056608
|
Scimp
|
SLP adaptor and CSK interacting membrane protein |
| chr10_+_88490798 | 11.67 |
ENSRNOT00000023872
|
Cnp
|
2',3'-cyclic nucleotide 3' phosphodiesterase |
| chr6_-_137664133 | 11.58 |
ENSRNOT00000018613
|
Gpr132
|
G protein-coupled receptor 132 |
| chr7_-_143552588 | 10.94 |
ENSRNOT00000086317
ENSRNOT00000092619 ENSRNOT00000092138 |
Krt78
|
keratin 78 |
| chr14_-_28856214 | 10.65 |
ENSRNOT00000044659
|
Adgrl3
|
adhesion G protein-coupled receptor L3 |
| chr11_+_60073383 | 10.47 |
ENSRNOT00000087508
|
Tagln3
|
transgelin 3 |
| chr19_+_50045020 | 10.40 |
ENSRNOT00000090165
|
Plcg2
|
phospholipase C, gamma 2 |
| chr15_+_34187223 | 9.95 |
ENSRNOT00000024978
|
Cpne6
|
copine 6 |
| chr11_+_60336061 | 9.53 |
ENSRNOT00000084022
|
LOC685767
|
similar to OX-2 membrane glycoprotein precursor (MRC OX-2 antigen) (CD200 antigen) |
| chr4_-_113866674 | 9.51 |
ENSRNOT00000010020
|
Dok1
|
docking protein 1 |
| chr4_-_103145058 | 9.47 |
ENSRNOT00000073076
|
AABR07061048.1
|
|
| chr11_+_57505005 | 9.40 |
ENSRNOT00000002942
|
LOC103693564
|
transgelin-3 |
| chr4_-_58006839 | 9.25 |
ENSRNOT00000076645
|
Cep41
|
centrosomal protein 41 |
| chr18_-_24057917 | 9.16 |
ENSRNOT00000023874
|
Rit2
|
Ras-like without CAAX 2 |
| chr10_-_88551056 | 9.14 |
ENSRNOT00000032737
|
Zfp385c
|
zinc finger protein 385C |
| chr4_+_147333056 | 9.06 |
ENSRNOT00000012137
|
Pparg
|
peroxisome proliferator-activated receptor gamma |
| chr12_+_25036605 | 9.04 |
ENSRNOT00000001996
ENSRNOT00000084427 |
Limk1
|
LIM domain kinase 1 |
| chrX_+_28593405 | 9.00 |
ENSRNOT00000071708
|
Tmsb4x
|
thymosin beta 4, X-linked |
| chr4_-_179307095 | 8.92 |
ENSRNOT00000021193
|
Bcat1
|
branched chain amino acid transaminase 1 |
| chr1_+_199196059 | 8.84 |
ENSRNOT00000090428
|
Fbxl19
|
F-box and leucine-rich repeat protein 19 |
| chr13_+_70174936 | 8.82 |
ENSRNOT00000064068
ENSRNOT00000079861 ENSRNOT00000092562 |
Arpc5
|
actin related protein 2/3 complex, subunit 5 |
| chr7_+_143629455 | 8.72 |
ENSRNOT00000073951
|
Krt18
|
keratin 18 |
| chr14_+_25589762 | 8.40 |
ENSRNOT00000043938
ENSRNOT00000067439 ENSRNOT00000002793 |
Epha5
|
EPH receptor A5 |
| chr13_+_48455923 | 8.20 |
ENSRNOT00000009280
|
Rab7b
|
Rab7b, member RAS oncogene family |
| chr15_-_33725188 | 8.19 |
ENSRNOT00000083941
|
Zfhx2
|
zinc finger homeobox 2 |
| chr1_+_124625985 | 7.97 |
ENSRNOT00000021068
|
Otud7a
|
OTU deubiquitinase 7A |
| chr8_+_133197032 | 7.96 |
ENSRNOT00000075564
|
Ccr5
|
chemokine (C-C motif) receptor 5 |
| chr1_+_82480195 | 7.90 |
ENSRNOT00000028051
|
Tgfb1
|
transforming growth factor, beta 1 |
| chr4_+_161685258 | 7.74 |
ENSRNOT00000008012
ENSRNOT00000008003 |
Foxm1
|
forkhead box M1 |
| chr20_-_2678141 | 7.70 |
ENSRNOT00000072377
ENSRNOT00000083833 |
C4a
|
complement component 4A (Rodgers blood group) |
| chr11_-_60882379 | 7.60 |
ENSRNOT00000002799
|
Cd200r1
|
CD200 receptor 1 |
| chr20_-_4070721 | 7.55 |
ENSRNOT00000000523
|
RT1-Ba
|
RT1 class II, locus Ba |
| chr1_-_212022212 | 7.40 |
ENSRNOT00000074298
|
Cfap46
|
cilia and flagella associated protein 46 |
| chr7_-_116255167 | 7.33 |
ENSRNOT00000038109
ENSRNOT00000041774 |
Cyp11b2
|
cytochrome P450, family 11, subfamily b, polypeptide 2 |
| chr20_-_4508197 | 7.24 |
ENSRNOT00000086027
ENSRNOT00000000514 |
C4a
|
complement component 4A (Rodgers blood group) |
| chr7_-_123445613 | 7.16 |
ENSRNOT00000070937
|
Shisa8
|
shisa family member 8 |
| chr19_+_37305248 | 7.04 |
ENSRNOT00000068299
|
Slc9a5
|
solute carrier family 9 member A5 |
| chr2_-_178057157 | 6.92 |
ENSRNOT00000091135
|
Rapgef2
|
Rap guanine nucleotide exchange factor 2 |
| chr17_+_80882666 | 6.80 |
ENSRNOT00000024430
|
Vim
|
vimentin |
| chr20_-_4316715 | 6.78 |
ENSRNOT00000031704
|
C4b
|
complement C4B (Chido blood group) |
| chr12_+_23544287 | 6.78 |
ENSRNOT00000001938
|
Orai2
|
ORAI calcium release-activated calcium modulator 2 |
| chr16_+_2743823 | 6.67 |
ENSRNOT00000087873
|
Arhgef3
|
Rho guanine nucleotide exchange factor 3 |
| chr1_-_219719272 | 6.58 |
ENSRNOT00000026152
|
Syt12
|
synaptotagmin 12 |
| chr7_-_28040510 | 6.58 |
ENSRNOT00000005674
|
Ascl1
|
achaete-scute family bHLH transcription factor 1 |
| chr2_-_93985378 | 6.54 |
ENSRNOT00000075493
|
Fabp5
|
fatty acid binding protein 5, epidermal |
| chr1_+_100832324 | 6.53 |
ENSRNOT00000056364
|
Il4i1
|
interleukin 4 induced 1 |
| chr10_+_107455845 | 6.52 |
ENSRNOT00000004373
|
C1qtnf1
|
C1q and tumor necrosis factor related protein 1 |
| chrX_-_78496847 | 6.45 |
ENSRNOT00000003265
|
Itm2a
|
integral membrane protein 2A |
| chr3_+_148773259 | 6.39 |
ENSRNOT00000013804
|
Kif3b
|
kinesin family member 3B |
| chr1_-_73619356 | 6.19 |
ENSRNOT00000074352
|
Lilrb3
|
leukocyte immunoglobulin like receptor B3 |
| chr6_-_33738825 | 6.13 |
ENSRNOT00000039492
|
Slc7a15
|
solute carrier family 7 (cationic amino acid transporter, y+ system), member 15 |
| chr7_-_143956668 | 5.95 |
ENSRNOT00000018809
|
Aaas
|
aladin WD repeat nucleoporin |
| chr9_+_81656116 | 5.77 |
ENSRNOT00000083421
|
Slc11a1
|
solute carrier family 11 member 1 |
| chr2_+_5437067 | 5.73 |
ENSRNOT00000093516
|
Pou5f2
|
POU domain class 5, transcription factor 2 |
| chr11_+_60072727 | 5.61 |
ENSRNOT00000090230
|
Tagln3
|
transgelin 3 |
| chr11_+_45751812 | 5.47 |
ENSRNOT00000079336
|
RGD1310935
|
similar to Dermal papilla derived protein 7 |
| chr10_+_61403130 | 5.35 |
ENSRNOT00000092490
ENSRNOT00000077649 |
Ccdc92b
|
coiled-coil domain containing 92B |
| chrX_-_10031167 | 5.13 |
ENSRNOT00000060988
|
Gpr34
|
G protein-coupled receptor 34 |
| chr6_+_123897956 | 5.13 |
ENSRNOT00000005167
|
Tdp1
|
tyrosyl-DNA phosphodiesterase 1 |
| chr8_+_21890319 | 5.01 |
ENSRNOT00000027949
|
LOC500956
|
hypothetical protein LOC500956 |
| chr7_+_11737293 | 4.76 |
ENSRNOT00000046059
|
Lingo3
|
leucine rich repeat and Ig domain containing 3 |
| chr14_+_34389991 | 4.74 |
ENSRNOT00000002953
|
Pdcl2
|
phosducin-like 2 |
| chr5_-_160555083 | 4.65 |
ENSRNOT00000018953
|
Fhad1
|
forkhead associated phosphopeptide binding domain 1 |
| chr3_+_147042944 | 4.58 |
ENSRNOT00000012608
|
Fkbp1a
|
FK506 binding protein 1a |
| chr12_+_42097626 | 4.56 |
ENSRNOT00000001893
|
Tbx5
|
T-box 5 |
| chr3_-_143063983 | 4.42 |
ENSRNOT00000006329
|
Napb
|
NSF attachment protein beta |
| chr10_-_70506963 | 4.38 |
ENSRNOT00000076883
ENSRNOT00000012874 |
Slfn14
|
schlafen family member 14 |
| chr8_+_117574161 | 4.31 |
ENSRNOT00000077078
|
Ip6k2
|
inositol hexakisphosphate kinase 2 |
| chr3_+_11756384 | 4.22 |
ENSRNOT00000087762
|
Sh2d3c
|
SH2 domain containing 3C |
| chr3_+_2506426 | 4.22 |
ENSRNOT00000015242
|
Lrrc26
|
leucine rich repeat containing 26 |
| chr3_-_114074803 | 4.20 |
ENSRNOT00000022964
|
Patl2
|
PAT1 homolog 2 |
| chr8_-_116532169 | 4.17 |
ENSRNOT00000085364
|
Rbm5
|
RNA binding motif protein 5 |
| chr12_+_22229079 | 4.16 |
ENSRNOT00000001911
|
Gnb2
|
G protein subunit beta 2 |
| chr12_+_22466601 | 4.03 |
ENSRNOT00000074544
|
AABR07035787.1
|
|
| chr16_-_3762877 | 4.02 |
ENSRNOT00000052224
|
Duxbl1
|
double homeobox B-like 1 |
| chr16_-_18860086 | 3.97 |
ENSRNOT00000074814
|
Sin3b
|
SIN3 transcription regulator family member B |
| chr20_+_28572242 | 3.95 |
ENSRNOT00000072485
|
Sh3rf3
|
SH3 domain containing ring finger 3 |
| chr9_+_16702460 | 3.88 |
ENSRNOT00000061432
|
Ptk7
|
protein tyrosine kinase 7 |
| chr14_-_6533524 | 3.81 |
ENSRNOT00000079795
|
Abcg3l1
|
ATP-binding cassette, subfamily G (WHITE), member 3-like 1 |
| chr14_-_35149608 | 3.78 |
ENSRNOT00000003050
ENSRNOT00000090654 |
Kit
|
KIT proto-oncogene receptor tyrosine kinase |
| chrX_+_71324365 | 3.76 |
ENSRNOT00000004911
|
Nono
|
non-POU domain containing, octamer-binding |
| chr20_-_17091766 | 3.73 |
ENSRNOT00000074404
|
Zwint
|
ZW10 interacting kinetochore protein |
| chr3_+_80556668 | 3.66 |
ENSRNOT00000079118
|
Arhgap1
|
Rho GTPase activating protein 1 |
| chr12_-_2387930 | 3.62 |
ENSRNOT00000031997
|
Cd209e
|
CD209e molecule |
| chr5_-_151709877 | 3.61 |
ENSRNOT00000080602
|
Trnp1
|
TMF1-regulated nuclear protein 1 |
| chr20_-_2212171 | 3.54 |
ENSRNOT00000085912
|
Trim26
|
tripartite motif-containing 26 |
| chr12_-_47456894 | 3.50 |
ENSRNOT00000001570
|
Oasl
|
2'-5'-oligoadenylate synthetase-like |
| chr9_+_12740885 | 3.48 |
ENSRNOT00000015210
|
Rftn1
|
raftlin lipid raft linker 1 |
| chr15_-_11912806 | 3.42 |
ENSRNOT00000068171
ENSRNOT00000008759 ENSRNOT00000049771 |
Slc4a7
|
solute carrier family 4 member 7 |
| chrX_-_123515720 | 3.35 |
ENSRNOT00000092343
|
Nkrf
|
NFKB repressing factor |
| chr10_+_20591432 | 3.32 |
ENSRNOT00000059780
|
Pank3
|
pantothenate kinase 3 |
| chr11_-_77593171 | 3.17 |
ENSRNOT00000002645
ENSRNOT00000043498 |
Il1rap
|
interleukin 1 receptor accessory protein |
| chr14_+_11095163 | 3.14 |
ENSRNOT00000003076
|
Tmem150c
|
transmembrane protein 150C |
| chr2_+_189106039 | 3.06 |
ENSRNOT00000028210
|
Ube2q1
|
ubiquitin conjugating enzyme E2 Q1 |
| chr1_+_85162452 | 3.01 |
ENSRNOT00000093347
|
Pak4
|
p21 (RAC1) activated kinase 4 |
| chr1_-_219853329 | 3.00 |
ENSRNOT00000026169
|
Lrfn4
|
leucine rich repeat and fibronectin type III domain containing 4 |
| chr1_-_175676699 | 2.87 |
ENSRNOT00000030474
|
Lyve1
|
lymphatic vessel endothelial hyaluronan receptor 1 |
| chr16_-_7007287 | 2.81 |
ENSRNOT00000041216
|
Itih3
|
inter-alpha trypsin inhibitor, heavy chain 3 |
| chr10_-_37311625 | 2.75 |
ENSRNOT00000043343
|
Jade2
|
jade family PHD finger 2 |
| chr20_+_17750744 | 2.72 |
ENSRNOT00000000745
|
RGD1559903
|
similar to RIKEN cDNA 1700049L16 |
| chr8_+_130581062 | 2.71 |
ENSRNOT00000014323
|
Fam198a
|
family with sequence similarity 198, member A |
| chr8_+_116754178 | 2.65 |
ENSRNOT00000068295
ENSRNOT00000084429 |
Uba7
|
ubiquitin-like modifier activating enzyme 7 |
| chr7_-_30274984 | 2.65 |
ENSRNOT00000092527
ENSRNOT00000010207 |
Slc17a8
|
solute carrier family 17 member 8 |
| chr10_-_87529599 | 2.63 |
ENSRNOT00000074099
|
Krtap2-1
|
keratin associated protein 2-1 |
| chr18_+_30114708 | 2.55 |
ENSRNOT00000027343
|
Pcdha4
|
protocadherin alpha 4 |
| chr17_+_23135985 | 2.52 |
ENSRNOT00000090794
|
Nedd9
|
neural precursor cell expressed, developmentally down-regulated 9 |
| chr6_-_107080524 | 2.51 |
ENSRNOT00000011662
|
Zfyve1
|
zinc finger FYVE-type containing 1 |
| chr14_-_6369666 | 2.51 |
ENSRNOT00000093293
ENSRNOT00000093262 |
Zfp951
|
zinc finger protein 951 |
| chrX_-_82986051 | 2.50 |
ENSRNOT00000077587
|
Hdx
|
highly divergent homeobox |
| chr7_-_12601674 | 2.50 |
ENSRNOT00000093489
|
Arid3a
|
AT-rich interaction domain 3A |
| chr7_-_129724303 | 2.45 |
ENSRNOT00000006034
|
Brd1
|
bromodomain containing 1 |
| chr2_-_188645196 | 2.40 |
ENSRNOT00000083793
|
Efna3
|
ephrin A3 |
| chr12_-_38782010 | 2.36 |
ENSRNOT00000001813
|
Wdr66
|
WD repeat domain 66 |
| chr1_-_1474846 | 2.36 |
ENSRNOT00000028992
|
Raet1d
|
retinoic acid early transcript delta |
| chr9_-_81565416 | 2.29 |
ENSRNOT00000083582
|
Aamp
|
angio-associated, migratory cell protein |
| chr20_-_2211995 | 2.29 |
ENSRNOT00000077201
|
Trim26
|
tripartite motif-containing 26 |
| chr4_+_27175243 | 2.28 |
ENSRNOT00000009985
|
Cyp51
|
cytochrome P450, family 51 |
| chr1_-_127292090 | 2.13 |
ENSRNOT00000016959
|
Lrrk1
|
leucine-rich repeat kinase 1 |
| chr10_-_57309298 | 2.12 |
ENSRNOT00000056622
|
Camta2
|
calmodulin binding transcription activator 2 |
| chr1_+_166564664 | 2.10 |
ENSRNOT00000090959
|
Pde2a
|
phosphodiesterase 2A |
| chr7_-_12311149 | 2.07 |
ENSRNOT00000046886
|
Dazap1
|
DAZ associated protein 1 |
| chrX_+_65226748 | 2.06 |
ENSRNOT00000076181
|
Msn
|
moesin |
| chr7_-_115045802 | 2.00 |
ENSRNOT00000040236
ENSRNOT00000071818 |
Mroh5
|
maestro heat-like repeat family member 5 |
| chr11_+_68493035 | 1.96 |
ENSRNOT00000067984
|
Pdia5
|
protein disulfide isomerase family A, member 5 |
| chr15_+_19603288 | 1.96 |
ENSRNOT00000035491
|
LOC102552640
|
REST corepressor 2-like |
| chr20_-_7930929 | 1.92 |
ENSRNOT00000000607
|
Tead3
|
TEA domain transcription factor 3 |
| chr7_-_70476340 | 1.90 |
ENSRNOT00000006800
|
Arhgef25
|
Rho guanine nucleotide exchange factor 25 |
| chr10_+_43538160 | 1.85 |
ENSRNOT00000089217
|
Cnot8
|
CCR4-NOT transcription complex, subunit 8 |
| chr4_+_113910685 | 1.84 |
ENSRNOT00000011173
|
LOC103692167
|
polycomb group RING finger protein 1 |
| chr8_+_129201669 | 1.77 |
ENSRNOT00000025663
|
Entpd3
|
ectonucleoside triphosphate diphosphohydrolase 3 |
| chr1_-_184188911 | 1.76 |
ENSRNOT00000055124
ENSRNOT00000014948 |
Calca
|
calcitonin-related polypeptide alpha |
| chr19_-_29802083 | 1.67 |
ENSRNOT00000024755
|
AC123471.1
|
|
| chr1_-_101596822 | 1.62 |
ENSRNOT00000028490
|
Fgf21
|
fibroblast growth factor 21 |
| chr6_+_129052503 | 1.61 |
ENSRNOT00000044152
|
RGD1565462
|
similar to BC049975 protein |
| chr7_+_114724610 | 1.60 |
ENSRNOT00000014541
|
Dennd3
|
DENN domain containing 3 |
| chrX_+_115563038 | 1.54 |
ENSRNOT00000087859
|
Alg13
|
ALG13, UDP-N-acetylglucosaminyltransferase subunit |
| chr12_+_31934343 | 1.52 |
ENSRNOT00000011181
|
Tmem132d
|
transmembrane protein 132D |
| chr17_-_1093873 | 1.52 |
ENSRNOT00000086130
|
Ptch1
|
patched 1 |
| chr1_+_123015746 | 1.51 |
ENSRNOT00000013483
|
Magel2
|
MAGE family member L2 |
| chr4_+_114776797 | 1.49 |
ENSRNOT00000089635
|
LOC103692167
|
polycomb group RING finger protein 1 |
| chr1_-_170471076 | 1.43 |
ENSRNOT00000025159
|
Arfip2
|
ADP-ribosylation factor interacting protein 2 |
| chr19_+_39063998 | 1.42 |
ENSRNOT00000081116
|
Has3
|
hyaluronan synthase 3 |
| chr1_-_98490315 | 1.38 |
ENSRNOT00000056490
|
Cldnd2
|
claudin domain containing 2 |
| chr10_+_40553180 | 1.37 |
ENSRNOT00000087763
|
Slc36a1
|
solute carrier family 36 member 1 |
| chr15_+_57505449 | 1.36 |
ENSRNOT00000064945
|
Siah3
|
siah E3 ubiquitin protein ligase family member 3 |
| chr17_+_89742140 | 1.34 |
ENSRNOT00000077899
|
Mastl
|
microtubule associated serine/threonine kinase-like |
| chr5_-_64674250 | 1.29 |
ENSRNOT00000089232
|
Acnat2
|
acyl-coenzyme A amino acid N-acyltransferase 2 |
| chr10_-_49196177 | 1.28 |
ENSRNOT00000084418
|
Zfp286a
|
zinc finger protein 286A |
| chr15_+_34520142 | 1.21 |
ENSRNOT00000074659
|
Nynrin
|
NYN domain and retroviral integrase containing |
| chr12_-_47793534 | 1.13 |
ENSRNOT00000001588
|
Fam222a
|
family with sequence similarity 222, member A |
| chr13_-_89661150 | 1.12 |
ENSRNOT00000058390
|
Usp21
|
ubiquitin specific peptidase 21 |
| chr6_-_107325345 | 1.11 |
ENSRNOT00000049481
ENSRNOT00000042594 ENSRNOT00000013026 |
Numb
|
NUMB, endocytic adaptor protein |
| chr5_-_144436509 | 1.09 |
ENSRNOT00000042371
|
Ago3
|
argonaute 3, RISC catalytic component |
| chr11_-_89260297 | 1.08 |
ENSRNOT00000057502
|
Spidr
|
scaffolding protein involved in DNA repair |
| chr3_-_148312791 | 1.08 |
ENSRNOT00000091419
|
Bcl2l1
|
Bcl2-like 1 |
| chr8_+_132120452 | 1.06 |
ENSRNOT00000055822
|
Tgm4
|
transglutaminase 4 |
| chr1_-_213745748 | 1.05 |
ENSRNOT00000020023
|
Ifitm5
|
interferon induced transmembrane protein 5 |
| chr1_+_177193735 | 1.04 |
ENSRNOT00000043017
|
Micalcl
|
MICAL C-terminal like |
| chr3_+_149424392 | 1.04 |
ENSRNOT00000044574
|
Bpifb4
|
BPI fold containing family B, member 4 |
| chr3_-_72289310 | 1.03 |
ENSRNOT00000038250
|
Rtn4rl2
|
reticulon 4 receptor-like 2 |
| chr10_-_70202398 | 1.03 |
ENSRNOT00000076089
|
Rffl
|
ring finger and FYVE-like domain containing E3 ubiquitin protein ligase |
| chr3_+_143119687 | 1.01 |
ENSRNOT00000006608
|
Cst12
|
cystatin 12 |
| chr9_-_19372673 | 0.99 |
ENSRNOT00000073667
ENSRNOT00000079517 |
Clic5
|
chloride intracellular channel 5 |
| chr20_+_5442390 | 0.96 |
ENSRNOT00000037499
|
Rps18
|
ribosomal protein S18 |
| chr20_-_10257044 | 0.95 |
ENSRNOT00000068289
|
Wdr4
|
WD repeat domain 4 |
| chr10_+_72486152 | 0.91 |
ENSRNOT00000004193
|
RGD1310166
|
similar to Chromodomain-helicase-DNA-binding protein 1 (CHD-1) |
| chr10_-_75120247 | 0.90 |
ENSRNOT00000011402
|
Lpo
|
lactoperoxidase |
| chr10_+_35637133 | 0.90 |
ENSRNOT00000043085
|
Tbc1d9b
|
TBC1 domain family member 9B |
| chr4_-_7885301 | 0.89 |
ENSRNOT00000035034
|
Rint1
|
RAD50 interactor 1 |
| chr3_-_93734282 | 0.86 |
ENSRNOT00000012428
|
Caprin1
|
cell cycle associated protein 1 |
| chr16_-_23156962 | 0.82 |
ENSRNOT00000018543
|
Sh2d4a
|
SH2 domain containing 4A |
| chr2_+_196139755 | 0.80 |
ENSRNOT00000040501
|
Pi4kb
|
phosphatidylinositol 4-kinase beta |
| chr11_+_54137639 | 0.79 |
ENSRNOT00000066343
|
LOC100909977
|
leukocyte surface antigen CD47-like |
| chr16_-_2048292 | 0.75 |
ENSRNOT00000061883
|
Zcchc24
|
zinc finger CCHC-type containing 24 |
| chr3_-_176865103 | 0.74 |
ENSRNOT00000019038
|
Arfrp1
|
ADP-ribosylation factor related protein 1 |
| chr1_-_83418777 | 0.73 |
ENSRNOT00000049175
|
Cyp2b21
|
cytochrome P450, family 2, subfamily b, polypeptide 21 |
| chr10_-_85938085 | 0.72 |
ENSRNOT00000043561
|
Plxdc1
|
plexin domain containing 1 |
| chr19_-_52750307 | 0.70 |
ENSRNOT00000023405
|
Zdhhc7
|
zinc finger, DHHC-type containing 7 |
| chrX_+_65566047 | 0.69 |
ENSRNOT00000092103
|
Heph
|
hephaestin |
| chr17_+_56935451 | 0.67 |
ENSRNOT00000058966
|
RGD1564129
|
similar to hypothetical protein 4930474N05 |
| chr6_-_25507073 | 0.67 |
ENSRNOT00000061176
|
Plb1
|
phospholipase B1 |
| chr3_-_164964702 | 0.65 |
ENSRNOT00000014595
|
Adnp
|
activity-dependent neuroprotector homeobox |
| chr5_-_50221095 | 0.65 |
ENSRNOT00000012164
|
RGD1563056
|
similar to hypothetical protein |
| chr18_+_15738809 | 0.65 |
ENSRNOT00000075444
|
Mapre2
|
microtubule-associated protein, RP/EB family, member 2 |
| chr20_-_5441706 | 0.55 |
ENSRNOT00000000549
|
Vps52
|
VPS52 GARP complex subunit |
| chr5_+_138470069 | 0.48 |
ENSRNOT00000076343
ENSRNOT00000064073 |
Zmynd12
|
zinc finger, MYND-type containing 12 |
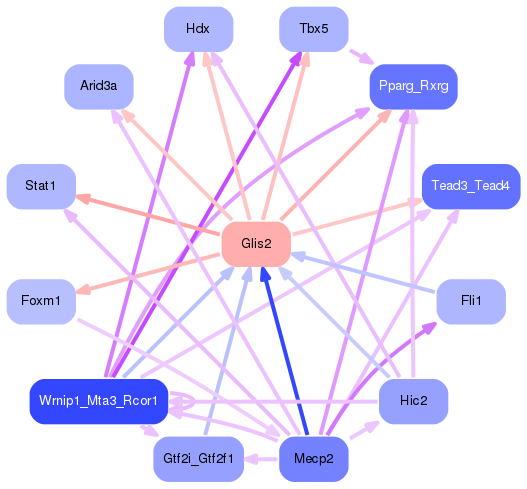
Network of associatons between targets according to the STRING database.

First level regulatory network of Glis2
Gene Ontology Analysis
Gene overrepresentation in biological process category:
| Log-likelihood per target | Total log-likelihood | Term | Description |
|---|---|---|---|
| 5.6 | 16.9 | GO:0002572 | pro-T cell differentiation(GO:0002572) |
| 3.6 | 14.3 | GO:0034240 | negative regulation of macrophage fusion(GO:0034240) |
| 3.0 | 9.1 | GO:2000230 | negative regulation of pancreatic stellate cell proliferation(GO:2000230) |
| 3.0 | 8.9 | GO:0009082 | branched-chain amino acid biosynthetic process(GO:0009082) leucine biosynthetic process(GO:0009098) valine biosynthetic process(GO:0009099) |
| 2.7 | 8.2 | GO:0034499 | late endosome to Golgi transport(GO:0034499) |
| 2.7 | 16.1 | GO:0014053 | negative regulation of gamma-aminobutyric acid secretion(GO:0014053) |
| 2.7 | 8.0 | GO:2000464 | positive regulation of astrocyte chemotaxis(GO:2000464) |
| 2.6 | 15.8 | GO:0038170 | somatostatin receptor signaling pathway(GO:0038169) somatostatin signaling pathway(GO:0038170) |
| 2.6 | 7.9 | GO:1900126 | negative regulation of hyaluronan biosynthetic process(GO:1900126) |
| 2.6 | 15.6 | GO:0061737 | leukotriene signaling pathway(GO:0061737) |
| 2.2 | 6.6 | GO:0021550 | neuroblast differentiation(GO:0014016) spinal cord oligodendrocyte cell differentiation(GO:0021529) spinal cord oligodendrocyte cell fate specification(GO:0021530) medulla oblongata development(GO:0021550) musculoskeletal movement, spinal reflex action(GO:0050883) olfactory pit development(GO:0060166) |
| 1.9 | 5.8 | GO:0055073 | cadmium ion homeostasis(GO:0055073) |
| 1.7 | 6.8 | GO:0036135 | Schwann cell migration(GO:0036135) regulation of Schwann cell migration(GO:1900147) |
| 1.6 | 6.5 | GO:2000860 | positive regulation of mineralocorticoid secretion(GO:2000857) positive regulation of aldosterone secretion(GO:2000860) |
| 1.4 | 6.9 | GO:0048022 | negative regulation of melanin biosynthetic process(GO:0048022) negative regulation of secondary metabolite biosynthetic process(GO:1900377) |
| 1.3 | 9.2 | GO:0032489 | regulation of Cdc42 protein signal transduction(GO:0032489) |
| 1.3 | 6.4 | GO:0002317 | plasma cell differentiation(GO:0002317) |
| 1.3 | 9.0 | GO:2000483 | negative regulation of interleukin-8 secretion(GO:2000483) |
| 1.3 | 3.8 | GO:1905065 | positive regulation of vascular smooth muscle cell differentiation(GO:1905065) |
| 1.2 | 7.3 | GO:0051365 | cellular response to potassium ion starvation(GO:0051365) |
| 1.1 | 4.4 | GO:0035494 | SNARE complex disassembly(GO:0035494) |
| 1.1 | 3.2 | GO:0038172 | interleukin-33-mediated signaling pathway(GO:0038172) |
| 1.0 | 10.4 | GO:0032959 | inositol trisphosphate biosynthetic process(GO:0032959) |
| 1.0 | 8.8 | GO:0021769 | orbitofrontal cortex development(GO:0021769) |
| 0.9 | 9.2 | GO:0018095 | protein polyglutamylation(GO:0018095) |
| 0.8 | 6.8 | GO:2000427 | positive regulation of apoptotic cell clearance(GO:2000427) |
| 0.8 | 4.6 | GO:0072513 | bundle of His development(GO:0003166) positive regulation of secondary heart field cardioblast proliferation(GO:0072513) |
| 0.7 | 3.7 | GO:1903336 | negative regulation of vacuolar transport(GO:1903336) |
| 0.7 | 8.0 | GO:0035871 | protein K11-linked deubiquitination(GO:0035871) |
| 0.7 | 15.0 | GO:2000251 | positive regulation of actin cytoskeleton reorganization(GO:2000251) |
| 0.7 | 3.4 | GO:0021747 | cochlear nucleus development(GO:0021747) |
| 0.7 | 4.6 | GO:0060315 | negative regulation of ryanodine-sensitive calcium-release channel activity(GO:0060315) |
| 0.6 | 1.8 | GO:0043928 | exonucleolytic nuclear-transcribed mRNA catabolic process involved in deadenylation-dependent decay(GO:0043928) |
| 0.6 | 8.4 | GO:1904321 | response to forskolin(GO:1904321) cellular response to forskolin(GO:1904322) |
| 0.6 | 4.7 | GO:0008616 | queuosine biosynthetic process(GO:0008616) queuosine metabolic process(GO:0046116) |
| 0.6 | 1.8 | GO:0001983 | baroreceptor response to increased systemic arterial blood pressure(GO:0001983) |
| 0.6 | 3.5 | GO:0002457 | T cell antigen processing and presentation(GO:0002457) dsRNA transport(GO:0033227) |
| 0.5 | 7.0 | GO:0098719 | sodium ion import across plasma membrane(GO:0098719) sodium ion import into cell(GO:1990118) |
| 0.5 | 2.7 | GO:0032020 | ISG15-protein conjugation(GO:0032020) |
| 0.5 | 6.3 | GO:0033601 | positive regulation of mammary gland epithelial cell proliferation(GO:0033601) |
| 0.5 | 8.8 | GO:2000781 | positive regulation of double-strand break repair(GO:2000781) |
| 0.5 | 5.1 | GO:0000012 | single strand break repair(GO:0000012) |
| 0.5 | 1.5 | GO:0021997 | neural plate axis specification(GO:0021997) |
| 0.5 | 9.8 | GO:0097284 | hepatocyte apoptotic process(GO:0097284) |
| 0.5 | 13.8 | GO:0009214 | cyclic nucleotide catabolic process(GO:0009214) |
| 0.5 | 5.9 | GO:0045198 | establishment of epithelial cell apical/basal polarity(GO:0045198) |
| 0.4 | 3.1 | GO:0070459 | prolactin secretion(GO:0070459) |
| 0.4 | 3.8 | GO:1903377 | negative regulation of oxidative stress-induced neuron intrinsic apoptotic signaling pathway(GO:1903377) |
| 0.4 | 1.6 | GO:1904640 | response to methionine(GO:1904640) |
| 0.4 | 4.0 | GO:0070317 | negative regulation of G0 to G1 transition(GO:0070317) |
| 0.4 | 7.5 | GO:0019886 | antigen processing and presentation of exogenous peptide antigen via MHC class II(GO:0019886) |
| 0.4 | 4.2 | GO:0010603 | deadenylation-dependent decapping of nuclear-transcribed mRNA(GO:0000290) regulation of cytoplasmic mRNA processing body assembly(GO:0010603) |
| 0.4 | 15.6 | GO:0050853 | B cell receptor signaling pathway(GO:0050853) |
| 0.4 | 1.1 | GO:0021849 | neuroblast division in subventricular zone(GO:0021849) |
| 0.4 | 11.8 | GO:0006958 | complement activation, classical pathway(GO:0006958) |
| 0.4 | 9.0 | GO:0051444 | negative regulation of ubiquitin-protein transferase activity(GO:0051444) |
| 0.4 | 1.4 | GO:1900104 | hyaluranon cable assembly(GO:0036118) extracellular polysaccharide biosynthetic process(GO:0045226) extracellular polysaccharide metabolic process(GO:0046379) regulation of hyaluranon cable assembly(GO:1900104) positive regulation of hyaluranon cable assembly(GO:1900106) |
| 0.3 | 10.0 | GO:1903861 | positive regulation of dendrite extension(GO:1903861) |
| 0.3 | 5.8 | GO:0046597 | negative regulation of viral entry into host cell(GO:0046597) |
| 0.3 | 6.0 | GO:0006656 | phosphatidylcholine biosynthetic process(GO:0006656) |
| 0.3 | 12.5 | GO:0010972 | negative regulation of G2/M transition of mitotic cell cycle(GO:0010972) |
| 0.3 | 6.8 | GO:0002115 | store-operated calcium entry(GO:0002115) |
| 0.3 | 4.4 | GO:0016075 | rRNA catabolic process(GO:0016075) |
| 0.3 | 7.2 | GO:0048172 | regulation of short-term neuronal synaptic plasticity(GO:0048172) |
| 0.3 | 1.1 | GO:0090625 | mRNA cleavage involved in gene silencing by siRNA(GO:0090625) |
| 0.3 | 2.8 | GO:0043983 | histone H4-K12 acetylation(GO:0043983) |
| 0.2 | 1.2 | GO:0015074 | DNA integration(GO:0015074) |
| 0.2 | 1.4 | GO:0015808 | L-alanine transport(GO:0015808) |
| 0.2 | 1.4 | GO:1903215 | negative regulation of protein targeting to mitochondrion(GO:1903215) |
| 0.2 | 8.8 | GO:1902475 | L-alpha-amino acid transmembrane transport(GO:1902475) |
| 0.2 | 6.2 | GO:0045671 | negative regulation of osteoclast differentiation(GO:0045671) |
| 0.2 | 1.1 | GO:0042628 | mating plug formation(GO:0042628) post-mating behavior(GO:0045297) |
| 0.2 | 10.5 | GO:0045494 | photoreceptor cell maintenance(GO:0045494) |
| 0.2 | 1.8 | GO:0009134 | nucleoside diphosphate catabolic process(GO:0009134) |
| 0.2 | 1.9 | GO:0055059 | asymmetric neuroblast division(GO:0055059) |
| 0.2 | 1.3 | GO:1904668 | regulation of ubiquitin protein ligase activity(GO:1904666) positive regulation of ubiquitin protein ligase activity(GO:1904668) |
| 0.2 | 5.0 | GO:0034340 | response to type I interferon(GO:0034340) |
| 0.2 | 6.6 | GO:0048791 | calcium ion-regulated exocytosis of neurotransmitter(GO:0048791) |
| 0.2 | 1.0 | GO:2001271 | negative regulation of cysteine-type endopeptidase activity involved in execution phase of apoptosis(GO:2001271) |
| 0.2 | 2.1 | GO:0036035 | osteoclast development(GO:0036035) |
| 0.2 | 11.3 | GO:0051965 | positive regulation of synapse assembly(GO:0051965) |
| 0.2 | 9.5 | GO:0007157 | heterophilic cell-cell adhesion via plasma membrane cell adhesion molecules(GO:0007157) |
| 0.2 | 1.5 | GO:0006488 | dolichol-linked oligosaccharide biosynthetic process(GO:0006488) |
| 0.1 | 6.4 | GO:0032467 | positive regulation of cytokinesis(GO:0032467) |
| 0.1 | 2.9 | GO:0006027 | glycosaminoglycan catabolic process(GO:0006027) |
| 0.1 | 1.0 | GO:0060088 | auditory receptor cell stereocilium organization(GO:0060088) |
| 0.1 | 4.3 | GO:0006817 | phosphate ion transport(GO:0006817) |
| 0.1 | 2.3 | GO:0045540 | regulation of cholesterol biosynthetic process(GO:0045540) |
| 0.1 | 2.1 | GO:0048026 | positive regulation of mRNA splicing, via spliceosome(GO:0048026) |
| 0.1 | 3.6 | GO:0021696 | cerebellar cortex morphogenesis(GO:0021696) |
| 0.1 | 3.5 | GO:0045071 | negative regulation of viral genome replication(GO:0045071) |
| 0.1 | 2.1 | GO:0003299 | muscle hypertrophy in response to stress(GO:0003299) cardiac muscle hypertrophy in response to stress(GO:0014898) |
| 0.1 | 4.2 | GO:0000245 | spliceosomal complex assembly(GO:0000245) regulation of alternative mRNA splicing, via spliceosome(GO:0000381) |
| 0.1 | 0.7 | GO:0018231 | peptidyl-L-cysteine S-palmitoylation(GO:0018230) peptidyl-S-diacylglycerol-L-cysteine biosynthetic process from peptidyl-cysteine(GO:0018231) |
| 0.1 | 9.1 | GO:0007127 | meiosis I(GO:0007127) |
| 0.1 | 0.7 | GO:2000344 | positive regulation of acrosome reaction(GO:2000344) |
| 0.1 | 1.0 | GO:0022038 | corpus callosum development(GO:0022038) |
| 0.1 | 2.4 | GO:0048013 | ephrin receptor signaling pathway(GO:0048013) |
| 0.1 | 0.5 | GO:0010668 | ectodermal cell differentiation(GO:0010668) |
| 0.1 | 4.8 | GO:0010923 | negative regulation of phosphatase activity(GO:0010923) |
| 0.1 | 2.5 | GO:0035902 | response to immobilization stress(GO:0035902) |
| 0.1 | 0.9 | GO:0061003 | positive regulation of dendritic spine morphogenesis(GO:0061003) |
| 0.1 | 5.7 | GO:0051321 | meiotic cell cycle(GO:0051321) |
| 0.1 | 1.1 | GO:0016578 | histone deubiquitination(GO:0016578) |
| 0.1 | 6.0 | GO:0007612 | learning(GO:0007612) |
| 0.0 | 3.0 | GO:0060996 | dendritic spine development(GO:0060996) |
| 0.0 | 3.7 | GO:0007093 | mitotic cell cycle checkpoint(GO:0007093) |
| 0.0 | 3.9 | GO:0016575 | histone deacetylation(GO:0016575) |
| 0.0 | 8.2 | GO:0030534 | adult behavior(GO:0030534) |
| 0.0 | 1.5 | GO:0070534 | protein K63-linked ubiquitination(GO:0070534) |
| 0.0 | 0.1 | GO:0036265 | RNA (guanine-N7)-methylation(GO:0036265) |
| 0.0 | 0.7 | GO:0006825 | copper ion transport(GO:0006825) |
| 0.0 | 0.9 | GO:0001580 | detection of chemical stimulus involved in sensory perception of bitter taste(GO:0001580) |
| 0.0 | 1.6 | GO:0008333 | endosome to lysosome transport(GO:0008333) |
| 0.0 | 2.0 | GO:0045454 | cell redox homeostasis(GO:0045454) |
| 0.0 | 2.3 | GO:0042273 | ribosomal large subunit biogenesis(GO:0042273) |
| 0.0 | 1.4 | GO:0031529 | ruffle organization(GO:0031529) |
| 0.0 | 0.4 | GO:0030212 | hyaluronan metabolic process(GO:0030212) |
| 0.0 | 0.7 | GO:0019373 | epoxygenase P450 pathway(GO:0019373) |
| 0.0 | 7.7 | GO:0043161 | proteasome-mediated ubiquitin-dependent protein catabolic process(GO:0043161) |
| 0.0 | 0.8 | GO:0046854 | phosphatidylinositol phosphorylation(GO:0046854) |
| 0.0 | 2.6 | GO:0042476 | odontogenesis(GO:0042476) |
| 0.0 | 0.9 | GO:0031338 | regulation of vesicle fusion(GO:0031338) |
| 0.0 | 1.3 | GO:0006637 | acyl-CoA metabolic process(GO:0006637) thioester metabolic process(GO:0035383) |
| 0.0 | 0.2 | GO:0042136 | neurotransmitter biosynthetic process(GO:0042136) |
| 0.0 | 1.0 | GO:0030282 | bone mineralization(GO:0030282) |
| 0.0 | 0.7 | GO:0042147 | retrograde transport, endosome to Golgi(GO:0042147) |
| 0.0 | 3.2 | GO:0007265 | Ras protein signal transduction(GO:0007265) |
Gene overrepresentation in cellular component category:
| Log-likelihood per target | Total log-likelihood | Term | Description |
|---|---|---|---|
| 5.4 | 16.1 | GO:0038039 | G-protein coupled receptor heterodimeric complex(GO:0038039) |
| 1.9 | 5.8 | GO:0070821 | tertiary granule membrane(GO:0070821) |
| 1.4 | 6.8 | GO:0045098 | type III intermediate filament(GO:0045098) |
| 1.3 | 11.7 | GO:0035749 | myelin sheath adaxonal region(GO:0035749) |
| 1.3 | 6.4 | GO:0016939 | kinesin II complex(GO:0016939) |
| 1.0 | 14.5 | GO:0042622 | photoreceptor outer segment membrane(GO:0042622) |
| 1.0 | 14.3 | GO:0001931 | uropod(GO:0001931) cell trailing edge(GO:0031254) |
| 0.8 | 2.5 | GO:0097629 | extrinsic component of omegasome membrane(GO:0097629) |
| 0.7 | 4.4 | GO:0070044 | synaptobrevin 2-SNAP-25-syntaxin-1a complex(GO:0070044) |
| 0.7 | 2.1 | GO:0044302 | dentate gyrus mossy fiber(GO:0044302) |
| 0.7 | 19.6 | GO:0042629 | mast cell granule(GO:0042629) |
| 0.7 | 8.8 | GO:0005885 | Arp2/3 protein complex(GO:0005885) |
| 0.7 | 2.7 | GO:0097451 | glial limiting end-foot(GO:0097451) |
| 0.5 | 3.8 | GO:0042382 | paraspeckles(GO:0042382) |
| 0.5 | 1.4 | GO:0036117 | hyaluranon cable(GO:0036117) |
| 0.5 | 7.5 | GO:0042613 | MHC class II protein complex(GO:0042613) |
| 0.5 | 3.7 | GO:0097443 | sorting endosome(GO:0097443) |
| 0.4 | 4.0 | GO:0000805 | X chromosome(GO:0000805) |
| 0.4 | 1.5 | GO:0043541 | UDP-N-acetylglucosamine transferase complex(GO:0043541) |
| 0.4 | 15.8 | GO:0060170 | ciliary membrane(GO:0060170) |
| 0.3 | 6.8 | GO:0044217 | other organism(GO:0044215) other organism cell(GO:0044216) other organism part(GO:0044217) |
| 0.3 | 0.9 | GO:0070939 | Dsl1p complex(GO:0070939) |
| 0.3 | 9.1 | GO:0045334 | clathrin-coated endocytic vesicle(GO:0045334) |
| 0.3 | 8.7 | GO:0034451 | centriolar satellite(GO:0034451) |
| 0.3 | 10.6 | GO:0044295 | axonal growth cone(GO:0044295) |
| 0.3 | 1.0 | GO:0002947 | tumor necrosis factor receptor superfamily complex(GO:0002947) |
| 0.2 | 2.5 | GO:0070775 | H3 histone acetyltransferase complex(GO:0070775) MOZ/MORF histone acetyltransferase complex(GO:0070776) |
| 0.2 | 0.9 | GO:0043527 | tRNA methyltransferase complex(GO:0043527) |
| 0.2 | 7.2 | GO:0032281 | AMPA glutamate receptor complex(GO:0032281) |
| 0.2 | 15.3 | GO:0000786 | nucleosome(GO:0000786) |
| 0.2 | 1.1 | GO:0035068 | micro-ribonucleoprotein complex(GO:0035068) |
| 0.2 | 1.1 | GO:0097136 | Bcl-2 family protein complex(GO:0097136) |
| 0.1 | 0.5 | GO:1990745 | GARP complex(GO:0000938) EARP complex(GO:1990745) |
| 0.1 | 4.6 | GO:0033017 | sarcoplasmic reticulum membrane(GO:0033017) |
| 0.1 | 3.6 | GO:0005719 | nuclear euchromatin(GO:0005719) |
| 0.1 | 12.5 | GO:0005913 | cell-cell adherens junction(GO:0005913) |
| 0.1 | 12.8 | GO:0005901 | caveola(GO:0005901) |
| 0.1 | 8.8 | GO:0019005 | SCF ubiquitin ligase complex(GO:0019005) |
| 0.1 | 8.2 | GO:0045335 | phagocytic vesicle(GO:0045335) |
| 0.1 | 37.8 | GO:0009897 | external side of plasma membrane(GO:0009897) |
| 0.1 | 6.9 | GO:0030139 | endocytic vesicle(GO:0030139) |
| 0.1 | 14.6 | GO:0090575 | RNA polymerase II transcription factor complex(GO:0090575) |
| 0.1 | 7.9 | GO:0005902 | microvillus(GO:0005902) |
| 0.1 | 4.4 | GO:0032420 | stereocilium(GO:0032420) |
| 0.1 | 1.8 | GO:0030014 | CCR4-NOT complex(GO:0030014) |
| 0.1 | 20.2 | GO:0043209 | myelin sheath(GO:0043209) |
| 0.1 | 7.2 | GO:0045095 | keratin filament(GO:0045095) |
| 0.1 | 6.6 | GO:0030672 | synaptic vesicle membrane(GO:0030672) exocytic vesicle membrane(GO:0099501) |
| 0.1 | 6.0 | GO:0005643 | nuclear pore(GO:0005643) |
| 0.1 | 8.7 | GO:0005814 | centriole(GO:0005814) |
| 0.1 | 1.4 | GO:0032588 | trans-Golgi network membrane(GO:0032588) |
| 0.1 | 2.3 | GO:0030687 | preribosome, large subunit precursor(GO:0030687) |
| 0.1 | 3.7 | GO:0000777 | condensed chromosome kinetochore(GO:0000777) |
| 0.1 | 4.2 | GO:0008076 | voltage-gated potassium channel complex(GO:0008076) |
| 0.1 | 1.5 | GO:0030904 | retromer complex(GO:0030904) |
| 0.1 | 30.4 | GO:0030424 | axon(GO:0030424) |
| 0.1 | 5.1 | GO:0000932 | cytoplasmic mRNA processing body(GO:0000932) |
| 0.1 | 1.3 | GO:0032154 | cleavage furrow(GO:0032154) cell surface furrow(GO:0097610) |
| 0.0 | 4.3 | GO:0045111 | intermediate filament cytoskeleton(GO:0045111) |
| 0.0 | 2.1 | GO:0005844 | polysome(GO:0005844) |
| 0.0 | 7.0 | GO:0098857 | membrane raft(GO:0045121) membrane microdomain(GO:0098857) |
| 0.0 | 0.6 | GO:0035371 | microtubule plus-end(GO:0035371) |
| 0.0 | 0.8 | GO:0030867 | rough endoplasmic reticulum membrane(GO:0030867) |
| 0.0 | 8.4 | GO:0005667 | transcription factor complex(GO:0005667) |
| 0.0 | 1.7 | GO:0000123 | histone acetyltransferase complex(GO:0000123) |
| 0.0 | 0.4 | GO:0030131 | clathrin adaptor complex(GO:0030131) |
| 0.0 | 1.1 | GO:0030136 | clathrin-coated vesicle(GO:0030136) |
| 0.0 | 2.0 | GO:0005788 | endoplasmic reticulum lumen(GO:0005788) |
| 0.0 | 23.6 | GO:0005730 | nucleolus(GO:0005730) |
| 0.0 | 2.5 | GO:0000922 | spindle pole(GO:0000922) |
| 0.0 | 4.7 | GO:0005765 | lysosomal membrane(GO:0005765) lytic vacuole membrane(GO:0098852) |
| 0.0 | 4.2 | GO:0005681 | spliceosomal complex(GO:0005681) |
| 0.0 | 1.0 | GO:0022627 | cytosolic small ribosomal subunit(GO:0022627) |
Gene overrepresentation in molecular function category:
| Log-likelihood per target | Total log-likelihood | Term | Description |
|---|---|---|---|
| 4.0 | 16.1 | GO:0004965 | G-protein coupled GABA receptor activity(GO:0004965) |
| 3.1 | 15.6 | GO:0004974 | leukotriene receptor activity(GO:0004974) |
| 3.0 | 8.9 | GO:0004084 | branched-chain-amino-acid transaminase activity(GO:0004084) L-leucine transaminase activity(GO:0052654) L-valine transaminase activity(GO:0052655) L-isoleucine transaminase activity(GO:0052656) |
| 2.7 | 8.0 | GO:0071791 | chemokine (C-C motif) ligand 5 binding(GO:0071791) |
| 2.6 | 15.8 | GO:0004994 | somatostatin receptor activity(GO:0004994) |
| 2.4 | 7.3 | GO:0047783 | steroid 11-beta-monooxygenase activity(GO:0004507) corticosterone 18-monooxygenase activity(GO:0047783) |
| 2.2 | 6.5 | GO:0001716 | L-amino-acid oxidase activity(GO:0001716) |
| 1.6 | 7.9 | GO:0034714 | type III transforming growth factor beta receptor binding(GO:0034714) |
| 1.5 | 4.4 | GO:0005483 | soluble NSF attachment protein activity(GO:0005483) |
| 1.4 | 4.3 | GO:0052724 | inositol hexakisphosphate 1-kinase activity(GO:0052723) inositol hexakisphosphate 3-kinase activity(GO:0052724) |
| 1.4 | 6.8 | GO:1990254 | keratin filament binding(GO:1990254) |
| 1.3 | 9.1 | GO:0050692 | DBD domain binding(GO:0050692) |
| 1.2 | 14.3 | GO:0031730 | CCR5 chemokine receptor binding(GO:0031730) |
| 1.2 | 6.9 | GO:0031697 | beta-1 adrenergic receptor binding(GO:0031697) |
| 1.1 | 3.2 | GO:0002114 | interleukin-33 receptor activity(GO:0002114) |
| 1.0 | 3.9 | GO:0071936 | coreceptor activity involved in Wnt signaling pathway(GO:0071936) |
| 1.0 | 6.8 | GO:0001849 | complement component C1q binding(GO:0001849) |
| 0.8 | 8.4 | GO:0005004 | GPI-linked ephrin receptor activity(GO:0005004) |
| 0.8 | 3.3 | GO:0004594 | pantothenate kinase activity(GO:0004594) |
| 0.7 | 9.2 | GO:0030215 | semaphorin receptor binding(GO:0030215) |
| 0.7 | 7.0 | GO:0015386 | potassium:proton antiporter activity(GO:0015386) |
| 0.6 | 4.7 | GO:0008479 | queuine tRNA-ribosyltransferase activity(GO:0008479) |
| 0.6 | 5.8 | GO:0005384 | manganese ion transmembrane transporter activity(GO:0005384) |
| 0.6 | 11.7 | GO:0098641 | cadherin binding involved in cell-cell adhesion(GO:0098641) |
| 0.5 | 2.1 | GO:0036004 | GAF domain binding(GO:0036004) |
| 0.5 | 25.2 | GO:0001784 | phosphotyrosine binding(GO:0001784) |
| 0.5 | 12.5 | GO:0035259 | glucocorticoid receptor binding(GO:0035259) |
| 0.5 | 4.6 | GO:0034713 | type I transforming growth factor beta receptor binding(GO:0034713) |
| 0.5 | 1.5 | GO:0005119 | smoothened binding(GO:0005119) |
| 0.5 | 15.8 | GO:0042169 | SH2 domain binding(GO:0042169) |
| 0.5 | 3.8 | GO:0004716 | receptor signaling protein tyrosine kinase activity(GO:0004716) |
| 0.5 | 1.4 | GO:0005302 | L-tyrosine transmembrane transporter activity(GO:0005302) |
| 0.4 | 6.8 | GO:0015279 | store-operated calcium channel activity(GO:0015279) |
| 0.4 | 3.5 | GO:0001730 | 2'-5'-oligoadenylate synthetase activity(GO:0001730) |
| 0.4 | 11.7 | GO:0004112 | cyclic-nucleotide phosphodiesterase activity(GO:0004112) |
| 0.3 | 9.0 | GO:0003785 | actin monomer binding(GO:0003785) |
| 0.3 | 1.4 | GO:0050501 | hyaluronan synthase activity(GO:0050501) |
| 0.3 | 1.1 | GO:0019784 | NEDD8-specific protease activity(GO:0019784) |
| 0.3 | 9.5 | GO:0005158 | insulin receptor binding(GO:0005158) |
| 0.2 | 2.7 | GO:0008641 | small protein activating enzyme activity(GO:0008641) |
| 0.2 | 4.2 | GO:0005070 | SH3/SH2 adaptor activity(GO:0005070) |
| 0.2 | 0.7 | GO:0050253 | retinyl-palmitate esterase activity(GO:0050253) |
| 0.2 | 2.1 | GO:0035613 | RNA stem-loop binding(GO:0035613) |
| 0.2 | 6.6 | GO:0043425 | bHLH transcription factor binding(GO:0043425) |
| 0.2 | 3.6 | GO:0005537 | mannose binding(GO:0005537) |
| 0.2 | 10.0 | GO:0001786 | phosphatidylserine binding(GO:0001786) |
| 0.2 | 7.5 | GO:0042605 | peptide antigen binding(GO:0042605) |
| 0.2 | 1.1 | GO:0051434 | BH3 domain binding(GO:0051434) |
| 0.2 | 12.4 | GO:0030295 | protein kinase activator activity(GO:0030295) |
| 0.2 | 2.7 | GO:0005313 | L-glutamate transmembrane transporter activity(GO:0005313) |
| 0.2 | 0.8 | GO:0004430 | 1-phosphatidylinositol 4-kinase activity(GO:0004430) |
| 0.1 | 2.0 | GO:0015037 | peptide disulfide oxidoreductase activity(GO:0015037) |
| 0.1 | 6.5 | GO:0005504 | fatty acid binding(GO:0005504) |
| 0.1 | 6.6 | GO:0005544 | calcium-dependent phospholipid binding(GO:0005544) |
| 0.1 | 3.4 | GO:0005452 | inorganic anion exchanger activity(GO:0005452) |
| 0.1 | 4.0 | GO:0004407 | histone deacetylase activity(GO:0004407) |
| 0.1 | 0.7 | GO:0016724 | ferroxidase activity(GO:0004322) oxidoreductase activity, oxidizing metal ions, oxygen as acceptor(GO:0016724) |
| 0.1 | 6.1 | GO:0015179 | L-amino acid transmembrane transporter activity(GO:0015179) |
| 0.1 | 1.8 | GO:0017110 | nucleoside-diphosphatase activity(GO:0017110) |
| 0.1 | 2.9 | GO:0005540 | hyaluronic acid binding(GO:0005540) |
| 0.1 | 2.4 | GO:0046875 | ephrin receptor binding(GO:0046875) |
| 0.1 | 1.8 | GO:0004535 | poly(A)-specific ribonuclease activity(GO:0004535) |
| 0.1 | 1.1 | GO:0003810 | protein-glutamine gamma-glutamyltransferase activity(GO:0003810) |
| 0.1 | 4.2 | GO:0005246 | calcium channel regulator activity(GO:0005246) |
| 0.1 | 8.0 | GO:0004843 | thiol-dependent ubiquitin-specific protease activity(GO:0004843) |
| 0.1 | 8.6 | GO:0005089 | Rho guanyl-nucleotide exchange factor activity(GO:0005089) |
| 0.1 | 3.1 | GO:0061631 | ubiquitin conjugating enzyme activity(GO:0061631) ubiquitin-like protein conjugating enzyme activity(GO:0061650) |
| 0.1 | 1.1 | GO:0045294 | alpha-catenin binding(GO:0045294) |
| 0.1 | 6.6 | GO:0003725 | double-stranded RNA binding(GO:0003725) |
| 0.1 | 15.5 | GO:0051015 | actin filament binding(GO:0051015) |
| 0.1 | 4.4 | GO:0004521 | endoribonuclease activity(GO:0004521) |
| 0.1 | 4.2 | GO:0015459 | potassium channel regulator activity(GO:0015459) |
| 0.1 | 5.1 | GO:0004527 | exonuclease activity(GO:0004527) |
| 0.1 | 1.3 | GO:0047617 | acyl-CoA hydrolase activity(GO:0047617) |
| 0.1 | 2.3 | GO:0016709 | oxidoreductase activity, acting on paired donors, with incorporation or reduction of molecular oxygen, NAD(P)H as one donor, and incorporation of one atom of oxygen(GO:0016709) |
| 0.1 | 1.7 | GO:0005184 | neuropeptide hormone activity(GO:0005184) |
| 0.1 | 1.6 | GO:0005104 | fibroblast growth factor receptor binding(GO:0005104) |
| 0.1 | 3.8 | GO:0000980 | RNA polymerase II distal enhancer sequence-specific DNA binding(GO:0000980) |
| 0.0 | 55.5 | GO:0008270 | zinc ion binding(GO:0008270) |
| 0.0 | 1.4 | GO:0030742 | GTP-dependent protein binding(GO:0030742) |
| 0.0 | 7.8 | GO:0004866 | endopeptidase inhibitor activity(GO:0004866) |
| 0.0 | 3.4 | GO:0003777 | microtubule motor activity(GO:0003777) |
| 0.0 | 1.6 | GO:0017112 | Rab guanyl-nucleotide exchange factor activity(GO:0017112) |
| 0.0 | 10.6 | GO:0030246 | carbohydrate binding(GO:0030246) |
| 0.0 | 1.0 | GO:0051019 | mitogen-activated protein kinase binding(GO:0051019) |
| 0.0 | 5.1 | GO:0017137 | Rab GTPase binding(GO:0017137) |
| 0.0 | 1.5 | GO:0008375 | acetylglucosaminyltransferase activity(GO:0008375) |
| 0.0 | 0.7 | GO:0019825 | oxygen binding(GO:0019825) |
| 0.0 | 2.3 | GO:0051082 | unfolded protein binding(GO:0051082) |
| 0.0 | 6.5 | GO:0003924 | GTPase activity(GO:0003924) |
| 0.0 | 0.7 | GO:0048487 | beta-tubulin binding(GO:0048487) |
| 0.0 | 0.9 | GO:0004601 | peroxidase activity(GO:0004601) |
| 0.0 | 7.6 | GO:0001228 | transcriptional activator activity, RNA polymerase II transcription regulatory region sequence-specific binding(GO:0001228) |
| 0.0 | 0.7 | GO:0019707 | protein-cysteine S-palmitoyltransferase activity(GO:0019706) protein-cysteine S-acyltransferase activity(GO:0019707) |
| 0.0 | 1.9 | GO:0001085 | RNA polymerase II transcription factor binding(GO:0001085) |
| 0.0 | 0.2 | GO:0009881 | photoreceptor activity(GO:0009881) |
| 0.0 | 1.0 | GO:0019843 | rRNA binding(GO:0019843) |
| 0.0 | 1.0 | GO:0004860 | protein kinase inhibitor activity(GO:0004860) |
| 0.0 | 0.1 | GO:0016423 | tRNA (guanine) methyltransferase activity(GO:0016423) |
| 0.0 | 1.0 | GO:0005254 | chloride channel activity(GO:0005254) |
| 0.0 | 0.4 | GO:0004712 | protein serine/threonine/tyrosine kinase activity(GO:0004712) |
Gene overrepresentation in curated gene sets: canonical pathways category:
| Log-likelihood per target | Total log-likelihood | Term | Description |
|---|---|---|---|
| 1.0 | 14.3 | ST INTERFERON GAMMA PATHWAY | Interferon gamma pathway. |
| 0.6 | 25.8 | PID EPHA FWDPATHWAY | EPHA forward signaling |
| 0.5 | 10.4 | PID AR NONGENOMIC PATHWAY | Nongenotropic Androgen signaling |
| 0.4 | 25.3 | PID FCER1 PATHWAY | Fc-epsilon receptor I signaling in mast cells |
| 0.4 | 7.9 | SA MMP CYTOKINE CONNECTION | Cytokines can induce activation of matrix metalloproteinases, which degrade extracellular matrix. |
| 0.4 | 24.6 | PID CASPASE PATHWAY | Caspase cascade in apoptosis |
| 0.4 | 13.0 | PID NETRIN PATHWAY | Netrin-mediated signaling events |
| 0.3 | 15.6 | PID ENDOTHELIN PATHWAY | Endothelins |
| 0.3 | 9.2 | PID MAPK TRK PATHWAY | Trk receptor signaling mediated by the MAPK pathway |
| 0.3 | 4.6 | PID ALK2 PATHWAY | ALK2 signaling events |
| 0.3 | 9.1 | PID WNT NONCANONICAL PATHWAY | Noncanonical Wnt signaling pathway |
| 0.2 | 5.6 | PID CDC42 REG PATHWAY | Regulation of CDC42 activity |
| 0.2 | 3.8 | PID CIRCADIAN PATHWAY | Circadian rhythm pathway |
| 0.2 | 11.8 | PID CDC42 PATHWAY | CDC42 signaling events |
| 0.2 | 8.0 | PID IL12 2PATHWAY | IL12-mediated signaling events |
| 0.2 | 3.2 | PID IL1 PATHWAY | IL1-mediated signaling events |
| 0.1 | 6.7 | PID RHOA REG PATHWAY | Regulation of RhoA activity |
| 0.1 | 5.5 | PID HEDGEHOG GLI PATHWAY | Hedgehog signaling events mediated by Gli proteins |
| 0.1 | 1.1 | SA PROGRAMMED CELL DEATH | Programmed cell death, or apoptosis, eliminates damaged or unneeded cells. |
| 0.1 | 3.8 | PID KIT PATHWAY | Signaling events mediated by Stem cell factor receptor (c-Kit) |
| 0.1 | 6.6 | PID HES HEY PATHWAY | Notch-mediated HES/HEY network |
| 0.1 | 2.1 | PID ER NONGENOMIC PATHWAY | Plasma membrane estrogen receptor signaling |
| 0.1 | 8.9 | PID MYC ACTIV PATHWAY | Validated targets of C-MYC transcriptional activation |
| 0.1 | 1.4 | PID ARF 3PATHWAY | Arf1 pathway |
| 0.0 | 1.0 | PID TNF PATHWAY | TNF receptor signaling pathway |
| 0.0 | 0.8 | PID FOXM1 PATHWAY | FOXM1 transcription factor network |
| 0.0 | 2.5 | PID P53 DOWNSTREAM PATHWAY | Direct p53 effectors |
| 0.0 | 0.8 | PID AVB3 INTEGRIN PATHWAY | Integrins in angiogenesis |
Gene overrepresentation in curated gene sets: REACTOME pathways category:
| Log-likelihood per target | Total log-likelihood | Term | Description |
|---|---|---|---|
| 1.6 | 8.0 | REACTOME BINDING AND ENTRY OF HIV VIRION | Genes involved in Binding and entry of HIV virion |
| 1.1 | 15.6 | REACTOME EICOSANOID LIGAND BINDING RECEPTORS | Genes involved in Eicosanoid ligand-binding receptors |
| 1.1 | 14.3 | REACTOME IL 6 SIGNALING | Genes involved in Interleukin-6 signaling |
| 1.1 | 14.9 | REACTOME REGULATION OF COMPLEMENT CASCADE | Genes involved in Regulation of Complement cascade |
| 0.8 | 9.5 | REACTOME SIGNAL ATTENUATION | Genes involved in Signal attenuation |
| 0.7 | 16.1 | REACTOME CLASS C 3 METABOTROPIC GLUTAMATE PHEROMONE RECEPTORS | Genes involved in Class C/3 (Metabotropic glutamate/pheromone receptors) |
| 0.7 | 15.0 | REACTOME REGULATION OF SIGNALING BY CBL | Genes involved in Regulation of signaling by CBL |
| 0.7 | 12.5 | REACTOME TGF BETA RECEPTOR SIGNALING IN EMT EPITHELIAL TO MESENCHYMAL TRANSITION | Genes involved in TGF-beta receptor signaling in EMT (epithelial to mesenchymal transition) |
| 0.6 | 15.3 | REACTOME RNA POL I PROMOTER OPENING | Genes involved in RNA Polymerase I Promoter Opening |
| 0.5 | 8.9 | REACTOME BRANCHED CHAIN AMINO ACID CATABOLISM | Genes involved in Branched-chain amino acid catabolism |
| 0.5 | 9.0 | REACTOME SEMA3A PAK DEPENDENT AXON REPULSION | Genes involved in Sema3A PAK dependent Axon repulsion |
| 0.5 | 10.4 | REACTOME GPVI MEDIATED ACTIVATION CASCADE | Genes involved in GPVI-mediated activation cascade |
| 0.5 | 8.9 | REACTOME SIGNALLING TO P38 VIA RIT AND RIN | Genes involved in Signalling to p38 via RIT and RIN |
| 0.4 | 7.3 | REACTOME ENDOGENOUS STEROLS | Genes involved in Endogenous sterols |
| 0.3 | 3.8 | REACTOME REGULATION OF KIT SIGNALING | Genes involved in Regulation of KIT signaling |
| 0.3 | 13.8 | REACTOME IMMUNOREGULATORY INTERACTIONS BETWEEN A LYMPHOID AND A NON LYMPHOID CELL | Genes involved in Immunoregulatory interactions between a Lymphoid and a non-Lymphoid cell |
| 0.2 | 6.8 | REACTOME CASPASE MEDIATED CLEAVAGE OF CYTOSKELETAL PROTEINS | Genes involved in Caspase-mediated cleavage of cytoskeletal proteins |
| 0.2 | 3.0 | REACTOME ACTIVATION OF RAC | Genes involved in Activation of Rac |
| 0.2 | 6.5 | REACTOME YAP1 AND WWTR1 TAZ STIMULATED GENE EXPRESSION | Genes involved in YAP1- and WWTR1 (TAZ)-stimulated gene expression |
| 0.2 | 4.3 | REACTOME HYALURONAN METABOLISM | Genes involved in Hyaluronan metabolism |
| 0.2 | 6.5 | REACTOME METAL ION SLC TRANSPORTERS | Genes involved in Metal ion SLC transporters |
| 0.2 | 4.2 | REACTOME G BETA GAMMA SIGNALLING THROUGH PI3KGAMMA | Genes involved in G beta:gamma signalling through PI3Kgamma |
| 0.2 | 6.0 | REACTOME NEP NS2 INTERACTS WITH THE CELLULAR EXPORT MACHINERY | Genes involved in NEP/NS2 Interacts with the Cellular Export Machinery |
| 0.2 | 7.8 | REACTOME INTERFERON ALPHA BETA SIGNALING | Genes involved in Interferon alpha/beta signaling |
| 0.1 | 4.2 | REACTOME DOUBLE STRAND BREAK REPAIR | Genes involved in Double-Strand Break Repair |
| 0.1 | 4.2 | REACTOME KINESINS | Genes involved in Kinesins |
| 0.1 | 6.7 | REACTOME NRAGE SIGNALS DEATH THROUGH JNK | Genes involved in NRAGE signals death through JNK |
| 0.1 | 9.1 | REACTOME NUCLEAR RECEPTOR TRANSCRIPTION PATHWAY | Genes involved in Nuclear Receptor transcription pathway |
| 0.1 | 14.5 | REACTOME TRANSPORT OF INORGANIC CATIONS ANIONS AND AMINO ACIDS OLIGOPEPTIDES | Genes involved in Transport of inorganic cations/anions and amino acids/oligopeptides |
| 0.1 | 3.2 | REACTOME RECYCLING PATHWAY OF L1 | Genes involved in Recycling pathway of L1 |
| 0.1 | 1.8 | REACTOME AMYLOIDS | Genes involved in Amyloids |
| 0.1 | 27.5 | REACTOME CLASS A1 RHODOPSIN LIKE RECEPTORS | Genes involved in Class A/1 (Rhodopsin-like receptors) |
| 0.1 | 2.7 | REACTOME NEGATIVE REGULATORS OF RIG I MDA5 SIGNALING | Genes involved in Negative regulators of RIG-I/MDA5 signaling |
| 0.1 | 2.1 | REACTOME CGMP EFFECTS | Genes involved in cGMP effects |
| 0.1 | 1.8 | REACTOME DEADENYLATION OF MRNA | Genes involved in Deadenylation of mRNA |
| 0.1 | 3.2 | REACTOME IL1 SIGNALING | Genes involved in Interleukin-1 signaling |
| 0.1 | 1.1 | REACTOME INFLAMMASOMES | Genes involved in Inflammasomes |
| 0.1 | 0.4 | REACTOME NEF MEDIATED DOWNREGULATION OF MHC CLASS I COMPLEX CELL SURFACE EXPRESSION | Genes involved in Nef mediated downregulation of MHC class I complex cell surface expression |
| 0.1 | 1.5 | REACTOME BIOSYNTHESIS OF THE N GLYCAN PRECURSOR DOLICHOL LIPID LINKED OLIGOSACCHARIDE LLO AND TRANSFER TO A NASCENT PROTEIN | Genes involved in Biosynthesis of the N-glycan precursor (dolichol lipid-linked oligosaccharide, LLO) and transfer to a nascent protein |
| 0.0 | 2.0 | REACTOME ACTIVATION OF CHAPERONE GENES BY XBP1S | Genes involved in Activation of Chaperone Genes by XBP1(S) |
| 0.0 | 3.7 | REACTOME MITOTIC PROMETAPHASE | Genes involved in Mitotic Prometaphase |
| 0.0 | 2.1 | REACTOME G ALPHA Q SIGNALLING EVENTS | Genes involved in G alpha (q) signalling events |
| 0.0 | 0.8 | REACTOME SYNTHESIS OF PIPS AT THE GOLGI MEMBRANE | Genes involved in Synthesis of PIPs at the Golgi membrane |
| 0.0 | 3.7 | REACTOME SIGNALING BY RHO GTPASES | Genes involved in Signaling by Rho GTPases |
| 0.0 | 4.2 | REACTOME MRNA SPLICING | Genes involved in mRNA Splicing |
| 0.0 | 3.1 | REACTOME RESPONSE TO ELEVATED PLATELET CYTOSOLIC CA2 | Genes involved in Response to elevated platelet cytosolic Ca2+ |
| 0.0 | 1.8 | REACTOME LOSS OF NLP FROM MITOTIC CENTROSOMES | Genes involved in Loss of Nlp from mitotic centrosomes |
| 0.0 | 1.0 | REACTOME FORMATION OF THE TERNARY COMPLEX AND SUBSEQUENTLY THE 43S COMPLEX | Genes involved in Formation of the ternary complex, and subsequently, the 43S complex |
| 0.0 | 3.1 | REACTOME ANTIGEN PROCESSING UBIQUITINATION PROTEASOME DEGRADATION | Genes involved in Antigen processing: Ubiquitination & Proteasome degradation |