Project
GSE53960: rat RNA-Seq transcriptomic Bodymap
Navigation
Downloads
Results for Gfi1_Gfi1b
Z-value: 1.26
Motif logo
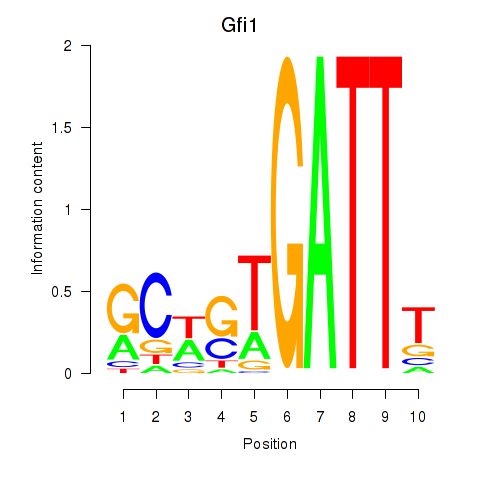
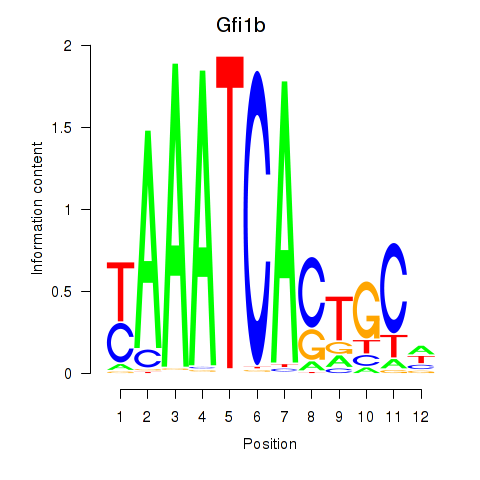
Transcription factors associated with Gfi1_Gfi1b
| Gene Symbol | Gene ID | Gene Info |
|---|---|---|
|
Gfi1
|
ENSRNOG00000002042 | growth factor independent 1 transcriptional repressor |
|
Gfi1b
|
ENSRNOG00000011353 | growth factor independent 1B transcriptional repressor |
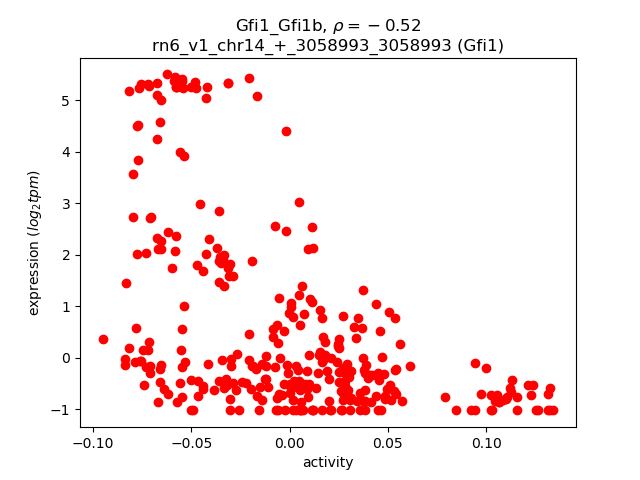
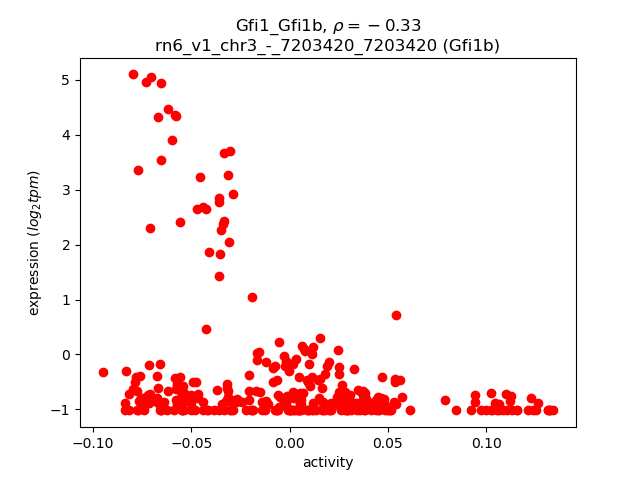
Activity-expression correlation:
| Gene | Promoter | Pearson corr. coef. | P-value | Plot |
|---|---|---|---|---|
| Gfi1 | rn6_v1_chr14_+_3058993_3058993 | -0.52 | 3.8e-23 | Click! |
| Gfi1b | rn6_v1_chr3_-_7203420_7203420 | -0.33 | 1.4e-09 | Click! |
Activity profile of Gfi1_Gfi1b motif
Sorted Z-values of Gfi1_Gfi1b motif
| Promoter | Log-likelihood | Transcript | Gene | Gene Info |
|---|---|---|---|---|
| chr1_+_105349069 | 49.03 |
ENSRNOT00000056030
|
Nell1
|
neural EGFL like 1 |
| chr13_+_63526486 | 42.96 |
ENSRNOT00000003788
|
Brinp3
|
BMP/retinoic acid inducible neural specific 3 |
| chr5_-_130085838 | 41.46 |
ENSRNOT00000035252
|
Elavl4
|
ELAV like RNA binding protein 4 |
| chr1_+_81372650 | 38.07 |
ENSRNOT00000088829
|
Zfp428
|
zinc finger protein 428 |
| chr17_-_27969433 | 37.98 |
ENSRNOT00000073967
|
Nrn1
|
neuritin 1 |
| chr4_-_40385349 | 34.21 |
ENSRNOT00000039005
|
Gpr85
|
G protein-coupled receptor 85 |
| chr11_+_20474483 | 33.79 |
ENSRNOT00000082417
ENSRNOT00000002895 |
Ncam2
|
neural cell adhesion molecule 2 |
| chr18_-_18079560 | 32.27 |
ENSRNOT00000072093
|
AABR07031533.1
|
|
| chr1_-_150395415 | 30.08 |
ENSRNOT00000018592
|
Folh1
|
folate hydrolase 1 |
| chr5_+_22380334 | 29.83 |
ENSRNOT00000009744
|
Clvs1
|
clavesin 1 |
| chr7_+_78131232 | 29.62 |
ENSRNOT00000039984
|
Rims2
|
regulating synaptic membrane exocytosis 2 |
| chr4_+_139670092 | 28.94 |
ENSRNOT00000008879
|
Lrrn1
|
leucine rich repeat neuronal 1 |
| chr9_+_81816872 | 27.62 |
ENSRNOT00000041407
|
Plcd4
|
phospholipase C, delta 4 |
| chr4_-_114853868 | 27.13 |
ENSRNOT00000090828
|
Wdr54
|
WD repeat domain 54 |
| chr1_+_37507276 | 27.04 |
ENSRNOT00000047627
|
Adcy2
|
adenylate cyclase 2 |
| chr19_+_6046665 | 25.58 |
ENSRNOT00000084126
|
Cdh8
|
cadherin 8 |
| chr11_+_32655616 | 24.40 |
ENSRNOT00000084412
ENSRNOT00000034383 |
Clic6
|
chloride intracellular channel 6 |
| chr10_-_8498422 | 23.96 |
ENSRNOT00000082332
|
Rbfox1
|
RNA binding protein, fox-1 homolog 1 |
| chr2_-_179704629 | 23.92 |
ENSRNOT00000083361
ENSRNOT00000077941 |
Gria2
|
glutamate ionotropic receptor AMPA type subunit 2 |
| chr11_+_57207656 | 23.42 |
ENSRNOT00000038207
ENSRNOT00000085754 |
Plcxd2
|
phosphatidylinositol-specific phospholipase C, X domain containing 2 |
| chr3_+_51883559 | 22.99 |
ENSRNOT00000007197
|
Csrnp3
|
cysteine and serine rich nuclear protein 3 |
| chr7_-_50278842 | 22.91 |
ENSRNOT00000088950
|
Syt1
|
synaptotagmin 1 |
| chr3_+_113319456 | 22.79 |
ENSRNOT00000051354
|
Ckmt1
|
creatine kinase, mitochondrial 1 |
| chr12_+_41073824 | 22.44 |
ENSRNOT00000001844
|
Rph3a
|
rabphilin 3A |
| chr13_-_88061108 | 22.20 |
ENSRNOT00000003774
|
Rgs4
|
regulator of G-protein signaling 4 |
| chr2_+_66940057 | 21.76 |
ENSRNOT00000043050
|
Cdh9
|
cadherin 9 |
| chrX_+_111735820 | 21.06 |
ENSRNOT00000086948
|
Frmpd3
|
FERM and PDZ domain containing 3 |
| chr3_+_129018592 | 20.33 |
ENSRNOT00000007274
|
Lamp5
|
lysosomal-associated membrane protein family, member 5 |
| chr14_-_44767120 | 20.24 |
ENSRNOT00000003991
|
Wdr19
|
WD repeat domain 19 |
| chr9_+_73378057 | 20.17 |
ENSRNOT00000043627
ENSRNOT00000045766 ENSRNOT00000092445 ENSRNOT00000037974 |
Map2
|
microtubule-associated protein 2 |
| chr8_+_72405748 | 19.93 |
ENSRNOT00000023952
|
Car12
|
carbonic anhydrase 12 |
| chr10_-_87248572 | 19.77 |
ENSRNOT00000066637
ENSRNOT00000085677 |
Krt26
|
keratin 26 |
| chr15_-_44860604 | 18.84 |
ENSRNOT00000018637
|
Nefm
|
neurofilament medium |
| chr11_+_60072727 | 18.25 |
ENSRNOT00000090230
|
Tagln3
|
transgelin 3 |
| chr12_-_35979193 | 18.04 |
ENSRNOT00000071104
|
Tmem132b
|
transmembrane protein 132B |
| chr1_-_89358166 | 18.02 |
ENSRNOT00000044532
|
Mag
|
myelin-associated glycoprotein |
| chr13_-_50514151 | 17.98 |
ENSRNOT00000003951
|
Ren
|
renin |
| chr11_+_57505005 | 17.96 |
ENSRNOT00000002942
|
LOC103693564
|
transgelin-3 |
| chr4_+_114854458 | 17.86 |
ENSRNOT00000013312
|
LOC500227
|
hypothetical gene supported by BC079424 |
| chr5_-_158549496 | 17.53 |
ENSRNOT00000074336
|
Igsf21
|
immunoglobin superfamily, member 21 |
| chr11_+_60073383 | 17.51 |
ENSRNOT00000087508
|
Tagln3
|
transgelin 3 |
| chr2_+_27905535 | 17.49 |
ENSRNOT00000022120
|
Fam169a
|
family with sequence similarity 169, member A |
| chr2_+_60920257 | 17.36 |
ENSRNOT00000025170
|
C1qtnf3
|
C1q and tumor necrosis factor related protein 3 |
| chr13_-_72063347 | 17.34 |
ENSRNOT00000090544
ENSRNOT00000003869 |
Cacna1e
|
calcium voltage-gated channel subunit alpha1 E |
| chr17_+_7675531 | 17.00 |
ENSRNOT00000061187
|
Spock1
|
sparc/osteonectin, cwcv and kazal like domains proteoglycan 1 |
| chrX_+_114930457 | 16.62 |
ENSRNOT00000089141
|
Pak3
|
p21 (RAC1) activated kinase 3 |
| chr14_-_66978499 | 16.38 |
ENSRNOT00000081601
|
Slit2
|
slit guidance ligand 2 |
| chrX_+_65040934 | 16.33 |
ENSRNOT00000044006
|
Zc3h12b
|
zinc finger CCCH-type containing 12B |
| chr15_-_5510289 | 16.25 |
ENSRNOT00000085883
|
Spetex-2F
|
Spetex-2F protein |
| chr1_-_84353725 | 16.19 |
ENSRNOT00000057177
|
Pld3
|
phospholipase D family, member 3 |
| chr5_-_136721379 | 15.85 |
ENSRNOT00000026704
|
Atp6v0b
|
ATPase H+ transporting V0 subunit B |
| chr1_-_156327352 | 15.82 |
ENSRNOT00000074282
|
LOC100911776
|
coiled-coil domain-containing protein 89-like |
| chr2_+_228544418 | 15.81 |
ENSRNOT00000013030
|
Tram1l1
|
translocation associated membrane protein 1-like 1 |
| chr3_-_153042395 | 15.46 |
ENSRNOT00000055232
|
Ndrg3
|
NDRG family member 3 |
| chr4_-_4473307 | 15.31 |
ENSRNOT00000045773
|
Dpp6
|
dipeptidyl peptidase like 6 |
| chr1_+_154606490 | 15.31 |
ENSRNOT00000024095
|
Ccdc89
|
coiled-coil domain containing 89 |
| chrX_+_70596576 | 15.16 |
ENSRNOT00000045082
ENSRNOT00000003741 ENSRNOT00000076079 |
Dlg3
|
discs large MAGUK scaffold protein 3 |
| chr3_-_26056818 | 15.06 |
ENSRNOT00000044209
|
Lrp1b
|
LDL receptor related protein 1B |
| chrX_+_14019961 | 14.80 |
ENSRNOT00000004785
|
Sytl5
|
synaptotagmin-like 5 |
| chr1_-_250630677 | 14.60 |
ENSRNOT00000016688
|
Asah2
|
N-acylsphingosine amidohydrolase 2 |
| chr20_+_20105047 | 14.50 |
ENSRNOT00000082181
|
Ank3
|
ankyrin 3 |
| chr3_+_137618898 | 14.34 |
ENSRNOT00000007249
|
Pcsk2
|
proprotein convertase subtilisin/kexin type 2 |
| chr4_+_153874852 | 14.12 |
ENSRNOT00000079744
|
Slc6a13
|
solute carrier family 6 member 13 |
| chr17_+_13670520 | 14.03 |
ENSRNOT00000019442
|
Shc3
|
SHC adaptor protein 3 |
| chr8_+_22947152 | 13.96 |
ENSRNOT00000016790
|
Plppr2
|
phospholipid phosphatase related 2 |
| chr14_-_42221225 | 13.73 |
ENSRNOT00000036103
|
Shisa3
|
shisa family member 3 |
| chr10_+_75055020 | 13.64 |
ENSRNOT00000010755
|
Tspoap1
|
TSPO associated protein 1 |
| chr5_-_2982603 | 13.46 |
ENSRNOT00000045460
|
Kcnb2
|
potassium voltage-gated channel subfamily B member 2 |
| chr4_+_33638709 | 13.38 |
ENSRNOT00000009888
ENSRNOT00000034719 ENSRNOT00000052333 |
Tac1
|
tachykinin, precursor 1 |
| chr3_-_13865843 | 13.23 |
ENSRNOT00000025194
|
Rabepk
|
Rab9 effector protein with kelch motifs |
| chr13_+_82072497 | 12.94 |
ENSRNOT00000063810
ENSRNOT00000085135 |
Kifap3
|
kinesin-associated protein 3 |
| chr12_+_43940929 | 12.82 |
ENSRNOT00000001486
|
Rnft2
|
ring finger protein, transmembrane 2 |
| chr17_-_22143324 | 12.55 |
ENSRNOT00000019361
|
Edn1
|
endothelin 1 |
| chr4_+_108301129 | 12.49 |
ENSRNOT00000007993
|
LRRTM1
|
leucine rich repeat transmembrane neuronal 1 |
| chr14_-_28536260 | 12.43 |
ENSRNOT00000059942
|
Adgrl3
|
adhesion G protein-coupled receptor L3 |
| chr13_-_49313940 | 12.42 |
ENSRNOT00000012190
|
Cntn2
|
contactin 2 |
| chr12_-_12025549 | 12.23 |
ENSRNOT00000001331
|
Nptx2
|
neuronal pentraxin 2 |
| chr1_-_143315633 | 12.19 |
ENSRNOT00000026030
|
Ap3b2
|
adaptor-related protein complex 3, beta 2 subunit |
| chr4_+_35279063 | 12.09 |
ENSRNOT00000011833
|
Nxph1
|
neurexophilin 1 |
| chr16_+_26906716 | 12.09 |
ENSRNOT00000064297
|
Cpe
|
carboxypeptidase E |
| chr1_+_224824799 | 12.04 |
ENSRNOT00000024757
|
Slc22a6
|
solute carrier family 22 member 6 |
| chr13_-_57080491 | 11.76 |
ENSRNOT00000017749
ENSRNOT00000086572 ENSRNOT00000060111 |
Cfh
|
complement factor H |
| chr12_-_2174131 | 11.75 |
ENSRNOT00000001313
|
Pcp2
|
Purkinje cell protein 2 |
| chrX_+_39711201 | 11.59 |
ENSRNOT00000080512
ENSRNOT00000009802 |
Cnksr2
|
connector enhancer of kinase suppressor of Ras 2 |
| chr3_+_45277348 | 11.58 |
ENSRNOT00000059246
|
Pkp4
|
plakophilin 4 |
| chr13_-_51992693 | 11.49 |
ENSRNOT00000008282
|
Gpr37l1
|
G protein-coupled receptor 37-like 1 |
| chr15_+_52767442 | 11.43 |
ENSRNOT00000014441
|
LOC108348161
|
phytanoyl-CoA hydroxylase-interacting protein |
| chr3_-_51612397 | 11.42 |
ENSRNOT00000081401
|
Scn3a
|
sodium voltage-gated channel alpha subunit 3 |
| chr16_+_67350539 | 11.30 |
ENSRNOT00000085659
ENSRNOT00000015879 |
Unc5d
|
unc-5 netrin receptor D |
| chr7_-_7189599 | 11.16 |
ENSRNOT00000004458
|
Olr1016
|
olfactory receptor 1016 |
| chrX_-_69218526 | 11.13 |
ENSRNOT00000092321
ENSRNOT00000074071 ENSRNOT00000092571 |
Pja1
|
praja ring finger ubiquitin ligase 1 |
| chr9_-_92530938 | 11.07 |
ENSRNOT00000064875
|
Slc16a14
|
solute carrier family 16, member 14 |
| chr1_-_88690534 | 11.00 |
ENSRNOT00000072570
|
Ovol3
|
ovo-like zinc finger 3 |
| chr2_+_229196616 | 10.94 |
ENSRNOT00000012773
|
Ndst4
|
N-deacetylase and N-sulfotransferase 4 |
| chr20_+_4593389 | 10.78 |
ENSRNOT00000001174
|
Slc44a4
|
solute carrier family 44, member 4 |
| chr13_-_111972603 | 10.70 |
ENSRNOT00000007870
|
Hsd11b1
|
hydroxysteroid 11-beta dehydrogenase 1 |
| chr9_+_84569597 | 10.55 |
ENSRNOT00000020161
|
Acsl3
|
acyl-CoA synthetase long-chain family member 3 |
| chr8_-_55194692 | 10.46 |
ENSRNOT00000068366
|
RGD1564937
|
similar to RIKEN cDNA 1110032A03 |
| chr9_+_119542328 | 10.41 |
ENSRNOT00000082005
|
Lpin2
|
lipin 2 |
| chr4_+_136512201 | 10.35 |
ENSRNOT00000051645
|
Cntn6
|
contactin 6 |
| chr10_-_34333305 | 10.32 |
ENSRNOT00000071365
|
Olr1384
|
olfactory receptor gene Olr1384 |
| chr15_+_52148379 | 10.28 |
ENSRNOT00000074912
|
Phyhip
|
phytanoyl-CoA 2-hydroxylase interacting protein |
| chr5_-_113880911 | 10.27 |
ENSRNOT00000029441
|
Eqtn
|
equatorin |
| chr20_-_14620019 | 10.10 |
ENSRNOT00000001779
|
Gnaz
|
G protein subunit alpha z |
| chr9_-_79898912 | 10.02 |
ENSRNOT00000022076
|
March4
|
membrane associated ring-CH-type finger 4 |
| chr9_+_44483875 | 9.64 |
ENSRNOT00000083245
|
NEWGENE_1308196
|
mitochondrial ribosomal protein L30 |
| chr7_+_59200918 | 9.58 |
ENSRNOT00000085073
|
Ptprr
|
protein tyrosine phosphatase, receptor type, R |
| chr16_-_49453394 | 9.57 |
ENSRNOT00000041617
|
Lrp2bp
|
Lrp2 binding protein |
| chr2_-_148807813 | 9.41 |
ENSRNOT00000047649
|
AC112531.1
|
|
| chr13_-_76049363 | 9.37 |
ENSRNOT00000075865
ENSRNOT00000007455 |
Brinp2
|
BMP/retinoic acid inducible neural specific 2 |
| chr14_+_22553650 | 9.36 |
ENSRNOT00000092201
ENSRNOT00000002712 |
Ugt2b35
|
UDP glucuronosyltransferase 2 family, polypeptide B35 |
| chr5_-_115222075 | 9.21 |
ENSRNOT00000058163
ENSRNOT00000012503 |
LOC100912642
|
cytochrome P450 2J3-like |
| chr8_+_53678777 | 9.14 |
ENSRNOT00000045944
|
Drd2
|
dopamine receptor D2 |
| chr6_+_99356509 | 9.12 |
ENSRNOT00000008416
|
Akap5
|
A-kinase anchoring protein 5 |
| chr18_+_52550739 | 9.11 |
ENSRNOT00000037529
|
Ctxn3
|
cortexin 3 |
| chr16_+_39144972 | 9.06 |
ENSRNOT00000086728
|
Adam21
|
ADAM metallopeptidase domain 21 |
| chr18_+_29966245 | 9.05 |
ENSRNOT00000074028
|
Pcdha4
|
protocadherin alpha 4 |
| chrX_-_134719097 | 9.00 |
ENSRNOT00000068478
|
Smarca1
|
SWI/SNF related, matrix associated, actin dependent regulator of chromatin, subfamily a, member 1 |
| chr3_-_52212412 | 8.99 |
ENSRNOT00000007615
|
Galnt3
|
polypeptide N-acetylgalactosaminyltransferase 3 |
| chr9_-_4876023 | 8.92 |
ENSRNOT00000065839
|
RGD1559960
|
similar to Sulfotransferase K1 (rSULT1C2) |
| chr3_-_123119460 | 8.88 |
ENSRNOT00000028833
|
Avp
|
arginine vasopressin |
| chrX_-_153878806 | 8.75 |
ENSRNOT00000087990
|
Aff2
|
AF4/FMR2 family, member 2 |
| chr7_-_130151414 | 8.73 |
ENSRNOT00000010467
|
Plxnb2
|
plexin B2 |
| chr2_+_22909569 | 8.71 |
ENSRNOT00000073871
|
Homer1
|
homer scaffolding protein 1 |
| chr15_-_5509839 | 8.68 |
ENSRNOT00000080252
ENSRNOT00000081979 ENSRNOT00000085137 ENSRNOT00000049746 |
Spetex-2F
|
Spetex-2F protein |
| chr1_+_156552328 | 8.62 |
ENSRNOT00000055401
|
Dlg2
|
discs large MAGUK scaffold protein 2 |
| chr15_-_26678420 | 8.60 |
ENSRNOT00000041420
|
RGD1310110
|
similar to 3632451O06Rik protein |
| chr8_-_8524643 | 8.53 |
ENSRNOT00000009418
|
Cntn5
|
contactin 5 |
| chr8_+_129205931 | 8.51 |
ENSRNOT00000082377
|
Entpd3
|
ectonucleoside triphosphate diphosphohydrolase 3 |
| chr4_-_82295470 | 8.45 |
ENSRNOT00000091073
|
Hoxa10
|
homeobox A10 |
| chr15_-_88036354 | 8.32 |
ENSRNOT00000014747
|
Ednrb
|
endothelin receptor type B |
| chr1_+_16478127 | 8.26 |
ENSRNOT00000019076
|
Ahi1
|
Abelson helper integration site 1 |
| chr12_-_44911147 | 8.24 |
ENSRNOT00000071074
ENSRNOT00000046190 |
Ksr2
|
kinase suppressor of ras 2 |
| chr9_+_25410669 | 8.23 |
ENSRNOT00000030912
ENSRNOT00000090920 |
Tfap2b
|
transcription factor AP-2 beta |
| chr4_-_82209933 | 8.16 |
ENSRNOT00000091106
|
LOC100912608
|
homeobox protein Hox-A10-like |
| chr1_-_224533219 | 8.07 |
ENSRNOT00000051289
|
Ust5r
|
integral membrane transport protein UST5r |
| chr9_-_13311924 | 8.03 |
ENSRNOT00000015584
|
Kif6
|
kinesin family member 6 |
| chr2_-_154418920 | 7.99 |
ENSRNOT00000076326
|
Plch1
|
phospholipase C, eta 1 |
| chrX_+_66314418 | 7.99 |
ENSRNOT00000035405
|
Pgr15l
|
G protein-coupled receptor 15-like |
| chr2_-_154418629 | 7.98 |
ENSRNOT00000076274
ENSRNOT00000076165 |
Plch1
|
phospholipase C, eta 1 |
| chr3_-_52664209 | 7.97 |
ENSRNOT00000065126
ENSRNOT00000079020 |
Scn9a
|
sodium voltage-gated channel alpha subunit 9 |
| chr7_-_68512397 | 7.80 |
ENSRNOT00000058036
|
Slc16a7
|
solute carrier family 16 member 7 |
| chr6_+_95205153 | 7.77 |
ENSRNOT00000007339
|
Lrrc9
|
leucine rich repeat containing 9 |
| chr2_+_3662763 | 7.72 |
ENSRNOT00000017828
|
Mctp1
|
multiple C2 and transmembrane domain containing 1 |
| chr4_+_88832178 | 7.71 |
ENSRNOT00000088983
|
Abcg2
|
ATP-binding cassette, subfamily G (WHITE), member 2 |
| chr3_+_67849966 | 7.59 |
ENSRNOT00000057826
|
Dusp19
|
dual specificity phosphatase 19 |
| chr10_-_52710862 | 7.57 |
ENSRNOT00000005583
|
Dnah9
|
dynein, axonemal, heavy chain 9 |
| chr5_+_58393233 | 7.51 |
ENSRNOT00000000142
|
Dnajb5
|
DnaJ heat shock protein family (Hsp40) member B5 |
| chr18_+_13386133 | 7.40 |
ENSRNOT00000020661
|
Asxl3
|
additional sex combs like 3, transcriptional regulator |
| chr2_-_59084059 | 7.38 |
ENSRNOT00000086323
ENSRNOT00000088701 |
Spef2
|
sperm flagellar 2 |
| chrX_+_70596901 | 7.31 |
ENSRNOT00000088114
|
Dlg3
|
discs large MAGUK scaffold protein 3 |
| chr14_+_78640620 | 7.29 |
ENSRNOT00000034730
|
Wfs1
|
wolframin ER transmembrane glycoprotein |
| chr14_+_107268128 | 7.15 |
ENSRNOT00000012224
|
Tmem17
|
transmembrane protein 17 |
| chr5_-_152589719 | 7.07 |
ENSRNOT00000022522
|
Extl1
|
exostosin-like glycosyltransferase 1 |
| chr16_-_38063821 | 7.06 |
ENSRNOT00000077452
ENSRNOT00000089533 |
Glra3
|
glycine receptor, alpha 3 |
| chr13_+_70157522 | 7.04 |
ENSRNOT00000036906
|
Apobec4
|
apolipoprotein B mRNA editing enzyme catalytic polypeptide like 4 |
| chr5_-_68139199 | 6.99 |
ENSRNOT00000009987
|
Plppr1
|
phospholipid phosphatase related 1 |
| chr18_+_30017918 | 6.99 |
ENSRNOT00000079794
|
Pcdha4
|
protocadherin alpha 4 |
| chr2_-_25153334 | 6.95 |
ENSRNOT00000024191
|
Crhbp
|
corticotropin releasing hormone binding protein |
| chrX_+_9436707 | 6.91 |
ENSRNOT00000004187
|
Cask
|
calcium/calmodulin dependent serine protein kinase |
| chr5_-_33892462 | 6.87 |
ENSRNOT00000009334
|
Atp6v0d2
|
ATPase H+ transporting V0 subunit D2 |
| chrX_+_116399611 | 6.86 |
ENSRNOT00000050854
|
Zcchc16
|
zinc finger CCHC-type containing 16 |
| chr17_-_80807181 | 6.83 |
ENSRNOT00000040052
ENSRNOT00000090064 |
Cubn
|
cubilin |
| chr2_-_257546799 | 6.64 |
ENSRNOT00000089370
ENSRNOT00000090367 |
Miga1
|
mitoguardin 1 |
| chr1_+_48008683 | 6.64 |
ENSRNOT00000018934
|
Acat2l1
|
acetyl-CoA acetyltransferase 2-like 1 |
| chr14_-_8510138 | 6.58 |
ENSRNOT00000080758
|
Arhgap24
|
Rho GTPase activating protein 24 |
| chr8_+_98745310 | 6.57 |
ENSRNOT00000019938
|
Zic4
|
Zic family member 4 |
| chr14_+_22107416 | 6.56 |
ENSRNOT00000060179
ENSRNOT00000080114 |
Sult1d1
|
sulfotransferase family 1D, member 1 |
| chr18_+_30592794 | 6.52 |
ENSRNOT00000027133
|
Pcdhb22
|
protocadherin beta 22 |
| chr2_+_144646308 | 6.52 |
ENSRNOT00000078337
ENSRNOT00000093407 |
Dclk1
|
doublecortin-like kinase 1 |
| chr12_-_22811058 | 6.51 |
ENSRNOT00000046412
|
Ift22
|
intraflagellar transport 22 |
| chr1_-_53802658 | 6.50 |
ENSRNOT00000032667
|
Afdn
|
afadin, adherens junction formation factor |
| chr17_+_45801528 | 6.49 |
ENSRNOT00000089221
|
Olr1664
|
olfactory receptor 1664 |
| chr6_-_129010271 | 6.43 |
ENSRNOT00000075378
|
Serpina10
|
serpin family A member 10 |
| chr10_+_89285855 | 6.39 |
ENSRNOT00000028033
|
G6pc
|
glucose-6-phosphatase, catalytic subunit |
| chr7_+_144647587 | 6.38 |
ENSRNOT00000022398
|
Hoxc4
|
homeo box C4 |
| chr13_-_88307988 | 6.34 |
ENSRNOT00000003812
|
Hsd17b7
|
hydroxysteroid (17-beta) dehydrogenase 7 |
| chr3_-_63211842 | 6.29 |
ENSRNOT00000008371
ENSRNOT00000050355 |
Pde11a
|
phosphodiesterase 11A |
| chr11_+_31893489 | 6.28 |
ENSRNOT00000042750
|
Itsn1
|
intersectin 1 |
| chr12_+_18679789 | 6.20 |
ENSRNOT00000001863
|
Cyp3a9
|
cytochrome P450, family 3, subfamily a, polypeptide 9 |
| chr9_-_100888107 | 6.17 |
ENSRNOT00000024794
|
Thap4
|
THAP domain containing 4 |
| chr2_-_59181863 | 6.16 |
ENSRNOT00000079636
|
Spef2
|
sperm flagellar 2 |
| chr3_+_8537350 | 6.15 |
ENSRNOT00000079640
|
Sptan1
|
spectrin, alpha, non-erythrocytic 1 |
| chr4_-_129430251 | 6.14 |
ENSRNOT00000067881
|
Fam19a4
|
family with sequence similarity 19 member A4, C-C motif chemokine like |
| chr17_-_69460321 | 6.11 |
ENSRNOT00000058367
|
Akr1c1
|
aldo-keto reductase family 1, member C1 |
| chr1_-_187779675 | 6.04 |
ENSRNOT00000024648
|
Arl6ip1
|
ADP-ribosylation factor like GTPase 6 interacting protein 1 |
| chr10_+_89286047 | 6.03 |
ENSRNOT00000085831
|
G6pc
|
glucose-6-phosphatase, catalytic subunit |
| chr20_+_46044892 | 5.98 |
ENSRNOT00000057187
|
Ak9
|
adenylate kinase 9 |
| chr18_+_61261418 | 5.97 |
ENSRNOT00000064250
|
Zfp532
|
zinc finger protein 532 |
| chr20_+_55594676 | 5.89 |
ENSRNOT00000057010
|
Sim1
|
single-minded family bHLH transcription factor 1 |
| chr1_-_24056373 | 5.89 |
ENSRNOT00000015566
|
Slc2a12
|
solute carrier family 2 member 12 |
| chr2_+_62887267 | 5.87 |
ENSRNOT00000048026
|
Drosha
|
drosha ribonuclease III |
| chr8_+_22937916 | 5.83 |
ENSRNOT00000088255
ENSRNOT00000049993 |
Ccdc159
|
coiled-coil domain containing 159 |
| chr5_-_64850427 | 5.82 |
ENSRNOT00000008883
|
Tmem246
|
transmembrane protein 246 |
| chr1_-_103717536 | 5.81 |
ENSRNOT00000029920
|
AABR07003291.1
|
|
| chr18_+_60392376 | 5.79 |
ENSRNOT00000023890
|
Nedd4l
|
neural precursor cell expressed, developmentally down-regulated 4-like, E3 ubiquitin protein ligase |
| chr10_-_91986632 | 5.78 |
ENSRNOT00000087824
|
Nsf
|
N-ethylmaleimide sensitive factor, vesicle fusing ATPase |
| chr8_+_98755104 | 5.76 |
ENSRNOT00000056562
|
Zic4
|
Zic family member 4 |
| chr10_+_14373679 | 5.74 |
ENSRNOT00000022063
|
Ift140
|
intraflagellar transport 140 |
| chr16_+_39353283 | 5.73 |
ENSRNOT00000080125
|
LOC108348202
|
disintegrin and metalloproteinase domain-containing protein 21-like |
Network of associatons between targets according to the STRING database.

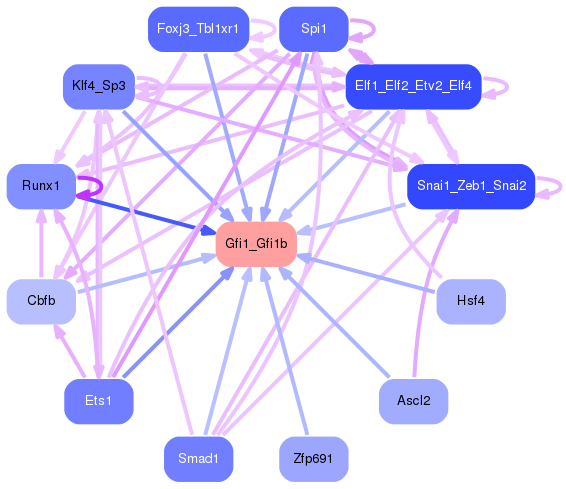
First level regulatory network of Gfi1_Gfi1b
Gene Ontology Analysis
Gene overrepresentation in biological process category:
| Log-likelihood per target | Total log-likelihood | Term | Description |
|---|---|---|---|
| 6.3 | 18.8 | GO:0033693 | neurofilament bundle assembly(GO:0033693) |
| 5.5 | 16.4 | GO:0090024 | chemorepulsion involved in postnatal olfactory bulb interneuron migration(GO:0021836) negative regulation of granulocyte chemotaxis(GO:0071623) negative regulation of neutrophil chemotaxis(GO:0090024) |
| 5.3 | 26.4 | GO:0030070 | insulin processing(GO:0030070) |
| 5.2 | 20.9 | GO:0014826 | vein smooth muscle contraction(GO:0014826) |
| 5.1 | 20.2 | GO:0060830 | ciliary receptor clustering involved in smoothened signaling pathway(GO:0060830) myotome development(GO:0061055) |
| 5.0 | 30.1 | GO:0035609 | C-terminal protein deglutamylation(GO:0035609) |
| 4.7 | 4.7 | GO:0006529 | asparagine biosynthetic process(GO:0006529) |
| 4.1 | 12.4 | GO:0060167 | clustering of voltage-gated potassium channels(GO:0045163) regulation of adenosine receptor signaling pathway(GO:0060167) |
| 4.0 | 15.8 | GO:0002125 | maternal aggressive behavior(GO:0002125) |
| 3.6 | 14.5 | GO:1900827 | positive regulation of cell communication by electrical coupling(GO:0010650) positive regulation of membrane depolarization during cardiac muscle cell action potential(GO:1900827) |
| 3.6 | 18.0 | GO:0002003 | angiotensin maturation(GO:0002003) renin-angiotensin regulation of aldosterone production(GO:0002018) |
| 3.6 | 10.8 | GO:0008292 | acetylcholine biosynthetic process(GO:0008292) acetate ester biosynthetic process(GO:1900620) |
| 3.6 | 10.7 | GO:0006713 | glucocorticoid catabolic process(GO:0006713) |
| 3.5 | 10.5 | GO:2001245 | regulation of phosphatidylcholine biosynthetic process(GO:2001245) |
| 3.2 | 9.6 | GO:0009216 | purine deoxyribonucleoside triphosphate biosynthetic process(GO:0009216) |
| 3.2 | 41.1 | GO:0033689 | negative regulation of osteoblast proliferation(GO:0033689) |
| 3.1 | 25.0 | GO:0035815 | positive regulation of renal sodium excretion(GO:0035815) |
| 2.8 | 31.1 | GO:0046710 | GDP metabolic process(GO:0046710) |
| 2.7 | 8.0 | GO:0043179 | rhythmic excitation(GO:0043179) |
| 2.6 | 7.7 | GO:1904612 | glucuronoside metabolic process(GO:0019389) response to 2,3,7,8-tetrachlorodibenzodioxine(GO:1904612) |
| 2.5 | 5.0 | GO:1903596 | regulation of gap junction assembly(GO:1903596) |
| 2.5 | 17.4 | GO:0071638 | negative regulation of monocyte chemotactic protein-1 production(GO:0071638) |
| 2.4 | 7.3 | GO:0036500 | ATF6-mediated unfolded protein response(GO:0036500) |
| 2.3 | 7.0 | GO:0090158 | endoplasmic reticulum membrane organization(GO:0090158) |
| 2.3 | 9.1 | GO:0036394 | amylase secretion(GO:0036394) |
| 2.3 | 29.6 | GO:0098814 | spontaneous neurotransmitter secretion(GO:0061669) spontaneous synaptic transmission(GO:0098814) |
| 2.2 | 19.9 | GO:0055064 | chloride ion homeostasis(GO:0055064) |
| 2.2 | 17.3 | GO:0090273 | regulation of somatostatin secretion(GO:0090273) |
| 2.1 | 6.4 | GO:1990790 | response to glial cell derived neurotrophic factor(GO:1990790) cellular response to glial cell derived neurotrophic factor(GO:1990792) |
| 2.1 | 27.0 | GO:1904321 | response to forskolin(GO:1904321) cellular response to forskolin(GO:1904322) |
| 2.1 | 8.3 | GO:0039020 | pronephric nephron tubule development(GO:0039020) |
| 2.1 | 10.3 | GO:0060478 | acrosomal vesicle exocytosis(GO:0060478) |
| 2.0 | 6.1 | GO:0009753 | response to jasmonic acid(GO:0009753) cellular response to jasmonic acid stimulus(GO:0071395) |
| 2.0 | 12.0 | GO:0031427 | response to methotrexate(GO:0031427) |
| 1.9 | 9.6 | GO:1903385 | regulation of homophilic cell adhesion(GO:1903385) |
| 1.9 | 22.9 | GO:0031340 | positive regulation of vesicle fusion(GO:0031340) |
| 1.9 | 1.9 | GO:0071504 | cellular response to heparin(GO:0071504) |
| 1.8 | 3.7 | GO:0070460 | thyroid-stimulating hormone secretion(GO:0070460) regulation of thyroid-stimulating hormone secretion(GO:2000612) |
| 1.8 | 9.0 | GO:0018242 | protein O-linked glycosylation via serine(GO:0018242) protein O-linked glycosylation via threonine(GO:0018243) |
| 1.6 | 8.2 | GO:0097070 | ductus arteriosus closure(GO:0097070) |
| 1.6 | 7.8 | GO:1901475 | pyruvate transmembrane transport(GO:1901475) |
| 1.6 | 6.2 | GO:0072139 | glomerular parietal epithelial cell differentiation(GO:0072139) |
| 1.6 | 6.2 | GO:0009822 | lipid hydroxylation(GO:0002933) alkaloid catabolic process(GO:0009822) |
| 1.5 | 4.4 | GO:0061443 | endocardial cushion cell differentiation(GO:0061443) |
| 1.5 | 11.7 | GO:0016056 | rhodopsin mediated signaling pathway(GO:0016056) |
| 1.4 | 4.3 | GO:0046952 | polyprenol biosynthetic process(GO:0016094) ketone body catabolic process(GO:0046952) |
| 1.4 | 5.8 | GO:2001288 | positive regulation of caveolin-mediated endocytosis(GO:2001288) |
| 1.4 | 5.8 | GO:0035494 | SNARE complex disassembly(GO:0035494) |
| 1.4 | 7.2 | GO:0015889 | cobalamin transport(GO:0015889) |
| 1.4 | 2.8 | GO:0014916 | regulation of lung blood pressure(GO:0014916) |
| 1.4 | 5.7 | GO:1904158 | axonemal central apparatus assembly(GO:1904158) |
| 1.4 | 9.7 | GO:0002091 | negative regulation of receptor internalization(GO:0002091) |
| 1.4 | 2.7 | GO:1904170 | regulation of bleb assembly(GO:1904170) |
| 1.3 | 4.0 | GO:0032053 | ciliary basal body organization(GO:0032053) positive regulation of protein localization to cilium(GO:1903566) |
| 1.3 | 5.3 | GO:0045900 | negative regulation of translational elongation(GO:0045900) |
| 1.3 | 6.5 | GO:0034334 | adherens junction maintenance(GO:0034334) |
| 1.3 | 3.8 | GO:0071250 | cellular response to nitrite(GO:0071250) response to nitrite(GO:0080033) response to resveratrol(GO:1904638) regulation of progesterone biosynthetic process(GO:2000182) |
| 1.3 | 11.4 | GO:0052697 | xenobiotic glucuronidation(GO:0052697) |
| 1.3 | 5.0 | GO:0051643 | endoplasmic reticulum localization(GO:0051643) |
| 1.2 | 12.4 | GO:0015712 | hexose phosphate transport(GO:0015712) glucose-6-phosphate transport(GO:0015760) |
| 1.2 | 6.1 | GO:0035063 | nuclear speck organization(GO:0035063) |
| 1.2 | 3.5 | GO:0090283 | regulation of protein glycosylation in Golgi(GO:0090283) |
| 1.2 | 24.6 | GO:2001014 | regulation of skeletal muscle cell differentiation(GO:2001014) |
| 1.1 | 11.4 | GO:0046684 | response to pyrethroid(GO:0046684) |
| 1.1 | 18.0 | GO:0048711 | positive regulation of astrocyte differentiation(GO:0048711) |
| 1.1 | 3.3 | GO:0002589 | regulation of antigen processing and presentation of peptide antigen via MHC class I(GO:0002589) |
| 1.1 | 7.8 | GO:0098903 | regulation of membrane repolarization during action potential(GO:0098903) |
| 1.1 | 2.2 | GO:0032474 | otolith morphogenesis(GO:0032474) |
| 1.1 | 33.0 | GO:0007413 | axonal fasciculation(GO:0007413) |
| 1.1 | 15.4 | GO:0031987 | locomotion involved in locomotory behavior(GO:0031987) |
| 1.1 | 3.3 | GO:0071947 | protein deubiquitination involved in ubiquitin-dependent protein catabolic process(GO:0071947) protein K33-linked deubiquitination(GO:1990168) |
| 1.1 | 3.3 | GO:0051771 | negative regulation of nitric-oxide synthase biosynthetic process(GO:0051771) |
| 1.1 | 3.2 | GO:0035928 | rRNA import into mitochondrion(GO:0035928) |
| 1.0 | 23.9 | GO:0060992 | response to fungicide(GO:0060992) |
| 1.0 | 3.1 | GO:0030824 | negative regulation of cGMP metabolic process(GO:0030824) |
| 0.9 | 2.8 | GO:0051697 | protein delipidation(GO:0051697) |
| 0.9 | 6.6 | GO:0000103 | sulfate assimilation(GO:0000103) |
| 0.9 | 34.0 | GO:0007340 | acrosome reaction(GO:0007340) |
| 0.9 | 37.2 | GO:0048791 | calcium ion-regulated exocytosis of neurotransmitter(GO:0048791) |
| 0.9 | 13.5 | GO:0007288 | sperm axoneme assembly(GO:0007288) |
| 0.9 | 18.7 | GO:0010763 | positive regulation of fibroblast migration(GO:0010763) |
| 0.9 | 7.1 | GO:0060012 | synaptic transmission, glycinergic(GO:0060012) |
| 0.9 | 2.6 | GO:0006788 | heme oxidation(GO:0006788) |
| 0.9 | 1.7 | GO:2000286 | receptor internalization involved in canonical Wnt signaling pathway(GO:2000286) |
| 0.8 | 4.1 | GO:0034316 | negative regulation of Arp2/3 complex-mediated actin nucleation(GO:0034316) |
| 0.8 | 3.2 | GO:1902174 | positive regulation of keratinocyte apoptotic process(GO:1902174) |
| 0.8 | 16.1 | GO:0099514 | anterograde synaptic vesicle transport(GO:0048490) synaptic vesicle cytoskeletal transport(GO:0099514) synaptic vesicle transport along microtubule(GO:0099517) |
| 0.8 | 6.3 | GO:0006703 | estrogen biosynthetic process(GO:0006703) |
| 0.8 | 2.3 | GO:0042732 | D-xylose metabolic process(GO:0042732) |
| 0.8 | 3.1 | GO:0044861 | protein transport into plasma membrane raft(GO:0044861) |
| 0.8 | 4.5 | GO:0035735 | intraciliary transport involved in cilium morphogenesis(GO:0035735) |
| 0.7 | 6.7 | GO:0009134 | nucleoside diphosphate catabolic process(GO:0009134) |
| 0.7 | 5.9 | GO:2000628 | regulation of miRNA metabolic process(GO:2000628) |
| 0.7 | 12.9 | GO:0016339 | calcium-dependent cell-cell adhesion via plasma membrane cell adhesion molecules(GO:0016339) |
| 0.7 | 14.1 | GO:0021859 | pyramidal neuron differentiation(GO:0021859) |
| 0.7 | 2.1 | GO:1903371 | regulation of endoplasmic reticulum tubular network organization(GO:1903371) |
| 0.7 | 2.7 | GO:0000379 | tRNA-type intron splice site recognition and cleavage(GO:0000379) |
| 0.7 | 6.6 | GO:0035021 | negative regulation of Rac protein signal transduction(GO:0035021) |
| 0.6 | 8.4 | GO:0043508 | negative regulation of JUN kinase activity(GO:0043508) |
| 0.6 | 3.9 | GO:0038203 | TORC2 signaling(GO:0038203) |
| 0.6 | 11.5 | GO:0048710 | regulation of astrocyte differentiation(GO:0048710) |
| 0.6 | 12.0 | GO:0030449 | regulation of complement activation(GO:0030449) |
| 0.6 | 1.9 | GO:0043605 | cellular amide catabolic process(GO:0043605) |
| 0.6 | 81.9 | GO:0007156 | homophilic cell adhesion via plasma membrane adhesion molecules(GO:0007156) |
| 0.6 | 14.1 | GO:0015812 | gamma-aminobutyric acid transport(GO:0015812) |
| 0.6 | 41.0 | GO:0042220 | response to cocaine(GO:0042220) |
| 0.6 | 1.8 | GO:0003220 | left ventricular cardiac muscle tissue morphogenesis(GO:0003220) positive regulation of the force of heart contraction(GO:0098735) |
| 0.6 | 4.7 | GO:0032471 | negative regulation of endoplasmic reticulum calcium ion concentration(GO:0032471) |
| 0.6 | 2.9 | GO:0046005 | positive regulation of circadian sleep/wake cycle, REM sleep(GO:0046005) |
| 0.6 | 1.2 | GO:0032417 | positive regulation of sodium:proton antiporter activity(GO:0032417) |
| 0.6 | 1.1 | GO:1904117 | cellular response to vasopressin(GO:1904117) |
| 0.6 | 20.4 | GO:0072661 | protein targeting to plasma membrane(GO:0072661) |
| 0.5 | 8.5 | GO:0000185 | activation of MAPKKK activity(GO:0000185) |
| 0.5 | 39.9 | GO:0071300 | cellular response to retinoic acid(GO:0071300) |
| 0.5 | 1.6 | GO:0031989 | bombesin receptor signaling pathway(GO:0031989) |
| 0.5 | 23.1 | GO:0045744 | negative regulation of G-protein coupled receptor protein signaling pathway(GO:0045744) |
| 0.5 | 4.7 | GO:0048208 | vesicle targeting, rough ER to cis-Golgi(GO:0048207) COPII vesicle coating(GO:0048208) |
| 0.5 | 4.1 | GO:0090110 | cargo loading into COPII-coated vesicle(GO:0090110) |
| 0.5 | 2.5 | GO:0043456 | regulation of pentose-phosphate shunt(GO:0043456) |
| 0.5 | 29.8 | GO:0080171 | lysosome organization(GO:0007040) lytic vacuole organization(GO:0080171) |
| 0.5 | 20.2 | GO:0007026 | negative regulation of microtubule depolymerization(GO:0007026) |
| 0.5 | 3.0 | GO:0045541 | negative regulation of cholesterol biosynthetic process(GO:0045541) negative regulation of cholesterol metabolic process(GO:0090206) |
| 0.5 | 15.3 | GO:1901381 | positive regulation of potassium ion transmembrane transport(GO:1901381) |
| 0.5 | 1.5 | GO:0032915 | positive regulation of transforming growth factor beta2 production(GO:0032915) |
| 0.5 | 1.9 | GO:0035965 | cardiolipin acyl-chain remodeling(GO:0035965) |
| 0.5 | 6.3 | GO:0046069 | cGMP catabolic process(GO:0046069) |
| 0.5 | 5.7 | GO:1990403 | embryonic brain development(GO:1990403) |
| 0.5 | 3.7 | GO:0006578 | amino-acid betaine biosynthetic process(GO:0006578) |
| 0.5 | 1.4 | GO:0042335 | cuticle development(GO:0042335) |
| 0.4 | 2.2 | GO:0006566 | threonine metabolic process(GO:0006566) short-chain fatty acid biosynthetic process(GO:0051790) |
| 0.4 | 1.3 | GO:0072720 | response to dithiothreitol(GO:0072720) |
| 0.4 | 1.3 | GO:0072268 | proximal/distal pattern formation involved in nephron development(GO:0072047) specification of nephron tubule identity(GO:0072081) specification of loop of Henle identity(GO:0072086) pattern specification involved in metanephros development(GO:0072268) |
| 0.4 | 1.3 | GO:0042350 | GDP-L-fucose biosynthetic process(GO:0042350) |
| 0.4 | 3.4 | GO:0090043 | regulation of tubulin deacetylation(GO:0090043) |
| 0.4 | 28.9 | GO:0051965 | positive regulation of synapse assembly(GO:0051965) |
| 0.4 | 2.5 | GO:0006069 | ethanol oxidation(GO:0006069) |
| 0.4 | 2.0 | GO:1903551 | regulation of extracellular exosome assembly(GO:1903551) |
| 0.4 | 1.9 | GO:0051919 | positive regulation of fibrinolysis(GO:0051919) |
| 0.3 | 2.0 | GO:0006102 | isocitrate metabolic process(GO:0006102) glyoxylate metabolic process(GO:0046487) |
| 0.3 | 4.6 | GO:1901642 | nucleoside transmembrane transport(GO:1901642) |
| 0.3 | 2.3 | GO:0006598 | polyamine catabolic process(GO:0006598) |
| 0.3 | 7.1 | GO:0015012 | heparan sulfate proteoglycan biosynthetic process(GO:0015012) |
| 0.3 | 1.0 | GO:1903944 | cholangiocyte apoptotic process(GO:1902488) regulation of hepatocyte apoptotic process(GO:1903943) negative regulation of hepatocyte apoptotic process(GO:1903944) regulation of cholangiocyte apoptotic process(GO:1904192) negative regulation of cholangiocyte apoptotic process(GO:1904193) |
| 0.3 | 3.5 | GO:0007171 | activation of transmembrane receptor protein tyrosine kinase activity(GO:0007171) |
| 0.3 | 2.8 | GO:0007220 | Notch receptor processing(GO:0007220) |
| 0.3 | 5.2 | GO:0034587 | piRNA metabolic process(GO:0034587) |
| 0.3 | 3.1 | GO:1904153 | negative regulation of protein exit from endoplasmic reticulum(GO:0070862) negative regulation of retrograde protein transport, ER to cytosol(GO:1904153) |
| 0.3 | 3.6 | GO:0021796 | cerebral cortex regionalization(GO:0021796) |
| 0.3 | 2.7 | GO:0048934 | peripheral nervous system neuron differentiation(GO:0048934) peripheral nervous system neuron development(GO:0048935) |
| 0.3 | 23.0 | GO:0010923 | negative regulation of phosphatase activity(GO:0010923) |
| 0.3 | 13.5 | GO:0010812 | negative regulation of cell-substrate adhesion(GO:0010812) |
| 0.3 | 0.6 | GO:0060585 | regulation of prostaglandin-endoperoxide synthase activity(GO:0060584) positive regulation of prostaglandin-endoperoxide synthase activity(GO:0060585) |
| 0.3 | 1.1 | GO:0051661 | maintenance of centrosome location(GO:0051661) |
| 0.3 | 9.0 | GO:0045747 | positive regulation of Notch signaling pathway(GO:0045747) |
| 0.3 | 3.2 | GO:0097369 | sodium ion import(GO:0097369) sodium ion import across plasma membrane(GO:0098719) sodium ion import into cell(GO:1990118) |
| 0.3 | 2.6 | GO:0006228 | UTP biosynthetic process(GO:0006228) |
| 0.3 | 3.1 | GO:0016540 | protein autoprocessing(GO:0016540) |
| 0.3 | 10.9 | GO:0032467 | positive regulation of cytokinesis(GO:0032467) |
| 0.2 | 0.7 | GO:0090234 | regulation of kinetochore assembly(GO:0090234) |
| 0.2 | 2.7 | GO:0039702 | viral budding via host ESCRT complex(GO:0039702) |
| 0.2 | 33.9 | GO:1990138 | neuron projection extension(GO:1990138) |
| 0.2 | 18.0 | GO:0032091 | negative regulation of protein binding(GO:0032091) |
| 0.2 | 14.4 | GO:0035249 | synaptic transmission, glutamatergic(GO:0035249) |
| 0.2 | 1.4 | GO:0042045 | epithelial fluid transport(GO:0042045) |
| 0.2 | 6.0 | GO:0045332 | phospholipid translocation(GO:0045332) |
| 0.2 | 2.2 | GO:0016926 | protein desumoylation(GO:0016926) |
| 0.2 | 5.5 | GO:0045109 | intermediate filament organization(GO:0045109) |
| 0.2 | 2.8 | GO:0032836 | glomerular basement membrane development(GO:0032836) |
| 0.2 | 2.3 | GO:0032119 | sequestering of zinc ion(GO:0032119) regulation of sequestering of zinc ion(GO:0061088) |
| 0.2 | 0.9 | GO:1990375 | prostate epithelial cord elongation(GO:0060523) baculum development(GO:1990375) |
| 0.2 | 3.8 | GO:0040036 | regulation of fibroblast growth factor receptor signaling pathway(GO:0040036) |
| 0.2 | 8.8 | GO:0006695 | cholesterol biosynthetic process(GO:0006695) |
| 0.2 | 6.9 | GO:0015991 | ATP hydrolysis coupled proton transport(GO:0015991) |
| 0.2 | 0.6 | GO:0014908 | myotube differentiation involved in skeletal muscle regeneration(GO:0014908) |
| 0.2 | 6.6 | GO:1904659 | hexose transmembrane transport(GO:0035428) glucose transmembrane transport(GO:1904659) |
| 0.2 | 12.2 | GO:0008306 | associative learning(GO:0008306) |
| 0.2 | 7.0 | GO:0046839 | phospholipid dephosphorylation(GO:0046839) |
| 0.2 | 1.1 | GO:0010571 | positive regulation of nuclear cell cycle DNA replication(GO:0010571) |
| 0.2 | 1.8 | GO:0006657 | CDP-choline pathway(GO:0006657) |
| 0.2 | 2.8 | GO:0043586 | tongue development(GO:0043586) |
| 0.2 | 1.9 | GO:0006122 | mitochondrial electron transport, ubiquinol to cytochrome c(GO:0006122) |
| 0.2 | 1.9 | GO:1902018 | negative regulation of cilium assembly(GO:1902018) |
| 0.2 | 3.1 | GO:0006020 | inositol metabolic process(GO:0006020) |
| 0.2 | 2.4 | GO:0051764 | actin crosslink formation(GO:0051764) |
| 0.2 | 0.2 | GO:0090526 | regulation of gluconeogenesis involved in cellular glucose homeostasis(GO:0090526) |
| 0.2 | 0.9 | GO:0010764 | negative regulation of fibroblast migration(GO:0010764) |
| 0.2 | 1.2 | GO:2001204 | regulation of osteoclast development(GO:2001204) |
| 0.2 | 4.3 | GO:0001578 | microtubule bundle formation(GO:0001578) |
| 0.2 | 6.1 | GO:0051693 | actin filament capping(GO:0051693) |
| 0.1 | 3.9 | GO:0007339 | binding of sperm to zona pellucida(GO:0007339) |
| 0.1 | 3.0 | GO:0060065 | uterus development(GO:0060065) |
| 0.1 | 4.1 | GO:0051058 | negative regulation of small GTPase mediated signal transduction(GO:0051058) |
| 0.1 | 3.5 | GO:0016556 | mRNA modification(GO:0016556) |
| 0.1 | 0.4 | GO:0035519 | protein K29-linked ubiquitination(GO:0035519) |
| 0.1 | 8.6 | GO:0001657 | ureteric bud development(GO:0001657) |
| 0.1 | 1.7 | GO:0010801 | negative regulation of peptidyl-threonine phosphorylation(GO:0010801) |
| 0.1 | 2.0 | GO:0033622 | integrin activation(GO:0033622) |
| 0.1 | 2.0 | GO:0031167 | rRNA methylation(GO:0031167) |
| 0.1 | 2.3 | GO:0032012 | regulation of ARF protein signal transduction(GO:0032012) |
| 0.1 | 0.5 | GO:0006004 | fucose metabolic process(GO:0006004) |
| 0.1 | 1.5 | GO:0008210 | estrogen metabolic process(GO:0008210) |
| 0.1 | 10.4 | GO:0009062 | fatty acid catabolic process(GO:0009062) |
| 0.1 | 2.6 | GO:0016601 | Rac protein signal transduction(GO:0016601) |
| 0.1 | 3.6 | GO:0048741 | skeletal muscle fiber development(GO:0048741) |
| 0.1 | 1.5 | GO:0033866 | coenzyme A biosynthetic process(GO:0015937) nucleoside bisphosphate biosynthetic process(GO:0033866) ribonucleoside bisphosphate biosynthetic process(GO:0034030) purine nucleoside bisphosphate biosynthetic process(GO:0034033) |
| 0.1 | 1.4 | GO:0009083 | branched-chain amino acid catabolic process(GO:0009083) |
| 0.1 | 1.1 | GO:0031145 | anaphase-promoting complex-dependent catabolic process(GO:0031145) |
| 0.1 | 2.2 | GO:0031581 | hemidesmosome assembly(GO:0031581) |
| 0.1 | 3.5 | GO:0046854 | phosphatidylinositol phosphorylation(GO:0046854) |
| 0.1 | 3.8 | GO:0030032 | lamellipodium assembly(GO:0030032) |
| 0.1 | 2.2 | GO:0016578 | histone deubiquitination(GO:0016578) |
| 0.1 | 7.5 | GO:0006986 | response to unfolded protein(GO:0006986) |
| 0.1 | 0.9 | GO:0014002 | astrocyte development(GO:0014002) |
| 0.1 | 4.1 | GO:0090263 | positive regulation of canonical Wnt signaling pathway(GO:0090263) |
| 0.1 | 1.5 | GO:0007019 | microtubule depolymerization(GO:0007019) |
| 0.1 | 0.3 | GO:0006433 | prolyl-tRNA aminoacylation(GO:0006433) |
| 0.1 | 0.6 | GO:0014886 | transition between slow and fast fiber(GO:0014886) |
| 0.1 | 1.0 | GO:0006654 | phosphatidic acid biosynthetic process(GO:0006654) |
| 0.1 | 4.5 | GO:0032526 | response to retinoic acid(GO:0032526) |
| 0.1 | 2.7 | GO:0032456 | endocytic recycling(GO:0032456) |
| 0.1 | 0.3 | GO:0086053 | AV node cell to bundle of His cell communication by electrical coupling(GO:0086053) |
| 0.1 | 12.9 | GO:0007018 | microtubule-based movement(GO:0007018) |
| 0.1 | 7.7 | GO:0006821 | chloride transport(GO:0006821) |
| 0.1 | 0.4 | GO:0000480 | endonucleolytic cleavage in 5'-ETS of tricistronic rRNA transcript (SSU-rRNA, 5.8S rRNA, LSU-rRNA)(GO:0000480) |
| 0.1 | 6.7 | GO:0006665 | sphingolipid metabolic process(GO:0006665) |
| 0.1 | 2.4 | GO:0043044 | ATP-dependent chromatin remodeling(GO:0043044) |
| 0.1 | 0.1 | GO:0046881 | sperm ejaculation(GO:0042713) positive regulation of follicle-stimulating hormone secretion(GO:0046881) |
| 0.1 | 4.5 | GO:0007218 | neuropeptide signaling pathway(GO:0007218) |
| 0.1 | 0.2 | GO:0060178 | regulation of exocyst localization(GO:0060178) |
| 0.1 | 0.4 | GO:0072329 | monocarboxylic acid catabolic process(GO:0072329) |
| 0.1 | 0.6 | GO:0046457 | prostaglandin biosynthetic process(GO:0001516) prostanoid biosynthetic process(GO:0046457) |
| 0.1 | 0.2 | GO:2000255 | negative regulation of male germ cell proliferation(GO:2000255) |
| 0.1 | 0.2 | GO:2001168 | regulation of histone H2B ubiquitination(GO:2001166) positive regulation of histone H2B ubiquitination(GO:2001168) |
| 0.0 | 0.4 | GO:0009235 | cobalamin metabolic process(GO:0009235) |
| 0.0 | 1.4 | GO:2000273 | positive regulation of receptor activity(GO:2000273) |
| 0.0 | 0.5 | GO:1902043 | positive regulation of extrinsic apoptotic signaling pathway via death domain receptors(GO:1902043) |
| 0.0 | 2.6 | GO:0050905 | neuromuscular process(GO:0050905) |
| 0.0 | 0.6 | GO:0043968 | histone H2A acetylation(GO:0043968) |
| 0.0 | 1.4 | GO:0043967 | histone H4 acetylation(GO:0043967) |
| 0.0 | 1.3 | GO:0006749 | glutathione metabolic process(GO:0006749) |
| 0.0 | 2.7 | GO:0048015 | phosphatidylinositol-mediated signaling(GO:0048015) |
| 0.0 | 2.2 | GO:0042552 | myelination(GO:0042552) |
| 0.0 | 0.8 | GO:0021762 | substantia nigra development(GO:0021762) |
| 0.0 | 0.9 | GO:1902475 | L-alpha-amino acid transmembrane transport(GO:1902475) |
| 0.0 | 1.1 | GO:0046323 | glucose import(GO:0046323) |
| 0.0 | 0.2 | GO:0070327 | thyroid hormone transport(GO:0070327) |
| 0.0 | 0.1 | GO:0010544 | negative regulation of platelet activation(GO:0010544) |
| 0.0 | 0.1 | GO:0019918 | peptidyl-arginine methylation, to symmetrical-dimethyl arginine(GO:0019918) |
| 0.0 | 0.2 | GO:0016973 | poly(A)+ mRNA export from nucleus(GO:0016973) |
| 0.0 | 1.1 | GO:0090630 | activation of GTPase activity(GO:0090630) |
| 0.0 | 0.4 | GO:0007193 | adenylate cyclase-inhibiting G-protein coupled receptor signaling pathway(GO:0007193) |
| 0.0 | 0.1 | GO:0070125 | mitochondrial translational elongation(GO:0070125) |
| 0.0 | 1.2 | GO:0007030 | Golgi organization(GO:0007030) |
| 0.0 | 0.1 | GO:0060903 | positive regulation of meiosis I(GO:0060903) |
| 0.0 | 1.0 | GO:0030308 | negative regulation of cell growth(GO:0030308) |
| 0.0 | 0.9 | GO:0035335 | peptidyl-tyrosine dephosphorylation(GO:0035335) |
| 0.0 | 0.1 | GO:0048280 | vesicle fusion with Golgi apparatus(GO:0048280) |
Gene overrepresentation in cellular component category:
| Log-likelihood per target | Total log-likelihood | Term | Description |
|---|---|---|---|
| 6.0 | 18.0 | GO:0097453 | mesaxon(GO:0097453) ensheathing process(GO:1990015) |
| 4.1 | 41.5 | GO:0042788 | polysomal ribosome(GO:0042788) |
| 3.8 | 22.9 | GO:0042584 | chromaffin granule membrane(GO:0042584) |
| 3.7 | 25.7 | GO:0030991 | intraciliary transport particle A(GO:0030991) |
| 2.6 | 12.9 | GO:0016939 | kinesin II complex(GO:0016939) |
| 2.6 | 10.3 | GO:0002079 | inner acrosomal membrane(GO:0002079) |
| 2.5 | 20.3 | GO:0032584 | growth cone membrane(GO:0032584) |
| 2.5 | 84.4 | GO:0032281 | AMPA glutamate receptor complex(GO:0032281) |
| 2.4 | 7.1 | GO:0016935 | glycine-gated chloride channel complex(GO:0016935) GABA-ergic synapse(GO:0098982) |
| 2.2 | 20.2 | GO:0097442 | CA3 pyramidal cell dendrite(GO:0097442) |
| 2.2 | 6.6 | GO:0031230 | intrinsic component of cell outer membrane(GO:0031230) integral component of cell outer membrane(GO:0045203) |
| 2.1 | 12.6 | GO:0033093 | Weibel-Palade body(GO:0033093) |
| 1.8 | 25.6 | GO:0043083 | synaptic cleft(GO:0043083) |
| 1.8 | 43.9 | GO:0033268 | node of Ranvier(GO:0033268) |
| 1.7 | 18.8 | GO:0097418 | neurofibrillary tangle(GO:0097418) |
| 1.7 | 5.0 | GO:0042642 | actomyosin, myosin complex part(GO:0042642) |
| 1.6 | 19.4 | GO:0001518 | voltage-gated sodium channel complex(GO:0001518) |
| 1.6 | 6.2 | GO:0071914 | prominosome(GO:0071914) |
| 1.4 | 19.0 | GO:0031045 | dense core granule(GO:0031045) |
| 1.2 | 13.5 | GO:0002177 | manchette(GO:0002177) |
| 1.2 | 6.0 | GO:0005784 | Sec61 translocon complex(GO:0005784) translocon complex(GO:0071256) |
| 1.2 | 16.1 | GO:0030123 | AP-3 adaptor complex(GO:0030123) |
| 1.1 | 5.7 | GO:1990716 | axonemal central apparatus(GO:1990716) |
| 1.1 | 9.0 | GO:0016589 | NURF complex(GO:0016589) |
| 1.0 | 4.2 | GO:1990745 | EARP complex(GO:1990745) |
| 0.9 | 4.6 | GO:0048179 | activin receptor complex(GO:0048179) |
| 0.9 | 15.4 | GO:0036038 | MKS complex(GO:0036038) |
| 0.8 | 5.1 | GO:0071547 | piP-body(GO:0071547) |
| 0.8 | 31.6 | GO:0060077 | inhibitory synapse(GO:0060077) |
| 0.7 | 9.1 | GO:0032591 | dendritic spine membrane(GO:0032591) |
| 0.7 | 6.9 | GO:0033179 | proton-transporting V-type ATPase, V0 domain(GO:0033179) |
| 0.7 | 6.1 | GO:0008091 | spectrin(GO:0008091) |
| 0.7 | 17.0 | GO:0008074 | guanylate cyclase complex, soluble(GO:0008074) |
| 0.7 | 3.3 | GO:1990357 | terminal web(GO:1990357) |
| 0.6 | 14.8 | GO:0030057 | desmosome(GO:0030057) |
| 0.6 | 8.6 | GO:0044224 | juxtaparanode region of axon(GO:0044224) |
| 0.6 | 16.0 | GO:0097440 | apical dendrite(GO:0097440) |
| 0.6 | 1.7 | GO:0010009 | cytoplasmic side of endosome membrane(GO:0010009) |
| 0.5 | 2.7 | GO:0000214 | tRNA-intron endonuclease complex(GO:0000214) |
| 0.5 | 3.2 | GO:0002142 | stereocilia ankle link complex(GO:0002142) |
| 0.5 | 3.1 | GO:0005785 | signal recognition particle receptor complex(GO:0005785) |
| 0.5 | 6.8 | GO:0043202 | lysosomal lumen(GO:0043202) |
| 0.5 | 2.8 | GO:0070765 | gamma-secretase complex(GO:0070765) |
| 0.5 | 21.6 | GO:0034707 | chloride channel complex(GO:0034707) |
| 0.4 | 3.5 | GO:0000138 | Golgi trans cisterna(GO:0000138) |
| 0.4 | 13.5 | GO:0032809 | neuronal cell body membrane(GO:0032809) |
| 0.4 | 3.9 | GO:0061700 | GATOR2 complex(GO:0061700) |
| 0.4 | 1.3 | GO:1990723 | cytoplasmic periphery of the nuclear pore complex(GO:1990723) |
| 0.4 | 11.0 | GO:0030990 | intraciliary transport particle(GO:0030990) |
| 0.4 | 29.8 | GO:0099501 | synaptic vesicle membrane(GO:0030672) exocytic vesicle membrane(GO:0099501) |
| 0.4 | 27.5 | GO:0031901 | early endosome membrane(GO:0031901) |
| 0.4 | 5.9 | GO:1902555 | endoribonuclease complex(GO:1902555) |
| 0.4 | 1.8 | GO:0031105 | septin complex(GO:0031105) sperm annulus(GO:0097227) |
| 0.4 | 2.8 | GO:0098642 | collagen type IV trimer(GO:0005587) network-forming collagen trimer(GO:0098642) collagen network(GO:0098645) |
| 0.4 | 5.3 | GO:0071565 | nBAF complex(GO:0071565) |
| 0.3 | 2.7 | GO:0000815 | ESCRT III complex(GO:0000815) |
| 0.3 | 4.0 | GO:0035253 | ciliary rootlet(GO:0035253) |
| 0.3 | 7.5 | GO:0001673 | male germ cell nucleus(GO:0001673) |
| 0.3 | 1.0 | GO:0014701 | junctional sarcoplasmic reticulum membrane(GO:0014701) |
| 0.3 | 3.5 | GO:0034663 | endoplasmic reticulum chaperone complex(GO:0034663) |
| 0.3 | 52.4 | GO:0043204 | perikaryon(GO:0043204) |
| 0.3 | 3.1 | GO:0044354 | pinosome(GO:0044352) macropinosome(GO:0044354) |
| 0.3 | 2.1 | GO:0001674 | female germ cell nucleus(GO:0001674) germ cell nucleus(GO:0043073) |
| 0.3 | 16.6 | GO:0043198 | dendritic shaft(GO:0043198) |
| 0.3 | 3.1 | GO:0001527 | microfibril(GO:0001527) fibril(GO:0043205) |
| 0.3 | 1.4 | GO:0005947 | mitochondrial alpha-ketoglutarate dehydrogenase complex(GO:0005947) |
| 0.3 | 3.3 | GO:0036513 | low-density lipoprotein particle(GO:0034362) Derlin-1 retrotranslocation complex(GO:0036513) |
| 0.3 | 6.2 | GO:0032391 | photoreceptor connecting cilium(GO:0032391) |
| 0.2 | 1.2 | GO:0005608 | laminin-3 complex(GO:0005608) |
| 0.2 | 1.9 | GO:0005750 | mitochondrial respiratory chain complex III(GO:0005750) |
| 0.2 | 0.9 | GO:0060053 | neurofilament cytoskeleton(GO:0060053) |
| 0.2 | 121.2 | GO:0043025 | neuronal cell body(GO:0043025) |
| 0.2 | 1.8 | GO:0005964 | phosphorylase kinase complex(GO:0005964) |
| 0.2 | 15.0 | GO:0005811 | lipid particle(GO:0005811) |
| 0.2 | 55.9 | GO:0030424 | axon(GO:0030424) |
| 0.2 | 23.3 | GO:0030176 | integral component of endoplasmic reticulum membrane(GO:0030176) |
| 0.2 | 39.3 | GO:0043209 | myelin sheath(GO:0043209) |
| 0.2 | 12.5 | GO:0070382 | exocytic vesicle(GO:0070382) |
| 0.2 | 74.1 | GO:0005635 | nuclear envelope(GO:0005635) |
| 0.2 | 2.2 | GO:0000124 | SAGA complex(GO:0000124) |
| 0.2 | 4.1 | GO:0000159 | protein phosphatase type 2A complex(GO:0000159) |
| 0.2 | 1.1 | GO:0032593 | insulin-responsive compartment(GO:0032593) |
| 0.2 | 17.3 | GO:0005882 | intermediate filament(GO:0005882) |
| 0.2 | 1.8 | GO:0032045 | guanyl-nucleotide exchange factor complex(GO:0032045) |
| 0.2 | 0.3 | GO:0035838 | growing cell tip(GO:0035838) |
| 0.2 | 1.0 | GO:0097038 | perinuclear endoplasmic reticulum(GO:0097038) |
| 0.2 | 3.0 | GO:0001917 | photoreceptor inner segment(GO:0001917) |
| 0.1 | 21.4 | GO:0005802 | trans-Golgi network(GO:0005802) |
| 0.1 | 1.1 | GO:0097197 | tetraspanin-enriched microdomain(GO:0097197) |
| 0.1 | 6.1 | GO:0016592 | mediator complex(GO:0016592) |
| 0.1 | 5.3 | GO:0016529 | sarcoplasmic reticulum(GO:0016529) |
| 0.1 | 5.0 | GO:0009925 | basal plasma membrane(GO:0009925) |
| 0.1 | 1.8 | GO:0030127 | COPII vesicle coat(GO:0030127) |
| 0.1 | 7.2 | GO:0000315 | organellar large ribosomal subunit(GO:0000315) mitochondrial large ribosomal subunit(GO:0005762) |
| 0.1 | 19.0 | GO:0030425 | dendrite(GO:0030425) |
| 0.1 | 5.0 | GO:0030286 | dynein complex(GO:0030286) |
| 0.1 | 12.8 | GO:0043296 | apical junction complex(GO:0043296) |
| 0.1 | 0.6 | GO:0033588 | Elongator holoenzyme complex(GO:0033588) |
| 0.1 | 1.1 | GO:0031616 | spindle pole centrosome(GO:0031616) |
| 0.1 | 6.5 | GO:0099572 | postsynaptic density(GO:0014069) postsynaptic specialization(GO:0099572) |
| 0.1 | 0.9 | GO:0035869 | ciliary transition zone(GO:0035869) |
| 0.1 | 1.1 | GO:0031011 | Ino80 complex(GO:0031011) DNA helicase complex(GO:0033202) |
| 0.1 | 0.6 | GO:0002199 | zona pellucida receptor complex(GO:0002199) |
| 0.1 | 0.2 | GO:0033503 | HULC complex(GO:0033503) |
| 0.1 | 0.3 | GO:0097452 | GAIT complex(GO:0097452) |
| 0.1 | 6.5 | GO:0001669 | acrosomal vesicle(GO:0001669) |
| 0.1 | 1.5 | GO:0030118 | clathrin coat(GO:0030118) |
| 0.1 | 1.1 | GO:0005680 | anaphase-promoting complex(GO:0005680) |
| 0.1 | 2.0 | GO:0030658 | transport vesicle membrane(GO:0030658) |
| 0.0 | 0.6 | GO:0016580 | Sin3 complex(GO:0016580) |
| 0.0 | 1.5 | GO:0005871 | kinesin complex(GO:0005871) |
| 0.0 | 0.2 | GO:0005790 | smooth endoplasmic reticulum(GO:0005790) |
| 0.0 | 7.5 | GO:0005759 | mitochondrial matrix(GO:0005759) |
| 0.0 | 1.1 | GO:0005793 | endoplasmic reticulum-Golgi intermediate compartment(GO:0005793) |
| 0.0 | 1.0 | GO:0046658 | anchored component of plasma membrane(GO:0046658) |
| 0.0 | 4.6 | GO:0043235 | receptor complex(GO:0043235) |
| 0.0 | 4.8 | GO:0045202 | synapse(GO:0045202) |
| 0.0 | 11.8 | GO:0005789 | endoplasmic reticulum membrane(GO:0005789) |
| 0.0 | 0.6 | GO:0008180 | COP9 signalosome(GO:0008180) |
| 0.0 | 0.0 | GO:0016600 | flotillin complex(GO:0016600) |
| 0.0 | 0.3 | GO:0005922 | connexon complex(GO:0005922) |
| 0.0 | 1.7 | GO:0010008 | endosome membrane(GO:0010008) |
Gene overrepresentation in molecular function category:
| Log-likelihood per target | Total log-likelihood | Term | Description |
|---|---|---|---|
| 6.1 | 24.4 | GO:0031750 | D3 dopamine receptor binding(GO:0031750) |
| 5.3 | 16.0 | GO:0050429 | calcium-dependent phospholipase C activity(GO:0050429) |
| 4.8 | 23.9 | GO:0004971 | AMPA glutamate receptor activity(GO:0004971) |
| 4.6 | 22.9 | GO:0030348 | syntaxin-3 binding(GO:0030348) |
| 4.5 | 13.6 | GO:0030156 | benzodiazepine receptor binding(GO:0030156) |
| 4.2 | 12.6 | GO:0031708 | endothelin B receptor binding(GO:0031708) |
| 4.1 | 16.4 | GO:0004963 | follicle-stimulating hormone receptor activity(GO:0004963) |
| 3.6 | 10.7 | GO:0003845 | 11-beta-hydroxysteroid dehydrogenase [NAD(P)] activity(GO:0003845) |
| 3.5 | 17.3 | GO:0008332 | low voltage-gated calcium channel activity(GO:0008332) |
| 3.1 | 31.1 | GO:0004385 | guanylate kinase activity(GO:0004385) |
| 3.0 | 8.9 | GO:0031893 | vasopressin receptor binding(GO:0031893) |
| 2.8 | 17.1 | GO:0070290 | N-acylphosphatidylethanolamine-specific phospholipase D activity(GO:0070290) |
| 2.8 | 22.4 | GO:0008430 | selenium binding(GO:0008430) |
| 2.6 | 18.0 | GO:0004111 | creatine kinase activity(GO:0004111) |
| 2.5 | 7.6 | GO:0008330 | protein tyrosine/threonine phosphatase activity(GO:0008330) |
| 2.5 | 35.1 | GO:0016805 | dipeptidase activity(GO:0016805) |
| 2.5 | 12.4 | GO:0050309 | glucose-6-phosphatase activity(GO:0004346) sugar-terminal-phosphatase activity(GO:0050309) |
| 2.4 | 14.6 | GO:0017040 | ceramidase activity(GO:0017040) |
| 2.4 | 14.1 | GO:0005332 | gamma-aminobutyric acid:sodium symporter activity(GO:0005332) |
| 2.4 | 7.1 | GO:0022852 | glycine-gated chloride ion channel activity(GO:0022852) |
| 2.2 | 15.3 | GO:0008239 | dipeptidyl-peptidase activity(GO:0008239) |
| 2.1 | 36.2 | GO:0008179 | adenylate cyclase binding(GO:0008179) |
| 2.1 | 6.3 | GO:0000253 | 3-keto sterol reductase activity(GO:0000253) |
| 2.0 | 6.1 | GO:0047045 | testosterone 17-beta-dehydrogenase (NADP+) activity(GO:0047045) |
| 2.0 | 6.0 | GO:0050145 | nucleoside phosphate kinase activity(GO:0050145) |
| 1.8 | 10.9 | GO:0015016 | [heparan sulfate]-glucosamine N-sulfotransferase activity(GO:0015016) |
| 1.8 | 5.3 | GO:0086057 | voltage-gated calcium channel activity involved in bundle of His cell action potential(GO:0086057) |
| 1.7 | 8.7 | GO:0031802 | type 5 metabotropic glutamate receptor binding(GO:0031802) |
| 1.7 | 22.6 | GO:0004089 | carbonate dehydratase activity(GO:0004089) |
| 1.7 | 46.7 | GO:0017091 | AU-rich element binding(GO:0017091) |
| 1.7 | 12.0 | GO:0031404 | chloride ion binding(GO:0031404) |
| 1.7 | 8.3 | GO:0004962 | endothelin receptor activity(GO:0004962) |
| 1.6 | 4.7 | GO:0004066 | asparagine synthase (glutamine-hydrolyzing) activity(GO:0004066) |
| 1.6 | 7.8 | GO:0050833 | pyruvate transmembrane transporter activity(GO:0050833) |
| 1.5 | 9.1 | GO:0008349 | MAP kinase kinase kinase kinase activity(GO:0008349) |
| 1.5 | 5.9 | GO:0004525 | ribonuclease III activity(GO:0004525) double-stranded RNA-specific ribonuclease activity(GO:0032296) |
| 1.4 | 4.3 | GO:0004769 | steroid delta-isomerase activity(GO:0004769) |
| 1.4 | 4.3 | GO:0016453 | C-acetyltransferase activity(GO:0016453) |
| 1.4 | 10.1 | GO:0031821 | G-protein coupled serotonin receptor binding(GO:0031821) |
| 1.4 | 16.8 | GO:0008191 | metalloendopeptidase inhibitor activity(GO:0008191) |
| 1.4 | 16.6 | GO:0004708 | MAP kinase kinase activity(GO:0004708) |
| 1.4 | 8.2 | GO:0005078 | MAP-kinase scaffold activity(GO:0005078) |
| 1.4 | 19.0 | GO:0042043 | neurexin family protein binding(GO:0042043) |
| 1.3 | 18.0 | GO:0033691 | sialic acid binding(GO:0033691) |
| 1.3 | 30.2 | GO:0080025 | phosphatidylinositol-3,5-bisphosphate binding(GO:0080025) |
| 1.2 | 3.5 | GO:0004925 | prolactin receptor activity(GO:0004925) |
| 1.1 | 4.5 | GO:0008569 | ATP-dependent microtubule motor activity, minus-end-directed(GO:0008569) |
| 1.1 | 18.8 | GO:0015643 | toxic substance binding(GO:0015643) |
| 1.1 | 9.9 | GO:0001591 | dopamine neurotransmitter receptor activity, coupled via Gi/Go(GO:0001591) |
| 1.1 | 8.8 | GO:0002151 | G-quadruplex RNA binding(GO:0002151) |
| 1.1 | 11.8 | GO:0001846 | opsonin binding(GO:0001846) |
| 1.0 | 3.1 | GO:0000827 | inositol-1,3,4,5,6-pentakisphosphate kinase activity(GO:0000827) |
| 1.0 | 17.4 | GO:0008195 | phosphatidate phosphatase activity(GO:0008195) |
| 1.0 | 6.8 | GO:0030492 | hemoglobin binding(GO:0030492) |
| 1.0 | 2.9 | GO:0031770 | growth hormone-releasing hormone receptor binding(GO:0031770) |
| 1.0 | 20.2 | GO:0002162 | dystroglycan binding(GO:0002162) |
| 0.9 | 6.6 | GO:0004062 | aryl sulfotransferase activity(GO:0004062) |
| 0.9 | 6.3 | GO:0004118 | cGMP-stimulated cyclic-nucleotide phosphodiesterase activity(GO:0004118) |
| 0.9 | 10.5 | GO:0102391 | decanoate--CoA ligase activity(GO:0102391) |
| 0.9 | 3.5 | GO:0016312 | 3'(2'),5'-bisphosphate nucleotidase activity(GO:0008441) inositol bisphosphate phosphatase activity(GO:0016312) |
| 0.9 | 2.6 | GO:0004392 | heme oxygenase (decyclizing) activity(GO:0004392) |
| 0.9 | 7.7 | GO:0008559 | xenobiotic-transporting ATPase activity(GO:0008559) |
| 0.9 | 18.0 | GO:0005159 | insulin-like growth factor receptor binding(GO:0005159) |
| 0.8 | 2.5 | GO:0019115 | all-trans retinal binding(GO:0005503) benzaldehyde dehydrogenase activity(GO:0019115) S-(hydroxymethyl)glutathione dehydrogenase activity(GO:0051903) |
| 0.8 | 9.0 | GO:0004653 | polypeptide N-acetylgalactosaminyltransferase activity(GO:0004653) |
| 0.8 | 6.5 | GO:0030274 | LIM domain binding(GO:0030274) |
| 0.8 | 3.2 | GO:0061665 | SUMO ligase activity(GO:0061665) |
| 0.8 | 4.0 | GO:0004064 | arylesterase activity(GO:0004064) |
| 0.8 | 5.3 | GO:0005432 | calcium:sodium antiporter activity(GO:0005432) |
| 0.7 | 19.4 | GO:0031402 | sodium ion binding(GO:0031402) |
| 0.7 | 3.0 | GO:0008597 | calcium-dependent protein serine/threonine phosphatase regulator activity(GO:0008597) |
| 0.7 | 4.9 | GO:0034711 | inhibin binding(GO:0034711) |
| 0.7 | 20.8 | GO:0015020 | glucuronosyltransferase activity(GO:0015020) |
| 0.7 | 12.8 | GO:0004435 | phosphatidylinositol phospholipase C activity(GO:0004435) |
| 0.7 | 2.0 | GO:0051990 | (R)-2-hydroxyglutarate dehydrogenase activity(GO:0051990) |
| 0.7 | 8.0 | GO:0004983 | neuropeptide Y receptor activity(GO:0004983) |
| 0.7 | 23.2 | GO:0001965 | G-protein alpha-subunit binding(GO:0001965) |
| 0.7 | 2.0 | GO:0000179 | rRNA (adenine-N6,N6-)-dimethyltransferase activity(GO:0000179) |
| 0.6 | 5.8 | GO:0019871 | sodium channel inhibitor activity(GO:0019871) |
| 0.6 | 5.8 | GO:0031748 | D1 dopamine receptor binding(GO:0031748) |
| 0.6 | 8.7 | GO:0017154 | semaphorin receptor activity(GO:0017154) |
| 0.6 | 3.0 | GO:0001729 | ceramide kinase activity(GO:0001729) |
| 0.6 | 35.5 | GO:0005080 | protein kinase C binding(GO:0005080) |
| 0.6 | 13.5 | GO:0005251 | delayed rectifier potassium channel activity(GO:0005251) |
| 0.5 | 5.5 | GO:0036310 | annealing helicase activity(GO:0036310) |
| 0.5 | 2.7 | GO:0000213 | tRNA-intron endonuclease activity(GO:0000213) |
| 0.5 | 1.6 | GO:0004946 | bombesin receptor activity(GO:0004946) |
| 0.5 | 8.5 | GO:0008252 | nucleotidase activity(GO:0008252) 5'-nucleotidase activity(GO:0008253) |
| 0.5 | 5.4 | GO:0039706 | co-receptor binding(GO:0039706) |
| 0.5 | 1.4 | GO:0010484 | H3 histone acetyltransferase activity(GO:0010484) |
| 0.5 | 1.8 | GO:0005219 | ryanodine-sensitive calcium-release channel activity(GO:0005219) |
| 0.5 | 10.4 | GO:0005112 | Notch binding(GO:0005112) |
| 0.4 | 13.4 | GO:0071855 | neuropeptide receptor binding(GO:0071855) |
| 0.4 | 4.6 | GO:0008504 | monoamine transmembrane transporter activity(GO:0008504) |
| 0.4 | 20.7 | GO:0030507 | spectrin binding(GO:0030507) |
| 0.4 | 2.4 | GO:0035374 | chondroitin sulfate binding(GO:0035374) |
| 0.4 | 3.1 | GO:0030249 | guanylate cyclase regulator activity(GO:0030249) |
| 0.4 | 3.1 | GO:0003996 | acyl-CoA ligase activity(GO:0003996) |
| 0.4 | 1.5 | GO:0004619 | bisphosphoglycerate mutase activity(GO:0004082) phosphoglycerate mutase activity(GO:0004619) 2,3-bisphosphoglycerate-dependent phosphoglycerate mutase activity(GO:0046538) |
| 0.4 | 1.5 | GO:0004594 | pantothenate kinase activity(GO:0004594) |
| 0.4 | 5.9 | GO:0005351 | sugar:proton symporter activity(GO:0005351) |
| 0.4 | 1.8 | GO:0004105 | choline-phosphate cytidylyltransferase activity(GO:0004105) |
| 0.4 | 1.4 | GO:0016802 | adenosylhomocysteinase activity(GO:0004013) trialkylsulfonium hydrolase activity(GO:0016802) |
| 0.4 | 2.9 | GO:0043199 | sulfate binding(GO:0043199) |
| 0.4 | 2.8 | GO:0036122 | BMP binding(GO:0036122) |
| 0.3 | 1.7 | GO:0051021 | GDP-dissociation inhibitor binding(GO:0051021) |
| 0.3 | 17.0 | GO:0019894 | kinesin binding(GO:0019894) |
| 0.3 | 6.0 | GO:0004012 | phospholipid-translocating ATPase activity(GO:0004012) |
| 0.3 | 3.2 | GO:0015386 | potassium:proton antiporter activity(GO:0015386) potassium ion antiporter activity(GO:0022821) |
| 0.3 | 5.0 | GO:0043008 | ATP-dependent protein binding(GO:0043008) |
| 0.3 | 4.1 | GO:0043024 | ribosomal small subunit binding(GO:0043024) |
| 0.3 | 2.7 | GO:0004931 | extracellular ATP-gated cation channel activity(GO:0004931) ATP-gated ion channel activity(GO:0035381) |
| 0.3 | 2.0 | GO:0005173 | stem cell factor receptor binding(GO:0005173) |
| 0.3 | 3.7 | GO:0019206 | nucleoside kinase activity(GO:0019206) |
| 0.3 | 17.1 | GO:0003777 | microtubule motor activity(GO:0003777) |
| 0.2 | 4.0 | GO:0051010 | microtubule plus-end binding(GO:0051010) |
| 0.2 | 41.2 | GO:0017137 | Rab GTPase binding(GO:0017137) |
| 0.2 | 3.2 | GO:0008097 | 5S rRNA binding(GO:0008097) |
| 0.2 | 1.5 | GO:0004366 | glycerol-3-phosphate O-acyltransferase activity(GO:0004366) |
| 0.2 | 6.6 | GO:0043027 | cysteine-type endopeptidase inhibitor activity involved in apoptotic process(GO:0043027) |
| 0.2 | 1.9 | GO:0016681 | ubiquinol-cytochrome-c reductase activity(GO:0008121) oxidoreductase activity, acting on diphenols and related substances as donors, cytochrome as acceptor(GO:0016681) |
| 0.2 | 4.9 | GO:0043014 | alpha-tubulin binding(GO:0043014) |
| 0.2 | 3.3 | GO:1990381 | ubiquitin-specific protease binding(GO:1990381) |
| 0.2 | 3.7 | GO:0004029 | aldehyde dehydrogenase (NAD) activity(GO:0004029) |
| 0.2 | 0.9 | GO:0031731 | CCR6 chemokine receptor binding(GO:0031731) |
| 0.2 | 0.9 | GO:0031798 | type 1 metabotropic glutamate receptor binding(GO:0031798) |
| 0.2 | 6.2 | GO:0008395 | steroid hydroxylase activity(GO:0008395) |
| 0.2 | 7.0 | GO:0016814 | hydrolase activity, acting on carbon-nitrogen (but not peptide) bonds, in cyclic amidines(GO:0016814) |
| 0.2 | 2.2 | GO:0016929 | SUMO-specific protease activity(GO:0016929) |
| 0.2 | 10.3 | GO:0030971 | receptor tyrosine kinase binding(GO:0030971) |
| 0.2 | 19.5 | GO:0019210 | kinase inhibitor activity(GO:0019210) |
| 0.2 | 12.5 | GO:0043621 | protein self-association(GO:0043621) |
| 0.2 | 4.9 | GO:0005086 | ARF guanyl-nucleotide exchange factor activity(GO:0005086) |
| 0.2 | 1.9 | GO:0034236 | protein kinase A catalytic subunit binding(GO:0034236) |
| 0.2 | 3.3 | GO:0070530 | K63-linked polyubiquitin binding(GO:0070530) |
| 0.2 | 1.4 | GO:0030375 | thyroid hormone receptor coactivator activity(GO:0030375) |
| 0.2 | 15.9 | GO:0004222 | metalloendopeptidase activity(GO:0004222) |
| 0.2 | 8.9 | GO:0008146 | sulfotransferase activity(GO:0008146) |
| 0.2 | 25.6 | GO:0051015 | actin filament binding(GO:0051015) |
| 0.2 | 4.3 | GO:0070064 | proline-rich region binding(GO:0070064) |
| 0.2 | 1.9 | GO:0070008 | serine-type exopeptidase activity(GO:0070008) |
| 0.2 | 1.4 | GO:0016174 | NAD(P)H oxidase activity(GO:0016174) |
| 0.2 | 1.4 | GO:0016624 | oxidoreductase activity, acting on the aldehyde or oxo group of donors, disulfide as acceptor(GO:0016624) |
| 0.2 | 1.5 | GO:0043325 | phosphatidylinositol-3,4-bisphosphate binding(GO:0043325) |
| 0.1 | 0.7 | GO:0033142 | progesterone receptor binding(GO:0033142) |
| 0.1 | 1.5 | GO:0008140 | cAMP response element binding protein binding(GO:0008140) |
| 0.1 | 9.2 | GO:0016278 | lysine N-methyltransferase activity(GO:0016278) protein-lysine N-methyltransferase activity(GO:0016279) |
| 0.1 | 5.6 | GO:0017046 | peptide hormone binding(GO:0017046) |
| 0.1 | 11.7 | GO:0051082 | unfolded protein binding(GO:0051082) |
| 0.1 | 0.4 | GO:0047787 | delta4-3-oxosteroid 5beta-reductase activity(GO:0047787) |
| 0.1 | 7.0 | GO:0048306 | calcium-dependent protein binding(GO:0048306) |
| 0.1 | 4.7 | GO:0004364 | glutathione transferase activity(GO:0004364) |
| 0.1 | 2.2 | GO:0004198 | calcium-dependent cysteine-type endopeptidase activity(GO:0004198) |
| 0.1 | 2.1 | GO:0017056 | structural constituent of nuclear pore(GO:0017056) |
| 0.1 | 1.5 | GO:0033038 | bitter taste receptor activity(GO:0033038) |
| 0.1 | 2.7 | GO:0016866 | intramolecular transferase activity(GO:0016866) |
| 0.1 | 0.6 | GO:0050700 | CARD domain binding(GO:0050700) |
| 0.1 | 2.8 | GO:0004693 | cyclin-dependent protein serine/threonine kinase activity(GO:0004693) |
| 0.1 | 1.3 | GO:0003688 | DNA replication origin binding(GO:0003688) |
| 0.1 | 10.5 | GO:0004725 | protein tyrosine phosphatase activity(GO:0004725) |
| 0.1 | 1.0 | GO:0004331 | fructose-2,6-bisphosphate 2-phosphatase activity(GO:0004331) |
| 0.1 | 0.3 | GO:0004827 | proline-tRNA ligase activity(GO:0004827) |
| 0.1 | 9.1 | GO:0042826 | histone deacetylase binding(GO:0042826) |
| 0.1 | 0.8 | GO:0097371 | MDM2/MDM4 family protein binding(GO:0097371) |
| 0.1 | 1.6 | GO:0005247 | voltage-gated chloride channel activity(GO:0005247) |
| 0.1 | 3.0 | GO:0015485 | cholesterol binding(GO:0015485) |
| 0.1 | 0.3 | GO:0086075 | gap junction channel activity involved in cardiac conduction electrical coupling(GO:0086075) gap junction channel activity involved in AV node cell-bundle of His cell electrical coupling(GO:0086077) |
| 0.1 | 0.7 | GO:0005412 | glucose:sodium symporter activity(GO:0005412) |
| 0.1 | 2.8 | GO:0097110 | scaffold protein binding(GO:0097110) |
| 0.1 | 2.1 | GO:0015036 | disulfide oxidoreductase activity(GO:0015036) |
| 0.1 | 5.5 | GO:0030674 | protein binding, bridging(GO:0030674) |
| 0.1 | 2.3 | GO:0016655 | oxidoreductase activity, acting on NAD(P)H, quinone or similar compound as acceptor(GO:0016655) |
| 0.1 | 2.2 | GO:0030374 | ligand-dependent nuclear receptor transcription coactivator activity(GO:0030374) |
| 0.1 | 0.4 | GO:0031419 | cobalamin binding(GO:0031419) |
| 0.1 | 0.4 | GO:0050693 | LBD domain binding(GO:0050693) |
| 0.1 | 0.3 | GO:0016361 | activin receptor activity, type I(GO:0016361) |
| 0.1 | 29.6 | GO:0005509 | calcium ion binding(GO:0005509) |
| 0.1 | 10.8 | GO:0061630 | ubiquitin protein ligase activity(GO:0061630) ubiquitin-like protein ligase activity(GO:0061659) |
| 0.1 | 5.0 | GO:0016503 | pheromone receptor activity(GO:0016503) |
| 0.0 | 2.4 | GO:0016811 | hydrolase activity, acting on carbon-nitrogen (but not peptide) bonds, in linear amides(GO:0016811) |
| 0.0 | 1.2 | GO:0004181 | metallocarboxypeptidase activity(GO:0004181) |
| 0.0 | 10.7 | GO:0004842 | ubiquitin-protein transferase activity(GO:0004842) |
| 0.0 | 2.4 | GO:0004197 | cysteine-type endopeptidase activity(GO:0004197) |
| 0.0 | 0.3 | GO:0001640 | adenylate cyclase inhibiting G-protein coupled glutamate receptor activity(GO:0001640) |
| 0.0 | 0.2 | GO:0051920 | peroxiredoxin activity(GO:0051920) |
| 0.0 | 2.2 | GO:0016835 | carbon-oxygen lyase activity(GO:0016835) |
| 0.0 | 0.4 | GO:0016290 | palmitoyl-CoA hydrolase activity(GO:0016290) |
| 0.0 | 0.2 | GO:0015349 | thyroid hormone transmembrane transporter activity(GO:0015349) |
| 0.0 | 0.7 | GO:0031492 | nucleosomal DNA binding(GO:0031492) |
| 0.0 | 2.8 | GO:0004867 | serine-type endopeptidase inhibitor activity(GO:0004867) |
| 0.0 | 0.2 | GO:0019789 | SUMO transferase activity(GO:0019789) |
| 0.0 | 0.1 | GO:0035243 | protein-arginine omega-N symmetric methyltransferase activity(GO:0035243) |
| 0.0 | 4.4 | GO:0016746 | transferase activity, transferring acyl groups(GO:0016746) |
| 0.0 | 0.1 | GO:0042923 | neuropeptide binding(GO:0042923) |
| 0.0 | 0.6 | GO:0016209 | antioxidant activity(GO:0016209) |
| 0.0 | 0.5 | GO:0099589 | G-protein coupled serotonin receptor activity(GO:0004993) serotonin receptor activity(GO:0099589) |
| 0.0 | 2.9 | GO:0004175 | endopeptidase activity(GO:0004175) |
| 0.0 | 1.0 | GO:0008528 | peptide receptor activity(GO:0001653) G-protein coupled peptide receptor activity(GO:0008528) |
Gene overrepresentation in curated gene sets: canonical pathways category:
| Log-likelihood per target | Total log-likelihood | Term | Description |
|---|---|---|---|
| 0.8 | 17.0 | PID LPA4 PATHWAY | LPA4-mediated signaling events |
| 0.7 | 10.1 | PID S1P S1P4 PATHWAY | S1P4 pathway |
| 0.5 | 16.3 | ST GA12 PATHWAY | G alpha 12 Pathway |
| 0.5 | 7.3 | PID ALK2 PATHWAY | ALK2 signaling events |
| 0.5 | 6.9 | PID SYNDECAN 3 PATHWAY | Syndecan-3-mediated signaling events |
| 0.5 | 19.6 | SIG CD40PATHWAYMAP | Genes related to CD40 signaling |
| 0.5 | 20.0 | NABA PROTEOGLYCANS | Genes encoding proteoglycans |
| 0.5 | 18.9 | PID NCADHERIN PATHWAY | N-cadherin signaling events |
| 0.4 | 4.1 | PID ARF6 DOWNSTREAM PATHWAY | Arf6 downstream pathway |
| 0.4 | 12.9 | PID HDAC CLASSIII PATHWAY | Signaling events mediated by HDAC Class III |
| 0.3 | 15.5 | PID P75 NTR PATHWAY | p75(NTR)-mediated signaling |
| 0.3 | 1.9 | SA PTEN PATHWAY | PTEN is a tumor suppressor that dephosphorylates the lipid messenger phosphatidylinositol triphosphate. |
| 0.3 | 12.4 | PID HNF3B PATHWAY | FOXA2 and FOXA3 transcription factor networks |
| 0.3 | 13.3 | PID ARF6 TRAFFICKING PATHWAY | Arf6 trafficking events |
| 0.3 | 2.0 | PID IL2 1PATHWAY | IL2-mediated signaling events |
| 0.3 | 16.6 | ST INTEGRIN SIGNALING PATHWAY | Integrin Signaling Pathway |
| 0.2 | 18.9 | PID TRKR PATHWAY | Neurotrophic factor-mediated Trk receptor signaling |
| 0.2 | 15.0 | PID HIF1 TFPATHWAY | HIF-1-alpha transcription factor network |
| 0.2 | 6.6 | PID TCR CALCIUM PATHWAY | Calcium signaling in the CD4+ TCR pathway |
| 0.1 | 8.4 | PID LKB1 PATHWAY | LKB1 signaling events |
| 0.1 | 3.2 | PID IFNG PATHWAY | IFN-gamma pathway |
| 0.1 | 3.0 | PID RAC1 REG PATHWAY | Regulation of RAC1 activity |
| 0.1 | 4.0 | PID GLYPICAN 1PATHWAY | Glypican 1 network |
| 0.1 | 1.0 | PID IGF1 PATHWAY | IGF1 pathway |
| 0.1 | 2.3 | PID WNT CANONICAL PATHWAY | Canonical Wnt signaling pathway |
| 0.1 | 2.7 | PID CDC42 REG PATHWAY | Regulation of CDC42 activity |
| 0.1 | 3.5 | PID ERBB4 PATHWAY | ErbB4 signaling events |
| 0.1 | 3.8 | PID P38 ALPHA BETA DOWNSTREAM PATHWAY | Signaling mediated by p38-alpha and p38-beta |
| 0.1 | 1.2 | PID PRL SIGNALING EVENTS PATHWAY | Signaling events mediated by PRL |
| 0.1 | 2.7 | PID FGF PATHWAY | FGF signaling pathway |
| 0.1 | 1.5 | PID PI3KCI PATHWAY | Class I PI3K signaling events |
| 0.1 | 4.1 | NABA BASEMENT MEMBRANES | Genes encoding structural components of basement membranes |
| 0.1 | 2.7 | SIG PIP3 SIGNALING IN CARDIAC MYOCTES | Genes related to PIP3 signaling in cardiac myocytes |
| 0.1 | 12.7 | NABA ECM AFFILIATED | Genes encoding proteins affiliated structurally or functionally to extracellular matrix proteins |
| 0.1 | 0.6 | PID NFKAPPAB CANONICAL PATHWAY | Canonical NF-kappaB pathway |
| 0.1 | 2.1 | ST WNT BETA CATENIN PATHWAY | Wnt/beta-catenin Pathway |
| 0.1 | 3.1 | PID MTOR 4PATHWAY | mTOR signaling pathway |
| 0.1 | 1.0 | PID FAK PATHWAY | Signaling events mediated by focal adhesion kinase |
| 0.0 | 0.9 | PID TAP63 PATHWAY | Validated transcriptional targets of TAp63 isoforms |
| 0.0 | 1.1 | PID RHOA PATHWAY | RhoA signaling pathway |
| 0.0 | 0.7 | PID TNF PATHWAY | TNF receptor signaling pathway |
| 0.0 | 0.3 | PID ARF 3PATHWAY | Arf1 pathway |
| 0.0 | 0.8 | PID P73PATHWAY | p73 transcription factor network |
| 0.0 | 0.4 | ST FAS SIGNALING PATHWAY | Fas Signaling Pathway |
Gene overrepresentation in curated gene sets: REACTOME pathways category:
| Log-likelihood per target | Total log-likelihood | Term | Description |
|---|---|---|---|
| 1.6 | 22.9 | REACTOME NOREPINEPHRINE NEUROTRANSMITTER RELEASE CYCLE | Genes involved in Norepinephrine Neurotransmitter Release Cycle |
| 1.6 | 44.5 | REACTOME ADHERENS JUNCTIONS INTERACTIONS | Genes involved in Adherens junctions interactions |
| 1.6 | 29.7 | REACTOME TRAFFICKING OF GLUR2 CONTAINING AMPA RECEPTORS | Genes involved in Trafficking of GluR2-containing AMPA receptors |
| 1.4 | 31.5 | REACTOME INSULIN SYNTHESIS AND PROCESSING | Genes involved in Insulin Synthesis and Processing |
| 1.4 | 22.5 | REACTOME IONOTROPIC ACTIVITY OF KAINATE RECEPTORS | Genes involved in Ionotropic activity of Kainate Receptors |
| 1.3 | 7.7 | REACTOME ABACAVIR TRANSPORT AND METABOLISM | Genes involved in Abacavir transport and metabolism |
| 1.2 | 12.0 | REACTOME ORGANIC CATION ANION ZWITTERION TRANSPORT | Genes involved in Organic cation/anion/zwitterion transport |
| 1.1 | 17.0 | REACTOME ADENYLATE CYCLASE ACTIVATING PATHWAY | Genes involved in Adenylate cyclase activating pathway |
| 0.9 | 14.0 | REACTOME SIGNAL ATTENUATION | Genes involved in Signal attenuation |
| 0.9 | 22.7 | REACTOME INSULIN RECEPTOR RECYCLING | Genes involved in Insulin receptor recycling |
| 0.8 | 21.2 | REACTOME SYNTHESIS OF PC | Genes involved in Synthesis of PC |
| 0.8 | 11.8 | REACTOME REGULATION OF COMPLEMENT CASCADE | Genes involved in Regulation of Complement cascade |
| 0.8 | 16.4 | REACTOME ACTIVATION OF RAC | Genes involved in Activation of Rac |
| 0.7 | 9.1 | REACTOME TRAFFICKING OF AMPA RECEPTORS | Genes involved in Trafficking of AMPA receptors |
| 0.7 | 15.1 | REACTOME CHOLESTEROL BIOSYNTHESIS | Genes involved in Cholesterol biosynthesis |
| 0.6 | 20.7 | REACTOME INTERACTION BETWEEN L1 AND ANKYRINS | Genes involved in Interaction between L1 and Ankyrins |
| 0.6 | 18.0 | REACTOME BASIGIN INTERACTIONS | Genes involved in Basigin interactions |
| 0.6 | 11.4 | REACTOME GLUCURONIDATION | Genes involved in Glucuronidation |
| 0.6 | 10.5 | REACTOME SYNTHESIS OF VERY LONG CHAIN FATTY ACYL COAS | Genes involved in Synthesis of very long-chain fatty acyl-CoAs |
| 0.6 | 22.5 | REACTOME G ALPHA Z SIGNALLING EVENTS | Genes involved in G alpha (z) signalling events |
| 0.5 | 17.1 | REACTOME STEROID HORMONES | Genes involved in Steroid hormones |
| 0.5 | 14.4 | REACTOME KINESINS | Genes involved in Kinesins |
| 0.4 | 8.9 | REACTOME REGULATION OF WATER BALANCE BY RENAL AQUAPORINS | Genes involved in Regulation of Water Balance by Renal Aquaporins |
| 0.4 | 10.9 | REACTOME HS GAG BIOSYNTHESIS | Genes involved in HS-GAG biosynthesis |
| 0.4 | 14.6 | REACTOME GLYCOSPHINGOLIPID METABOLISM | Genes involved in Glycosphingolipid metabolism |
| 0.4 | 21.1 | REACTOME L1CAM INTERACTIONS | Genes involved in L1CAM interactions |
| 0.3 | 5.9 | REACTOME FACILITATIVE NA INDEPENDENT GLUCOSE TRANSPORTERS | Genes involved in Facilitative Na+-independent glucose transporters |
| 0.3 | 4.1 | REACTOME SPRY REGULATION OF FGF SIGNALING | Genes involved in Spry regulation of FGF signaling |
| 0.3 | 15.1 | REACTOME NETRIN1 SIGNALING | Genes involved in Netrin-1 signaling |
| 0.3 | 3.0 | REACTOME CS DS DEGRADATION | Genes involved in CS/DS degradation |
| 0.3 | 5.9 | REACTOME MICRORNA MIRNA BIOGENESIS | Genes involved in MicroRNA (miRNA) Biogenesis |
| 0.3 | 2.5 | REACTOME ETHANOL OXIDATION | Genes involved in Ethanol oxidation |
| 0.3 | 3.5 | REACTOME CYTOSOLIC SULFONATION OF SMALL MOLECULES | Genes involved in Cytosolic sulfonation of small molecules |
| 0.3 | 7.1 | REACTOME LIGAND GATED ION CHANNEL TRANSPORT | Genes involved in Ligand-gated ion channel transport |
| 0.3 | 6.3 | REACTOME CGMP EFFECTS | Genes involved in cGMP effects |
| 0.2 | 3.7 | REACTOME PURINE SALVAGE | Genes involved in Purine salvage |
| 0.2 | 9.2 | REACTOME AMINE LIGAND BINDING RECEPTORS | Genes involved in Amine ligand-binding receptors |
| 0.2 | 10.6 | REACTOME ACTIVATION OF CHAPERONE GENES BY XBP1S | Genes involved in Activation of Chaperone Genes by XBP1(S) |
| 0.2 | 18.0 | REACTOME GLYCEROPHOSPHOLIPID BIOSYNTHESIS | Genes involved in Glycerophospholipid biosynthesis |
| 0.2 | 2.7 | REACTOME THE NLRP3 INFLAMMASOME | Genes involved in The NLRP3 inflammasome |
| 0.2 | 2.4 | REACTOME CRMPS IN SEMA3A SIGNALING | Genes involved in CRMPs in Sema3A signaling |
| 0.2 | 2.1 | REACTOME PLATELET CALCIUM HOMEOSTASIS | Genes involved in Platelet calcium homeostasis |
| 0.2 | 7.3 | REACTOME GLUCOSE TRANSPORT | Genes involved in Glucose transport |
| 0.2 | 9.0 | REACTOME O LINKED GLYCOSYLATION OF MUCINS | Genes involved in O-linked glycosylation of mucins |
| 0.2 | 2.3 | REACTOME PTM GAMMA CARBOXYLATION HYPUSINE FORMATION AND ARYLSULFATASE ACTIVATION | Genes involved in PTM: gamma carboxylation, hypusine formation and arylsulfatase activation |
| 0.2 | 1.1 | REACTOME LATE PHASE OF HIV LIFE CYCLE | Genes involved in Late Phase of HIV Life Cycle |
| 0.2 | 2.6 | REACTOME THE ROLE OF NEF IN HIV1 REPLICATION AND DISEASE PATHOGENESIS | Genes involved in The role of Nef in HIV-1 replication and disease pathogenesis |
| 0.2 | 2.6 | REACTOME IRON UPTAKE AND TRANSPORT | Genes involved in Iron uptake and transport |
| 0.1 | 7.0 | REACTOME VOLTAGE GATED POTASSIUM CHANNELS | Genes involved in Voltage gated Potassium channels |
| 0.1 | 3.8 | REACTOME CIRCADIAN REPRESSION OF EXPRESSION BY REV ERBA | Genes involved in Circadian Repression of Expression by REV-ERBA |
| 0.1 | 6.0 | REACTOME ION CHANNEL TRANSPORT | Genes involved in Ion channel transport |
| 0.1 | 2.0 | REACTOME CELL EXTRACELLULAR MATRIX INTERACTIONS | Genes involved in Cell-extracellular matrix interactions |
| 0.1 | 1.5 | REACTOME VITAMIN B5 PANTOTHENATE METABOLISM | Genes involved in Vitamin B5 (pantothenate) metabolism |
| 0.1 | 4.5 | REACTOME MHC CLASS II ANTIGEN PRESENTATION | Genes involved in MHC class II antigen presentation |
| 0.1 | 2.0 | REACTOME INTRINSIC PATHWAY | Genes involved in Intrinsic Pathway |
| 0.1 | 1.5 | REACTOME ACTIVATION OF THE AP1 FAMILY OF TRANSCRIPTION FACTORS | Genes involved in Activation of the AP-1 family of transcription factors |
| 0.1 | 2.1 | REACTOME SIGNALING BY BMP | Genes involved in Signaling by BMP |
| 0.1 | 2.0 | REACTOME ENDOSOMAL SORTING COMPLEX REQUIRED FOR TRANSPORT ESCRT | Genes involved in Endosomal Sorting Complex Required For Transport (ESCRT) |
| 0.1 | 2.0 | REACTOME PEROXISOMAL LIPID METABOLISM | Genes involved in Peroxisomal lipid metabolism |
| 0.1 | 1.4 | REACTOME BRANCHED CHAIN AMINO ACID CATABOLISM | Genes involved in Branched-chain amino acid catabolism |
| 0.1 | 1.1 | REACTOME CONVERSION FROM APC C CDC20 TO APC C CDH1 IN LATE ANAPHASE | Genes involved in Conversion from APC/C:Cdc20 to APC/C:Cdh1 in late anaphase |
| 0.1 | 15.6 | REACTOME ANTIGEN PROCESSING UBIQUITINATION PROTEASOME DEGRADATION | Genes involved in Antigen processing: Ubiquitination & Proteasome degradation |
| 0.1 | 3.1 | REACTOME PHASE II CONJUGATION | Genes involved in Phase II conjugation |
| 0.0 | 0.6 | REACTOME ERK MAPK TARGETS | Genes involved in ERK/MAPK targets |
| 0.0 | 1.5 | REACTOME GLYCOLYSIS | Genes involved in Glycolysis |
| 0.0 | 0.4 | REACTOME SYNTHESIS OF BILE ACIDS AND BILE SALTS VIA 24 HYDROXYCHOLESTEROL | Genes involved in Synthesis of bile acids and bile salts via 24-hydroxycholesterol |
| 0.0 | 0.3 | REACTOME COPI MEDIATED TRANSPORT | Genes involved in COPI Mediated Transport |
| 0.0 | 0.6 | REACTOME FORMATION OF TUBULIN FOLDING INTERMEDIATES BY CCT TRIC | Genes involved in Formation of tubulin folding intermediates by CCT/TriC |
| 0.0 | 0.2 | REACTOME CREATION OF C4 AND C2 ACTIVATORS | Genes involved in Creation of C4 and C2 activators |
| 0.0 | 1.2 | REACTOME CELL JUNCTION ORGANIZATION | Genes involved in Cell junction organization |
| 0.0 | 0.3 | REACTOME GAP JUNCTION ASSEMBLY | Genes involved in Gap junction assembly |
| 0.0 | 0.3 | REACTOME CLASS C 3 METABOTROPIC GLUTAMATE PHEROMONE RECEPTORS | Genes involved in Class C/3 (Metabotropic glutamate/pheromone receptors) |
| 0.0 | 1.0 | REACTOME SIGNALING BY FGFR | Genes involved in Signaling by FGFR |