Project
GSE53960: rat RNA-Seq transcriptomic Bodymap
Navigation
Downloads
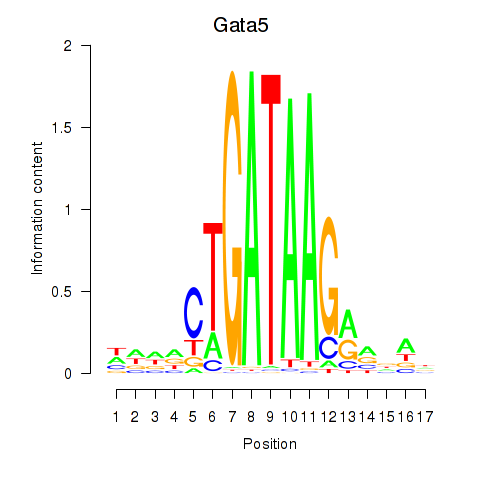
Results for Gata5
Z-value: 0.92
Motif logo
Transcription factors associated with Gata5
| Gene Symbol | Gene ID | Gene Info |
|---|---|---|
|
Gata5
|
ENSRNOG00000058983 | GATA binding protein 5 |
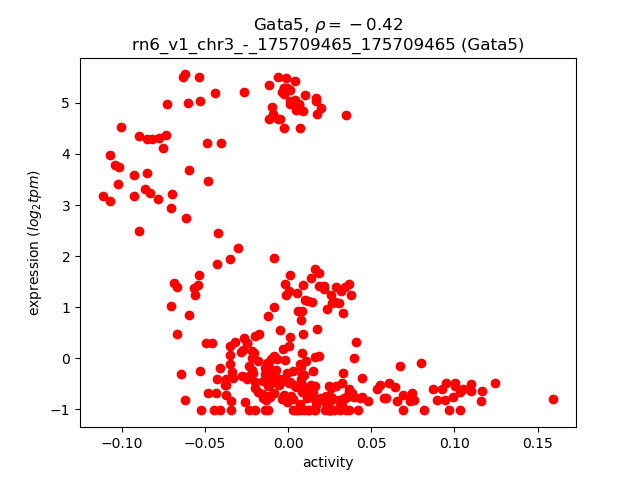
Activity-expression correlation:
| Gene | Promoter | Pearson corr. coef. | P-value | Plot |
|---|---|---|---|---|
| Gata5 | rn6_v1_chr3_-_175709465_175709465 | -0.42 | 3.5e-15 | Click! |
Activity profile of Gata5 motif
Sorted Z-values of Gata5 motif
| Promoter | Log-likelihood | Transcript | Gene | Gene Info |
|---|---|---|---|---|
| chr15_-_45524582 | 37.26 |
ENSRNOT00000081912
|
Gucy1b2
|
guanylate cyclase 1 soluble subunit beta 2 |
| chr8_+_50525091 | 37.24 |
ENSRNOT00000074357
|
Apoa1
|
apolipoprotein A1 |
| chr8_-_85645718 | 33.76 |
ENSRNOT00000032185
|
Gsta2
|
glutathione S-transferase alpha 2 |
| chr17_-_43537293 | 28.49 |
ENSRNOT00000091749
|
Slc17a3
|
solute carrier family 17 member 3 |
| chr14_+_22517774 | 26.49 |
ENSRNOT00000047655
|
Ugt2b37
|
UDP-glucuronosyltransferase 2 family, member 37 |
| chr2_+_147496229 | 26.25 |
ENSRNOT00000022105
|
Tm4sf4
|
transmembrane 4 L six family member 4 |
| chr13_+_44424689 | 25.16 |
ENSRNOT00000005206
|
Acmsd
|
aminocarboxymuconate semialdehyde decarboxylase |
| chr4_+_70776046 | 25.15 |
ENSRNOT00000040403
|
Prss1
|
protease, serine 1 |
| chr2_-_182038178 | 24.43 |
ENSRNOT00000040708
|
Fgb
|
fibrinogen beta chain |
| chr3_-_127500709 | 23.92 |
ENSRNOT00000006330
|
Hao1
|
hydroxyacid oxidase 1 |
| chr5_-_155772040 | 23.73 |
ENSRNOT00000036788
|
Cela3b
|
chymotrypsin-like elastase family, member 3B |
| chrX_-_1848904 | 21.79 |
ENSRNOT00000010984
|
Rgn
|
regucalcin |
| chr4_+_70614524 | 21.67 |
ENSRNOT00000041100
|
Prss3
|
protease, serine 3 |
| chr20_-_5806097 | 20.81 |
ENSRNOT00000000611
|
Clps
|
colipase |
| chrX_-_13601069 | 20.64 |
ENSRNOT00000004686
|
Otc
|
ornithine carbamoyltransferase |
| chr9_-_79530821 | 20.20 |
ENSRNOT00000085619
|
Mreg
|
melanoregulin |
| chr6_-_127632265 | 19.26 |
ENSRNOT00000084157
|
Serpina1
|
serpin family A member 1 |
| chr13_-_56958549 | 18.06 |
ENSRNOT00000017293
ENSRNOT00000083912 |
RGD1564614
|
similar to complement factor H-related protein |
| chr4_-_70747226 | 17.20 |
ENSRNOT00000044960
|
LOC102554637
|
anionic trypsin-2-like |
| chr1_+_282567674 | 16.54 |
ENSRNOT00000090543
|
Ces2i
|
carboxylesterase 2I |
| chr5_-_4972124 | 16.22 |
ENSRNOT00000081661
|
Xkr9
|
XK related 9 |
| chr4_+_173732248 | 16.15 |
ENSRNOT00000041499
|
Pik3c2g
|
phosphatidylinositol-4-phosphate 3-kinase, catalytic subunit type 2 gamma |
| chr15_-_28104206 | 15.59 |
ENSRNOT00000032536
|
Ang2
|
angiogenin, ribonuclease A family, member 2 |
| chr1_+_72784966 | 15.36 |
ENSRNOT00000090065
ENSRNOT00000041527 |
Tmem86b
|
transmembrane protein 86B |
| chr7_-_27552078 | 14.54 |
ENSRNOT00000059538
|
Stab2
|
stabilin 2 |
| chr4_-_176026133 | 14.22 |
ENSRNOT00000043374
ENSRNOT00000046598 |
Slco1a4
|
solute carrier organic anion transporter family, member 1a4 |
| chr8_+_91464229 | 13.95 |
ENSRNOT00000013249
|
Bckdhb
|
branched chain keto acid dehydrogenase E1 subunit beta |
| chr16_+_10267482 | 13.91 |
ENSRNOT00000085255
|
Gdf2
|
growth differentiation factor 2 |
| chr9_+_95221474 | 12.00 |
ENSRNOT00000066839
|
Ugt1a5
|
UDP glucuronosyltransferase family 1 member A5 |
| chr18_-_11858744 | 11.11 |
ENSRNOT00000061417
ENSRNOT00000082891 |
Dsc2
|
desmocollin 2 |
| chr10_-_90415070 | 10.93 |
ENSRNOT00000055179
|
Itga2b
|
integrin subunit alpha 2b |
| chr1_-_207766250 | 9.63 |
ENSRNOT00000031397
|
Clrn3
|
clarin 3 |
| chr2_+_52431601 | 9.20 |
ENSRNOT00000023554
|
Hmgcs1
|
3-hydroxy-3-methylglutaryl-CoA synthase 1 |
| chr11_-_80981415 | 9.19 |
ENSRNOT00000002499
ENSRNOT00000002496 |
St6gal1
|
ST6 beta-galactoside alpha-2,6-sialyltransferase 1 |
| chr7_-_30162056 | 8.89 |
ENSRNOT00000009910
|
Nr1h4
|
nuclear receptor subfamily 1, group H, member 4 |
| chr8_+_37156619 | 8.70 |
ENSRNOT00000070856
|
Gm17689
|
predicted gene, 17689 |
| chr18_-_24823837 | 8.30 |
ENSRNOT00000021405
ENSRNOT00000090390 |
Myo7b
|
myosin VIIb |
| chr16_-_75581325 | 7.96 |
ENSRNOT00000058031
|
Defb33
|
defensin beta 33 |
| chr19_-_49623758 | 7.90 |
ENSRNOT00000071130
|
Pkd1l2
|
polycystic kidney disease 1-like 2 |
| chr3_-_72447801 | 7.63 |
ENSRNOT00000088815
|
P2rx3
|
purinergic receptor P2X 3 |
| chr2_-_123851854 | 7.49 |
ENSRNOT00000023327
|
Il2
|
interleukin 2 |
| chr10_+_86399827 | 7.19 |
ENSRNOT00000009299
|
Grb7
|
growth factor receptor bound protein 7 |
| chr9_+_20048121 | 7.17 |
ENSRNOT00000014791
|
Mep1a
|
meprin 1 subunit alpha |
| chr4_-_70974006 | 6.83 |
ENSRNOT00000020975
|
Trpv5
|
transient receptor potential cation channel, subfamily V, member 5 |
| chr1_-_101883744 | 6.75 |
ENSRNOT00000028635
|
Syngr4
|
synaptogyrin 4 |
| chr4_-_177039677 | 6.74 |
ENSRNOT00000055538
ENSRNOT00000075667 |
RGD1561551
|
similar to Hypothetical protein MGC75664 |
| chr1_-_214414763 | 6.58 |
ENSRNOT00000025240
ENSRNOT00000077776 |
LOC100911440
|
mitochondrial glutamate carrier 1-like |
| chr4_-_38240848 | 6.37 |
ENSRNOT00000007567
|
Ndufa4
|
NADH:ubiquinone oxidoreductase subunit A4 |
| chr1_-_207811008 | 6.24 |
ENSRNOT00000080506
|
Clrn3
|
clarin 3 |
| chr6_-_127337791 | 6.00 |
ENSRNOT00000032015
|
Ifi27l2b
|
interferon, alpha-inducible protein 27 like 2B |
| chr1_-_226732736 | 5.94 |
ENSRNOT00000072343
|
LOC108348129
|
pepsin F-like |
| chr4_-_117575154 | 5.76 |
ENSRNOT00000075813
|
LOC102556148
|
probable N-acetyltransferase CML2-like |
| chr14_-_65153013 | 5.73 |
ENSRNOT00000071542
|
AABR07015596.1
|
|
| chr7_-_71269869 | 5.50 |
ENSRNOT00000037030
|
Uqcrb
|
ubiquinol-cytochrome c reductase binding protein |
| chr9_-_95108739 | 5.49 |
ENSRNOT00000070819
|
Usp40
|
ubiquitin specific peptidase 40 |
| chr4_-_117758135 | 5.45 |
ENSRNOT00000087750
|
Nat8f4
|
N-acetyltransferase 8 (GCN5-related) family member 4 |
| chr5_-_126666830 | 5.42 |
ENSRNOT00000012102
ENSRNOT00000091165 |
Mrpl37
|
mitochondrial ribosomal protein L37 |
| chr14_+_900696 | 5.41 |
ENSRNOT00000049544
|
Vom2r71
|
vomeronasal 2 receptor, 71 |
| chr1_+_168005316 | 5.33 |
ENSRNOT00000020678
|
Olr51
|
olfactory receptor 51 |
| chr3_+_121128368 | 5.28 |
ENSRNOT00000055882
|
LOC499886
|
similar to hypothetical protein 4933411G11 |
| chr14_+_7027788 | 5.21 |
ENSRNOT00000090234
|
LOC100359907
|
secretory calcium-binding phosphoprotein proline-glutamine rich 1-like |
| chr17_-_71897972 | 5.08 |
ENSRNOT00000065942
|
Sfmbt2
|
Scm-like with four mbt domains 2 |
| chr5_-_139748489 | 5.07 |
ENSRNOT00000078741
|
Nfyc
|
nuclear transcription factor Y subunit gamma |
| chr15_+_31051414 | 5.04 |
ENSRNOT00000090250
|
AABR07017783.4
|
|
| chr10_+_83840303 | 5.00 |
ENSRNOT00000008481
|
Gip
|
gastric inhibitory polypeptide |
| chr13_-_55701414 | 4.91 |
ENSRNOT00000060277
|
AABR07021066.1
|
|
| chrX_+_123023280 | 4.91 |
ENSRNOT00000087749
|
Gm6268
|
predicted gene 6268 |
| chr6_+_58388333 | 4.89 |
ENSRNOT00000036337
|
LOC680646
|
similar to 40S ribosomal protein S2 |
| chr10_-_102227554 | 4.88 |
ENSRNOT00000078035
|
AC096468.1
|
|
| chr17_-_42818258 | 4.86 |
ENSRNOT00000088978
|
Prl3c1
|
Prolactin family 3, subfamily c, member 1 |
| chr17_+_38919078 | 4.84 |
ENSRNOT00000074999
|
LOC684107
|
similar to placental prolactin-like protein O |
| chr10_+_38788992 | 4.83 |
ENSRNOT00000009727
|
Gdf9
|
growth differentiation factor 9 |
| chr11_-_44049648 | 4.82 |
ENSRNOT00000002257
|
Cpox
|
coproporphyrinogen oxidase |
| chr8_+_43590248 | 4.65 |
ENSRNOT00000088053
|
Olr1318
|
olfactory receptor 1318 |
| chr3_+_160695911 | 4.64 |
ENSRNOT00000018510
|
Svs6
|
seminal vesicle secretory protein 6 |
| chr17_+_38993182 | 4.62 |
ENSRNOT00000022251
|
Prl7d1
|
prolactin family 7, subfamily d, member 1 |
| chr15_+_34926686 | 4.52 |
ENSRNOT00000045948
|
Mcpt1l3
|
mast cell protease 1-like 3 |
| chr4_-_65780799 | 4.51 |
ENSRNOT00000079883
|
Atp6v0a4
|
ATPase H+ transporting V0 subunit a4 |
| chr4_+_148476943 | 4.46 |
ENSRNOT00000017689
|
Olr823
|
olfactory receptor 823 |
| chr11_-_76888178 | 4.46 |
ENSRNOT00000049841
|
Ostn
|
osteocrin |
| chr4_+_109467272 | 4.44 |
ENSRNOT00000008212
|
Reg3b
|
regenerating family member 3 beta |
| chr4_-_23718047 | 4.36 |
ENSRNOT00000011359
|
RGD1564345
|
similar to RIKEN cDNA 4921511H03 |
| chr14_+_113530470 | 4.34 |
ENSRNOT00000004919
|
Pnpt1
|
polyribonucleotide nucleotidyltransferase 1 |
| chrM_+_2740 | 4.32 |
ENSRNOT00000047550
|
Mt-nd1
|
mitochondrially encoded NADH dehydrogenase 1 |
| chrX_+_113510621 | 4.27 |
ENSRNOT00000025912
|
Nxt2
|
nuclear transport factor 2-like export factor 2 |
| chr13_-_80745347 | 4.21 |
ENSRNOT00000041908
|
Fmo1
|
flavin containing monooxygenase 1 |
| chr8_-_43249887 | 4.16 |
ENSRNOT00000060094
|
Olr1305
|
olfactory receptor 1305 |
| chr1_+_260289589 | 4.15 |
ENSRNOT00000051058
|
Dntt
|
DNA nucleotidylexotransferase |
| chr7_+_38858062 | 4.15 |
ENSRNOT00000006234
|
Kera
|
keratocan |
| chr5_-_76632462 | 4.14 |
ENSRNOT00000085109
|
Susd1
|
sushi domain containing 1 |
| chrX_+_42951237 | 4.14 |
ENSRNOT00000060113
|
RGD1559536
|
similar to vitellogenin-like 1 precursor |
| chr16_+_81593532 | 4.12 |
ENSRNOT00000026370
|
NEWGENE_1582994
|
DCN1, defective in cullin neddylation 1, domain containing 2 |
| chr2_-_181900856 | 4.04 |
ENSRNOT00000082156
|
Lrat
|
lecithin-retinol acyltransferase (phosphatidylcholine-retinol-O-acyltransferase) |
| chr5_-_69578458 | 4.03 |
ENSRNOT00000082758
|
Olr851
|
olfactory receptor 851 |
| chr2_-_199771896 | 4.03 |
ENSRNOT00000043937
|
Chd1l
|
chromodomain helicase DNA binding protein 1-like |
| chr4_-_60358562 | 3.98 |
ENSRNOT00000018001
|
Chchd3
|
coiled-coil-helix-coiled-coil-helix domain containing 3 |
| chr16_-_81028656 | 3.97 |
ENSRNOT00000091296
|
Dcun1d2
|
defective in cullin neddylation 1 domain containing 2 |
| chr11_+_82862695 | 3.97 |
ENSRNOT00000071707
ENSRNOT00000073435 |
Clcn2
|
chloride voltage-gated channel 2 |
| chr10_-_38969501 | 3.92 |
ENSRNOT00000090691
ENSRNOT00000081309 ENSRNOT00000010029 |
Il4
|
interleukin 4 |
| chr3_-_74782417 | 3.90 |
ENSRNOT00000080494
|
Olr495
|
olfactory receptor 495 |
| chr2_-_243467703 | 3.87 |
ENSRNOT00000045169
|
RGD1309170
|
similar to hypothetical protein DKFZp434G072 |
| chr13_-_73390393 | 3.83 |
ENSRNOT00000067253
ENSRNOT00000093438 |
Lhx4
|
LIM homeobox 4 |
| chr3_-_45498327 | 3.82 |
ENSRNOT00000090213
|
AABR07052296.1
|
|
| chr14_+_22597103 | 3.79 |
ENSRNOT00000048482
|
Ugt2a1
|
UDP glucuronosyltransferase 2 family, polypeptide A1 |
| chr13_-_47331187 | 3.77 |
ENSRNOT00000035577
ENSRNOT00000049915 |
Zp3r
|
zona pellucida 3 receptor |
| chr13_-_53870428 | 3.74 |
ENSRNOT00000000812
|
Nr5a2
|
nuclear receptor subfamily 5, group A, member 2 |
| chr1_+_190462327 | 3.72 |
ENSRNOT00000030732
|
LOC691519
|
similar to ankyrin repeat domain 26 |
| chr11_+_83884048 | 3.71 |
ENSRNOT00000002376
|
LOC108348101
|
chloride channel protein 2 |
| chr1_+_68221395 | 3.67 |
ENSRNOT00000075596
|
Vom1r29
|
vomeronasal 1 receptor 29 |
| chr7_-_143392777 | 3.62 |
ENSRNOT00000086504
ENSRNOT00000038105 |
Krt72
|
keratin 72 |
| chr18_-_29587760 | 3.62 |
ENSRNOT00000023811
|
Ndufa2
|
NADH:ubiquinone oxidoreductase subunit A2 |
| chr19_-_46167950 | 3.59 |
ENSRNOT00000071024
|
AABR07043892.1
|
|
| chrX_-_51792597 | 3.59 |
ENSRNOT00000072727
|
LOC102549011
|
titin-like |
| chr15_-_46166335 | 3.59 |
ENSRNOT00000059215
|
Defb42
|
defensin beta 42 |
| chr4_+_102592965 | 3.57 |
ENSRNOT00000031103
|
AABR07061003.1
|
|
| chr3_+_143151739 | 3.56 |
ENSRNOT00000006850
|
Cst13
|
cystatin 13 |
| chr8_-_19082478 | 3.54 |
ENSRNOT00000073314
|
Olr1135
|
olfactory receptor 1135 |
| chr2_-_28799266 | 3.53 |
ENSRNOT00000089293
|
Tmem171
|
transmembrane protein 171 |
| chr1_-_167884690 | 3.50 |
ENSRNOT00000091372
|
Olr61
|
olfactory receptor 61 |
| chr1_-_89132959 | 3.50 |
ENSRNOT00000070888
|
Pmis2
|
Pmis2, sperm specific protein |
| chr20_-_860109 | 3.46 |
ENSRNOT00000000973
|
Olr1695
|
olfactory receptor 1695 |
| chr1_+_99864084 | 3.41 |
ENSRNOT00000056467
|
AABR07003241.1
|
|
| chr4_+_71376535 | 3.39 |
ENSRNOT00000021832
|
Sval1
|
seminal vesicle antigen-like 1 |
| chr1_+_11873206 | 3.38 |
ENSRNOT00000089608
|
AABR07000385.1
|
|
| chr15_-_37410848 | 3.36 |
ENSRNOT00000081757
|
Gjb6
|
gap junction protein, beta 6 |
| chr12_+_31934343 | 3.33 |
ENSRNOT00000011181
|
Tmem132d
|
transmembrane protein 132D |
| chr15_+_34751550 | 3.32 |
ENSRNOT00000089559
ENSRNOT00000027918 ENSRNOT00000027895 ENSRNOT00000041631 |
Mcpt4
|
mast cell protease 4 |
| chr13_+_71322759 | 3.29 |
ENSRNOT00000071815
|
Teddm1
|
transmembrane epididymal protein 1 |
| chr3_+_1331226 | 3.29 |
ENSRNOT00000007540
|
Il36a
|
interleukin 36, alpha |
| chr13_+_51218468 | 3.28 |
ENSRNOT00000033636
|
LOC289035
|
similar to UDP-N-acetylglucosamine:a-1,3-D-mannoside beta-1,4-N-acetylgluco |
| chr12_-_49406037 | 3.27 |
ENSRNOT00000076878
|
Tmem211
|
transmembrane protein 211 |
| chr3_+_75936795 | 3.23 |
ENSRNOT00000007603
|
Olr588
|
olfactory receptor 588 |
| chr6_-_26318568 | 3.22 |
ENSRNOT00000072707
|
LOC102556504
|
titin-like |
| chr3_+_160713728 | 3.22 |
ENSRNOT00000018537
|
LOC103694892
|
seminal vesicle secretory protein 5 |
| chr20_+_3611964 | 3.19 |
ENSRNOT00000090510
ENSRNOT00000068159 |
Dpcr1
|
diffuse panbronchiolitis critical region 1 |
| chr7_-_143538579 | 3.17 |
ENSRNOT00000081518
|
Krt79
|
keratin 79 |
| chr17_+_79749747 | 3.16 |
ENSRNOT00000081743
|
AABR07028665.1
|
|
| chr3_+_138174054 | 3.04 |
ENSRNOT00000007946
|
Banf2
|
barrier to autointegration factor 2 |
| chr10_-_15610826 | 3.02 |
ENSRNOT00000027851
|
Hbz
|
hemoglobin subunit zeta |
| chr17_-_42817037 | 3.01 |
ENSRNOT00000023166
|
Prl3c1
|
Prolactin family 3, subfamily c, member 1 |
| chrX_+_106774980 | 3.01 |
ENSRNOT00000046091
|
Tceal7
|
transcription elongation factor A like 7 |
| chr3_-_160630457 | 2.99 |
ENSRNOT00000018420
|
Semg1
|
semenogelin I |
| chr3_+_76751603 | 2.99 |
ENSRNOT00000040604
|
Olr633
|
olfactory receptor 633 |
| chr16_-_75499012 | 2.89 |
ENSRNOT00000058039
|
Defa10
|
defensin alpha 10 |
| chrX_-_136737730 | 2.88 |
ENSRNOT00000040754
|
Olr1765
|
olfactory receptor 1765 |
| chr3_+_73138229 | 2.86 |
ENSRNOT00000092148
|
Olr456
|
olfactory receptor 456 |
| chr2_-_195935878 | 2.84 |
ENSRNOT00000028440
|
Cgn
|
cingulin |
| chr17_-_89881919 | 2.83 |
ENSRNOT00000090982
|
LOC100910957
|
acyl-CoA-binding domain-containing protein 5-like |
| chr9_-_24467892 | 2.82 |
ENSRNOT00000060803
|
Defb18
|
defensin beta 18 |
| chr1_-_149787308 | 2.80 |
ENSRNOT00000088514
|
LOC100909966
|
olfactory receptor 6F1-like |
| chr18_-_68755426 | 2.79 |
ENSRNOT00000033631
|
Dynap
|
dynactin associated protein |
| chrX_+_110512013 | 2.79 |
ENSRNOT00000057044
|
Trap1a
|
tumor rejection antigen P1A |
| chr1_+_230604386 | 2.78 |
ENSRNOT00000040608
|
Olr375
|
olfactory receptor 375 |
| chr3_-_77095635 | 2.78 |
ENSRNOT00000051966
|
Olr650
|
olfactory receptor 650 |
| chr11_+_85030872 | 2.77 |
ENSRNOT00000074815
|
LOC100911043
|
olfactory receptor 2L3-like |
| chr11_+_43431431 | 2.76 |
ENSRNOT00000081261
|
Olr1545
|
olfactory receptor 1545 |
| chr1_-_170743732 | 2.75 |
ENSRNOT00000051962
|
Olr208
|
olfactory receptor 208 |
| chr1_+_79324274 | 2.74 |
ENSRNOT00000058040
|
LOC102557244
|
carcinoembryonic antigen-related cell adhesion molecule 5-like |
| chr3_+_167442529 | 2.72 |
ENSRNOT00000086910
|
AABR07054716.2
|
|
| chr1_+_79289164 | 2.59 |
ENSRNOT00000024155
|
AABR07002659.1
|
|
| chr9_-_94495333 | 2.59 |
ENSRNOT00000021507
|
Kcnj13
|
potassium voltage-gated channel subfamily J member 13 |
| chr2_-_35503638 | 2.57 |
ENSRNOT00000007560
|
LOC100910467
|
olfactory receptor 144-like |
| chr8_-_43235208 | 2.55 |
ENSRNOT00000060095
|
Olr1304
|
olfactory receptor 1304 |
| chr3_-_75168421 | 2.55 |
ENSRNOT00000072853
|
LOC103691842
|
olfactory receptor 10AG1-like |
| chr16_+_51748970 | 2.52 |
ENSRNOT00000059182
|
Adam26a
|
a disintegrin and metallopeptidase domain 26A |
| chr1_-_254513299 | 2.52 |
ENSRNOT00000086031
|
AC119111.1
|
|
| chr1_-_172486268 | 2.51 |
ENSRNOT00000083135
|
Olr255
|
olfactory receptor 255 |
| chr1_-_155955173 | 2.50 |
ENSRNOT00000079345
|
AABR07004776.1
|
|
| chr4_+_156186281 | 2.50 |
ENSRNOT00000013330
ENSRNOT00000067105 ENSRNOT00000068661 |
Clec4n
|
C-type lectin domain family 4, member n |
| chr3_+_75906945 | 2.49 |
ENSRNOT00000047110
|
Olr586
|
olfactory receptor 586 |
| chr11_+_18454144 | 2.48 |
ENSRNOT00000072550
|
AABR07033357.1
|
|
| chr1_-_167992529 | 2.47 |
ENSRNOT00000067344
|
LOC684170
|
similar to olfactory receptor 566 |
| chr11_+_43454665 | 2.44 |
ENSRNOT00000080384
|
Olr1546
|
olfactory receptor 1546 |
| chr15_+_86153628 | 2.42 |
ENSRNOT00000012842
|
Uchl3
|
ubiquitin C-terminal hydrolase L3 |
| chr3_-_8659102 | 2.42 |
ENSRNOT00000050908
|
Zdhhc12
|
zinc finger, DHHC-type containing 12 |
| chr1_+_172129514 | 2.41 |
ENSRNOT00000041658
|
Olr241
|
olfactory receptor 241 |
| chr3_+_73064092 | 2.31 |
ENSRNOT00000072178
|
LOC684539
|
similar to olfactory receptor Olr490 |
| chr4_+_1671269 | 2.30 |
ENSRNOT00000071452
|
Olr1251
|
olfactory receptor 1251 |
| chr2_-_188559882 | 2.29 |
ENSRNOT00000088199
|
Trim46
|
tripartite motif-containing 46 |
| chr6_+_64252020 | 2.29 |
ENSRNOT00000047296
ENSRNOT00000082105 |
Pnpla8
|
patatin-like phospholipase domain containing 8 |
| chrX_-_137015266 | 2.29 |
ENSRNOT00000040369
|
Olr1767
|
olfactory receptor 1767 |
| chr11_-_82893845 | 2.27 |
ENSRNOT00000075306
|
LOC100912571
|
eukaryotic translation initiation factor 4 gamma 1-like |
| chr1_+_169912819 | 2.26 |
ENSRNOT00000023283
|
Olr185
|
olfactory receptor 185 |
| chr3_+_48096954 | 2.26 |
ENSRNOT00000068238
ENSRNOT00000064344 ENSRNOT00000044638 |
Slc4a10
|
solute carrier family 4 member 10 |
| chr4_+_69386698 | 2.25 |
ENSRNOT00000091655
|
Trbv13-2
|
T cell receptor beta, variable 13-2 |
| chr16_-_3790928 | 2.24 |
ENSRNOT00000082024
ENSRNOT00000035065 |
Cphx
|
cytoplasmic polyadenylated homeobox |
| chr1_-_89944752 | 2.23 |
ENSRNOT00000029680
|
Scgb2b24
|
secretoglobin, family 2B, member 24 |
| chr8_-_54961265 | 2.16 |
ENSRNOT00000012434
|
Pts
|
6-pyruvoyl-tetrahydropterin synthase |
| chrX_+_13992064 | 2.13 |
ENSRNOT00000036543
|
LOC100363125
|
rCG42854-like |
| chr8_+_43644822 | 2.12 |
ENSRNOT00000085286
|
Olr1321
|
olfactory receptor 1321 |
| chr15_-_27001826 | 2.11 |
ENSRNOT00000016693
|
Olr1608
|
olfactory receptor 1608 |
| chr1_+_169636914 | 2.08 |
ENSRNOT00000074466
|
Olr158
|
olfactory receptor 158 |
| chr10_+_12100133 | 2.06 |
ENSRNOT00000060987
|
Olr1358
|
olfactory receptor 1358 |
| chr3_+_102859815 | 2.06 |
ENSRNOT00000037906
|
Olr771
|
olfactory receptor 771 |
| chr9_-_44534041 | 2.04 |
ENSRNOT00000025068
|
LOC100910070
|
lysozyme g-like protein 1-like |
| chr17_+_57906050 | 2.03 |
ENSRNOT00000077338
|
AABR07028157.1
|
|
| chr15_+_35843533 | 2.02 |
ENSRNOT00000087987
|
AC114070.2
|
|
| chr11_-_33760100 | 1.99 |
ENSRNOT00000065810
|
RGD1562683
|
RGD1562683 |
| chr16_+_55152748 | 1.98 |
ENSRNOT00000000121
|
Fgf20
|
fibroblast growth factor 20 |
| chr5_+_98387291 | 1.95 |
ENSRNOT00000046503
|
Tyrp1
|
tyrosinase-related protein 1 |
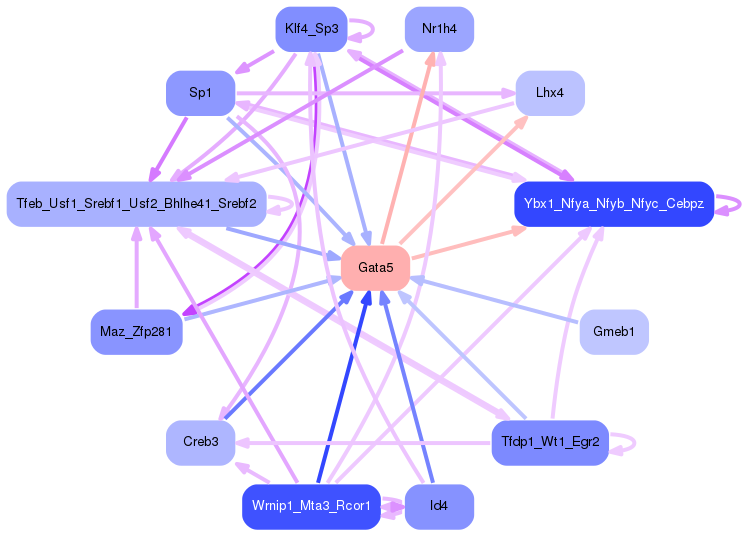
Network of associatons between targets according to the STRING database.

First level regulatory network of Gata5
Gene Ontology Analysis
Gene overrepresentation in biological process category:
| Log-likelihood per target | Total log-likelihood | Term | Description |
|---|---|---|---|
| 12.4 | 37.2 | GO:0010903 | negative regulation of very-low-density lipoprotein particle remodeling(GO:0010903) |
| 7.3 | 21.8 | GO:1903630 | regulation of aminoacyl-tRNA ligase activity(GO:1903630) |
| 6.4 | 19.3 | GO:0033986 | response to methanol(GO:0033986) |
| 6.0 | 23.9 | GO:0009441 | glycolate metabolic process(GO:0009441) |
| 4.9 | 24.4 | GO:0043152 | induction of bacterial agglutination(GO:0043152) |
| 4.2 | 25.2 | GO:0046874 | quinolinate metabolic process(GO:0046874) |
| 4.1 | 20.6 | GO:0006526 | arginine biosynthetic process(GO:0006526) |
| 3.1 | 9.2 | GO:1990743 | protein sialylation(GO:1990743) |
| 3.0 | 8.9 | GO:0019676 | ammonia assimilation cycle(GO:0019676) histone H3-R17 methylation(GO:0034971) |
| 2.6 | 33.8 | GO:0042178 | xenobiotic catabolic process(GO:0042178) |
| 2.6 | 28.5 | GO:0015747 | urate transport(GO:0015747) |
| 2.3 | 9.1 | GO:0046013 | regulation of T cell homeostatic proliferation(GO:0046013) |
| 2.0 | 14.2 | GO:0043252 | sodium-independent organic anion transport(GO:0043252) |
| 1.8 | 3.6 | GO:1903383 | neuron intrinsic apoptotic signaling pathway in response to hydrogen peroxide(GO:0036482) positive regulation of mitochondrial electron transport, NADH to ubiquinone(GO:1902958) regulation of hydrogen peroxide-induced neuron intrinsic apoptotic signaling pathway(GO:1903383) negative regulation of hydrogen peroxide-induced neuron intrinsic apoptotic signaling pathway(GO:1903384) |
| 1.7 | 8.3 | GO:1904970 | brush border assembly(GO:1904970) |
| 1.5 | 4.5 | GO:1903860 | negative regulation of dendrite extension(GO:1903860) |
| 1.4 | 4.3 | GO:0035928 | mitochondrial mRNA catabolic process(GO:0000958) positive regulation of mitochondrial RNA catabolic process(GO:0000962) rRNA import into mitochondrion(GO:0035928) |
| 1.4 | 11.1 | GO:0086073 | bundle of His cell-Purkinje myocyte adhesion involved in cell communication(GO:0086073) |
| 1.3 | 12.0 | GO:0052697 | xenobiotic glucuronidation(GO:0052697) |
| 1.3 | 3.9 | GO:1903660 | T-helper 1 cell lineage commitment(GO:0002296) negative regulation of complement-dependent cytotoxicity(GO:1903660) regulation of eosinophil chemotaxis(GO:2000422) positive regulation of eosinophil chemotaxis(GO:2000424) |
| 1.3 | 15.4 | GO:0046485 | ether lipid metabolic process(GO:0046485) |
| 1.2 | 4.8 | GO:2000870 | regulation of progesterone secretion(GO:2000870) |
| 1.1 | 4.4 | GO:1903576 | response to L-arginine(GO:1903576) |
| 1.0 | 25.2 | GO:0030574 | collagen catabolic process(GO:0030574) |
| 1.0 | 5.0 | GO:0070094 | positive regulation of glucagon secretion(GO:0070094) |
| 1.0 | 14.0 | GO:0009083 | branched-chain amino acid catabolic process(GO:0009083) |
| 1.0 | 2.0 | GO:0048023 | positive regulation of melanin biosynthetic process(GO:0048023) positive regulation of secondary metabolite biosynthetic process(GO:1900378) |
| 1.0 | 3.8 | GO:0021526 | medial motor column neuron differentiation(GO:0021526) |
| 1.0 | 7.6 | GO:1904058 | positive regulation of sensory perception of pain(GO:1904058) |
| 0.9 | 3.8 | GO:0052695 | cellular glucuronidation(GO:0052695) |
| 0.9 | 4.7 | GO:0045297 | mating plug formation(GO:0042628) post-mating behavior(GO:0045297) |
| 0.8 | 18.3 | GO:0032401 | establishment of melanosome localization(GO:0032401) melanosome transport(GO:0032402) |
| 0.8 | 4.0 | GO:0060689 | cell differentiation involved in salivary gland development(GO:0060689) |
| 0.7 | 3.7 | GO:0061113 | pancreas morphogenesis(GO:0061113) |
| 0.7 | 12.7 | GO:0036092 | phosphatidylinositol-3-phosphate biosynthetic process(GO:0036092) |
| 0.7 | 13.9 | GO:0045603 | positive regulation of endothelial cell differentiation(GO:0045603) |
| 0.7 | 4.1 | GO:0061303 | cornea development in camera-type eye(GO:0061303) |
| 0.7 | 5.5 | GO:0034551 | respiratory chain complex III assembly(GO:0017062) mitochondrial respiratory chain complex III assembly(GO:0034551) |
| 0.7 | 6.8 | GO:1990035 | calcium ion import across plasma membrane(GO:0098703) calcium ion import into cell(GO:1990035) |
| 0.7 | 12.0 | GO:0036315 | cellular response to sterol(GO:0036315) |
| 0.6 | 33.6 | GO:0006182 | cGMP biosynthetic process(GO:0006182) |
| 0.6 | 2.3 | GO:0046338 | phosphatidylethanolamine catabolic process(GO:0046338) |
| 0.6 | 7.2 | GO:0034063 | stress granule assembly(GO:0034063) |
| 0.5 | 2.0 | GO:0016998 | cell wall macromolecule catabolic process(GO:0016998) |
| 0.5 | 4.0 | GO:0006776 | vitamin A metabolic process(GO:0006776) |
| 0.5 | 1.4 | GO:1990168 | protein K27-linked deubiquitination(GO:1990167) protein K33-linked deubiquitination(GO:1990168) |
| 0.4 | 4.8 | GO:0006782 | protoporphyrinogen IX biosynthetic process(GO:0006782) |
| 0.4 | 4.2 | GO:0070995 | NADPH oxidation(GO:0070995) |
| 0.4 | 1.6 | GO:0019918 | peptidyl-arginine methylation, to symmetrical-dimethyl arginine(GO:0019918) |
| 0.4 | 6.6 | GO:0089711 | L-glutamate transmembrane transport(GO:0089711) |
| 0.4 | 3.6 | GO:0007195 | adenylate cyclase-inhibiting dopamine receptor signaling pathway(GO:0007195) |
| 0.3 | 4.5 | GO:0070072 | vacuolar proton-transporting V-type ATPase complex assembly(GO:0070072) |
| 0.3 | 1.7 | GO:0060478 | acrosomal vesicle exocytosis(GO:0060478) |
| 0.3 | 4.0 | GO:0042407 | cristae formation(GO:0042407) |
| 0.3 | 20.8 | GO:0032094 | response to food(GO:0032094) |
| 0.3 | 10.9 | GO:0070527 | platelet aggregation(GO:0070527) |
| 0.3 | 3.0 | GO:0043249 | erythrocyte maturation(GO:0043249) |
| 0.3 | 2.2 | GO:0006729 | tetrahydrobiopterin biosynthetic process(GO:0006729) |
| 0.3 | 1.1 | GO:0035519 | protein K29-linked ubiquitination(GO:0035519) |
| 0.3 | 1.6 | GO:0046490 | isopentenyl diphosphate biosynthetic process(GO:0009240) isopentenyl diphosphate metabolic process(GO:0046490) |
| 0.3 | 4.1 | GO:1900003 | regulation of serine-type endopeptidase activity(GO:1900003) regulation of serine-type peptidase activity(GO:1902571) |
| 0.3 | 0.8 | GO:0070563 | cell migration involved in endocardial cushion formation(GO:0003273) negative regulation of vitamin D receptor signaling pathway(GO:0070563) |
| 0.2 | 1.2 | GO:0007529 | establishment of synaptic specificity at neuromuscular junction(GO:0007529) gamma-aminobutyric acid receptor clustering(GO:0097112) receptor diffusion trapping(GO:0098953) postsynaptic neurotransmitter receptor diffusion trapping(GO:0098970) neurotransmitter receptor diffusion trapping(GO:0099628) |
| 0.2 | 23.7 | GO:0008203 | cholesterol metabolic process(GO:0008203) |
| 0.2 | 20.5 | GO:0042246 | tissue regeneration(GO:0042246) |
| 0.2 | 0.6 | GO:2000312 | regulation of kainate selective glutamate receptor activity(GO:2000312) |
| 0.2 | 0.9 | GO:0018992 | germ-line sex determination(GO:0018992) |
| 0.2 | 1.3 | GO:0014054 | positive regulation of gamma-aminobutyric acid secretion(GO:0014054) |
| 0.2 | 2.9 | GO:0002227 | innate immune response in mucosa(GO:0002227) |
| 0.2 | 4.0 | GO:0045116 | protein neddylation(GO:0045116) |
| 0.2 | 1.4 | GO:0016584 | maintenance of DNA methylation(GO:0010216) nucleosome positioning(GO:0016584) |
| 0.2 | 4.6 | GO:0043537 | negative regulation of blood vessel endothelial cell migration(GO:0043537) |
| 0.2 | 1.7 | GO:0033523 | histone H2B ubiquitination(GO:0033523) |
| 0.2 | 4.3 | GO:0033194 | response to hydroperoxide(GO:0033194) |
| 0.2 | 11.6 | GO:0030193 | regulation of blood coagulation(GO:0030193) regulation of hemostasis(GO:1900046) |
| 0.2 | 21.7 | GO:0043542 | endothelial cell migration(GO:0043542) |
| 0.1 | 1.7 | GO:0046884 | follicle-stimulating hormone secretion(GO:0046884) |
| 0.1 | 2.3 | GO:0099612 | anterograde synaptic vesicle transport(GO:0048490) synaptic vesicle cytoskeletal transport(GO:0099514) synaptic vesicle transport along microtubule(GO:0099517) protein localization to axon(GO:0099612) |
| 0.1 | 2.3 | GO:0021860 | pyramidal neuron development(GO:0021860) |
| 0.1 | 3.8 | GO:0007339 | binding of sperm to zona pellucida(GO:0007339) |
| 0.1 | 1.4 | GO:0001867 | complement activation, lectin pathway(GO:0001867) |
| 0.1 | 1.0 | GO:0032119 | sequestering of zinc ion(GO:0032119) regulation of sequestering of zinc ion(GO:0061088) |
| 0.1 | 3.7 | GO:1903959 | regulation of anion transmembrane transport(GO:1903959) |
| 0.1 | 2.5 | GO:0033198 | response to ATP(GO:0033198) |
| 0.1 | 1.5 | GO:0048535 | lymph node development(GO:0048535) |
| 0.1 | 2.6 | GO:0010107 | potassium ion import(GO:0010107) |
| 0.1 | 9.3 | GO:0016579 | protein deubiquitination(GO:0016579) |
| 0.1 | 96.8 | GO:0050911 | detection of chemical stimulus involved in sensory perception of smell(GO:0050911) |
| 0.1 | 1.3 | GO:0006607 | NLS-bearing protein import into nucleus(GO:0006607) |
| 0.1 | 1.0 | GO:0051292 | nuclear pore complex assembly(GO:0051292) |
| 0.1 | 9.9 | GO:0090501 | RNA phosphodiester bond hydrolysis(GO:0090501) |
| 0.1 | 0.6 | GO:0046543 | development of secondary female sexual characteristics(GO:0046543) |
| 0.1 | 2.0 | GO:0060043 | regulation of cardiac muscle cell proliferation(GO:0060043) |
| 0.1 | 2.8 | GO:0070830 | bicellular tight junction assembly(GO:0070830) |
| 0.1 | 0.7 | GO:0021542 | dentate gyrus development(GO:0021542) |
| 0.1 | 3.0 | GO:0032088 | negative regulation of NF-kappaB transcription factor activity(GO:0032088) |
| 0.1 | 3.2 | GO:0032755 | positive regulation of interleukin-6 production(GO:0032755) |
| 0.1 | 0.3 | GO:0006432 | phenylalanyl-tRNA aminoacylation(GO:0006432) |
| 0.1 | 3.4 | GO:0051602 | response to electrical stimulus(GO:0051602) |
| 0.0 | 4.3 | GO:0051028 | mRNA transport(GO:0051028) |
| 0.0 | 1.5 | GO:0006730 | one-carbon metabolic process(GO:0006730) |
| 0.0 | 3.2 | GO:1903955 | positive regulation of protein targeting to mitochondrion(GO:1903955) |
| 0.0 | 0.9 | GO:0097502 | mannosylation(GO:0097502) |
| 0.0 | 0.4 | GO:0032674 | regulation of interleukin-5 production(GO:0032674) |
| 0.0 | 5.1 | GO:0010951 | negative regulation of endopeptidase activity(GO:0010951) |
| 0.0 | 0.7 | GO:0090307 | mitotic spindle assembly(GO:0090307) |
| 0.0 | 1.7 | GO:0090305 | nucleic acid phosphodiester bond hydrolysis(GO:0090305) |
Gene overrepresentation in cellular component category:
| Log-likelihood per target | Total log-likelihood | Term | Description |
|---|---|---|---|
| 7.4 | 37.2 | GO:0034365 | discoidal high-density lipoprotein particle(GO:0034365) |
| 3.1 | 24.4 | GO:0005577 | fibrinogen complex(GO:0005577) |
| 2.8 | 14.0 | GO:0005947 | mitochondrial alpha-ketoglutarate dehydrogenase complex(GO:0005947) |
| 1.5 | 37.3 | GO:0008074 | guanylate cyclase complex, soluble(GO:0008074) |
| 1.4 | 4.3 | GO:0045025 | mitochondrial degradosome(GO:0045025) |
| 1.3 | 33.8 | GO:0005640 | nuclear outer membrane(GO:0005640) |
| 1.0 | 9.2 | GO:0000138 | Golgi trans cisterna(GO:0000138) |
| 0.9 | 3.8 | GO:0034774 | secretory granule lumen(GO:0034774) |
| 0.9 | 6.5 | GO:0016602 | CCAAT-binding factor complex(GO:0016602) |
| 0.9 | 4.5 | GO:0000220 | vacuolar proton-transporting V-type ATPase, V0 domain(GO:0000220) |
| 0.7 | 16.2 | GO:0005942 | phosphatidylinositol 3-kinase complex(GO:0005942) |
| 0.6 | 4.0 | GO:0061617 | MICOS complex(GO:0061617) |
| 0.5 | 11.8 | GO:0030057 | desmosome(GO:0030057) |
| 0.5 | 5.5 | GO:0005750 | mitochondrial respiratory chain complex III(GO:0005750) |
| 0.5 | 2.3 | GO:1990769 | proximal neuron projection(GO:1990769) |
| 0.4 | 1.7 | GO:0002079 | inner acrosomal membrane(GO:0002079) |
| 0.4 | 3.0 | GO:0005833 | hemoglobin complex(GO:0005833) |
| 0.4 | 7.6 | GO:0005639 | integral component of nuclear inner membrane(GO:0005639) intrinsic component of nuclear inner membrane(GO:0031229) nuclear membrane part(GO:0044453) |
| 0.4 | 3.6 | GO:0005742 | mitochondrial outer membrane translocase complex(GO:0005742) |
| 0.4 | 2.3 | GO:0097441 | basilar dendrite(GO:0097441) |
| 0.3 | 10.9 | GO:0008305 | integrin complex(GO:0008305) |
| 0.3 | 13.0 | GO:0000791 | euchromatin(GO:0000791) |
| 0.3 | 14.3 | GO:0045271 | mitochondrial respiratory chain complex I(GO:0005747) NADH dehydrogenase complex(GO:0030964) respiratory chain complex I(GO:0045271) |
| 0.2 | 2.0 | GO:0045009 | melanosome membrane(GO:0033162) chitosome(GO:0045009) |
| 0.2 | 1.3 | GO:0032983 | kainate selective glutamate receptor complex(GO:0032983) |
| 0.2 | 20.2 | GO:0048770 | melanosome(GO:0042470) pigment granule(GO:0048770) |
| 0.2 | 1.7 | GO:0031232 | extrinsic component of external side of plasma membrane(GO:0031232) |
| 0.2 | 11.1 | GO:0016459 | myosin complex(GO:0016459) |
| 0.2 | 3.4 | GO:0005922 | connexon complex(GO:0005922) |
| 0.2 | 26.1 | GO:0005777 | peroxisome(GO:0005777) microbody(GO:0042579) |
| 0.1 | 7.2 | GO:0010494 | cytoplasmic stress granule(GO:0010494) |
| 0.1 | 7.7 | GO:0034707 | chloride channel complex(GO:0034707) |
| 0.1 | 8.2 | GO:0045095 | keratin filament(GO:0045095) |
| 0.1 | 5.4 | GO:0005762 | organellar large ribosomal subunit(GO:0000315) mitochondrial large ribosomal subunit(GO:0005762) |
| 0.1 | 1.9 | GO:0042588 | zymogen granule(GO:0042588) |
| 0.1 | 0.7 | GO:0005818 | astral microtubule(GO:0000235) aster(GO:0005818) |
| 0.1 | 6.7 | GO:0030672 | synaptic vesicle membrane(GO:0030672) exocytic vesicle membrane(GO:0099501) |
| 0.1 | 20.9 | GO:0005759 | mitochondrial matrix(GO:0005759) |
| 0.1 | 1.9 | GO:0001673 | male germ cell nucleus(GO:0001673) |
| 0.1 | 2.2 | GO:0005771 | multivesicular body(GO:0005771) |
| 0.1 | 23.5 | GO:0016324 | apical plasma membrane(GO:0016324) |
| 0.1 | 90.0 | GO:0005615 | extracellular space(GO:0005615) |
| 0.1 | 1.6 | GO:0005753 | mitochondrial proton-transporting ATP synthase complex(GO:0005753) |
| 0.0 | 0.9 | GO:0030667 | secretory granule membrane(GO:0030667) |
| 0.0 | 2.2 | GO:0005643 | nuclear pore(GO:0005643) |
| 0.0 | 3.7 | GO:0090575 | RNA polymerase II transcription factor complex(GO:0090575) |
| 0.0 | 0.5 | GO:0005839 | proteasome core complex(GO:0005839) |
| 0.0 | 1.7 | GO:0005681 | spliceosomal complex(GO:0005681) |
| 0.0 | 0.3 | GO:0005689 | U12-type spliceosomal complex(GO:0005689) |
| 0.0 | 9.1 | GO:0005789 | endoplasmic reticulum membrane(GO:0005789) |
| 0.0 | 4.2 | GO:0016607 | nuclear speck(GO:0016607) |
| 0.0 | 2.2 | GO:0009897 | external side of plasma membrane(GO:0009897) |
Gene overrepresentation in molecular function category:
| Log-likelihood per target | Total log-likelihood | Term | Description |
|---|---|---|---|
| 12.4 | 37.2 | GO:0070653 | high-density lipoprotein particle receptor binding(GO:0070653) |
| 6.0 | 23.9 | GO:0003973 | (S)-2-hydroxy-acid oxidase activity(GO:0003973) |
| 2.8 | 28.5 | GO:0015143 | urate transmembrane transporter activity(GO:0015143) efflux transmembrane transporter activity(GO:0015562) salt transmembrane transporter activity(GO:1901702) |
| 2.3 | 9.2 | GO:0003835 | beta-galactoside alpha-2,6-sialyltransferase activity(GO:0003835) |
| 2.2 | 8.9 | GO:0038181 | bile acid receptor activity(GO:0038181) |
| 2.2 | 15.4 | GO:0016803 | ether hydrolase activity(GO:0016803) |
| 2.0 | 16.2 | GO:0035005 | 1-phosphatidylinositol-4-phosphate 3-kinase activity(GO:0035005) |
| 1.9 | 33.8 | GO:0043295 | glutathione binding(GO:0043295) |
| 1.8 | 9.2 | GO:0046912 | transferase activity, transferring acyl groups, acyl groups converted into alkyl on transfer(GO:0046912) |
| 1.8 | 10.9 | GO:0070051 | fibrinogen binding(GO:0070051) |
| 1.6 | 14.0 | GO:0016624 | oxidoreductase activity, acting on the aldehyde or oxo group of donors, disulfide as acceptor(GO:0016624) |
| 1.5 | 7.5 | GO:0005134 | interleukin-2 receptor binding(GO:0005134) |
| 1.5 | 37.3 | GO:0004383 | guanylate cyclase activity(GO:0004383) |
| 1.4 | 42.3 | GO:0015020 | glucuronosyltransferase activity(GO:0015020) |
| 1.3 | 6.6 | GO:0005314 | high-affinity glutamate transmembrane transporter activity(GO:0005314) |
| 1.0 | 3.9 | GO:0005136 | interleukin-4 receptor binding(GO:0005136) |
| 0.9 | 12.5 | GO:0042301 | phosphate ion binding(GO:0042301) |
| 0.9 | 14.2 | GO:0015125 | bile acid transmembrane transporter activity(GO:0015125) |
| 0.8 | 7.6 | GO:0004931 | extracellular ATP-gated cation channel activity(GO:0004931) ATP-gated ion channel activity(GO:0035381) |
| 0.7 | 14.5 | GO:0030169 | low-density lipoprotein particle binding(GO:0030169) |
| 0.7 | 4.8 | GO:0016634 | oxidoreductase activity, acting on the CH-CH group of donors, oxygen as acceptor(GO:0016634) |
| 0.7 | 5.5 | GO:0016681 | ubiquinol-cytochrome-c reductase activity(GO:0008121) oxidoreductase activity, acting on diphenols and related substances as donors, cytochrome as acceptor(GO:0016681) |
| 0.6 | 25.2 | GO:0016831 | carboxy-lyase activity(GO:0016831) |
| 0.5 | 1.6 | GO:0004911 | interleukin-2 receptor activity(GO:0004911) |
| 0.5 | 4.3 | GO:0034046 | poly(G) binding(GO:0034046) |
| 0.5 | 2.0 | GO:0016716 | oxidoreductase activity, acting on paired donors, with incorporation or reduction of molecular oxygen, another compound as one donor, and incorporation of one atom of oxygen(GO:0016716) |
| 0.4 | 1.6 | GO:0035243 | protein-arginine omega-N symmetric methyltransferase activity(GO:0035243) |
| 0.4 | 7.7 | GO:0005247 | voltage-gated chloride channel activity(GO:0005247) |
| 0.4 | 3.6 | GO:0001591 | dopamine neurotransmitter receptor activity, coupled via Gi/Go(GO:0001591) |
| 0.4 | 1.6 | GO:0004452 | isopentenyl-diphosphate delta-isomerase activity(GO:0004452) |
| 0.4 | 3.6 | GO:0055131 | C3HC4-type RING finger domain binding(GO:0055131) |
| 0.4 | 4.2 | GO:0004499 | N,N-dimethylaniline monooxygenase activity(GO:0004499) |
| 0.3 | 70.2 | GO:0004252 | serine-type endopeptidase activity(GO:0004252) |
| 0.3 | 4.0 | GO:0019841 | retinol binding(GO:0019841) |
| 0.3 | 1.2 | GO:0008940 | nitrate reductase activity(GO:0008940) |
| 0.3 | 7.9 | GO:0050136 | NADH dehydrogenase (ubiquinone) activity(GO:0008137) NADH dehydrogenase (quinone) activity(GO:0050136) |
| 0.3 | 2.3 | GO:0047499 | calcium-independent phospholipase A2 activity(GO:0047499) |
| 0.3 | 1.4 | GO:0030280 | structural constituent of epidermis(GO:0030280) |
| 0.3 | 24.1 | GO:0051087 | chaperone binding(GO:0051087) |
| 0.3 | 1.3 | GO:0004977 | melanocortin receptor activity(GO:0004977) |
| 0.3 | 14.7 | GO:0005160 | transforming growth factor beta receptor binding(GO:0005160) |
| 0.2 | 4.0 | GO:0097602 | cullin family protein binding(GO:0097602) |
| 0.2 | 25.1 | GO:0004867 | serine-type endopeptidase inhibitor activity(GO:0004867) |
| 0.2 | 4.5 | GO:0046961 | proton-transporting ATPase activity, rotational mechanism(GO:0046961) |
| 0.2 | 1.3 | GO:0015277 | kainate selective glutamate receptor activity(GO:0015277) |
| 0.2 | 3.3 | GO:0005149 | interleukin-1 receptor binding(GO:0005149) |
| 0.2 | 1.5 | GO:0016494 | C-X-C chemokine receptor activity(GO:0016494) |
| 0.2 | 23.6 | GO:0005179 | hormone activity(GO:0005179) |
| 0.2 | 2.0 | GO:0003796 | lysozyme activity(GO:0003796) |
| 0.1 | 4.2 | GO:0003887 | DNA-directed DNA polymerase activity(GO:0003887) |
| 0.1 | 1.4 | GO:1990380 | Lys48-specific deubiquitinase activity(GO:1990380) |
| 0.1 | 4.0 | GO:0016676 | cytochrome-c oxidase activity(GO:0004129) heme-copper terminal oxidase activity(GO:0015002) oxidoreductase activity, acting on a heme group of donors, oxygen as acceptor(GO:0016676) |
| 0.1 | 1.5 | GO:0004089 | carbonate dehydratase activity(GO:0004089) |
| 0.1 | 2.6 | GO:0005242 | inward rectifier potassium channel activity(GO:0005242) |
| 0.1 | 18.9 | GO:0052689 | carboxylic ester hydrolase activity(GO:0052689) |
| 0.1 | 42.7 | GO:0005549 | odorant binding(GO:0005549) |
| 0.1 | 11.6 | GO:0004540 | ribonuclease activity(GO:0004540) |
| 0.1 | 9.3 | GO:0101005 | thiol-dependent ubiquitinyl hydrolase activity(GO:0036459) ubiquitinyl hydrolase activity(GO:0101005) |
| 0.1 | 2.3 | GO:0005452 | inorganic anion exchanger activity(GO:0005452) |
| 0.1 | 3.5 | GO:0099589 | G-protein coupled serotonin receptor activity(GO:0004993) serotonin receptor activity(GO:0099589) |
| 0.1 | 5.4 | GO:0004869 | cysteine-type endopeptidase inhibitor activity(GO:0004869) |
| 0.1 | 1.7 | GO:0000993 | RNA polymerase II core binding(GO:0000993) |
| 0.1 | 11.1 | GO:0003774 | motor activity(GO:0003774) |
| 0.1 | 2.4 | GO:0004003 | ATP-dependent DNA helicase activity(GO:0004003) |
| 0.1 | 8.1 | GO:0004222 | metalloendopeptidase activity(GO:0004222) |
| 0.1 | 2.0 | GO:0005104 | fibroblast growth factor receptor binding(GO:0005104) |
| 0.1 | 50.6 | GO:0004984 | olfactory receptor activity(GO:0004984) |
| 0.1 | 0.7 | GO:0008061 | chitin binding(GO:0008061) |
| 0.1 | 1.3 | GO:0008139 | nuclear localization sequence binding(GO:0008139) |
| 0.1 | 3.7 | GO:0098531 | RNA polymerase II transcription factor activity, ligand-activated sequence-specific DNA binding(GO:0004879) transcription factor activity, direct ligand regulated sequence-specific DNA binding(GO:0098531) |
| 0.1 | 6.8 | GO:0005262 | calcium channel activity(GO:0005262) |
| 0.1 | 1.0 | GO:0017056 | structural constituent of nuclear pore(GO:0017056) |
| 0.1 | 4.0 | GO:0032947 | protein complex scaffold(GO:0032947) |
| 0.0 | 0.3 | GO:0004826 | phenylalanine-tRNA ligase activity(GO:0004826) |
| 0.0 | 2.2 | GO:0016835 | carbon-oxygen lyase activity(GO:0016835) |
| 0.0 | 0.9 | GO:0000030 | mannosyltransferase activity(GO:0000030) |
| 0.0 | 1.0 | GO:0005385 | zinc ion transmembrane transporter activity(GO:0005385) |
| 0.0 | 2.8 | GO:0008080 | N-acetyltransferase activity(GO:0008080) |
| 0.0 | 0.5 | GO:0070003 | threonine-type endopeptidase activity(GO:0004298) threonine-type peptidase activity(GO:0070003) |
| 0.0 | 1.4 | GO:0031490 | chromatin DNA binding(GO:0031490) |
| 0.0 | 2.1 | GO:0019838 | growth factor binding(GO:0019838) |
| 0.0 | 2.1 | GO:0016758 | transferase activity, transferring hexosyl groups(GO:0016758) |
Gene overrepresentation in curated gene sets: canonical pathways category:
| Log-likelihood per target | Total log-likelihood | Term | Description |
|---|---|---|---|
| 0.8 | 46.4 | PID HNF3B PATHWAY | FOXA2 and FOXA3 transcription factor networks |
| 0.7 | 21.4 | PID INTEGRIN2 PATHWAY | Beta2 integrin cell surface interactions |
| 0.5 | 10.9 | PID INTEGRIN CS PATHWAY | Integrin family cell surface interactions |
| 0.4 | 99.5 | NABA ECM REGULATORS | Genes encoding enzymes and their regulators involved in the remodeling of the extracellular matrix |
| 0.4 | 13.9 | PID ALK1 PATHWAY | ALK1 signaling events |
| 0.4 | 13.0 | PID TCR CALCIUM PATHWAY | Calcium signaling in the CD4+ TCR pathway |
| 0.3 | 16.2 | ST DIFFERENTIATION PATHWAY IN PC12 CELLS | Differentiation Pathway in PC12 Cells; this is a specific case of PAC1 Receptor Pathway. |
| 0.3 | 4.2 | PID DNA PK PATHWAY | DNA-PK pathway in nonhomologous end joining |
| 0.2 | 8.9 | PID RXR VDR PATHWAY | RXR and RAR heterodimerization with other nuclear receptor |
| 0.2 | 7.2 | PID RET PATHWAY | Signaling events regulated by Ret tyrosine kinase |
| 0.2 | 4.0 | PID RHODOPSIN PATHWAY | Visual signal transduction: Rods |
| 0.1 | 4.1 | NABA PROTEOGLYCANS | Genes encoding proteoglycans |
| 0.1 | 0.4 | PID IL5 PATHWAY | IL5-mediated signaling events |
| 0.0 | 3.1 | PID REG GR PATHWAY | Glucocorticoid receptor regulatory network |
| 0.0 | 3.6 | PID MYC REPRESS PATHWAY | Validated targets of C-MYC transcriptional repression |
| 0.0 | 1.1 | PID NFAT TFPATHWAY | Calcineurin-regulated NFAT-dependent transcription in lymphocytes |
Gene overrepresentation in curated gene sets: REACTOME pathways category:
| Log-likelihood per target | Total log-likelihood | Term | Description |
|---|---|---|---|
| 2.8 | 25.2 | REACTOME TRYPTOPHAN CATABOLISM | Genes involved in Tryptophan catabolism |
| 2.2 | 37.2 | REACTOME CHYLOMICRON MEDIATED LIPID TRANSPORT | Genes involved in Chylomicron-mediated lipid transport |
| 2.0 | 35.4 | REACTOME P130CAS LINKAGE TO MAPK SIGNALING FOR INTEGRINS | Genes involved in p130Cas linkage to MAPK signaling for integrins |
| 1.1 | 33.8 | REACTOME GLUTATHIONE CONJUGATION | Genes involved in Glutathione conjugation |
| 1.1 | 14.5 | REACTOME HYALURONAN UPTAKE AND DEGRADATION | Genes involved in Hyaluronan uptake and degradation |
| 0.9 | 25.2 | REACTOME DEGRADATION OF THE EXTRACELLULAR MATRIX | Genes involved in Degradation of the extracellular matrix |
| 0.8 | 15.8 | REACTOME GLUCURONIDATION | Genes involved in Glucuronidation |
| 0.8 | 14.0 | REACTOME BRANCHED CHAIN AMINO ACID CATABOLISM | Genes involved in Branched-chain amino acid catabolism |
| 0.6 | 20.8 | REACTOME LIPID DIGESTION MOBILIZATION AND TRANSPORT | Genes involved in Lipid digestion, mobilization, and transport |
| 0.6 | 9.2 | REACTOME TERMINATION OF O GLYCAN BIOSYNTHESIS | Genes involved in Termination of O-glycan biosynthesis |
| 0.6 | 10.6 | REACTOME SYNTHESIS OF PIPS AT THE GOLGI MEMBRANE | Genes involved in Synthesis of PIPs at the Golgi membrane |
| 0.4 | 9.2 | REACTOME CHOLESTEROL BIOSYNTHESIS | Genes involved in Cholesterol biosynthesis |
| 0.4 | 9.5 | REACTOME IL RECEPTOR SHC SIGNALING | Genes involved in Interleukin receptor SHC signaling |
| 0.3 | 4.1 | REACTOME KERATAN SULFATE DEGRADATION | Genes involved in Keratan sulfate degradation |
| 0.3 | 7.2 | REACTOME TIE2 SIGNALING | Genes involved in Tie2 Signaling |
| 0.3 | 5.0 | REACTOME SYNTHESIS SECRETION AND INACTIVATION OF GIP | Genes involved in Synthesis, Secretion, and Inactivation of Glucose-dependent Insulinotropic Polypeptide (GIP) |
| 0.3 | 4.8 | REACTOME METABOLISM OF PORPHYRINS | Genes involved in Metabolism of porphyrins |
| 0.2 | 42.7 | REACTOME METABOLISM OF AMINO ACIDS AND DERIVATIVES | Genes involved in Metabolism of amino acids and derivatives |
| 0.2 | 15.5 | REACTOME RESPIRATORY ELECTRON TRANSPORT | Genes involved in Respiratory electron transport |
| 0.2 | 19.3 | REACTOME RESPONSE TO ELEVATED PLATELET CYTOSOLIC CA2 | Genes involved in Response to elevated platelet cytosolic Ca2+ |
| 0.2 | 3.4 | REACTOME GAP JUNCTION ASSEMBLY | Genes involved in Gap junction assembly |
| 0.2 | 4.5 | REACTOME INSULIN RECEPTOR RECYCLING | Genes involved in Insulin receptor recycling |
| 0.2 | 2.8 | REACTOME TGF BETA RECEPTOR SIGNALING IN EMT EPITHELIAL TO MESENCHYMAL TRANSITION | Genes involved in TGF-beta receptor signaling in EMT (epithelial to mesenchymal transition) |
| 0.2 | 2.0 | REACTOME SIGNALING BY ACTIVATED POINT MUTANTS OF FGFR1 | Genes involved in Signaling by activated point mutants of FGFR1 |
| 0.1 | 1.1 | REACTOME TETRAHYDROBIOPTERIN BH4 SYNTHESIS RECYCLING SALVAGE AND REGULATION | Genes involved in Tetrahydrobiopterin (BH4) synthesis, recycling, salvage and regulation |
| 0.1 | 3.7 | REACTOME REGULATION OF BETA CELL DEVELOPMENT | Genes involved in Regulation of beta-cell development |
| 0.1 | 1.3 | REACTOME IONOTROPIC ACTIVITY OF KAINATE RECEPTORS | Genes involved in Ionotropic activity of Kainate Receptors |
| 0.1 | 4.2 | REACTOME PHASE1 FUNCTIONALIZATION OF COMPOUNDS | Genes involved in Phase 1 - Functionalization of compounds |
| 0.1 | 2.3 | REACTOME ACYL CHAIN REMODELLING OF PE | Genes involved in Acyl chain remodelling of PE |
| 0.0 | 0.9 | REACTOME SYNTHESIS OF GLYCOSYLPHOSPHATIDYLINOSITOL GPI | Genes involved in Synthesis of glycosylphosphatidylinositol (GPI) |
| 0.0 | 0.9 | REACTOME AMYLOIDS | Genes involved in Amyloids |
| 0.0 | 1.2 | REACTOME METABOLISM OF VITAMINS AND COFACTORS | Genes involved in Metabolism of vitamins and cofactors |
| 0.0 | 0.3 | REACTOME MITOCHONDRIAL TRNA AMINOACYLATION | Genes involved in Mitochondrial tRNA aminoacylation |