Project
GSE53960: rat RNA-Seq transcriptomic Bodymap
Navigation
Downloads
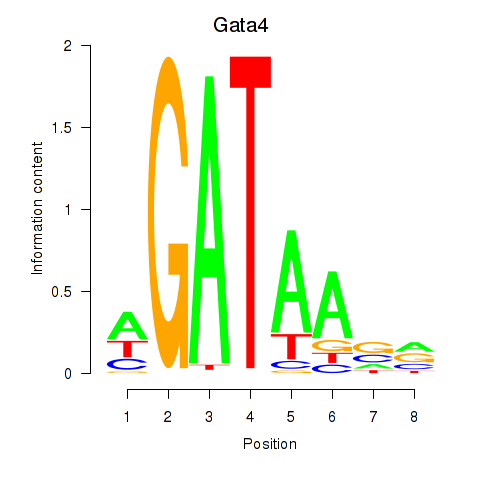
Results for Gata4
Z-value: 1.07
Motif logo
Transcription factors associated with Gata4
| Gene Symbol | Gene ID | Gene Info |
|---|---|---|
|
Gata4
|
ENSRNOG00000010708 | GATA binding protein 4 |
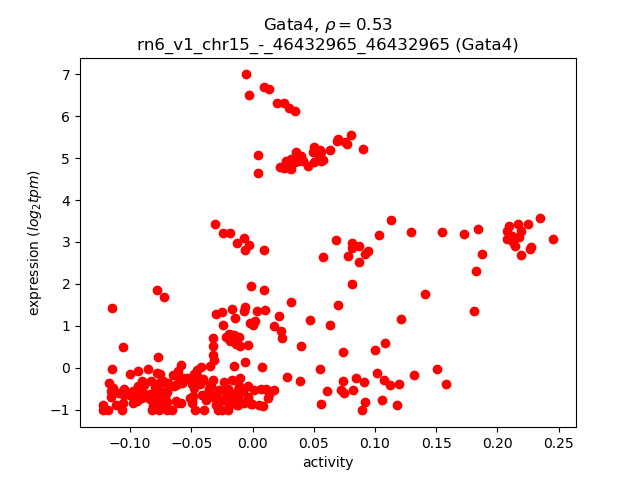
Activity-expression correlation:
| Gene | Promoter | Pearson corr. coef. | P-value | Plot |
|---|---|---|---|---|
| Gata4 | rn6_v1_chr15_-_46432965_46432965 | 0.53 | 3.4e-24 | Click! |
Activity profile of Gata4 motif
Sorted Z-values of Gata4 motif
| Promoter | Log-likelihood | Transcript | Gene | Gene Info |
|---|---|---|---|---|
| chr1_+_279798187 | 82.40 |
ENSRNOT00000024065
|
Pnlip
|
pancreatic lipase |
| chrX_-_13601069 | 62.15 |
ENSRNOT00000004686
|
Otc
|
ornithine carbamoyltransferase |
| chr8_+_50525091 | 61.50 |
ENSRNOT00000074357
|
Apoa1
|
apolipoprotein A1 |
| chr4_+_70689737 | 58.95 |
ENSRNOT00000018852
|
Prss2
|
protease, serine, 2 |
| chr5_-_155772040 | 58.46 |
ENSRNOT00000036788
|
Cela3b
|
chymotrypsin-like elastase family, member 3B |
| chr4_+_57952982 | 57.82 |
ENSRNOT00000014465
|
Cpa1
|
carboxypeptidase A1 |
| chr1_-_85220237 | 56.75 |
ENSRNOT00000026907
|
Sycn
|
syncollin |
| chr12_-_46889082 | 53.07 |
ENSRNOT00000001525
|
Pla2g1b
|
phospholipase A2 group IB |
| chr6_-_47890033 | 50.07 |
ENSRNOT00000011290
|
Colec11
|
collectin sub-family member 11 |
| chr16_+_10267482 | 49.16 |
ENSRNOT00000085255
|
Gdf2
|
growth differentiation factor 2 |
| chr4_+_70614524 | 48.55 |
ENSRNOT00000041100
|
Prss3
|
protease, serine 3 |
| chr4_-_70747226 | 44.74 |
ENSRNOT00000044960
|
LOC102554637
|
anionic trypsin-2-like |
| chr17_+_8489266 | 44.06 |
ENSRNOT00000016252
|
Lect2
|
leukocyte cell-derived chemotaxin 2 |
| chr4_+_163162211 | 42.51 |
ENSRNOT00000082537
|
Clec1b
|
C-type lectin domain family 1, member B |
| chr7_+_11490852 | 42.11 |
ENSRNOT00000044484
|
Creb3l3
|
cAMP responsive element binding protein 3-like 3 |
| chr4_+_119225040 | 39.37 |
ENSRNOT00000012365
|
Bmp10
|
bone morphogenetic protein 10 |
| chr6_-_26385761 | 38.03 |
ENSRNOT00000073228
|
Gckr
|
glucokinase regulator |
| chr2_+_147496229 | 37.90 |
ENSRNOT00000022105
|
Tm4sf4
|
transmembrane 4 L six family member 4 |
| chr1_-_258877045 | 32.46 |
ENSRNOT00000071633
|
Cyp2c13
|
cytochrome P450, family 2, subfamily c, polypeptide 13 |
| chr5_+_151776004 | 30.54 |
ENSRNOT00000009683
|
Nr0b2
|
nuclear receptor subfamily 0, group B, member 2 |
| chr3_+_159936856 | 29.37 |
ENSRNOT00000078703
|
Hnf4a
|
hepatocyte nuclear factor 4, alpha |
| chr13_-_53870428 | 24.95 |
ENSRNOT00000000812
|
Nr5a2
|
nuclear receptor subfamily 5, group A, member 2 |
| chr11_+_80736576 | 23.77 |
ENSRNOT00000047678
|
Masp1
|
mannan-binding lectin serine peptidase 1 |
| chr6_-_7961207 | 23.57 |
ENSRNOT00000007174
|
Abcg5
|
ATP binding cassette subfamily G member 5 |
| chr10_-_90415070 | 22.75 |
ENSRNOT00000055179
|
Itga2b
|
integrin subunit alpha 2b |
| chr9_+_95256627 | 21.30 |
ENSRNOT00000025291
|
Ugt1a5
|
UDP glucuronosyltransferase family 1 member A5 |
| chr16_-_49820235 | 21.13 |
ENSRNOT00000029628
|
Sorbs2
|
sorbin and SH3 domain containing 2 |
| chr20_-_5076539 | 20.06 |
ENSRNOT00000076253
ENSRNOT00000037613 |
Ly6g6f
|
lymphocyte antigen 6 complex, locus G6F |
| chr1_+_72882806 | 19.49 |
ENSRNOT00000024640
|
Tnni3
|
troponin I3, cardiac type |
| chr1_-_275906686 | 15.34 |
ENSRNOT00000092170
|
Gpam
|
glycerol-3-phosphate acyltransferase, mitochondrial |
| chr7_+_60099120 | 14.92 |
ENSRNOT00000007338
|
LOC100911101
|
leucine-rich repeat-containing protein 10-like |
| chr11_-_44049648 | 12.97 |
ENSRNOT00000002257
|
Cpox
|
coproporphyrinogen oxidase |
| chr6_+_7961413 | 12.37 |
ENSRNOT00000007638
ENSRNOT00000061871 |
Abcg8
|
ATP binding cassette subfamily G member 8 |
| chr2_+_227080924 | 11.76 |
ENSRNOT00000029871
|
Fabp2
|
fatty acid binding protein 2 |
| chr8_+_22047697 | 11.64 |
ENSRNOT00000067741
|
Icam4
|
intercellular adhesion molecule 4, Landsteiner-Wiener blood group |
| chr20_-_2191640 | 11.22 |
ENSRNOT00000001016
|
Trim10
|
tripartite motif-containing 10 |
| chr3_+_79940561 | 10.85 |
ENSRNOT00000016652
|
Mybpc3
|
myosin binding protein C, cardiac |
| chr11_-_60679555 | 10.04 |
ENSRNOT00000059735
|
Ccdc80
|
coiled-coil domain containing 80 |
| chr5_+_133864798 | 9.85 |
ENSRNOT00000091977
|
Tal1
|
TAL bHLH transcription factor 1, erythroid differentiation factor |
| chr8_-_48672732 | 9.19 |
ENSRNOT00000079275
|
Hmbs
|
hydroxymethylbilane synthase |
| chr15_+_33632416 | 8.67 |
ENSRNOT00000068212
|
AC130940.1
|
|
| chr3_+_79918969 | 8.31 |
ENSRNOT00000016306
|
Spi1
|
Spi-1 proto-oncogene |
| chr2_-_60657712 | 8.29 |
ENSRNOT00000040348
|
Rai14
|
retinoic acid induced 14 |
| chr20_-_5056474 | 7.60 |
ENSRNOT00000076375
ENSRNOT00000037191 ENSRNOT00000076863 |
G6b
|
immunoreceptor tyrosine-based inhibitory motif (ITIM) containing platelet receptor |
| chr2_+_241029693 | 7.24 |
ENSRNOT00000033413
|
Slc39a8
|
solute carrier family 39 member 8 |
| chr13_-_89654244 | 6.98 |
ENSRNOT00000004896
|
Ppox
|
protoporphyrinogen oxidase |
| chr10_+_86399827 | 6.87 |
ENSRNOT00000009299
|
Grb7
|
growth factor receptor bound protein 7 |
| chr6_+_50725085 | 6.85 |
ENSRNOT00000009473
|
Slc26a3
|
solute carrier family 26 member 3 |
| chr9_-_82146874 | 6.48 |
ENSRNOT00000024190
|
Fev
|
FEV, ETS transcription factor |
| chr3_-_78790691 | 5.86 |
ENSRNOT00000008750
|
Olr724
|
olfactory receptor 724 |
| chr1_+_169951913 | 5.79 |
ENSRNOT00000040861
|
Olr189
|
olfactory receptor 189 |
| chr1_-_226732736 | 5.73 |
ENSRNOT00000072343
|
LOC108348129
|
pepsin F-like |
| chr5_+_169898302 | 5.23 |
ENSRNOT00000087911
|
AABR07050561.1
|
|
| chr10_-_34242985 | 4.60 |
ENSRNOT00000046438
|
RGD1559575
|
similar to novel protein |
| chr7_-_143408276 | 4.13 |
ENSRNOT00000013122
ENSRNOT00000091540 |
Krt73
|
keratin 73 |
| chrX_+_83678339 | 4.03 |
ENSRNOT00000005997
|
Apool
|
apolipoprotein O-like |
| chr3_+_55910177 | 4.01 |
ENSRNOT00000009969
|
Klhl41
|
kelch-like family member 41 |
| chr16_+_50022998 | 3.84 |
ENSRNOT00000087986
|
Tlr3
|
toll-like receptor 3 |
| chr3_-_112985318 | 3.83 |
ENSRNOT00000015556
|
Epb42
|
erythrocyte membrane protein band 4.2 |
| chr8_+_40383918 | 3.67 |
ENSRNOT00000071422
|
Olr1201
|
olfactory receptor 1201 |
| chr10_+_70262361 | 3.58 |
ENSRNOT00000064625
ENSRNOT00000076973 |
Unc45b
|
unc-45 myosin chaperone B |
| chr11_-_35749464 | 3.42 |
ENSRNOT00000078818
ENSRNOT00000078425 |
Erg
|
ERG, ETS transcription factor |
| chr4_+_158088505 | 2.53 |
ENSRNOT00000026643
|
Vwf
|
von Willebrand factor |
| chr5_+_57239086 | 2.48 |
ENSRNOT00000060714
|
Spink4
|
serine peptidase inhibitor, Kazal type 4 |
| chr3_+_73335149 | 2.42 |
ENSRNOT00000042537
|
Olr470
|
olfactory receptor 470 |
| chr10_+_103874383 | 2.27 |
ENSRNOT00000038935
|
Otop2
|
otopetrin 2 |
| chr17_-_21705773 | 1.95 |
ENSRNOT00000078010
|
Gcnt2
|
glucosaminyl (N-acetyl) transferase 2, I-branching enzyme |
| chr8_-_22974321 | 1.57 |
ENSRNOT00000017369
|
Epor
|
erythropoietin receptor |
| chr16_+_2634603 | 1.49 |
ENSRNOT00000019113
|
Hesx1
|
HESX homeobox 1 |
| chr8_-_33661049 | 1.31 |
ENSRNOT00000068037
|
Fli1
|
Fli-1 proto-oncogene, ETS transcription factor |
| chr4_+_102290338 | 1.24 |
ENSRNOT00000011067
|
AABR07060992.1
|
|
| chr15_-_52399074 | 1.11 |
ENSRNOT00000018440
|
Xpo7
|
exportin 7 |
| chr5_+_50381244 | 1.10 |
ENSRNOT00000012385
|
Cga
|
glycoprotein hormones, alpha polypeptide |
| chr15_+_67555835 | 1.03 |
ENSRNOT00000045882
|
Pcdh17
|
protocadherin 17 |
| chr17_+_45670284 | 0.59 |
ENSRNOT00000086536
|
Olr1660
|
olfactory receptor 1660 |
| chr11_+_31806618 | 0.52 |
ENSRNOT00000043410
ENSRNOT00000002769 |
Son
|
Son DNA binding protein |
| chr4_-_163261958 | 0.35 |
ENSRNOT00000086390
|
Olr1
|
oxidized low density lipoprotein (lectin-like) receptor 1 |
| chr10_-_56831243 | 0.23 |
ENSRNOT00000025403
|
Slc16a13
|
solute carrier family 16, member 13 |
| chr7_-_3752134 | 0.03 |
ENSRNOT00000067319
|
Olr880
|
olfactory receptor 880 |
| chr2_+_204427608 | 0.02 |
ENSRNOT00000083374
|
Nhlh2
|
nescient helix loop helix 2 |
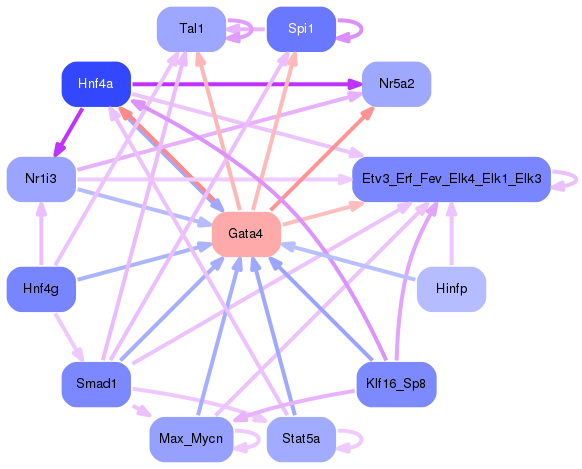
Network of associatons between targets according to the STRING database.

First level regulatory network of Gata4
Gene Ontology Analysis
Gene overrepresentation in biological process category:
| Log-likelihood per target | Total log-likelihood | Term | Description |
|---|---|---|---|
| 20.5 | 61.5 | GO:0010903 | negative regulation of very-low-density lipoprotein particle remodeling(GO:0010903) |
| 17.7 | 53.1 | GO:0044240 | multicellular organism lipid catabolic process(GO:0044240) |
| 12.4 | 62.2 | GO:0006526 | arginine biosynthetic process(GO:0006526) |
| 9.2 | 82.4 | GO:0061365 | positive regulation of triglyceride lipase activity(GO:0061365) |
| 9.0 | 35.9 | GO:0030300 | regulation of intestinal cholesterol absorption(GO:0030300) |
| 7.6 | 38.0 | GO:0034287 | detection of carbohydrate stimulus(GO:0009730) detection of hexose stimulus(GO:0009732) negative regulation of glucokinase activity(GO:0033132) detection of monosaccharide stimulus(GO:0034287) detection of glucose(GO:0051594) negative regulation of hexokinase activity(GO:1903300) |
| 7.3 | 29.4 | GO:0010534 | regulation of activation of JAK2 kinase activity(GO:0010534) activation of JAK2 kinase activity(GO:0042977) negative regulation of activation of JAK2 kinase activity(GO:1902569) |
| 6.2 | 31.2 | GO:0060298 | positive regulation of sarcomere organization(GO:0060298) |
| 6.2 | 25.0 | GO:0061113 | pancreas morphogenesis(GO:0061113) |
| 3.3 | 9.9 | GO:0045799 | positive regulation of chromatin assembly or disassembly(GO:0045799) |
| 2.8 | 42.1 | GO:1990440 | positive regulation of transcription from RNA polymerase II promoter in response to endoplasmic reticulum stress(GO:1990440) |
| 2.5 | 49.2 | GO:0045603 | positive regulation of endothelial cell differentiation(GO:0045603) |
| 2.5 | 58.9 | GO:0030574 | collagen catabolic process(GO:0030574) |
| 2.4 | 21.3 | GO:0052697 | xenobiotic glucuronidation(GO:0052697) |
| 2.1 | 8.3 | GO:0045347 | negative regulation of MHC class II biosynthetic process(GO:0045347) |
| 2.0 | 22.2 | GO:0006782 | protoporphyrinogen IX biosynthetic process(GO:0006782) |
| 2.0 | 23.8 | GO:2000258 | negative regulation of complement activation(GO:0045916) negative regulation of protein activation cascade(GO:2000258) |
| 1.8 | 42.5 | GO:0030220 | platelet formation(GO:0030220) |
| 1.7 | 7.0 | GO:0046501 | protoporphyrinogen IX metabolic process(GO:0046501) |
| 1.7 | 15.3 | GO:0016024 | CDP-diacylglycerol biosynthetic process(GO:0016024) |
| 1.2 | 19.5 | GO:0032780 | negative regulation of ATPase activity(GO:0032780) |
| 1.2 | 32.5 | GO:0019373 | epoxygenase P450 pathway(GO:0019373) |
| 1.1 | 10.8 | GO:0071688 | striated muscle myosin thick filament assembly(GO:0071688) |
| 1.0 | 7.2 | GO:0070574 | cadmium ion transport(GO:0015691) cadmium ion transmembrane transport(GO:0070574) |
| 1.0 | 3.8 | GO:0045356 | microglial cell activation involved in immune response(GO:0002282) positive regulation of interferon-alpha biosynthetic process(GO:0045356) |
| 0.6 | 4.0 | GO:2000291 | regulation of myoblast proliferation(GO:2000291) |
| 0.6 | 3.4 | GO:0003199 | endocardial cushion to mesenchymal transition involved in heart valve formation(GO:0003199) positive regulation of blood vessel remodeling(GO:2000504) |
| 0.5 | 6.9 | GO:0034063 | stress granule assembly(GO:0034063) |
| 0.5 | 58.5 | GO:0008203 | cholesterol metabolic process(GO:0008203) |
| 0.5 | 11.2 | GO:0046597 | negative regulation of viral entry into host cell(GO:0046597) |
| 0.4 | 2.5 | GO:0070417 | cellular response to cold(GO:0070417) |
| 0.4 | 54.4 | GO:0017158 | regulation of calcium ion-dependent exocytosis(GO:0017158) |
| 0.4 | 37.9 | GO:0042246 | tissue regeneration(GO:0042246) |
| 0.4 | 1.6 | GO:1904373 | response to kainic acid(GO:1904373) |
| 0.4 | 3.8 | GO:0020027 | hemoglobin metabolic process(GO:0020027) |
| 0.4 | 30.5 | GO:0032024 | positive regulation of insulin secretion(GO:0032024) |
| 0.4 | 22.3 | GO:0070527 | platelet aggregation(GO:0070527) |
| 0.4 | 48.5 | GO:0031638 | zymogen activation(GO:0031638) |
| 0.4 | 11.3 | GO:0061049 | physiological muscle hypertrophy(GO:0003298) physiological cardiac muscle hypertrophy(GO:0003301) cell growth involved in cardiac muscle cell development(GO:0061049) |
| 0.4 | 6.8 | GO:0060081 | membrane hyperpolarization(GO:0060081) |
| 0.3 | 1.5 | GO:0030916 | otic vesicle formation(GO:0030916) |
| 0.3 | 7.7 | GO:0050892 | intestinal absorption(GO:0050892) |
| 0.3 | 4.0 | GO:0042407 | cristae formation(GO:0042407) |
| 0.2 | 6.5 | GO:0048665 | neuron fate specification(GO:0048665) |
| 0.2 | 1.0 | GO:2000807 | regulation of synaptic vesicle clustering(GO:2000807) |
| 0.2 | 4.6 | GO:0035458 | cellular response to interferon-beta(GO:0035458) |
| 0.1 | 1.3 | GO:0035855 | megakaryocyte development(GO:0035855) |
| 0.1 | 18.8 | GO:0030178 | negative regulation of Wnt signaling pathway(GO:0030178) |
| 0.1 | 1.1 | GO:0046884 | follicle-stimulating hormone secretion(GO:0046884) |
| 0.1 | 10.0 | GO:0010811 | positive regulation of cell-substrate adhesion(GO:0010811) |
| 0.1 | 48.6 | GO:0051603 | proteolysis involved in cellular protein catabolic process(GO:0051603) |
| 0.1 | 3.6 | GO:0061077 | chaperone-mediated protein folding(GO:0061077) |
| 0.0 | 5.7 | GO:0030163 | protein catabolic process(GO:0030163) |
| 0.0 | 1.1 | GO:0006611 | protein export from nucleus(GO:0006611) |
| 0.0 | 15.8 | GO:0050911 | detection of chemical stimulus involved in sensory perception of smell(GO:0050911) |
| 0.0 | 0.5 | GO:0000281 | mitotic cytokinesis(GO:0000281) |
Gene overrepresentation in cellular component category:
| Log-likelihood per target | Total log-likelihood | Term | Description |
|---|---|---|---|
| 12.3 | 61.5 | GO:0034365 | discoidal high-density lipoprotein particle(GO:0034365) |
| 12.0 | 35.9 | GO:0043190 | ATP-binding cassette (ABC) transporter complex(GO:0043190) |
| 4.9 | 19.5 | GO:1990584 | cardiac Troponin complex(GO:1990584) |
| 1.8 | 10.8 | GO:0097512 | cardiac myofibril(GO:0097512) |
| 1.2 | 11.8 | GO:0045179 | apical cortex(GO:0045179) |
| 0.6 | 22.7 | GO:0008305 | integrin complex(GO:0008305) |
| 0.6 | 56.7 | GO:0030667 | secretory granule membrane(GO:0030667) |
| 0.6 | 4.0 | GO:0061617 | MICOS complex(GO:0061617) |
| 0.5 | 10.0 | GO:0005614 | interstitial matrix(GO:0005614) |
| 0.5 | 37.5 | GO:0005581 | collagen trimer(GO:0005581) |
| 0.4 | 4.0 | GO:0031143 | pseudopodium(GO:0031143) |
| 0.3 | 7.0 | GO:0031304 | intrinsic component of mitochondrial inner membrane(GO:0031304) integral component of mitochondrial inner membrane(GO:0031305) |
| 0.3 | 6.8 | GO:0097225 | sperm midpiece(GO:0097225) |
| 0.3 | 426.9 | GO:0005615 | extracellular space(GO:0005615) |
| 0.2 | 13.0 | GO:0005758 | mitochondrial intermembrane space(GO:0005758) |
| 0.2 | 62.2 | GO:0005759 | mitochondrial matrix(GO:0005759) |
| 0.2 | 25.0 | GO:0090575 | RNA polymerase II transcription factor complex(GO:0090575) |
| 0.1 | 6.9 | GO:0010494 | cytoplasmic stress granule(GO:0010494) |
| 0.1 | 9.9 | GO:0000118 | histone deacetylase complex(GO:0000118) |
| 0.1 | 22.6 | GO:0005667 | transcription factor complex(GO:0005667) |
| 0.1 | 62.3 | GO:0005789 | endoplasmic reticulum membrane(GO:0005789) |
| 0.1 | 4.1 | GO:0045095 | keratin filament(GO:0045095) |
| 0.1 | 8.3 | GO:0001650 | fibrillar center(GO:0001650) |
| 0.1 | 21.1 | GO:0005925 | focal adhesion(GO:0005925) |
| 0.0 | 9.2 | GO:0000793 | condensed chromosome(GO:0000793) |
| 0.0 | 1.1 | GO:0005643 | nuclear pore(GO:0005643) |
| 0.0 | 3.8 | GO:0005765 | lysosomal membrane(GO:0005765) lytic vacuole membrane(GO:0098852) |
Gene overrepresentation in molecular function category:
| Log-likelihood per target | Total log-likelihood | Term | Description |
|---|---|---|---|
| 20.5 | 61.5 | GO:0070653 | high-density lipoprotein particle receptor binding(GO:0070653) |
| 5.9 | 53.1 | GO:0047498 | calcium-dependent phospholipase A2 activity(GO:0047498) |
| 5.6 | 39.4 | GO:0031433 | telethonin binding(GO:0031433) |
| 5.4 | 38.0 | GO:0070095 | fructose-6-phosphate binding(GO:0070095) |
| 4.9 | 19.5 | GO:0030172 | troponin C binding(GO:0030172) |
| 4.4 | 61.7 | GO:0042301 | phosphate ion binding(GO:0042301) |
| 4.1 | 82.4 | GO:0004806 | triglyceride lipase activity(GO:0004806) |
| 3.8 | 22.7 | GO:0070051 | fibrinogen binding(GO:0070051) |
| 3.1 | 9.2 | GO:0004852 | uroporphyrinogen-III synthase activity(GO:0004852) |
| 2.8 | 19.9 | GO:0016634 | oxidoreductase activity, acting on the CH-CH group of donors, oxygen as acceptor(GO:0016634) |
| 2.6 | 42.1 | GO:0035497 | cAMP response element binding(GO:0035497) |
| 2.6 | 15.3 | GO:0004366 | glycerol-3-phosphate O-acyltransferase activity(GO:0004366) |
| 2.4 | 29.4 | GO:0016290 | palmitoyl-CoA hydrolase activity(GO:0016290) |
| 2.0 | 11.8 | GO:0005324 | long-chain fatty acid transporter activity(GO:0005324) |
| 1.7 | 35.9 | GO:0017127 | cholesterol transporter activity(GO:0017127) |
| 1.7 | 45.9 | GO:0004181 | metallocarboxypeptidase activity(GO:0004181) |
| 1.2 | 30.5 | GO:0042975 | peroxisome proliferator activated receptor binding(GO:0042975) |
| 1.1 | 32.5 | GO:0008392 | arachidonic acid epoxygenase activity(GO:0008392) |
| 1.0 | 8.3 | GO:0051525 | NFAT protein binding(GO:0051525) |
| 1.0 | 10.8 | GO:0032036 | myosin heavy chain binding(GO:0032036) |
| 0.9 | 49.2 | GO:0005160 | transforming growth factor beta receptor binding(GO:0005160) |
| 0.8 | 189.7 | GO:0004252 | serine-type endopeptidase activity(GO:0004252) |
| 0.7 | 21.3 | GO:0015020 | glucuronosyltransferase activity(GO:0015020) |
| 0.4 | 36.1 | GO:0000980 | RNA polymerase II distal enhancer sequence-specific DNA binding(GO:0000980) |
| 0.4 | 10.0 | GO:0001968 | fibronectin binding(GO:0001968) |
| 0.4 | 3.8 | GO:0003810 | protein-glutamine gamma-glutamyltransferase activity(GO:0003810) |
| 0.2 | 5.7 | GO:0004190 | aspartic-type endopeptidase activity(GO:0004190) |
| 0.1 | 1.1 | GO:0005049 | nuclear export signal receptor activity(GO:0005049) |
| 0.1 | 42.9 | GO:0030246 | carbohydrate binding(GO:0030246) |
| 0.1 | 14.2 | GO:0005178 | integrin binding(GO:0005178) |
| 0.1 | 0.5 | GO:0050733 | RS domain binding(GO:0050733) |
| 0.1 | 1.5 | GO:0019531 | oxalate transmembrane transporter activity(GO:0019531) |
| 0.1 | 3.6 | GO:0051879 | Hsp90 protein binding(GO:0051879) |
| 0.0 | 3.8 | GO:0003725 | double-stranded RNA binding(GO:0003725) |
| 0.0 | 6.9 | GO:0035091 | phosphatidylinositol binding(GO:0035091) |
| 0.0 | 15.8 | GO:0004984 | olfactory receptor activity(GO:0004984) |
| 0.0 | 1.5 | GO:0001078 | transcriptional repressor activity, RNA polymerase II core promoter proximal region sequence-specific binding(GO:0001078) |
Gene overrepresentation in curated gene sets: canonical pathways category:
| Log-likelihood per target | Total log-likelihood | Term | Description |
|---|---|---|---|
| 1.8 | 30.5 | PID ERB GENOMIC PATHWAY | Validated nuclear estrogen receptor beta network |
| 1.7 | 90.9 | PID HNF3B PATHWAY | FOXA2 and FOXA3 transcription factor networks |
| 1.4 | 49.2 | PID ALK1 PATHWAY | ALK1 signaling events |
| 0.8 | 189.7 | NABA ECM REGULATORS | Genes encoding enzymes and their regulators involved in the remodeling of the extracellular matrix |
| 0.8 | 22.7 | PID INTEGRIN CS PATHWAY | Integrin family cell surface interactions |
| 0.6 | 43.7 | PID FCER1 PATHWAY | Fc-epsilon receptor I signaling in mast cells |
| 0.6 | 92.6 | NABA ECM AFFILIATED | Genes encoding proteins affiliated structurally or functionally to extracellular matrix proteins |
| 0.6 | 52.4 | PID CMYB PATHWAY | C-MYB transcription factor network |
| 0.5 | 11.2 | PID INTEGRIN2 PATHWAY | Beta2 integrin cell surface interactions |
| 0.2 | 6.9 | PID RET PATHWAY | Signaling events regulated by Ret tyrosine kinase |
| 0.2 | 3.8 | PID TOLL ENDOGENOUS PATHWAY | Endogenous TLR signaling |
| 0.2 | 15.3 | PID MYC ACTIV PATHWAY | Validated targets of C-MYC transcriptional activation |
| 0.0 | 1.1 | PID EPO PATHWAY | EPO signaling pathway |
| 0.0 | 7.9 | NABA MATRISOME ASSOCIATED | Ensemble of genes encoding ECM-associated proteins including ECM-affilaited proteins, ECM regulators and secreted factors |
| 0.0 | 1.1 | PID REG GR PATHWAY | Glucocorticoid receptor regulatory network |
| 0.0 | 2.5 | NABA ECM GLYCOPROTEINS | Genes encoding structural ECM glycoproteins |
Gene overrepresentation in curated gene sets: REACTOME pathways category:
| Log-likelihood per target | Total log-likelihood | Term | Description |
|---|---|---|---|
| 6.5 | 58.9 | REACTOME DEFENSINS | Genes involved in Defensins |
| 5.1 | 97.4 | REACTOME ABCA TRANSPORTERS IN LIPID HOMEOSTASIS | Genes involved in ABCA transporters in lipid homeostasis |
| 3.3 | 53.1 | REACTOME ACYL CHAIN REMODELLING OF PS | Genes involved in Acyl chain remodelling of PS |
| 2.2 | 23.8 | REACTOME CREATION OF C4 AND C2 ACTIVATORS | Genes involved in Creation of C4 and C2 activators |
| 2.0 | 83.5 | REACTOME METABOLISM OF STEROID HORMONES AND VITAMINS A AND D | Genes involved in Metabolism of steroid hormones and vitamins A and D |
| 1.7 | 29.1 | REACTOME METABOLISM OF PORPHYRINS | Genes involved in Metabolism of porphyrins |
| 1.4 | 25.3 | REACTOME P130CAS LINKAGE TO MAPK SIGNALING FOR INTEGRINS | Genes involved in p130Cas linkage to MAPK signaling for integrins |
| 1.4 | 54.3 | REACTOME REGULATION OF BETA CELL DEVELOPMENT | Genes involved in Regulation of beta-cell development |
| 1.4 | 38.0 | REACTOME REGULATION OF GLUCOKINASE BY GLUCOKINASE REGULATORY PROTEIN | Genes involved in Regulation of Glucokinase by Glucokinase Regulatory Protein |
| 1.1 | 21.3 | REACTOME GLUCURONIDATION | Genes involved in Glucuronidation |
| 0.8 | 15.3 | REACTOME SYNTHESIS OF PA | Genes involved in Synthesis of PA |
| 0.4 | 30.5 | REACTOME NUCLEAR RECEPTOR TRANSCRIPTION PATHWAY | Genes involved in Nuclear Receptor transcription pathway |
| 0.4 | 3.8 | REACTOME IKK COMPLEX RECRUITMENT MEDIATED BY RIP1 | Genes involved in IKK complex recruitment mediated by RIP1 |
| 0.3 | 6.9 | REACTOME TIE2 SIGNALING | Genes involved in Tie2 Signaling |
| 0.3 | 62.2 | REACTOME METABOLISM OF AMINO ACIDS AND DERIVATIVES | Genes involved in Metabolism of amino acids and derivatives |
| 0.3 | 11.1 | REACTOME STRIATED MUSCLE CONTRACTION | Genes involved in Striated Muscle Contraction |
| 0.2 | 11.6 | REACTOME IMMUNOREGULATORY INTERACTIONS BETWEEN A LYMPHOID AND A NON LYMPHOID CELL | Genes involved in Immunoregulatory interactions between a Lymphoid and a non-Lymphoid cell |