Project
GSE53960: rat RNA-Seq transcriptomic Bodymap
Navigation
Downloads
Results for Gata3
Z-value: 2.17
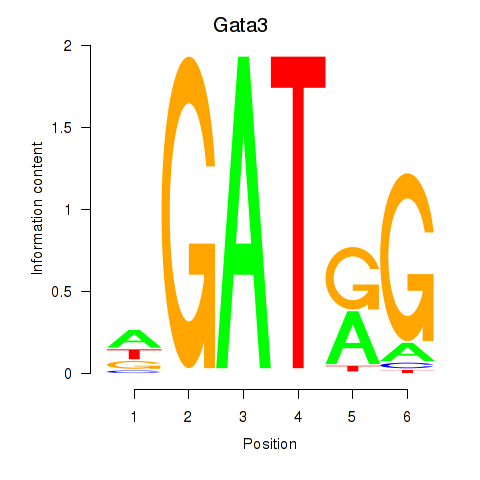
Motif logo
Transcription factors associated with Gata3
| Gene Symbol | Gene ID | Gene Info |
|---|---|---|
|
Gata3
|
ENSRNOG00000019336 | GATA binding protein 3 |
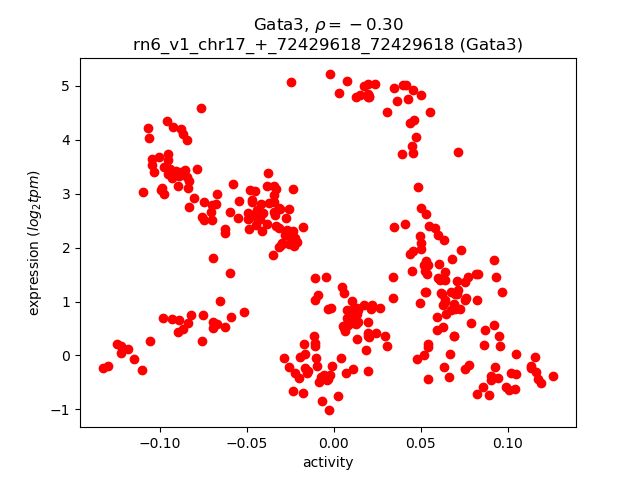
Activity-expression correlation:
| Gene | Promoter | Pearson corr. coef. | P-value | Plot |
|---|---|---|---|---|
| Gata3 | rn6_v1_chr17_+_72429618_72429618 | -0.30 | 2.7e-08 | Click! |
Activity profile of Gata3 motif
Sorted Z-values of Gata3 motif
| Promoter | Log-likelihood | Transcript | Gene | Gene Info |
|---|---|---|---|---|
| chr1_+_72889270 | 38.16 |
ENSRNOT00000058843
ENSRNOT00000034957 |
Tnnt1
|
troponin T1, slow skeletal type |
| chrX_-_64715823 | 37.38 |
ENSRNOT00000076297
|
Asb12
|
ankyrin repeat and SOCS box-containing 12 |
| chr14_-_86047162 | 35.33 |
ENSRNOT00000018227
|
Pgam2
|
phosphoglycerate mutase 2 |
| chr4_-_132111079 | 33.86 |
ENSRNOT00000013719
|
Eif4e3
|
eukaryotic translation initiation factor 4E family member 3 |
| chr9_-_73948583 | 33.52 |
ENSRNOT00000018097
|
Myl1
|
myosin, light chain 1 |
| chrX_+_71342775 | 33.35 |
ENSRNOT00000004888
|
Itgb1bp2
|
integrin subunit beta 1 binding protein 2 |
| chr10_+_45289741 | 33.34 |
ENSRNOT00000066190
|
Hist3h2ba
|
histone cluster 3, H2ba |
| chr2_+_104416972 | 33.16 |
ENSRNOT00000017125
|
Trim55
|
tripartite motif-containing 55 |
| chr1_+_193537137 | 33.09 |
ENSRNOT00000029967
|
AABR07005667.1
|
|
| chr16_+_25773602 | 32.08 |
ENSRNOT00000047750
|
Gapdh-ps2
|
glyceraldehyde-3-phosphate dehydrogenase, pseudogene 2 |
| chr1_-_197858016 | 31.04 |
ENSRNOT00000074778
|
Atp2a1
|
ATPase sarcoplasmic/endoplasmic reticulum Ca2+ transporting 1 |
| chr5_+_115649046 | 30.95 |
ENSRNOT00000041328
|
LOC108351137
|
glyceraldehyde-3-phosphate dehydrogenase |
| chr10_-_8498422 | 30.30 |
ENSRNOT00000082332
|
Rbfox1
|
RNA binding protein, fox-1 homolog 1 |
| chr8_+_45561390 | 30.09 |
ENSRNOT00000047820
|
AABR07070043.1
|
|
| chr4_-_129619142 | 28.10 |
ENSRNOT00000047453
|
Lmod3
|
leiomodin 3 |
| chr6_+_113898420 | 28.10 |
ENSRNOT00000064872
|
Nrxn3
|
neurexin 3 |
| chr10_-_45297385 | 27.95 |
ENSRNOT00000041187
|
Hist3h2bb
|
histone cluster 3 H2B family member b |
| chr10_-_109729019 | 27.92 |
ENSRNOT00000054959
|
Ppp1r27
|
protein phosphatase 1, regulatory subunit 27 |
| chr17_-_18592750 | 27.72 |
ENSRNOT00000065742
|
Cap2
|
CAP, adenylate cyclase-associated protein, 2 (yeast) |
| chr8_-_80631873 | 27.68 |
ENSRNOT00000091661
ENSRNOT00000080662 |
Unc13c
|
unc-13 homolog C |
| chr11_+_60073383 | 26.99 |
ENSRNOT00000087508
|
Tagln3
|
transgelin 3 |
| chr12_+_46257343 | 26.50 |
ENSRNOT00000083569
|
Tmem233
|
transmembrane protein 233 |
| chr3_-_52510507 | 26.50 |
ENSRNOT00000091259
|
Scn1a
|
sodium voltage-gated channel alpha subunit 1 |
| chr10_-_90999506 | 26.09 |
ENSRNOT00000034401
|
Gfap
|
glial fibrillary acidic protein |
| chr3_-_63568464 | 25.81 |
ENSRNOT00000068494
|
AABR07052585.2
|
|
| chr4_-_89151184 | 24.71 |
ENSRNOT00000010263
|
Nap1l5
|
nucleosome assembly protein 1-like 5 |
| chr6_+_23337571 | 24.71 |
ENSRNOT00000011832
|
RGD1304963
|
similar to hypothetical protein MGC38716 |
| chr6_-_26624092 | 24.63 |
ENSRNOT00000008113
|
Trim54
|
tripartite motif-containing 54 |
| chr5_-_155258392 | 23.57 |
ENSRNOT00000017065
|
C1qc
|
complement C1q C chain |
| chr10_+_53778662 | 23.33 |
ENSRNOT00000045718
|
Myh2
|
myosin heavy chain 2 |
| chr14_-_112946204 | 23.25 |
ENSRNOT00000056813
|
LOC103690141
|
coiled-coil domain-containing protein 85A-like |
| chr14_+_108826831 | 22.90 |
ENSRNOT00000083146
ENSRNOT00000009421 |
Bcl11a
|
B-cell CLL/lymphoma 11A |
| chr6_+_112203679 | 22.71 |
ENSRNOT00000031205
|
Nrxn3
|
neurexin 3 |
| chr18_+_83777665 | 22.28 |
ENSRNOT00000018682
|
Cbln2
|
cerebellin 2 precursor |
| chr7_-_119896925 | 22.09 |
ENSRNOT00000010609
|
Elfn2
|
extracellular leucine-rich repeat and fibronectin type III domain containing 2 |
| chr3_+_16413080 | 21.79 |
ENSRNOT00000040386
|
LOC100912707
|
Ig kappa chain V19-17-like |
| chr18_-_63825408 | 21.45 |
ENSRNOT00000043709
|
RGD1562758
|
similar to glyceraldehyde-3-phosphate dehydrogenase |
| chr9_+_37727942 | 21.24 |
ENSRNOT00000016511
ENSRNOT00000074276 |
LOC100912306
|
myotilin-like |
| chr2_+_252771017 | 21.21 |
ENSRNOT00000075452
ENSRNOT00000055318 |
Ttll7
|
tubulin tyrosine ligase like 7 |
| chr4_+_106323089 | 21.20 |
ENSRNOT00000091402
|
AABR07061134.1
|
|
| chr4_+_102147211 | 21.04 |
ENSRNOT00000083239
|
AABR07060980.1
|
|
| chrX_+_70563570 | 21.04 |
ENSRNOT00000003772
|
Gdpd2
|
glycerophosphodiester phosphodiesterase domain containing 2 |
| chr17_-_61332391 | 20.94 |
ENSRNOT00000034599
|
LOC100362965
|
SNRPN upstream reading frame protein-like |
| chr13_+_103396314 | 20.50 |
ENSRNOT00000049499
|
Slc30a10
|
solute carrier family 30, member 10 |
| chr3_+_113251778 | 20.37 |
ENSRNOT00000083005
|
Map1a
|
microtubule-associated protein 1A |
| chr15_-_33656089 | 20.35 |
ENSRNOT00000024186
|
Myh7
|
myosin heavy chain 7 |
| chr3_-_94182714 | 19.55 |
ENSRNOT00000015073
|
LOC100362814
|
hypothetical protein LOC100362814 |
| chr13_+_47602692 | 19.51 |
ENSRNOT00000038822
|
Fcmr
|
Fc fragment of IgM receptor |
| chr1_+_165482155 | 19.13 |
ENSRNOT00000024005
|
Ucp3
|
uncoupling protein 3 |
| chr10_-_102289837 | 19.10 |
ENSRNOT00000044922
|
AABR07030729.1
|
|
| chr10_-_27179900 | 19.04 |
ENSRNOT00000082445
|
Gabrg2
|
gamma-aminobutyric acid type A receptor gamma 2 subunit |
| chr6_+_48708368 | 18.97 |
ENSRNOT00000005905
|
Myt1l
|
myelin transcription factor 1-like |
| chr18_-_28438654 | 18.66 |
ENSRNOT00000036301
|
Mzb1
|
marginal zone B and B1 cell-specific protein |
| chr18_-_18079560 | 18.65 |
ENSRNOT00000072093
|
AABR07031533.1
|
|
| chr4_-_85915099 | 18.63 |
ENSRNOT00000016182
|
Neurod6
|
neuronal differentiation 6 |
| chr10_-_90995982 | 18.62 |
ENSRNOT00000093266
|
Gfap
|
glial fibrillary acidic protein |
| chr3_-_158328881 | 18.40 |
ENSRNOT00000044466
|
Ptprt
|
protein tyrosine phosphatase, receptor type, T |
| chr14_+_60764409 | 18.17 |
ENSRNOT00000005168
|
Lgi2
|
leucine-rich repeat LGI family, member 2 |
| chr3_+_20303979 | 18.12 |
ENSRNOT00000058331
|
AABR07051730.1
|
|
| chrX_-_32355296 | 18.08 |
ENSRNOT00000081652
ENSRNOT00000065075 |
Ap1s2
|
adaptor-related protein complex 1, sigma 2 subunit |
| chr11_+_85430400 | 18.07 |
ENSRNOT00000083198
|
AABR07034729.1
|
|
| chr1_-_101360971 | 17.95 |
ENSRNOT00000028164
|
Lin7b
|
lin-7 homolog B, crumbs cell polarity complex component |
| chr17_+_12762752 | 17.69 |
ENSRNOT00000044842
|
Diras2
|
DIRAS family GTPase 2 |
| chr3_-_129357348 | 17.61 |
ENSRNOT00000084829
ENSRNOT00000007410 |
Pak7
|
p21 (RAC1) activated kinase 7 |
| chr5_+_140888973 | 17.50 |
ENSRNOT00000020524
|
Nt5c1a
|
5'-nucleotidase, cytosolic IA |
| chr1_-_167202767 | 17.46 |
ENSRNOT00000055243
|
Art5
|
ADP-ribosyltransferase 5 |
| chrX_-_15707436 | 17.38 |
ENSRNOT00000085907
|
Syp
|
synaptophysin |
| chr2_-_210943620 | 17.36 |
ENSRNOT00000026750
|
Gpr61
|
G protein-coupled receptor 61 |
| chr10_+_19366793 | 17.35 |
ENSRNOT00000050610
|
Fam196b
|
family with sequence similarity 196, member B |
| chr15_+_51756978 | 17.10 |
ENSRNOT00000024067
|
Egr3
|
early growth response 3 |
| chr6_+_76349362 | 17.05 |
ENSRNOT00000043224
|
Aldoart2
|
aldolase 1 A retrogene 2 |
| chr13_+_52625441 | 17.03 |
ENSRNOT00000012095
|
Tnni1
|
troponin I1, slow skeletal type |
| chr3_+_57770948 | 16.95 |
ENSRNOT00000038429
|
AC107446.2
|
|
| chr13_+_52624878 | 16.61 |
ENSRNOT00000076054
ENSRNOT00000076299 |
Tnni1
|
troponin I1, slow skeletal type |
| chr7_-_136853957 | 16.59 |
ENSRNOT00000008985
|
Nell2
|
neural EGFL like 2 |
| chr8_+_100260049 | 16.47 |
ENSRNOT00000011090
|
AABR07071101.1
|
|
| chr10_+_83636518 | 16.45 |
ENSRNOT00000007352
|
Phospho1
|
phosphoethanolamine/phosphocholine phosphatase 1 |
| chr17_+_88215834 | 16.41 |
ENSRNOT00000034098
|
Gpr158
|
G protein-coupled receptor 158 |
| chr17_-_31706523 | 16.30 |
ENSRNOT00000071312
|
AABR07027447.1
|
|
| chr2_+_222792999 | 16.25 |
ENSRNOT00000036228
|
AABR07013086.1
|
|
| chr1_-_89358166 | 16.15 |
ENSRNOT00000044532
|
Mag
|
myelin-associated glycoprotein |
| chr3_+_132052612 | 15.91 |
ENSRNOT00000030148
|
AABR07053879.1
|
|
| chrX_-_64800435 | 15.90 |
ENSRNOT00000005663
|
Asb12
|
ankyrin repeat and SOCS box-containing 12 |
| chr15_-_70399924 | 15.79 |
ENSRNOT00000087940
|
Diaph3
|
diaphanous-related formin 3 |
| chr5_+_154800226 | 15.72 |
ENSRNOT00000016046
|
Htr1d
|
5-hydroxytryptamine receptor 1D |
| chr2_+_36246628 | 15.66 |
ENSRNOT00000013618
|
Htr1a
|
5-hydroxytryptamine receptor 1A |
| chr17_+_15924048 | 15.65 |
ENSRNOT00000050696
|
Wnk2
|
WNK lysine deficient protein kinase 2 |
| chr18_-_60835739 | 15.61 |
ENSRNOT00000039569
|
LOC291543
|
similar to glyceraldehyde-3-phosphate dehydrogenase |
| chr4_-_103646906 | 15.45 |
ENSRNOT00000047620
|
AABR07061078.1
|
|
| chr3_+_155103150 | 15.30 |
ENSRNOT00000020720
|
Slc32a1
|
solute carrier family 32 member 1 |
| chr13_-_82005741 | 15.25 |
ENSRNOT00000076404
|
Mettl11b
|
methyltransferase like 11B |
| chr13_+_99663150 | 15.24 |
ENSRNOT00000036705
|
Cnih3
|
cornichon family AMPA receptor auxiliary protein 3 |
| chr20_-_15334745 | 15.21 |
ENSRNOT00000067633
|
Pcdh15
|
protocadherin 15 |
| chr7_-_143353925 | 15.16 |
ENSRNOT00000068533
|
Krt71
|
keratin 71 |
| chr4_-_103369224 | 15.15 |
ENSRNOT00000075709
|
AABR07061057.1
|
|
| chr15_-_14737704 | 15.10 |
ENSRNOT00000011307
|
Synpr
|
synaptoporin |
| chr3_-_16753987 | 15.08 |
ENSRNOT00000091257
|
AABR07051548.1
|
|
| chr3_+_16495748 | 15.08 |
ENSRNOT00000045492
|
AABR07051533.1
|
|
| chr6_-_128989812 | 14.99 |
ENSRNOT00000085943
|
LOC100909439
|
ankyrin repeat and SOCS box protein 2-like |
| chr3_+_11593655 | 14.86 |
ENSRNOT00000074122
|
Pip5kl1
|
phosphatidylinositol-4-phosphate 5-kinase-like 1 |
| chr1_-_5165859 | 14.85 |
ENSRNOT00000044325
ENSRNOT00000019319 |
Grm1
|
glutamate metabotropic receptor 1 |
| chr1_-_227441442 | 14.85 |
ENSRNOT00000028433
|
Ms4a1
|
membrane spanning 4-domains A1 |
| chr3_-_11885311 | 14.81 |
ENSRNOT00000021189
ENSRNOT00000021178 |
Stxbp1
|
syntaxin binding protein 1 |
| chr5_-_130085838 | 14.77 |
ENSRNOT00000035252
|
Elavl4
|
ELAV like RNA binding protein 4 |
| chr5_+_22380334 | 14.76 |
ENSRNOT00000009744
|
Clvs1
|
clavesin 1 |
| chr3_+_16753703 | 14.65 |
ENSRNOT00000077741
|
AABR07051548.2
|
|
| chr4_+_102489916 | 14.57 |
ENSRNOT00000082031
|
AABR07061001.1
|
|
| chr10_+_65586504 | 14.56 |
ENSRNOT00000015535
ENSRNOT00000046388 |
Aldoc
|
aldolase, fructose-bisphosphate C |
| chr17_+_44760056 | 14.46 |
ENSRNOT00000052073
|
LOC690171
|
similar to H3 histone, family 3B |
| chr5_+_162031722 | 14.42 |
ENSRNOT00000020483
|
Lrrc38
|
leucine rich repeat containing 38 |
| chr6_-_138900915 | 14.41 |
ENSRNOT00000075363
|
AABR07065656.3
|
|
| chr10_-_110585376 | 14.34 |
ENSRNOT00000054917
|
Rab40b
|
Rab40b, member RAS oncogene family |
| chr6_-_141062581 | 14.29 |
ENSRNOT00000073446
|
AABR07065778.3
|
|
| chr13_-_82006005 | 14.27 |
ENSRNOT00000039581
|
Mettl11b
|
methyltransferase like 11B |
| chr14_+_75880410 | 14.27 |
ENSRNOT00000014078
|
Hs3st1
|
heparan sulfate-glucosamine 3-sulfotransferase 1 |
| chr5_-_147827863 | 14.24 |
ENSRNOT00000075659
|
Ccdc28b
|
coiled coil domain containing 28B |
| chr9_+_81816872 | 14.12 |
ENSRNOT00000041407
|
Plcd4
|
phospholipase C, delta 4 |
| chr13_-_51183269 | 14.09 |
ENSRNOT00000039540
|
Ppfia4
|
PTPRF interacting protein alpha 4 |
| chr13_-_103080920 | 14.08 |
ENSRNOT00000034990
|
AABR07022022.1
|
|
| chr4_-_103258134 | 14.07 |
ENSRNOT00000086827
|
AABR07061052.1
|
|
| chr3_-_17081510 | 13.99 |
ENSRNOT00000063862
|
AABR07051562.1
|
|
| chr1_+_25173242 | 13.77 |
ENSRNOT00000016518
|
Clvs2
|
clavesin 2 |
| chr5_-_58950373 | 13.75 |
ENSRNOT00000060442
|
Cd72
|
Cd72 molecule |
| chr5_+_22392732 | 13.72 |
ENSRNOT00000087182
|
Clvs1
|
clavesin 1 |
| chr3_-_72219246 | 13.62 |
ENSRNOT00000009903
|
Smtnl1
|
smoothelin-like 1 |
| chr6_-_138632159 | 13.56 |
ENSRNOT00000082921
ENSRNOT00000040702 |
Ighm
|
immunoglobulin heavy constant mu |
| chr7_-_44121130 | 13.53 |
ENSRNOT00000005706
|
Nts
|
neurotensin |
| chr3_-_16999720 | 13.39 |
ENSRNOT00000074382
|
RGD1563231
|
similar to immunoglobulin kappa-chain VK-1 |
| chr2_-_144323254 | 13.25 |
ENSRNOT00000018780
|
Sertm1
|
serine-rich and transmembrane domain containing 1 |
| chr1_-_198128857 | 13.23 |
ENSRNOT00000026496
|
Coro1a
|
coronin 1A |
| chr3_+_19274273 | 13.09 |
ENSRNOT00000040102
|
AABR07051684.1
|
|
| chr9_+_73528681 | 12.97 |
ENSRNOT00000084340
|
Unc80
|
unc-80 homolog, NALCN activator |
| chr3_+_17139670 | 12.95 |
ENSRNOT00000073316
|
AABR07051564.1
|
|
| chr2_-_140618405 | 12.86 |
ENSRNOT00000017736
|
Setd7
|
SET domain containing (lysine methyltransferase) 7 |
| chr20_-_28263037 | 12.74 |
ENSRNOT00000030348
|
Edar
|
ectodysplasin-A receptor |
| chr4_-_103115522 | 12.72 |
ENSRNOT00000074206
|
AABR07061044.1
|
|
| chr18_+_59748444 | 12.72 |
ENSRNOT00000024752
|
St8sia3
|
ST8 alpha-N-acetyl-neuraminide alpha-2,8-sialyltransferase 3 |
| chr4_+_102068556 | 12.72 |
ENSRNOT00000077412
|
AABR07060971.1
|
|
| chr3_+_51737904 | 12.69 |
ENSRNOT00000007069
|
Scn2a
|
sodium voltage-gated channel alpha subunit 2 |
| chr3_-_16537433 | 12.57 |
ENSRNOT00000048523
|
AABR07051533.2
|
|
| chr6_-_140880070 | 12.55 |
ENSRNOT00000073779
|
LOC691828
|
uncharacterized LOC691828 |
| chr13_-_90602365 | 12.43 |
ENSRNOT00000009344
|
Casq1
|
calsequestrin 1 |
| chr11_+_86092468 | 12.36 |
ENSRNOT00000057971
|
LOC100361706
|
lambda-chain C1-region-like |
| chr1_+_192233910 | 12.29 |
ENSRNOT00000016418
ENSRNOT00000016442 |
Prkcb
|
protein kinase C, beta |
| chr1_+_272799784 | 12.13 |
ENSRNOT00000016052
|
Ins1
|
insulin 1 |
| chr17_-_31916553 | 12.12 |
ENSRNOT00000074220
|
LOC100911032
|
uncharacterized LOC100911032 |
| chr6_-_138631997 | 12.08 |
ENSRNOT00000073304
|
AABR07065651.3
|
|
| chr4_+_102262007 | 12.05 |
ENSRNOT00000079328
|
AABR07060992.2
|
|
| chr12_+_48316143 | 12.00 |
ENSRNOT00000084511
|
Svop
|
SV2 related protein |
| chr3_-_51643140 | 11.98 |
ENSRNOT00000006646
|
Scn3a
|
sodium voltage-gated channel alpha subunit 3 |
| chr20_+_3830376 | 11.95 |
ENSRNOT00000085547
|
Col11a2
|
collagen type XI alpha 2 chain |
| chr2_+_226825635 | 11.89 |
ENSRNOT00000042173
|
AABR07013200.1
|
|
| chr6_-_141147264 | 11.84 |
ENSRNOT00000042900
|
LOC100361105
|
Igh protein-like |
| chr17_-_31813716 | 11.84 |
ENSRNOT00000074147
|
AABR07027451.1
|
|
| chr2_+_189629297 | 11.83 |
ENSRNOT00000049810
|
Dennd4b
|
DENN domain containing 4B |
| chr3_+_18706988 | 11.82 |
ENSRNOT00000074650
|
AABR07051652.1
|
|
| chr3_-_105512939 | 11.67 |
ENSRNOT00000011773
|
Actc1
|
actin, alpha, cardiac muscle 1 |
| chr10_-_108691367 | 11.65 |
ENSRNOT00000005067
|
Nptx1
|
neuronal pentraxin 1 |
| chr3_+_2591331 | 11.62 |
ENSRNOT00000017466
|
Sapcd2
|
suppressor APC domain containing 2 |
| chr4_-_168656673 | 11.54 |
ENSRNOT00000009341
|
Gpr19
|
G protein-coupled receptor 19 |
| chr17_+_44763598 | 11.50 |
ENSRNOT00000079880
|
Hist1h3b
|
histone cluster 1, H3b |
| chr1_-_98521706 | 11.38 |
ENSRNOT00000015941
|
Siglec10
|
sialic acid binding Ig-like lectin 10 |
| chr16_+_39827749 | 11.31 |
ENSRNOT00000074885
|
Wdr17
|
WD repeat domain 17 |
| chr10_-_31493419 | 11.27 |
ENSRNOT00000009211
|
Itk
|
IL2-inducible T-cell kinase |
| chr12_-_22211071 | 11.23 |
ENSRNOT00000087817
ENSRNOT00000001910 |
Actl6b
|
actin-like 6B |
| chr3_+_19441604 | 11.16 |
ENSRNOT00000090581
|
AABR07051692.1
|
|
| chr5_-_77173502 | 11.15 |
ENSRNOT00000023588
|
Slc46a2
|
solute carrier family 46, member 2 |
| chr4_+_70828894 | 11.10 |
ENSRNOT00000064892
|
Trbc2
|
T cell receptor beta, constant 2 |
| chr6_+_147876557 | 11.09 |
ENSRNOT00000080090
|
Tmem196
|
transmembrane protein 196 |
| chr6_-_142676432 | 11.06 |
ENSRNOT00000074947
|
AABR07065815.2
|
|
| chr8_+_130401470 | 11.06 |
ENSRNOT00000043346
|
Zbtb47
|
zinc finger and BTB domain containing 47 |
| chr9_+_41295909 | 11.01 |
ENSRNOT00000018935
|
Arhgef4
|
Rho guanine nucleotide exchange factor 4 |
| chr2_+_40554146 | 10.99 |
ENSRNOT00000015138
|
Pde4d
|
phosphodiesterase 4D |
| chr5_+_18963937 | 10.97 |
ENSRNOT00000082188
|
AABR07047089.1
|
|
| chr11_+_70687500 | 10.81 |
ENSRNOT00000037432
|
AC110981.1
|
|
| chr14_+_46649971 | 10.80 |
ENSRNOT00000085875
|
AABR07015078.1
|
|
| chr5_+_142875773 | 10.77 |
ENSRNOT00000082120
ENSRNOT00000056496 |
Epha10
|
EPH receptor A10 |
| chr10_-_56962161 | 10.76 |
ENSRNOT00000026038
|
Alox15
|
arachidonate 15-lipoxygenase |
| chr15_-_61564695 | 10.68 |
ENSRNOT00000068216
|
Rgcc
|
regulator of cell cycle |
| chr20_+_3875706 | 10.66 |
ENSRNOT00000036900
|
RT1-Ha
|
RT1 class II, locus Ha |
| chr4_+_101909389 | 10.57 |
ENSRNOT00000086458
|
AABR07060963.2
|
|
| chr4_+_102643934 | 10.54 |
ENSRNOT00000058389
|
LOC100911032
|
uncharacterized LOC100911032 |
| chr1_-_100980340 | 10.52 |
ENSRNOT00000064272
|
Prmt1
|
protein arginine methyltransferase 1 |
| chr1_-_215836641 | 10.51 |
ENSRNOT00000080246
|
Igf2
|
insulin-like growth factor 2 |
| chr2_+_113984824 | 10.50 |
ENSRNOT00000086399
|
Tnik
|
TRAF2 and NCK interacting kinase |
| chr1_-_98521551 | 10.48 |
ENSRNOT00000081922
|
Siglec10
|
sialic acid binding Ig-like lectin 10 |
| chr2_+_113984646 | 10.42 |
ENSRNOT00000016799
|
Tnik
|
TRAF2 and NCK interacting kinase |
| chr16_+_16949232 | 10.42 |
ENSRNOT00000047499
|
AABR07024795.1
|
|
| chr1_-_219422268 | 10.42 |
ENSRNOT00000025092
|
Carns1
|
carnosine synthase 1 |
| chr2_+_83393282 | 10.36 |
ENSRNOT00000044871
|
Ctnnd2
|
catenin delta 2 |
| chr1_+_219250265 | 10.33 |
ENSRNOT00000024353
|
Doc2g
|
double C2-like domains, gamma |
| chr9_-_13877130 | 10.27 |
ENSRNOT00000015705
|
Lrfn2
|
leucine rich repeat and fibronectin type III domain containing 2 |
| chr3_-_60611924 | 10.18 |
ENSRNOT00000068745
|
Chn1
|
chimerin 1 |
| chrX_+_65800059 | 10.16 |
ENSRNOT00000076428
|
Gpr165
|
G protein-coupled receptor 165 |
| chr13_-_89594738 | 10.04 |
ENSRNOT00000004641
|
Tomm40l
|
translocase of outer mitochondrial membrane 40 like |
| chr15_+_344685 | 9.98 |
ENSRNOT00000065542
ENSRNOT00000066928 |
Kcnma1
|
potassium calcium-activated channel subfamily M alpha 1 |
| chr18_+_14471213 | 9.97 |
ENSRNOT00000045224
|
Dtna
|
dystrobrevin, alpha |
| chr4_+_98481520 | 9.97 |
ENSRNOT00000078381
ENSRNOT00000048493 |
AABR07060886.1
|
|
| chr6_+_139405966 | 9.90 |
ENSRNOT00000088974
|
AABR07065693.3
|
|
| chr17_-_54808483 | 9.83 |
ENSRNOT00000075683
|
AABR07028049.1
|
|
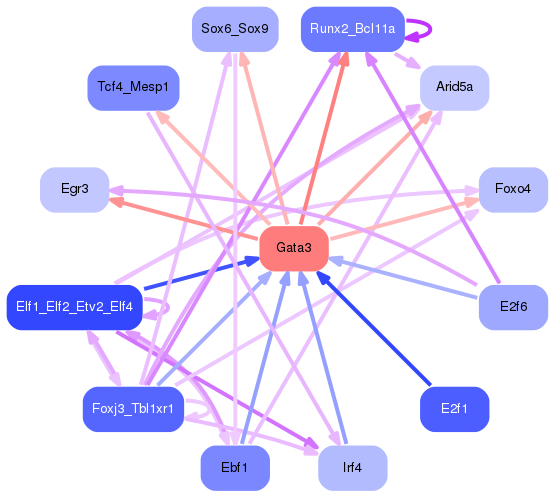
Network of associatons between targets according to the STRING database.

First level regulatory network of Gata3
Gene Ontology Analysis
Gene overrepresentation in biological process category:
| Log-likelihood per target | Total log-likelihood | Term | Description |
|---|---|---|---|
| 19.5 | 58.5 | GO:0031444 | slow-twitch skeletal muscle fiber contraction(GO:0031444) |
| 10.3 | 31.0 | GO:0031448 | regulation of fast-twitch skeletal muscle fiber contraction(GO:0031446) positive regulation of fast-twitch skeletal muscle fiber contraction(GO:0031448) positive regulation of endoplasmic reticulum calcium ion concentration(GO:0032470) |
| 10.3 | 30.9 | GO:0035606 | peptidyl-cysteine S-trans-nitrosylation(GO:0035606) |
| 9.8 | 29.5 | GO:0006480 | N-terminal protein amino acid methylation(GO:0006480) |
| 7.6 | 22.9 | GO:1903860 | negative regulation of dendrite extension(GO:1903860) |
| 7.5 | 44.7 | GO:1904714 | positive regulation of Schwann cell proliferation(GO:0010625) regulation of chaperone-mediated autophagy(GO:1904714) |
| 6.0 | 18.1 | GO:0071579 | regulation of zinc ion transport(GO:0071579) |
| 5.8 | 17.4 | GO:2000474 | regulation of opioid receptor signaling pathway(GO:2000474) |
| 5.0 | 35.3 | GO:0043456 | regulation of pentose-phosphate shunt(GO:0043456) |
| 4.9 | 14.8 | GO:0035544 | negative regulation of SNARE complex assembly(GO:0035544) |
| 4.7 | 18.7 | GO:2001274 | immunoglobulin biosynthetic process(GO:0002378) negative regulation of glucose import in response to insulin stimulus(GO:2001274) |
| 4.4 | 13.2 | GO:0031339 | negative regulation of vesicle fusion(GO:0031339) |
| 4.2 | 12.7 | GO:1990743 | protein sialylation(GO:1990743) |
| 4.1 | 12.3 | GO:0035408 | histone H3-T6 phosphorylation(GO:0035408) |
| 3.7 | 11.0 | GO:0086024 | adrenergic receptor signaling pathway involved in positive regulation of heart rate(GO:0086024) |
| 3.6 | 10.7 | GO:0003330 | regulation of extracellular matrix constituent secretion(GO:0003330) positive regulation of extracellular matrix constituent secretion(GO:0003331) |
| 3.5 | 28.1 | GO:0051694 | pointed-end actin filament capping(GO:0051694) |
| 3.3 | 10.0 | GO:0060082 | eye blink reflex(GO:0060082) |
| 3.3 | 26.2 | GO:0014883 | transition between fast and slow fiber(GO:0014883) |
| 3.1 | 12.4 | GO:0014809 | regulation of skeletal muscle contraction by regulation of release of sequestered calcium ion(GO:0014809) |
| 3.1 | 24.7 | GO:1903546 | protein localization to photoreceptor outer segment(GO:1903546) |
| 3.0 | 17.9 | GO:1903361 | protein localization to basolateral plasma membrane(GO:1903361) |
| 3.0 | 8.9 | GO:0046103 | inosine biosynthetic process(GO:0046103) |
| 2.8 | 50.8 | GO:0090129 | positive regulation of synapse maturation(GO:0090129) |
| 2.7 | 10.9 | GO:0002188 | translation reinitiation(GO:0002188) |
| 2.7 | 13.5 | GO:0097332 | response to antipsychotic drug(GO:0097332) |
| 2.6 | 10.5 | GO:0046985 | positive regulation of hemoglobin biosynthetic process(GO:0046985) |
| 2.6 | 15.7 | GO:0007198 | adenylate cyclase-inhibiting serotonin receptor signaling pathway(GO:0007198) |
| 2.6 | 10.4 | GO:0030240 | skeletal muscle thin filament assembly(GO:0030240) |
| 2.6 | 7.8 | GO:0045079 | negative regulation of chemokine biosynthetic process(GO:0045079) negative regulation of interleukin-1-mediated signaling pathway(GO:2000660) |
| 2.6 | 12.8 | GO:0098700 | neurotransmitter loading into synaptic vesicle(GO:0098700) |
| 2.6 | 7.7 | GO:1990091 | sodium-dependent self proteolysis(GO:1990091) |
| 2.5 | 15.1 | GO:0060528 | secretory columnal luminar epithelial cell differentiation involved in prostate glandular acinus development(GO:0060528) |
| 2.5 | 14.9 | GO:0046813 | receptor-mediated virion attachment to host cell(GO:0046813) |
| 2.5 | 7.4 | GO:0031632 | positive regulation of synaptic vesicle fusion to presynaptic membrane(GO:0031632) |
| 2.4 | 26.8 | GO:1990001 | inhibition of cysteine-type endopeptidase activity involved in apoptotic process(GO:1990001) |
| 2.4 | 7.2 | GO:0090164 | asymmetric Golgi ribbon formation(GO:0090164) |
| 2.3 | 9.4 | GO:1902683 | regulation of receptor localization to synapse(GO:1902683) |
| 2.3 | 18.7 | GO:0045650 | negative regulation of macrophage differentiation(GO:0045650) |
| 2.3 | 9.3 | GO:0050893 | sensory processing(GO:0050893) |
| 2.3 | 9.2 | GO:0045347 | negative regulation of MHC class II biosynthetic process(GO:0045347) |
| 2.3 | 6.9 | GO:0060392 | negative regulation of SMAD protein import into nucleus(GO:0060392) |
| 2.3 | 9.1 | GO:0043490 | malate-aspartate shuttle(GO:0043490) |
| 2.2 | 9.0 | GO:1901423 | response to benzene(GO:1901423) |
| 2.2 | 8.9 | GO:1902473 | regulation of protein localization to synapse(GO:1902473) positive regulation of protein localization to synapse(GO:1902474) |
| 2.2 | 10.8 | GO:0051122 | hepoxilin metabolic process(GO:0051121) hepoxilin biosynthetic process(GO:0051122) |
| 2.1 | 15.0 | GO:0099566 | regulation of postsynaptic cytosolic calcium ion concentration(GO:0099566) |
| 2.1 | 6.4 | GO:0018343 | protein farnesylation(GO:0018343) |
| 2.1 | 16.9 | GO:0007021 | tubulin complex assembly(GO:0007021) |
| 2.0 | 6.1 | GO:0019276 | UDP-N-acetylgalactosamine metabolic process(GO:0019276) |
| 2.0 | 6.1 | GO:0021589 | hindbrain structural organization(GO:0021577) cerebellum structural organization(GO:0021589) neuronal-glial interaction involved in cerebral cortex radial glia guided migration(GO:0021812) lateral motor column neuron migration(GO:0097477) |
| 2.0 | 11.9 | GO:0060023 | soft palate development(GO:0060023) |
| 1.9 | 11.6 | GO:2000354 | regulation of ovarian follicle development(GO:2000354) |
| 1.9 | 5.8 | GO:0097051 | establishment of protein localization to endoplasmic reticulum membrane(GO:0097051) |
| 1.9 | 5.7 | GO:1990009 | retinal cell apoptotic process(GO:1990009) |
| 1.9 | 3.8 | GO:0033123 | positive regulation of purine nucleotide catabolic process(GO:0033123) |
| 1.8 | 24.0 | GO:0019227 | neuronal action potential propagation(GO:0019227) action potential propagation(GO:0098870) |
| 1.8 | 36.6 | GO:2001014 | regulation of skeletal muscle cell differentiation(GO:2001014) |
| 1.8 | 12.7 | GO:0060605 | tube lumen cavitation(GO:0060605) salivary gland cavitation(GO:0060662) |
| 1.8 | 7.3 | GO:1904975 | response to bleomycin(GO:1904975) |
| 1.8 | 23.3 | GO:0001778 | plasma membrane repair(GO:0001778) |
| 1.8 | 5.4 | GO:0000189 | MAPK import into nucleus(GO:0000189) diadenosine polyphosphate biosynthetic process(GO:0015960) diadenosine tetraphosphate metabolic process(GO:0015965) diadenosine tetraphosphate biosynthetic process(GO:0015966) |
| 1.8 | 5.4 | GO:0019417 | sulfur oxidation(GO:0019417) |
| 1.8 | 17.5 | GO:0046085 | adenosine metabolic process(GO:0046085) |
| 1.7 | 12.2 | GO:0046684 | response to pyrethroid(GO:0046684) |
| 1.7 | 22.7 | GO:0030388 | fructose 1,6-bisphosphate metabolic process(GO:0030388) |
| 1.7 | 5.2 | GO:0033566 | gamma-tubulin complex localization(GO:0033566) |
| 1.7 | 8.6 | GO:0019521 | aldonic acid metabolic process(GO:0019520) D-gluconate metabolic process(GO:0019521) |
| 1.7 | 6.8 | GO:0002669 | positive regulation of T cell anergy(GO:0002669) positive regulation of lymphocyte anergy(GO:0002913) |
| 1.7 | 11.8 | GO:0032483 | regulation of Rab protein signal transduction(GO:0032483) |
| 1.7 | 15.2 | GO:0050957 | equilibrioception(GO:0050957) |
| 1.7 | 6.7 | GO:0060298 | positive regulation of sarcomere organization(GO:0060298) |
| 1.7 | 8.3 | GO:0034626 | fatty acid elongation, polyunsaturated fatty acid(GO:0034626) |
| 1.6 | 4.8 | GO:0003221 | right ventricular cardiac muscle tissue morphogenesis(GO:0003221) |
| 1.6 | 22.3 | GO:0071420 | cellular response to histamine(GO:0071420) |
| 1.6 | 22.2 | GO:0007256 | activation of JNKK activity(GO:0007256) |
| 1.6 | 12.7 | GO:0008627 | intrinsic apoptotic signaling pathway in response to osmotic stress(GO:0008627) |
| 1.5 | 6.0 | GO:0006428 | isoleucyl-tRNA aminoacylation(GO:0006428) |
| 1.5 | 6.0 | GO:0035470 | positive regulation of vascular wound healing(GO:0035470) hematopoietic stem cell migration(GO:0035701) response to ultrasound(GO:1990478) |
| 1.5 | 16.5 | GO:0090527 | actin filament reorganization(GO:0090527) |
| 1.5 | 10.5 | GO:0038028 | insulin receptor signaling pathway via phosphatidylinositol 3-kinase(GO:0038028) positive regulation of glycogen (starch) synthase activity(GO:2000467) |
| 1.5 | 16.3 | GO:0031914 | negative regulation of synaptic plasticity(GO:0031914) |
| 1.5 | 4.4 | GO:1905076 | peptidyl-serine ADP-ribosylation(GO:0018312) myofibroblast differentiation(GO:0036446) regulation of myofibroblast differentiation(GO:1904760) regulation of interleukin-17 secretion(GO:1905076) negative regulation of interleukin-17 secretion(GO:1905077) negative regulation of ATP biosynthetic process(GO:2001170) |
| 1.4 | 8.5 | GO:2000304 | positive regulation of sphingolipid biosynthetic process(GO:0090154) positive regulation of ceramide biosynthetic process(GO:2000304) |
| 1.4 | 7.1 | GO:0014063 | negative regulation of serotonin secretion(GO:0014063) |
| 1.4 | 4.2 | GO:0060300 | regulation of cytokine activity(GO:0060300) |
| 1.4 | 7.0 | GO:2000741 | positive regulation of mesenchymal stem cell differentiation(GO:2000741) |
| 1.4 | 2.8 | GO:0042940 | D-amino acid transport(GO:0042940) |
| 1.4 | 5.6 | GO:0036515 | serotonergic neuron axon guidance(GO:0036515) |
| 1.4 | 16.6 | GO:0046543 | development of secondary female sexual characteristics(GO:0046543) |
| 1.4 | 4.1 | GO:0000912 | assembly of actomyosin apparatus involved in cytokinesis(GO:0000912) actomyosin contractile ring assembly(GO:0000915) actomyosin contractile ring organization(GO:0044837) |
| 1.3 | 5.3 | GO:0090204 | protein localization to nuclear pore(GO:0090204) |
| 1.3 | 52.0 | GO:0007026 | negative regulation of microtubule depolymerization(GO:0007026) |
| 1.3 | 12.9 | GO:0018026 | peptidyl-lysine monomethylation(GO:0018026) |
| 1.3 | 6.4 | GO:0006741 | NADP biosynthetic process(GO:0006741) |
| 1.3 | 3.8 | GO:0007056 | spindle assembly involved in female meiosis(GO:0007056) |
| 1.3 | 11.3 | GO:0001865 | NK T cell differentiation(GO:0001865) |
| 1.2 | 4.9 | GO:0070537 | histone H2A K63-linked deubiquitination(GO:0070537) |
| 1.2 | 17.1 | GO:0033089 | positive regulation of T cell differentiation in thymus(GO:0033089) positive regulation of thymocyte aggregation(GO:2000400) |
| 1.2 | 23.0 | GO:2000311 | regulation of alpha-amino-3-hydroxy-5-methyl-4-isoxazole propionate selective glutamate receptor activity(GO:2000311) |
| 1.2 | 14.3 | GO:0035865 | cellular response to potassium ion(GO:0035865) |
| 1.2 | 11.9 | GO:0070837 | dehydroascorbic acid transport(GO:0070837) |
| 1.2 | 127.6 | GO:0006334 | nucleosome assembly(GO:0006334) |
| 1.2 | 8.2 | GO:0061718 | NADH regeneration(GO:0006735) positive regulation of glucokinase activity(GO:0033133) canonical glycolysis(GO:0061621) glucose catabolic process to pyruvate(GO:0061718) positive regulation of hexokinase activity(GO:1903301) |
| 1.2 | 7.0 | GO:1990928 | response to amino acid starvation(GO:1990928) |
| 1.2 | 12.7 | GO:0060040 | retinal bipolar neuron differentiation(GO:0060040) |
| 1.1 | 7.8 | GO:0000492 | box C/D snoRNP assembly(GO:0000492) |
| 1.0 | 24.1 | GO:0045109 | intermediate filament organization(GO:0045109) |
| 1.0 | 6.2 | GO:0000056 | ribosomal small subunit export from nucleus(GO:0000056) |
| 1.0 | 10.3 | GO:0018095 | protein polyglutamylation(GO:0018095) |
| 1.0 | 5.1 | GO:0061086 | negative regulation of histone H3-K27 methylation(GO:0061086) |
| 1.0 | 3.0 | GO:0097296 | regulation of lung blood pressure(GO:0014916) positive regulation of transforming growth factor beta3 production(GO:0032916) activation of cysteine-type endopeptidase activity involved in apoptotic signaling pathway(GO:0097296) |
| 1.0 | 2.0 | GO:2000313 | fibroblast growth factor receptor signaling pathway involved in neural plate anterior/posterior pattern formation(GO:0060825) regulation of fibroblast growth factor receptor signaling pathway involved in neural plate anterior/posterior pattern formation(GO:2000313) |
| 1.0 | 5.9 | GO:1902916 | positive regulation of protein polyubiquitination(GO:1902916) |
| 1.0 | 18.6 | GO:0021542 | dentate gyrus development(GO:0021542) |
| 1.0 | 9.7 | GO:0050862 | positive regulation of T cell receptor signaling pathway(GO:0050862) |
| 1.0 | 8.6 | GO:0007196 | adenylate cyclase-inhibiting G-protein coupled glutamate receptor signaling pathway(GO:0007196) |
| 0.9 | 2.8 | GO:0045751 | regulation of Toll signaling pathway(GO:0008592) negative regulation of Toll signaling pathway(GO:0045751) |
| 0.9 | 2.8 | GO:0010841 | positive regulation of circadian sleep/wake cycle, wakefulness(GO:0010841) |
| 0.9 | 12.7 | GO:0032688 | negative regulation of interferon-beta production(GO:0032688) |
| 0.9 | 2.7 | GO:0046952 | ketone body catabolic process(GO:0046952) |
| 0.9 | 3.5 | GO:0035426 | extracellular matrix-cell signaling(GO:0035426) |
| 0.9 | 6.0 | GO:1902083 | negative regulation of peptidyl-cysteine S-nitrosylation(GO:1902083) |
| 0.9 | 1.7 | GO:2000669 | negative regulation of dendritic cell apoptotic process(GO:2000669) |
| 0.9 | 3.4 | GO:0032701 | negative regulation of interleukin-18 production(GO:0032701) |
| 0.8 | 3.4 | GO:0051643 | endoplasmic reticulum localization(GO:0051643) |
| 0.8 | 5.9 | GO:0017062 | respiratory chain complex III assembly(GO:0017062) mitochondrial respiratory chain complex III assembly(GO:0034551) |
| 0.8 | 3.3 | GO:0045794 | negative regulation of cell volume(GO:0045794) |
| 0.8 | 5.8 | GO:0035745 | T-helper 2 cell cytokine production(GO:0035745) |
| 0.8 | 5.7 | GO:0070317 | negative regulation of G0 to G1 transition(GO:0070317) response to water-immersion restraint stress(GO:1990785) |
| 0.8 | 4.9 | GO:0051388 | positive regulation of neurotrophin TRK receptor signaling pathway(GO:0051388) |
| 0.8 | 3.2 | GO:0038110 | interleukin-2-mediated signaling pathway(GO:0038110) |
| 0.8 | 8.1 | GO:0060088 | auditory receptor cell stereocilium organization(GO:0060088) |
| 0.8 | 3.2 | GO:2000416 | regulation of eosinophil migration(GO:2000416) positive regulation of eosinophil migration(GO:2000418) |
| 0.8 | 3.2 | GO:1902775 | mitochondrial large ribosomal subunit assembly(GO:1902775) |
| 0.8 | 2.4 | GO:0002477 | antigen processing and presentation of exogenous peptide antigen via MHC class Ib(GO:0002477) antigen processing and presentation of exogenous protein antigen via MHC class Ib, TAP-dependent(GO:0002481) |
| 0.8 | 1.6 | GO:1905065 | mineralocorticoid receptor signaling pathway(GO:0031959) positive regulation of vascular smooth muscle cell differentiation(GO:1905065) |
| 0.8 | 7.0 | GO:0097119 | postsynaptic density protein 95 clustering(GO:0097119) |
| 0.8 | 13.1 | GO:0072488 | ammonium transmembrane transport(GO:0072488) |
| 0.8 | 1.5 | GO:1902309 | negative regulation of peptidyl-serine dephosphorylation(GO:1902309) |
| 0.8 | 4.6 | GO:0032825 | positive regulation of natural killer cell differentiation(GO:0032825) |
| 0.8 | 3.8 | GO:0019372 | lipoxygenase pathway(GO:0019372) |
| 0.8 | 6.9 | GO:0032230 | positive regulation of synaptic transmission, GABAergic(GO:0032230) |
| 0.8 | 7.6 | GO:1902993 | positive regulation of beta-amyloid formation(GO:1902004) positive regulation of amyloid precursor protein catabolic process(GO:1902993) |
| 0.8 | 9.8 | GO:0089711 | L-glutamate transmembrane transport(GO:0089711) |
| 0.8 | 3.0 | GO:0048143 | negative regulation of photoreceptor cell differentiation(GO:0046533) astrocyte activation(GO:0048143) positive regulation of sprouting of injured axon(GO:0048687) positive regulation of axon extension involved in regeneration(GO:0048691) |
| 0.7 | 4.5 | GO:0071418 | cellular response to amine stimulus(GO:0071418) |
| 0.7 | 2.2 | GO:1900368 | regulation of RNA interference(GO:1900368) |
| 0.7 | 3.7 | GO:0032849 | positive regulation of cellular pH reduction(GO:0032849) |
| 0.7 | 8.1 | GO:0099612 | protein localization to axon(GO:0099612) |
| 0.7 | 2.9 | GO:1900378 | positive regulation of melanin biosynthetic process(GO:0048023) positive regulation of secondary metabolite biosynthetic process(GO:1900378) |
| 0.7 | 14.3 | GO:2000651 | positive regulation of sodium ion transmembrane transporter activity(GO:2000651) |
| 0.7 | 2.8 | GO:0046005 | positive regulation of circadian sleep/wake cycle, REM sleep(GO:0046005) |
| 0.7 | 33.3 | GO:0036465 | synaptic vesicle recycling(GO:0036465) |
| 0.7 | 60.7 | GO:0010923 | negative regulation of phosphatase activity(GO:0010923) |
| 0.7 | 4.9 | GO:0060753 | regulation of mast cell chemotaxis(GO:0060753) |
| 0.7 | 7.0 | GO:1900017 | positive regulation of cytokine production involved in inflammatory response(GO:1900017) |
| 0.7 | 0.7 | GO:0002191 | cap-dependent translational initiation(GO:0002191) |
| 0.7 | 7.7 | GO:0046784 | viral mRNA export from host cell nucleus(GO:0046784) |
| 0.7 | 6.3 | GO:0051026 | chiasma assembly(GO:0051026) |
| 0.7 | 3.5 | GO:1904401 | cellular response to Thyroid stimulating hormone(GO:1904401) |
| 0.7 | 2.1 | GO:1903544 | response to butyrate(GO:1903544) |
| 0.7 | 11.0 | GO:0031643 | positive regulation of myelination(GO:0031643) |
| 0.7 | 8.1 | GO:0002726 | positive regulation of T cell cytokine production(GO:0002726) |
| 0.7 | 3.3 | GO:0042264 | peptidyl-aspartic acid hydroxylation(GO:0042264) |
| 0.7 | 4.0 | GO:0038170 | somatostatin receptor signaling pathway(GO:0038169) somatostatin signaling pathway(GO:0038170) |
| 0.7 | 6.6 | GO:0036444 | calcium ion transmembrane import into mitochondrion(GO:0036444) |
| 0.6 | 3.8 | GO:0006610 | ribosomal protein import into nucleus(GO:0006610) |
| 0.6 | 10.0 | GO:0030150 | protein import into mitochondrial matrix(GO:0030150) |
| 0.6 | 3.7 | GO:0045348 | positive regulation of MHC class II biosynthetic process(GO:0045348) |
| 0.6 | 3.1 | GO:0010701 | positive regulation of chronic inflammatory response(GO:0002678) positive regulation of norepinephrine secretion(GO:0010701) |
| 0.6 | 4.9 | GO:0061101 | neuroendocrine cell differentiation(GO:0061101) |
| 0.6 | 7.3 | GO:0035630 | bone mineralization involved in bone maturation(GO:0035630) |
| 0.6 | 2.4 | GO:0097039 | protein linear polyubiquitination(GO:0097039) |
| 0.6 | 7.2 | GO:1990118 | sodium ion import across plasma membrane(GO:0098719) sodium ion import into cell(GO:1990118) |
| 0.6 | 1.8 | GO:0010903 | negative regulation of cytokine secretion involved in immune response(GO:0002740) negative regulation of very-low-density lipoprotein particle remodeling(GO:0010903) diacylglycerol catabolic process(GO:0046340) |
| 0.6 | 10.7 | GO:0019886 | antigen processing and presentation of exogenous peptide antigen via MHC class II(GO:0019886) |
| 0.6 | 3.0 | GO:0030222 | eosinophil differentiation(GO:0030222) |
| 0.6 | 4.7 | GO:0046007 | negative regulation of activated T cell proliferation(GO:0046007) negative regulation of cAMP-dependent protein kinase activity(GO:2000480) |
| 0.6 | 2.2 | GO:0046462 | monoacylglycerol metabolic process(GO:0046462) monoacylglycerol catabolic process(GO:0052651) |
| 0.5 | 3.2 | GO:0072675 | osteoclast fusion(GO:0072675) |
| 0.5 | 1.1 | GO:1904395 | positive regulation of skeletal muscle acetylcholine-gated channel clustering(GO:1904395) |
| 0.5 | 5.8 | GO:0002430 | complement receptor mediated signaling pathway(GO:0002430) |
| 0.5 | 1.0 | GO:2000078 | positive regulation of type B pancreatic cell development(GO:2000078) |
| 0.5 | 9.2 | GO:0035641 | locomotory exploration behavior(GO:0035641) |
| 0.5 | 3.0 | GO:0032790 | ribosome disassembly(GO:0032790) |
| 0.5 | 4.0 | GO:0060371 | regulation of atrial cardiac muscle cell membrane depolarization(GO:0060371) |
| 0.5 | 4.0 | GO:0019388 | galactose catabolic process(GO:0019388) |
| 0.5 | 2.5 | GO:0019919 | peptidyl-arginine methylation, to asymmetrical-dimethyl arginine(GO:0019919) |
| 0.5 | 3.5 | GO:0016259 | selenocysteine metabolic process(GO:0016259) |
| 0.5 | 3.9 | GO:0002934 | desmosome organization(GO:0002934) |
| 0.5 | 2.4 | GO:0043418 | homocysteine catabolic process(GO:0043418) |
| 0.5 | 4.9 | GO:2001223 | negative regulation of neuron migration(GO:2001223) |
| 0.5 | 8.1 | GO:0034453 | microtubule anchoring(GO:0034453) |
| 0.5 | 6.2 | GO:0016446 | somatic hypermutation of immunoglobulin genes(GO:0016446) |
| 0.5 | 6.2 | GO:0020027 | hemoglobin metabolic process(GO:0020027) |
| 0.5 | 5.2 | GO:0030206 | chondroitin sulfate biosynthetic process(GO:0030206) negative regulation of axon regeneration(GO:0048681) |
| 0.5 | 1.4 | GO:0018242 | protein O-linked glycosylation via serine(GO:0018242) |
| 0.5 | 4.1 | GO:0000463 | maturation of LSU-rRNA from tricistronic rRNA transcript (SSU-rRNA, 5.8S rRNA, LSU-rRNA)(GO:0000463) |
| 0.5 | 16.9 | GO:0006904 | vesicle docking involved in exocytosis(GO:0006904) |
| 0.5 | 27.2 | GO:0007040 | lysosome organization(GO:0007040) lytic vacuole organization(GO:0080171) |
| 0.4 | 7.2 | GO:0014051 | gamma-aminobutyric acid secretion(GO:0014051) |
| 0.4 | 10.7 | GO:0006471 | protein ADP-ribosylation(GO:0006471) |
| 0.4 | 6.7 | GO:0035269 | protein O-linked mannosylation(GO:0035269) |
| 0.4 | 3.5 | GO:2000766 | negative regulation of cytoplasmic translation(GO:2000766) |
| 0.4 | 5.3 | GO:0032096 | negative regulation of response to food(GO:0032096) |
| 0.4 | 5.3 | GO:0030299 | intestinal cholesterol absorption(GO:0030299) |
| 0.4 | 6.1 | GO:0051131 | chaperone-mediated protein complex assembly(GO:0051131) |
| 0.4 | 4.3 | GO:0090161 | Golgi ribbon formation(GO:0090161) |
| 0.4 | 2.6 | GO:0061635 | regulation of protein complex stability(GO:0061635) |
| 0.4 | 3.4 | GO:0042760 | very long-chain fatty acid catabolic process(GO:0042760) |
| 0.4 | 4.2 | GO:0032098 | regulation of appetite(GO:0032098) |
| 0.4 | 2.5 | GO:0044351 | macropinocytosis(GO:0044351) |
| 0.4 | 12.0 | GO:0015985 | energy coupled proton transport, down electrochemical gradient(GO:0015985) ATP synthesis coupled proton transport(GO:0015986) |
| 0.4 | 5.6 | GO:1900746 | regulation of vascular endothelial growth factor signaling pathway(GO:1900746) |
| 0.4 | 1.2 | GO:0051697 | protein delipidation(GO:0051697) |
| 0.4 | 0.8 | GO:1903817 | negative regulation of delayed rectifier potassium channel activity(GO:1902260) negative regulation of voltage-gated potassium channel activity(GO:1903817) |
| 0.4 | 2.7 | GO:1904117 | cellular response to vasopressin(GO:1904117) |
| 0.4 | 3.1 | GO:0060449 | bud elongation involved in lung branching(GO:0060449) |
| 0.4 | 0.8 | GO:0051660 | establishment of centrosome localization(GO:0051660) |
| 0.4 | 1.9 | GO:0090367 | negative regulation of mRNA modification(GO:0090367) |
| 0.4 | 9.6 | GO:0070233 | negative regulation of T cell apoptotic process(GO:0070233) |
| 0.4 | 0.8 | GO:2001106 | regulation of Rho guanyl-nucleotide exchange factor activity(GO:2001106) |
| 0.4 | 1.9 | GO:0035627 | ceramide transport(GO:0035627) |
| 0.4 | 2.3 | GO:0035898 | parathyroid hormone secretion(GO:0035898) |
| 0.4 | 20.6 | GO:0045761 | regulation of adenylate cyclase activity(GO:0045761) |
| 0.4 | 2.2 | GO:0035609 | C-terminal protein deglutamylation(GO:0035609) |
| 0.4 | 5.1 | GO:0030502 | negative regulation of bone mineralization(GO:0030502) |
| 0.4 | 1.5 | GO:0030311 | poly-N-acetyllactosamine metabolic process(GO:0030309) poly-N-acetyllactosamine biosynthetic process(GO:0030311) |
| 0.4 | 1.5 | GO:1903336 | negative regulation of vacuolar transport(GO:1903336) |
| 0.4 | 5.0 | GO:0015671 | oxygen transport(GO:0015671) |
| 0.4 | 9.3 | GO:0035066 | positive regulation of histone acetylation(GO:0035066) positive regulation of peptidyl-lysine acetylation(GO:2000758) |
| 0.4 | 7.8 | GO:0032012 | regulation of ARF protein signal transduction(GO:0032012) |
| 0.4 | 13.0 | GO:0042220 | response to cocaine(GO:0042220) |
| 0.4 | 3.5 | GO:0045542 | positive regulation of cholesterol biosynthetic process(GO:0045542) positive regulation of cholesterol metabolic process(GO:0090205) |
| 0.4 | 2.1 | GO:0048496 | maintenance of organ identity(GO:0048496) |
| 0.3 | 3.1 | GO:0015684 | ferrous iron transport(GO:0015684) ferrous iron transmembrane transport(GO:1903874) |
| 0.3 | 5.2 | GO:0051481 | negative regulation of cytosolic calcium ion concentration(GO:0051481) |
| 0.3 | 0.3 | GO:1904170 | regulation of bleb assembly(GO:1904170) |
| 0.3 | 6.2 | GO:0031581 | hemidesmosome assembly(GO:0031581) |
| 0.3 | 7.9 | GO:0050901 | leukocyte tethering or rolling(GO:0050901) |
| 0.3 | 22.5 | GO:0051965 | positive regulation of synapse assembly(GO:0051965) |
| 0.3 | 5.4 | GO:0051457 | maintenance of protein location in nucleus(GO:0051457) |
| 0.3 | 28.8 | GO:0014823 | response to activity(GO:0014823) |
| 0.3 | 3.7 | GO:0021559 | trigeminal nerve development(GO:0021559) |
| 0.3 | 6.3 | GO:0097503 | sialylation(GO:0097503) |
| 0.3 | 31.6 | GO:0007229 | integrin-mediated signaling pathway(GO:0007229) |
| 0.3 | 6.9 | GO:0007214 | gamma-aminobutyric acid signaling pathway(GO:0007214) |
| 0.3 | 14.7 | GO:0048168 | regulation of neuronal synaptic plasticity(GO:0048168) |
| 0.3 | 1.9 | GO:0043249 | erythrocyte maturation(GO:0043249) |
| 0.3 | 12.3 | GO:0048791 | calcium ion-regulated exocytosis of neurotransmitter(GO:0048791) |
| 0.3 | 11.0 | GO:0046847 | filopodium assembly(GO:0046847) |
| 0.3 | 7.2 | GO:0045116 | protein neddylation(GO:0045116) |
| 0.3 | 1.9 | GO:0045839 | negative regulation of mitotic nuclear division(GO:0045839) |
| 0.3 | 4.3 | GO:0000042 | protein targeting to Golgi(GO:0000042) |
| 0.3 | 4.0 | GO:1903830 | magnesium ion transmembrane transport(GO:1903830) |
| 0.3 | 6.3 | GO:0060218 | hematopoietic stem cell differentiation(GO:0060218) |
| 0.3 | 10.4 | GO:0048013 | ephrin receptor signaling pathway(GO:0048013) |
| 0.3 | 9.9 | GO:0007193 | adenylate cyclase-inhibiting G-protein coupled receptor signaling pathway(GO:0007193) |
| 0.3 | 26.5 | GO:0060048 | cardiac muscle contraction(GO:0060048) |
| 0.3 | 3.4 | GO:1901409 | positive regulation of phosphorylation of RNA polymerase II C-terminal domain(GO:1901409) |
| 0.3 | 1.7 | GO:0045625 | regulation of T-helper 1 cell differentiation(GO:0045625) |
| 0.3 | 2.5 | GO:0042711 | maternal behavior(GO:0042711) |
| 0.3 | 352.9 | GO:0050911 | detection of chemical stimulus involved in sensory perception of smell(GO:0050911) |
| 0.3 | 6.3 | GO:0071526 | semaphorin-plexin signaling pathway(GO:0071526) |
| 0.3 | 17.7 | GO:0007218 | neuropeptide signaling pathway(GO:0007218) |
| 0.3 | 3.2 | GO:0000185 | activation of MAPKKK activity(GO:0000185) |
| 0.3 | 2.1 | GO:0048642 | negative regulation of skeletal muscle tissue development(GO:0048642) |
| 0.3 | 1.9 | GO:0031284 | positive regulation of guanylate cyclase activity(GO:0031284) |
| 0.3 | 6.6 | GO:1903963 | arachidonic acid secretion(GO:0050482) arachidonate transport(GO:1903963) |
| 0.3 | 2.1 | GO:0097327 | response to antineoplastic agent(GO:0097327) |
| 0.3 | 1.0 | GO:0046379 | extracellular polysaccharide biosynthetic process(GO:0045226) extracellular polysaccharide metabolic process(GO:0046379) |
| 0.3 | 7.6 | GO:0006890 | retrograde vesicle-mediated transport, Golgi to ER(GO:0006890) |
| 0.3 | 1.3 | GO:0033685 | negative regulation of luteinizing hormone secretion(GO:0033685) |
| 0.2 | 2.7 | GO:0001731 | formation of translation preinitiation complex(GO:0001731) |
| 0.2 | 4.4 | GO:1905144 | acetylcholine receptor signaling pathway(GO:0095500) signal transduction involved in cellular response to ammonium ion(GO:1903831) response to acetylcholine(GO:1905144) cellular response to acetylcholine(GO:1905145) |
| 0.2 | 2.9 | GO:0019934 | cGMP-mediated signaling(GO:0019934) |
| 0.2 | 7.1 | GO:0000028 | ribosomal small subunit assembly(GO:0000028) |
| 0.2 | 9.9 | GO:0006096 | glycolytic process(GO:0006096) |
| 0.2 | 3.6 | GO:0000027 | ribosomal large subunit assembly(GO:0000027) |
| 0.2 | 2.5 | GO:0072431 | DNA damage response, signal transduction by p53 class mediator resulting in cell cycle arrest(GO:0006977) signal transduction involved in mitotic G1 DNA damage checkpoint(GO:0072431) intracellular signal transduction involved in G1 DNA damage checkpoint(GO:1902400) |
| 0.2 | 3.0 | GO:0000470 | maturation of LSU-rRNA(GO:0000470) |
| 0.2 | 3.2 | GO:0006198 | cAMP catabolic process(GO:0006198) |
| 0.2 | 1.9 | GO:0060967 | negative regulation of posttranscriptional gene silencing(GO:0060149) negative regulation of gene silencing by RNA(GO:0060967) |
| 0.2 | 20.8 | GO:0006413 | translational initiation(GO:0006413) |
| 0.2 | 1.6 | GO:0033234 | negative regulation of protein sumoylation(GO:0033234) |
| 0.2 | 1.8 | GO:1904251 | regulation of bile acid metabolic process(GO:1904251) |
| 0.2 | 1.2 | GO:0030321 | transepithelial chloride transport(GO:0030321) |
| 0.2 | 6.4 | GO:0000186 | activation of MAPKK activity(GO:0000186) |
| 0.2 | 2.3 | GO:0048268 | clathrin coat assembly(GO:0048268) |
| 0.2 | 1.9 | GO:0010248 | establishment or maintenance of transmembrane electrochemical gradient(GO:0010248) |
| 0.2 | 1.7 | GO:0033504 | floor plate development(GO:0033504) |
| 0.2 | 1.6 | GO:0042501 | regulation of peptidyl-serine phosphorylation of STAT protein(GO:0033139) positive regulation of peptidyl-serine phosphorylation of STAT protein(GO:0033141) serine phosphorylation of STAT protein(GO:0042501) |
| 0.2 | 4.9 | GO:0046426 | negative regulation of JAK-STAT cascade(GO:0046426) negative regulation of STAT cascade(GO:1904893) |
| 0.2 | 15.8 | GO:1903955 | positive regulation of protein targeting to mitochondrion(GO:1903955) |
| 0.2 | 3.3 | GO:0007602 | phototransduction(GO:0007602) |
| 0.2 | 2.7 | GO:0015012 | heparan sulfate proteoglycan biosynthetic process(GO:0015012) |
| 0.2 | 0.3 | GO:0032621 | interleukin-18 production(GO:0032621) regulation of interleukin-18 production(GO:0032661) positive regulation of interleukin-18 production(GO:0032741) |
| 0.2 | 0.9 | GO:1904261 | regulation of basement membrane assembly involved in embryonic body morphogenesis(GO:1904259) positive regulation of basement membrane assembly involved in embryonic body morphogenesis(GO:1904261) basement membrane assembly involved in embryonic body morphogenesis(GO:2001197) |
| 0.2 | 0.8 | GO:0010032 | meiotic chromosome condensation(GO:0010032) |
| 0.2 | 2.5 | GO:0035235 | ionotropic glutamate receptor signaling pathway(GO:0035235) |
| 0.1 | 0.9 | GO:0001842 | neural fold formation(GO:0001842) |
| 0.1 | 3.5 | GO:0045214 | sarcomere organization(GO:0045214) |
| 0.1 | 2.8 | GO:0007257 | activation of JUN kinase activity(GO:0007257) |
| 0.1 | 3.0 | GO:0045616 | regulation of keratinocyte differentiation(GO:0045616) |
| 0.1 | 8.6 | GO:0046330 | positive regulation of JNK cascade(GO:0046330) |
| 0.1 | 3.6 | GO:0002181 | cytoplasmic translation(GO:0002181) |
| 0.1 | 2.8 | GO:0031163 | iron-sulfur cluster assembly(GO:0016226) metallo-sulfur cluster assembly(GO:0031163) |
| 0.1 | 1.5 | GO:0021521 | ventral spinal cord interneuron specification(GO:0021521) cell fate specification involved in pattern specification(GO:0060573) |
| 0.1 | 2.0 | GO:0002115 | store-operated calcium entry(GO:0002115) |
| 0.1 | 2.6 | GO:1902475 | L-alpha-amino acid transmembrane transport(GO:1902475) |
| 0.1 | 9.9 | GO:0006338 | chromatin remodeling(GO:0006338) |
| 0.1 | 8.3 | GO:2001237 | negative regulation of extrinsic apoptotic signaling pathway(GO:2001237) |
| 0.1 | 2.5 | GO:0060997 | dendritic spine morphogenesis(GO:0060997) |
| 0.1 | 4.7 | GO:0007091 | metaphase/anaphase transition of mitotic cell cycle(GO:0007091) regulation of mitotic sister chromatid separation(GO:0010965) metaphase/anaphase transition of cell cycle(GO:0044784) |
| 0.1 | 0.6 | GO:0015860 | purine nucleoside transmembrane transport(GO:0015860) |
| 0.1 | 3.5 | GO:0097421 | liver regeneration(GO:0097421) |
| 0.1 | 1.1 | GO:0044819 | mitotic G1 DNA damage checkpoint(GO:0031571) mitotic G1/S transition checkpoint(GO:0044819) |
| 0.1 | 2.8 | GO:0034314 | Arp2/3 complex-mediated actin nucleation(GO:0034314) |
| 0.1 | 1.8 | GO:0007617 | mating behavior(GO:0007617) multi-organism reproductive behavior(GO:0044705) |
| 0.1 | 1.3 | GO:2000678 | negative regulation of transcription regulatory region DNA binding(GO:2000678) |
| 0.1 | 1.0 | GO:0097034 | mitochondrial respiratory chain complex IV assembly(GO:0033617) mitochondrial respiratory chain complex IV biogenesis(GO:0097034) |
| 0.1 | 1.1 | GO:0033147 | negative regulation of intracellular estrogen receptor signaling pathway(GO:0033147) |
| 0.1 | 0.9 | GO:0006120 | mitochondrial electron transport, NADH to ubiquinone(GO:0006120) |
| 0.1 | 3.2 | GO:0000413 | protein peptidyl-prolyl isomerization(GO:0000413) |
| 0.1 | 0.1 | GO:0002589 | regulation of antigen processing and presentation of peptide antigen via MHC class I(GO:0002589) |
| 0.1 | 8.2 | GO:0006457 | protein folding(GO:0006457) |
| 0.1 | 0.3 | GO:1904781 | regulation of protein localization to centrosome(GO:1904779) positive regulation of protein localization to centrosome(GO:1904781) |
| 0.1 | 2.2 | GO:0000184 | nuclear-transcribed mRNA catabolic process, nonsense-mediated decay(GO:0000184) |
| 0.1 | 1.3 | GO:0007064 | mitotic sister chromatid cohesion(GO:0007064) |
| 0.1 | 0.8 | GO:0031167 | rRNA methylation(GO:0031167) |
| 0.1 | 1.3 | GO:0021696 | cerebellar cortex morphogenesis(GO:0021696) |
| 0.0 | 0.7 | GO:0007095 | mitotic G2 DNA damage checkpoint(GO:0007095) G2 DNA damage checkpoint(GO:0031572) |
| 0.0 | 0.7 | GO:0019236 | response to pheromone(GO:0019236) |
| 0.0 | 1.1 | GO:0045739 | positive regulation of DNA repair(GO:0045739) |
| 0.0 | 0.6 | GO:0045738 | negative regulation of DNA repair(GO:0045738) negative regulation of double-strand break repair(GO:2000780) |
| 0.0 | 0.6 | GO:0042347 | negative regulation of NF-kappaB import into nucleus(GO:0042347) |
| 0.0 | 0.2 | GO:0060290 | transdifferentiation(GO:0060290) |
| 0.0 | 1.0 | GO:0006376 | mRNA splice site selection(GO:0006376) |
| 0.0 | 0.0 | GO:2000373 | regulation of isomerase activity(GO:0010911) positive regulation of isomerase activity(GO:0010912) regulation of DNA topoisomerase (ATP-hydrolyzing) activity(GO:2000371) positive regulation of DNA topoisomerase (ATP-hydrolyzing) activity(GO:2000373) |
| 0.0 | 0.3 | GO:0051132 | NK T cell activation(GO:0051132) |
| 0.0 | 1.3 | GO:0072384 | organelle transport along microtubule(GO:0072384) |
| 0.0 | 1.8 | GO:0006919 | activation of cysteine-type endopeptidase activity involved in apoptotic process(GO:0006919) |
| 0.0 | 0.3 | GO:0007413 | axonal fasciculation(GO:0007413) |
| 0.0 | 3.5 | GO:0042787 | protein ubiquitination involved in ubiquitin-dependent protein catabolic process(GO:0042787) |
| 0.0 | 0.8 | GO:0021522 | spinal cord motor neuron differentiation(GO:0021522) |
| 0.0 | 1.6 | GO:0030433 | ER-associated ubiquitin-dependent protein catabolic process(GO:0030433) |
| 0.0 | 1.5 | GO:0030216 | keratinocyte differentiation(GO:0030216) |
| 0.0 | 0.2 | GO:0097201 | negative regulation of transcription from RNA polymerase II promoter in response to stress(GO:0097201) |
| 0.0 | 1.2 | GO:0045576 | mast cell activation(GO:0045576) |
| 0.0 | 2.4 | GO:0006364 | rRNA processing(GO:0006364) |
| 0.0 | 1.2 | GO:0048024 | regulation of mRNA splicing, via spliceosome(GO:0048024) |
| 0.0 | 2.3 | GO:0007519 | skeletal muscle tissue development(GO:0007519) |
| 0.0 | 0.3 | GO:0060219 | camera-type eye photoreceptor cell differentiation(GO:0060219) |
| 0.0 | 0.6 | GO:0042773 | ATP synthesis coupled electron transport(GO:0042773) |
| 0.0 | 0.3 | GO:0006779 | porphyrin-containing compound biosynthetic process(GO:0006779) |
| 0.0 | 0.1 | GO:0060252 | positive regulation of glial cell proliferation(GO:0060252) |
| 0.0 | 1.0 | GO:1902600 | hydrogen ion transmembrane transport(GO:1902600) |
| 0.0 | 0.9 | GO:0050728 | negative regulation of inflammatory response(GO:0050728) |
| 0.0 | 0.8 | GO:0042633 | molting cycle(GO:0042303) hair cycle(GO:0042633) |
| 0.0 | 0.8 | GO:0042147 | retrograde transport, endosome to Golgi(GO:0042147) |
| 0.0 | 0.2 | GO:0036065 | fucosylation(GO:0036065) |
| 0.0 | 1.3 | GO:0006261 | DNA-dependent DNA replication(GO:0006261) |
Gene overrepresentation in cellular component category:
| Log-likelihood per target | Total log-likelihood | Term | Description |
|---|---|---|---|
| 11.2 | 44.7 | GO:0098574 | cytoplasmic side of lysosomal membrane(GO:0098574) |
| 6.0 | 71.8 | GO:0005861 | troponin complex(GO:0005861) |
| 5.4 | 16.2 | GO:1990015 | mesaxon(GO:0097453) ensheathing process(GO:1990015) |
| 4.1 | 33.2 | GO:0097452 | GAIT complex(GO:0097452) |
| 4.0 | 11.9 | GO:0005592 | collagen type XI trimer(GO:0005592) |
| 3.7 | 14.9 | GO:0038037 | G-protein coupled receptor dimeric complex(GO:0038037) G-protein coupled receptor complex(GO:0097648) |
| 3.1 | 12.4 | GO:0033018 | sarcoplasmic reticulum lumen(GO:0033018) |
| 3.1 | 15.3 | GO:0044316 | cone cell pedicle(GO:0044316) |
| 2.7 | 53.9 | GO:0001518 | voltage-gated sodium channel complex(GO:0001518) |
| 2.6 | 23.3 | GO:0005826 | actomyosin contractile ring(GO:0005826) |
| 2.6 | 7.8 | GO:0005896 | interleukin-6 receptor complex(GO:0005896) |
| 2.5 | 24.8 | GO:0048787 | presynaptic active zone membrane(GO:0048787) |
| 2.2 | 8.7 | GO:0030121 | AP-1 adaptor complex(GO:0030121) |
| 2.1 | 16.5 | GO:0065010 | extracellular membrane-bounded organelle(GO:0065010) |
| 2.0 | 16.3 | GO:0044305 | calyx of Held(GO:0044305) |
| 2.0 | 45.9 | GO:0098563 | integral component of synaptic vesicle membrane(GO:0030285) intrinsic component of synaptic vesicle membrane(GO:0098563) |
| 2.0 | 15.7 | GO:0043203 | axon hillock(GO:0043203) |
| 1.9 | 28.7 | GO:0034709 | methylosome(GO:0034709) |
| 1.9 | 83.9 | GO:0031672 | A band(GO:0031672) |
| 1.8 | 18.2 | GO:0042788 | polysomal ribosome(GO:0042788) |
| 1.7 | 5.2 | GO:0008275 | gamma-tubulin large complex(GO:0000931) gamma-tubulin ring complex(GO:0008274) gamma-tubulin small complex(GO:0008275) |
| 1.7 | 18.7 | GO:0034663 | endoplasmic reticulum chaperone complex(GO:0034663) |
| 1.7 | 20.3 | GO:0005859 | muscle myosin complex(GO:0005859) |
| 1.6 | 9.3 | GO:0032983 | kainate selective glutamate receptor complex(GO:0032983) |
| 1.5 | 9.2 | GO:0097441 | basilar dendrite(GO:0097441) |
| 1.5 | 7.4 | GO:0098831 | presynaptic active zone cytoplasmic component(GO:0098831) |
| 1.4 | 8.5 | GO:0044308 | axonal spine(GO:0044308) |
| 1.4 | 4.1 | GO:0005594 | collagen type IX trimer(GO:0005594) |
| 1.3 | 28.1 | GO:1902710 | GABA receptor complex(GO:1902710) GABA-A receptor complex(GO:1902711) |
| 1.3 | 2.6 | GO:0070033 | synaptobrevin 2-SNAP-25-syntaxin-1a-complexin II complex(GO:0070033) |
| 1.2 | 8.5 | GO:0000137 | Golgi cis cisterna(GO:0000137) |
| 1.2 | 116.3 | GO:0000786 | nucleosome(GO:0000786) |
| 1.1 | 1.1 | GO:0033655 | host cell cytoplasm(GO:0030430) host cell cytoplasm part(GO:0033655) |
| 1.1 | 10.0 | GO:0005742 | mitochondrial outer membrane translocase complex(GO:0005742) |
| 1.1 | 6.6 | GO:1990246 | uniplex complex(GO:1990246) |
| 1.0 | 5.2 | GO:0030314 | junctional membrane complex(GO:0030314) |
| 1.0 | 4.1 | GO:0097149 | centralspindlin complex(GO:0097149) |
| 1.0 | 3.0 | GO:0097058 | CRLF-CLCF1 complex(GO:0097058) |
| 1.0 | 4.9 | GO:0070552 | BRISC complex(GO:0070552) |
| 1.0 | 8.6 | GO:0071821 | FANCM-MHF complex(GO:0071821) |
| 0.9 | 3.8 | GO:1990630 | IRE1-RACK1-PP2A complex(GO:1990630) |
| 0.9 | 8.1 | GO:0019773 | proteasome core complex, alpha-subunit complex(GO:0019773) |
| 0.9 | 3.5 | GO:0005927 | muscle tendon junction(GO:0005927) |
| 0.8 | 6.8 | GO:0042105 | alpha-beta T cell receptor complex(GO:0042105) |
| 0.8 | 2.5 | GO:1990730 | VCP-NSFL1C complex(GO:1990730) |
| 0.8 | 4.8 | GO:0031428 | box C/D snoRNP complex(GO:0031428) |
| 0.8 | 11.2 | GO:0016514 | SWI/SNF complex(GO:0016514) |
| 0.8 | 6.1 | GO:0016272 | prefoldin complex(GO:0016272) |
| 0.7 | 7.4 | GO:0031143 | pseudopodium(GO:0031143) |
| 0.7 | 97.9 | GO:0031674 | I band(GO:0031674) |
| 0.7 | 7.3 | GO:0042101 | T cell receptor complex(GO:0042101) |
| 0.7 | 54.9 | GO:0030016 | myofibril(GO:0030016) |
| 0.7 | 61.9 | GO:0001750 | photoreceptor outer segment(GO:0001750) |
| 0.7 | 9.2 | GO:0032426 | stereocilium tip(GO:0032426) |
| 0.7 | 8.5 | GO:0001931 | uropod(GO:0001931) cell trailing edge(GO:0031254) |
| 0.7 | 2.1 | GO:0032398 | MHC class Ib protein complex(GO:0032398) |
| 0.7 | 2.1 | GO:0005943 | phosphatidylinositol 3-kinase complex, class IA(GO:0005943) |
| 0.7 | 19.7 | GO:0048786 | presynaptic active zone(GO:0048786) |
| 0.7 | 4.7 | GO:0070761 | pre-snoRNP complex(GO:0070761) |
| 0.7 | 10.7 | GO:0042613 | MHC class II protein complex(GO:0042613) |
| 0.7 | 20.6 | GO:0032281 | AMPA glutamate receptor complex(GO:0032281) |
| 0.6 | 3.2 | GO:0044530 | supraspliceosomal complex(GO:0044530) |
| 0.6 | 4.5 | GO:0071986 | Ragulator complex(GO:0071986) |
| 0.6 | 7.3 | GO:0005796 | Golgi lumen(GO:0005796) |
| 0.6 | 3.0 | GO:0097361 | CIA complex(GO:0097361) |
| 0.6 | 4.1 | GO:0071598 | neuronal ribonucleoprotein granule(GO:0071598) |
| 0.6 | 9.3 | GO:0017146 | NMDA selective glutamate receptor complex(GO:0017146) |
| 0.6 | 9.3 | GO:0044292 | dendrite terminus(GO:0044292) |
| 0.5 | 5.5 | GO:0000445 | THO complex(GO:0000347) THO complex part of transcription export complex(GO:0000445) |
| 0.5 | 8.1 | GO:0043194 | axon initial segment(GO:0043194) |
| 0.5 | 2.7 | GO:0097165 | nuclear stress granule(GO:0097165) |
| 0.5 | 4.7 | GO:0005952 | cAMP-dependent protein kinase complex(GO:0005952) |
| 0.5 | 2.0 | GO:0031074 | nucleocytoplasmic shuttling complex(GO:0031074) |
| 0.5 | 2.4 | GO:0071797 | LUBAC complex(GO:0071797) |
| 0.5 | 5.3 | GO:0008385 | IkappaB kinase complex(GO:0008385) |
| 0.5 | 24.2 | GO:0030864 | cortical actin cytoskeleton(GO:0030864) |
| 0.5 | 6.1 | GO:0000276 | mitochondrial proton-transporting ATP synthase complex, coupling factor F(o)(GO:0000276) |
| 0.5 | 4.1 | GO:0005688 | U6 snRNP(GO:0005688) |
| 0.5 | 5.0 | GO:0005833 | hemoglobin complex(GO:0005833) |
| 0.4 | 1.7 | GO:0033643 | host cell part(GO:0033643) |
| 0.4 | 2.1 | GO:0045252 | oxoglutarate dehydrogenase complex(GO:0045252) |
| 0.4 | 2.1 | GO:1990696 | stereocilia ankle link complex(GO:0002142) USH2 complex(GO:1990696) |
| 0.4 | 34.4 | GO:0022625 | cytosolic large ribosomal subunit(GO:0022625) |
| 0.4 | 29.1 | GO:0022627 | cytosolic small ribosomal subunit(GO:0022627) |
| 0.4 | 1.1 | GO:1990812 | growth cone filopodium(GO:1990812) |
| 0.4 | 3.7 | GO:0044613 | nuclear pore central transport channel(GO:0044613) |
| 0.4 | 5.8 | GO:0005753 | mitochondrial proton-transporting ATP synthase complex(GO:0005753) |
| 0.4 | 26.1 | GO:0045095 | keratin filament(GO:0045095) |
| 0.4 | 3.5 | GO:0031091 | platelet alpha granule(GO:0031091) |
| 0.3 | 2.7 | GO:0033290 | eukaryotic 43S preinitiation complex(GO:0016282) eukaryotic 48S preinitiation complex(GO:0033290) |
| 0.3 | 12.6 | GO:0042734 | presynaptic membrane(GO:0042734) |
| 0.3 | 1.3 | GO:0035363 | histone locus body(GO:0035363) |
| 0.3 | 7.0 | GO:0046658 | anchored component of plasma membrane(GO:0046658) |
| 0.3 | 8.9 | GO:0030863 | cortical cytoskeleton(GO:0030863) |
| 0.3 | 7.2 | GO:0031594 | neuromuscular junction(GO:0031594) |
| 0.3 | 7.8 | GO:0000159 | protein phosphatase type 2A complex(GO:0000159) |
| 0.3 | 7.8 | GO:0005905 | clathrin-coated pit(GO:0005905) |
| 0.3 | 5.1 | GO:0035098 | ESC/E(Z) complex(GO:0035098) |
| 0.3 | 8.0 | GO:0022624 | proteasome accessory complex(GO:0022624) |
| 0.3 | 56.0 | GO:0005802 | trans-Golgi network(GO:0005802) |
| 0.3 | 8.0 | GO:0034451 | centriolar satellite(GO:0034451) |
| 0.3 | 69.6 | GO:0014069 | postsynaptic density(GO:0014069) |
| 0.3 | 17.5 | GO:0030672 | synaptic vesicle membrane(GO:0030672) exocytic vesicle membrane(GO:0099501) |
| 0.3 | 6.6 | GO:0005763 | organellar small ribosomal subunit(GO:0000314) mitochondrial small ribosomal subunit(GO:0005763) |
| 0.3 | 3.2 | GO:0005885 | Arp2/3 protein complex(GO:0005885) |
| 0.3 | 0.8 | GO:0030906 | retromer, cargo-selective complex(GO:0030906) |
| 0.3 | 11.4 | GO:0043679 | axon terminus(GO:0043679) |
| 0.2 | 4.9 | GO:0019908 | nuclear cyclin-dependent protein kinase holoenzyme complex(GO:0019908) |
| 0.2 | 21.5 | GO:0030117 | membrane coat(GO:0030117) coated membrane(GO:0048475) |
| 0.2 | 24.6 | GO:0055037 | recycling endosome(GO:0055037) |
| 0.2 | 4.3 | GO:0032590 | dendrite membrane(GO:0032590) |
| 0.2 | 3.3 | GO:0005839 | proteasome core complex(GO:0005839) |
| 0.2 | 1.8 | GO:0034366 | spherical high-density lipoprotein particle(GO:0034366) |
| 0.2 | 4.1 | GO:0010369 | chromocenter(GO:0010369) |
| 0.2 | 8.9 | GO:0030173 | integral component of Golgi membrane(GO:0030173) |
| 0.2 | 5.3 | GO:0005834 | heterotrimeric G-protein complex(GO:0005834) |
| 0.2 | 3.1 | GO:0005790 | smooth endoplasmic reticulum(GO:0005790) |
| 0.2 | 3.2 | GO:0002102 | podosome(GO:0002102) |
| 0.2 | 1.1 | GO:1990635 | proximal dendrite(GO:1990635) |
| 0.2 | 9.7 | GO:0000315 | organellar large ribosomal subunit(GO:0000315) mitochondrial large ribosomal subunit(GO:0005762) |
| 0.2 | 0.8 | GO:0045009 | melanosome membrane(GO:0033162) chitosome(GO:0045009) |
| 0.2 | 26.3 | GO:0098793 | presynapse(GO:0098793) |
| 0.1 | 9.7 | GO:0045211 | postsynaptic membrane(GO:0045211) |
| 0.1 | 6.5 | GO:0009295 | nucleoid(GO:0009295) mitochondrial nucleoid(GO:0042645) |
| 0.1 | 9.4 | GO:0043204 | perikaryon(GO:0043204) |
| 0.1 | 0.6 | GO:0005642 | annulate lamellae(GO:0005642) |
| 0.1 | 0.7 | GO:0016600 | flotillin complex(GO:0016600) |
| 0.1 | 0.7 | GO:0071541 | eukaryotic translation initiation factor 3 complex, eIF3m(GO:0071541) |
| 0.1 | 3.4 | GO:0000307 | cyclin-dependent protein kinase holoenzyme complex(GO:0000307) |
| 0.1 | 0.6 | GO:0005851 | eukaryotic translation initiation factor 2B complex(GO:0005851) |
| 0.1 | 31.0 | GO:0009897 | external side of plasma membrane(GO:0009897) |
| 0.1 | 1.3 | GO:0097431 | mitotic spindle pole(GO:0097431) |
| 0.1 | 0.8 | GO:0000796 | condensin complex(GO:0000796) |
| 0.1 | 2.3 | GO:0035145 | exon-exon junction complex(GO:0035145) |
| 0.1 | 0.9 | GO:0045180 | basal cortex(GO:0045180) |
| 0.1 | 6.4 | GO:0005791 | rough endoplasmic reticulum(GO:0005791) |
| 0.1 | 5.2 | GO:0005902 | microvillus(GO:0005902) |
| 0.1 | 0.9 | GO:0031010 | ISWI-type complex(GO:0031010) |
| 0.1 | 5.0 | GO:0005884 | actin filament(GO:0005884) |
| 0.1 | 0.9 | GO:0000176 | nuclear exosome (RNase complex)(GO:0000176) |
| 0.1 | 0.3 | GO:0032009 | early phagosome(GO:0032009) |
| 0.1 | 5.0 | GO:0005840 | ribosome(GO:0005840) |
| 0.1 | 0.3 | GO:0033588 | Elongator holoenzyme complex(GO:0033588) |
| 0.1 | 1.9 | GO:0031519 | PcG protein complex(GO:0031519) |
| 0.1 | 7.1 | GO:0043209 | myelin sheath(GO:0043209) |
| 0.0 | 3.7 | GO:0042383 | sarcolemma(GO:0042383) |
| 0.0 | 4.6 | GO:0032993 | protein-DNA complex(GO:0032993) |
| 0.0 | 11.0 | GO:0043025 | neuronal cell body(GO:0043025) |
| 0.0 | 2.9 | GO:0016605 | PML body(GO:0016605) |
| 0.0 | 0.9 | GO:0097517 | stress fiber(GO:0001725) contractile actin filament bundle(GO:0097517) |
| 0.0 | 0.1 | GO:0042405 | nuclear inclusion body(GO:0042405) |
| 0.0 | 3.8 | GO:0031965 | nuclear membrane(GO:0031965) |
| 0.0 | 0.2 | GO:0034045 | pre-autophagosomal structure membrane(GO:0034045) |
| 0.0 | 1.0 | GO:0005643 | nuclear pore(GO:0005643) |
| 0.0 | 1.4 | GO:0071013 | catalytic step 2 spliceosome(GO:0071013) |
| 0.0 | 0.8 | GO:0005758 | mitochondrial intermembrane space(GO:0005758) |
| 0.0 | 0.6 | GO:0030964 | mitochondrial respiratory chain complex I(GO:0005747) NADH dehydrogenase complex(GO:0030964) respiratory chain complex I(GO:0045271) |
Gene overrepresentation in molecular function category:
| Log-likelihood per target | Total log-likelihood | Term | Description |
|---|---|---|---|
| 9.8 | 29.5 | GO:0071885 | N-terminal protein N-methyltransferase activity(GO:0071885) |
| 8.8 | 35.3 | GO:0046538 | bisphosphoglycerate mutase activity(GO:0004082) phosphoglycerate mutase activity(GO:0004619) 2,3-bisphosphoglycerate-dependent phosphoglycerate mutase activity(GO:0046538) |
| 7.7 | 30.9 | GO:0004365 | glyceraldehyde-3-phosphate dehydrogenase (NAD+) (phosphorylating) activity(GO:0004365) glyceraldehyde-3-phosphate dehydrogenase (NAD(P)+) (phosphorylating) activity(GO:0043891) |
| 5.8 | 17.5 | GO:0003953 | NAD+ nucleosidase activity(GO:0003953) |
| 5.5 | 38.2 | GO:0031014 | troponin T binding(GO:0031014) |
| 4.9 | 29.7 | GO:0005338 | nucleotide-sugar transmembrane transporter activity(GO:0005338) |
| 4.5 | 31.6 | GO:0004332 | fructose-bisphosphate aldolase activity(GO:0004332) |
| 4.2 | 12.7 | GO:0003828 | alpha-N-acetylneuraminate alpha-2,8-sialyltransferase activity(GO:0003828) |
| 4.1 | 12.3 | GO:0035403 | histone kinase activity (H3-T6 specific)(GO:0035403) |
| 3.9 | 15.7 | GO:0004052 | arachidonate 12-lipoxygenase activity(GO:0004052) |
| 3.5 | 21.0 | GO:0008889 | glycerophosphodiester phosphodiesterase activity(GO:0008889) |
| 3.4 | 10.2 | GO:0001565 | phorbol ester receptor activity(GO:0001565) |
| 3.3 | 9.8 | GO:0005294 | neutral L-amino acid secondary active transmembrane transporter activity(GO:0005294) |
| 3.1 | 15.3 | GO:0005280 | hydrogen:amino acid symporter activity(GO:0005280) |
| 3.0 | 9.0 | GO:0016748 | succinyltransferase activity(GO:0016748) |
| 2.9 | 8.7 | GO:1901375 | acetylcholine transmembrane transporter activity(GO:0005277) acetate ester transmembrane transporter activity(GO:1901375) |
| 2.9 | 14.5 | GO:0035241 | protein-arginine omega-N monomethyltransferase activity(GO:0035241) |
| 2.8 | 39.4 | GO:0051378 | serotonin binding(GO:0051378) |
| 2.8 | 13.8 | GO:0070739 | protein-glutamic acid ligase activity(GO:0070739) |
| 2.6 | 41.7 | GO:0005523 | tropomyosin binding(GO:0005523) |
| 2.5 | 10.0 | GO:0060072 | large conductance calcium-activated potassium channel activity(GO:0060072) |
| 2.4 | 14.3 | GO:0008467 | [heparan sulfate]-glucosamine 3-sulfotransferase 1 activity(GO:0008467) |
| 2.4 | 19.0 | GO:0044323 | retinoic acid-responsive element binding(GO:0044323) |
| 2.2 | 42.5 | GO:0008179 | adenylate cyclase binding(GO:0008179) |
| 2.2 | 6.7 | GO:0097363 | protein O-GlcNAc transferase activity(GO:0097363) |
| 2.2 | 6.6 | GO:0030158 | protein xylosyltransferase activity(GO:0030158) |
| 2.2 | 6.6 | GO:0015292 | uniporter activity(GO:0015292) |
| 2.2 | 8.6 | GO:0001642 | group III metabotropic glutamate receptor activity(GO:0001642) |
| 2.1 | 14.9 | GO:0098988 | G-protein coupled glutamate receptor activity(GO:0098988) |
| 2.0 | 6.1 | GO:0047237 | glucuronylgalactosylproteoglycan 4-beta-N-acetylgalactosaminyltransferase activity(GO:0047237) |
| 2.0 | 55.0 | GO:0031402 | sodium ion binding(GO:0031402) |
| 1.9 | 13.0 | GO:0030160 | GKAP/Homer scaffold activity(GO:0030160) |
| 1.9 | 14.9 | GO:0016308 | 1-phosphatidylinositol-4-phosphate 5-kinase activity(GO:0016308) |
| 1.9 | 5.6 | GO:0001011 | transcription factor activity, sequence-specific DNA binding, RNA polymerase recruiting(GO:0001011) transcription factor activity, TFIIB-class binding(GO:0001087) |
| 1.9 | 26.0 | GO:0005237 | inhibitory extracellular ligand-gated ion channel activity(GO:0005237) |
| 1.8 | 5.5 | GO:0033222 | xylose binding(GO:0033222) |
| 1.8 | 9.2 | GO:0048248 | CXCR3 chemokine receptor binding(GO:0048248) |
| 1.8 | 11.0 | GO:0031698 | beta-2 adrenergic receptor binding(GO:0031698) |
| 1.8 | 9.1 | GO:0030348 | syntaxin-3 binding(GO:0030348) |
| 1.8 | 16.3 | GO:0019992 | diacylglycerol binding(GO:0019992) |
| 1.8 | 9.1 | GO:0005314 | high-affinity glutamate transmembrane transporter activity(GO:0005314) |
| 1.8 | 10.8 | GO:0005005 | transmembrane-ephrin receptor activity(GO:0005005) |
| 1.8 | 10.8 | GO:0005138 | interleukin-6 receptor binding(GO:0005138) |
| 1.6 | 39.6 | GO:0080025 | phosphatidylinositol-3,5-bisphosphate binding(GO:0080025) |
| 1.6 | 9.3 | GO:0015277 | kainate selective glutamate receptor activity(GO:0015277) |
| 1.5 | 57.0 | GO:0005246 | calcium channel regulator activity(GO:0005246) |
| 1.5 | 16.7 | GO:0031681 | G-protein beta-subunit binding(GO:0031681) |
| 1.5 | 6.0 | GO:0004822 | isoleucine-tRNA ligase activity(GO:0004822) |
| 1.5 | 15.0 | GO:0032036 | myosin heavy chain binding(GO:0032036) |
| 1.5 | 4.5 | GO:0004852 | uroporphyrinogen-III synthase activity(GO:0004852) |
| 1.5 | 20.3 | GO:0030898 | actin-dependent ATPase activity(GO:0030898) |
| 1.4 | 34.7 | GO:0017075 | syntaxin-1 binding(GO:0017075) |
| 1.4 | 8.6 | GO:0004616 | phosphogluconate dehydrogenase (decarboxylating) activity(GO:0004616) |
| 1.4 | 7.1 | GO:0004969 | histamine receptor activity(GO:0004969) |
| 1.4 | 18.4 | GO:0045294 | alpha-catenin binding(GO:0045294) |
| 1.4 | 8.3 | GO:0001602 | pancreatic polypeptide receptor activity(GO:0001602) |
| 1.3 | 5.2 | GO:0005219 | ryanodine-sensitive calcium-release channel activity(GO:0005219) |
| 1.2 | 8.5 | GO:0004767 | sphingomyelin phosphodiesterase activity(GO:0004767) |
| 1.2 | 7.0 | GO:0042289 | MHC class II protein binding(GO:0042289) |
| 1.2 | 8.2 | GO:0070095 | fructose-6-phosphate binding(GO:0070095) |
| 1.1 | 3.4 | GO:0004466 | long-chain-acyl-CoA dehydrogenase activity(GO:0004466) |
| 1.1 | 10.0 | GO:0015266 | protein channel activity(GO:0015266) |
| 1.1 | 3.2 | GO:0004911 | interleukin-2 receptor activity(GO:0004911) |
| 1.1 | 6.4 | GO:0008318 | protein prenyltransferase activity(GO:0008318) |
| 1.1 | 3.2 | GO:0034512 | box C/D snoRNA binding(GO:0034512) |
| 1.1 | 6.3 | GO:0055056 | D-glucose transmembrane transporter activity(GO:0055056) |
| 1.0 | 7.2 | GO:0016286 | small conductance calcium-activated potassium channel activity(GO:0016286) |
| 1.0 | 6.0 | GO:0032027 | myosin light chain binding(GO:0032027) |
| 1.0 | 6.7 | GO:0031433 | telethonin binding(GO:0031433) |
| 0.9 | 2.8 | GO:0031770 | growth hormone-releasing hormone receptor binding(GO:0031770) |
| 0.9 | 2.7 | GO:0097677 | STAT family protein binding(GO:0097677) |
| 0.9 | 14.8 | GO:0023026 | MHC class II protein complex binding(GO:0023026) |
| 0.9 | 25.7 | GO:0005184 | neuropeptide hormone activity(GO:0005184) |
| 0.8 | 8.3 | GO:0009922 | fatty acid elongase activity(GO:0009922) 3-oxo-arachidoyl-CoA synthase activity(GO:0102336) 3-oxo-cerotoyl-CoA synthase activity(GO:0102337) 3-oxo-lignoceronyl-CoA synthase activity(GO:0102338) |
| 0.8 | 7.3 | GO:0008320 | protein transmembrane transporter activity(GO:0008320) |
| 0.8 | 8.9 | GO:0004017 | adenylate kinase activity(GO:0004017) |
| 0.8 | 18.6 | GO:0031489 | myosin V binding(GO:0031489) |
| 0.8 | 11.3 | GO:0033691 | sialic acid binding(GO:0033691) |
| 0.8 | 4.0 | GO:0005134 | interleukin-2 receptor binding(GO:0005134) |
| 0.8 | 4.0 | GO:0004614 | phosphoglucomutase activity(GO:0004614) |
| 0.8 | 2.4 | GO:0031721 | hemoglobin alpha binding(GO:0031721) |
| 0.8 | 16.5 | GO:0099589 | G-protein coupled serotonin receptor activity(GO:0004993) serotonin receptor activity(GO:0099589) |
| 0.8 | 16.9 | GO:0005212 | structural constituent of eye lens(GO:0005212) |
| 0.8 | 3.8 | GO:0005105 | type 1 fibroblast growth factor receptor binding(GO:0005105) |
| 0.7 | 9.4 | GO:0017151 | DEAD/H-box RNA helicase binding(GO:0017151) |
| 0.7 | 7.2 | GO:0022821 | potassium:proton antiporter activity(GO:0015386) potassium ion antiporter activity(GO:0022821) |
| 0.7 | 15.1 | GO:0008327 | methyl-CpG binding(GO:0008327) |
| 0.7 | 18.8 | GO:0017091 | AU-rich element binding(GO:0017091) |
| 0.7 | 45.5 | GO:0003743 | translation initiation factor activity(GO:0003743) |
| 0.7 | 15.0 | GO:0030676 | Rac guanyl-nucleotide exchange factor activity(GO:0030676) |
| 0.7 | 14.9 | GO:0004435 | phosphatidylinositol phospholipase C activity(GO:0004435) |
| 0.7 | 4.7 | GO:0008603 | cAMP-dependent protein kinase regulator activity(GO:0008603) |
| 0.7 | 3.3 | GO:0071532 | ankyrin repeat binding(GO:0071532) |
| 0.7 | 4.0 | GO:0004994 | somatostatin receptor activity(GO:0004994) |
| 0.7 | 9.2 | GO:0015279 | store-operated calcium channel activity(GO:0015279) |
| 0.7 | 10.4 | GO:0016881 | acid-amino acid ligase activity(GO:0016881) |
| 0.6 | 5.1 | GO:1990430 | extracellular matrix protein binding(GO:1990430) |
| 0.6 | 5.1 | GO:0004035 | alkaline phosphatase activity(GO:0004035) |
| 0.6 | 2.5 | GO:0004045 | aminoacyl-tRNA hydrolase activity(GO:0004045) |
| 0.6 | 1.9 | GO:0008048 | calcium sensitive guanylate cyclase activator activity(GO:0008048) |
| 0.6 | 6.2 | GO:0003810 | protein-glutamine gamma-glutamyltransferase activity(GO:0003810) |
| 0.6 | 16.5 | GO:0004298 | threonine-type endopeptidase activity(GO:0004298) threonine-type peptidase activity(GO:0070003) |
| 0.6 | 1.8 | GO:0070653 | high-density lipoprotein particle receptor binding(GO:0070653) |
| 0.6 | 3.0 | GO:0030280 | structural constituent of epidermis(GO:0030280) |
| 0.6 | 2.9 | GO:0031779 | melanocortin receptor binding(GO:0031779) type 3 melanocortin receptor binding(GO:0031781) type 4 melanocortin receptor binding(GO:0031782) |
| 0.6 | 2.2 | GO:0003726 | double-stranded RNA adenosine deaminase activity(GO:0003726) |
| 0.5 | 3.2 | GO:0008349 | MAP kinase kinase kinase kinase activity(GO:0008349) |
| 0.5 | 4.2 | GO:0036122 | BMP binding(GO:0036122) |
| 0.5 | 3.2 | GO:0004982 | N-formyl peptide receptor activity(GO:0004982) |
| 0.5 | 2.6 | GO:0004875 | complement receptor activity(GO:0004875) |
| 0.5 | 4.7 | GO:0001094 | TFIID-class transcription factor binding(GO:0001094) |
| 0.5 | 4.4 | GO:0003910 | DNA ligase activity(GO:0003909) DNA ligase (ATP) activity(GO:0003910) |
| 0.5 | 7.6 | GO:0008143 | poly(A) binding(GO:0008143) |
| 0.5 | 4.7 | GO:0070016 | armadillo repeat domain binding(GO:0070016) |
| 0.5 | 1.9 | GO:0008900 | hydrogen:potassium-exchanging ATPase activity(GO:0008900) |
| 0.5 | 3.3 | GO:0008131 | primary amine oxidase activity(GO:0008131) |
| 0.5 | 10.7 | GO:0005227 | calcium activated cation channel activity(GO:0005227) |
| 0.5 | 7.9 | GO:0008253 | 5'-nucleotidase activity(GO:0008253) |
| 0.5 | 1.8 | GO:0004594 | pantothenate kinase activity(GO:0004594) |
| 0.5 | 1.8 | GO:0005136 | interleukin-4 receptor binding(GO:0005136) |
| 0.5 | 6.3 | GO:0017154 | semaphorin receptor activity(GO:0017154) |
| 0.4 | 3.1 | GO:0001609 | G-protein coupled adenosine receptor activity(GO:0001609) |
| 0.4 | 34.3 | GO:0019209 | kinase activator activity(GO:0019209) |
| 0.4 | 1.3 | GO:0051431 | corticotropin-releasing hormone receptor 2 binding(GO:0051431) |
| 0.4 | 29.5 | GO:0005518 | collagen binding(GO:0005518) |
| 0.4 | 2.1 | GO:0052813 | phosphatidylinositol-4,5-bisphosphate 3-kinase activity(GO:0046934) phosphatidylinositol bisphosphate kinase activity(GO:0052813) |
| 0.4 | 2.8 | GO:0005078 | MAP-kinase scaffold activity(GO:0005078) |
| 0.4 | 3.2 | GO:0016176 | superoxide-generating NADPH oxidase activator activity(GO:0016176) |
| 0.4 | 1.2 | GO:0015065 | uridine nucleotide receptor activity(GO:0015065) G-protein coupled pyrimidinergic nucleotide receptor activity(GO:0071553) |
| 0.4 | 1.9 | GO:0034191 | apolipoprotein A-I receptor binding(GO:0034191) |
| 0.4 | 1.1 | GO:0031871 | proteinase activated receptor binding(GO:0031871) |
| 0.4 | 1.5 | GO:0008532 | N-acetyllactosaminide beta-1,3-N-acetylglucosaminyltransferase activity(GO:0008532) |
| 0.4 | 43.3 | GO:0005178 | integrin binding(GO:0005178) |
| 0.4 | 13.3 | GO:0005484 | SNAP receptor activity(GO:0005484) |
| 0.3 | 3.1 | GO:0015093 | manganese ion transmembrane transporter activity(GO:0005384) ferrous iron transmembrane transporter activity(GO:0015093) |
| 0.3 | 7.8 | GO:0005086 | ARF guanyl-nucleotide exchange factor activity(GO:0005086) |
| 0.3 | 3.7 | GO:0005000 | vasopressin receptor activity(GO:0005000) |
| 0.3 | 1.3 | GO:0005534 | galactose binding(GO:0005534) |
| 0.3 | 2.0 | GO:0070180 | large ribosomal subunit rRNA binding(GO:0070180) |
| 0.3 | 6.3 | GO:0008373 | sialyltransferase activity(GO:0008373) |
| 0.3 | 32.0 | GO:0015078 | hydrogen ion transmembrane transporter activity(GO:0015078) |
| 0.3 | 3.8 | GO:0008656 | cysteine-type endopeptidase activator activity involved in apoptotic process(GO:0008656) |
| 0.3 | 4.4 | GO:0030550 | acetylcholine receptor inhibitor activity(GO:0030550) |
| 0.3 | 1.2 | GO:0086056 | voltage-gated calcium channel activity involved in AV node cell action potential(GO:0086056) |
| 0.3 | 6.1 | GO:0001222 | transcription corepressor binding(GO:0001222) |
| 0.3 | 34.8 | GO:0004702 | receptor signaling protein serine/threonine kinase activity(GO:0004702) |
| 0.3 | 4.0 | GO:0015095 | magnesium ion transmembrane transporter activity(GO:0015095) |
| 0.3 | 4.2 | GO:0050308 | sugar-phosphatase activity(GO:0050308) |
| 0.3 | 3.6 | GO:0008061 | chitin binding(GO:0008061) |
| 0.3 | 342.7 | GO:0004984 | olfactory receptor activity(GO:0004984) |
| 0.3 | 2.4 | GO:0047498 | calcium-dependent phospholipase A2 activity(GO:0047498) |
| 0.3 | 7.6 | GO:0042605 | peptide antigen binding(GO:0042605) |
| 0.3 | 3.4 | GO:0043028 | cysteine-type endopeptidase inhibitor activity involved in apoptotic process(GO:0043027) cysteine-type endopeptidase regulator activity involved in apoptotic process(GO:0043028) |
| 0.3 | 6.4 | GO:0003951 | NAD+ kinase activity(GO:0003951) |
| 0.2 | 7.2 | GO:0043531 | ADP binding(GO:0043531) |
| 0.2 | 3.7 | GO:0001594 | trace-amine receptor activity(GO:0001594) |
| 0.2 | 2.2 | GO:0043008 | ATP-dependent protein binding(GO:0043008) |
| 0.2 | 64.0 | GO:0003735 | structural constituent of ribosome(GO:0003735) |
| 0.2 | 2.5 | GO:0009931 | calcium-dependent protein serine/threonine kinase activity(GO:0009931) |
| 0.2 | 2.7 | GO:0005344 | oxygen transporter activity(GO:0005344) |
| 0.2 | 15.3 | GO:0030276 | clathrin binding(GO:0030276) |
| 0.2 | 18.3 | GO:0051087 | chaperone binding(GO:0051087) |
| 0.2 | 3.2 | GO:0004115 | 3',5'-cyclic-AMP phosphodiesterase activity(GO:0004115) |
| 0.2 | 1.7 | GO:0034511 | U3 snoRNA binding(GO:0034511) |
| 0.2 | 1.0 | GO:0050501 | hyaluronan synthase activity(GO:0050501) |
| 0.2 | 7.7 | GO:0005160 | transforming growth factor beta receptor binding(GO:0005160) |
| 0.2 | 5.5 | GO:0031492 | nucleosomal DNA binding(GO:0031492) |
| 0.2 | 3.0 | GO:0008574 | ATP-dependent microtubule motor activity, plus-end-directed(GO:0008574) |
| 0.2 | 1.6 | GO:1990239 | estrogen receptor activity(GO:0030284) steroid hormone binding(GO:1990239) |
| 0.2 | 4.2 | GO:0004623 | phospholipase A2 activity(GO:0004623) |
| 0.2 | 2.4 | GO:0031005 | filamin binding(GO:0031005) |
| 0.2 | 3.9 | GO:0030169 | low-density lipoprotein particle binding(GO:0030169) |
| 0.2 | 13.5 | GO:0008013 | beta-catenin binding(GO:0008013) |
| 0.2 | 33.7 | GO:0042393 | histone binding(GO:0042393) |
| 0.2 | 13.6 | GO:0030165 | PDZ domain binding(GO:0030165) |
| 0.2 | 15.4 | GO:0017048 | Rho GTPase binding(GO:0017048) |
| 0.2 | 15.1 | GO:0008565 | protein transporter activity(GO:0008565) |
| 0.2 | 23.7 | GO:0001078 | transcriptional repressor activity, RNA polymerase II core promoter proximal region sequence-specific binding(GO:0001078) |
| 0.2 | 6.2 | GO:0008307 | structural constituent of muscle(GO:0008307) |
| 0.2 | 1.6 | GO:0005132 | type I interferon receptor binding(GO:0005132) |
| 0.2 | 2.2 | GO:0004622 | lysophospholipase activity(GO:0004622) |
| 0.2 | 3.5 | GO:1990841 | promoter-specific chromatin binding(GO:1990841) |
| 0.2 | 3.5 | GO:0019843 | rRNA binding(GO:0019843) |
| 0.1 | 2.7 | GO:0030371 | translation repressor activity(GO:0030371) |
| 0.1 | 1.7 | GO:0015379 | potassium:chloride symporter activity(GO:0015379) potassium ion symporter activity(GO:0022820) |
| 0.1 | 2.8 | GO:1905030 | voltage-gated sodium channel activity(GO:0005248) voltage-gated ion channel activity involved in regulation of postsynaptic membrane potential(GO:1905030) |
| 0.1 | 5.5 | GO:0017112 | Rab guanyl-nucleotide exchange factor activity(GO:0017112) |
| 0.1 | 15.3 | GO:0019207 | kinase regulator activity(GO:0019207) |
| 0.1 | 9.0 | GO:0051287 | NAD binding(GO:0051287) |
| 0.1 | 1.4 | GO:0008242 | omega peptidase activity(GO:0008242) |
| 0.1 | 3.3 | GO:0030331 | estrogen receptor binding(GO:0030331) |
| 0.1 | 5.6 | GO:0031593 | polyubiquitin binding(GO:0031593) |
| 0.1 | 7.4 | GO:0002039 | p53 binding(GO:0002039) |
| 0.1 | 3.7 | GO:0042805 | actinin binding(GO:0042805) |
| 0.1 | 2.2 | GO:0004890 | GABA-A receptor activity(GO:0004890) |
| 0.1 | 0.8 | GO:0001671 | ATPase activator activity(GO:0001671) |
| 0.1 | 5.2 | GO:0005057 | receptor signaling protein activity(GO:0005057) |
| 0.1 | 4.6 | GO:0032947 | protein complex scaffold(GO:0032947) |
| 0.1 | 0.6 | GO:0034452 | dynactin binding(GO:0034452) |
| 0.1 | 5.4 | GO:0098531 | RNA polymerase II transcription factor activity, ligand-activated sequence-specific DNA binding(GO:0004879) transcription factor activity, direct ligand regulated sequence-specific DNA binding(GO:0098531) |
| 0.1 | 0.3 | GO:0045322 | unmethylated CpG binding(GO:0045322) |
| 0.1 | 6.2 | GO:0033613 | activating transcription factor binding(GO:0033613) |
| 0.1 | 11.5 | GO:0047485 | protein N-terminus binding(GO:0047485) |
| 0.1 | 0.3 | GO:0000822 | inositol hexakisphosphate binding(GO:0000822) |
| 0.1 | 2.0 | GO:0051879 | Hsp90 protein binding(GO:0051879) |
| 0.1 | 1.9 | GO:0005080 | protein kinase C binding(GO:0005080) |
| 0.1 | 3.0 | GO:0097110 | scaffold protein binding(GO:0097110) |
| 0.1 | 14.8 | GO:0019902 | phosphatase binding(GO:0019902) |
| 0.1 | 6.6 | GO:0016247 | channel regulator activity(GO:0016247) |
| 0.1 | 28.4 | GO:0003779 | actin binding(GO:0003779) |
| 0.1 | 0.6 | GO:0031996 | thioesterase binding(GO:0031996) |
| 0.1 | 2.8 | GO:0019894 | kinesin binding(GO:0019894) |
| 0.1 | 3.2 | GO:0003755 | peptidyl-prolyl cis-trans isomerase activity(GO:0003755) |
| 0.1 | 0.8 | GO:0034450 | ubiquitin-ubiquitin ligase activity(GO:0034450) |
| 0.1 | 2.5 | GO:0051117 | ATPase binding(GO:0051117) |
| 0.1 | 0.8 | GO:0008649 | rRNA methyltransferase activity(GO:0008649) |
| 0.1 | 4.0 | GO:0044325 | ion channel binding(GO:0044325) |
| 0.1 | 2.1 | GO:0043548 | phosphatidylinositol 3-kinase binding(GO:0043548) |
| 0.1 | 2.1 | GO:0030332 | cyclin binding(GO:0030332) |
| 0.1 | 1.1 | GO:0070064 | proline-rich region binding(GO:0070064) |
| 0.1 | 4.2 | GO:0003725 | double-stranded RNA binding(GO:0003725) |
| 0.1 | 2.4 | GO:0004177 | aminopeptidase activity(GO:0004177) |
| 0.1 | 3.6 | GO:0004722 | protein serine/threonine phosphatase activity(GO:0004722) |
| 0.1 | 3.2 | GO:0031490 | chromatin DNA binding(GO:0031490) |
| 0.1 | 1.5 | GO:0005385 | zinc ion transmembrane transporter activity(GO:0005385) |
| 0.1 | 8.9 | GO:0035091 | phosphatidylinositol binding(GO:0035091) |
| 0.1 | 2.3 | GO:0004715 | non-membrane spanning protein tyrosine kinase activity(GO:0004715) |
| 0.1 | 1.5 | GO:0008137 | NADH dehydrogenase (ubiquinone) activity(GO:0008137) NADH dehydrogenase (quinone) activity(GO:0050136) |
| 0.1 | 0.2 | GO:0031127 | galactoside 2-alpha-L-fucosyltransferase activity(GO:0008107) alpha-(1,2)-fucosyltransferase activity(GO:0031127) |
| 0.0 | 18.3 | GO:0046982 | protein heterodimerization activity(GO:0046982) |
| 0.0 | 0.2 | GO:0035240 | dopamine binding(GO:0035240) |
| 0.0 | 8.8 | GO:0061630 | ubiquitin protein ligase activity(GO:0061630) |
| 0.0 | 1.8 | GO:0019888 | protein phosphatase regulator activity(GO:0019888) |
| 0.0 | 2.2 | GO:0005089 | Rho guanyl-nucleotide exchange factor activity(GO:0005089) |
| 0.0 | 2.6 | GO:0015179 | L-amino acid transmembrane transporter activity(GO:0015179) |
| 0.0 | 4.9 | GO:0005125 | cytokine activity(GO:0005125) |
| 0.0 | 1.5 | GO:0003899 | DNA-directed RNA polymerase activity(GO:0003899) RNA polymerase activity(GO:0034062) |
| 0.0 | 8.3 | GO:0030246 | carbohydrate binding(GO:0030246) |
| 0.0 | 2.8 | GO:0005179 | hormone activity(GO:0005179) |
| 0.0 | 4.0 | GO:0044822 | mRNA binding(GO:0003729) poly(A) RNA binding(GO:0044822) |
| 0.0 | 1.7 | GO:0001227 | transcriptional repressor activity, RNA polymerase II transcription regulatory region sequence-specific binding(GO:0001227) |
| 0.0 | 0.1 | GO:0034046 | poly(G) binding(GO:0034046) |
| 0.0 | 0.1 | GO:0008508 | bile acid:sodium symporter activity(GO:0008508) |
| 0.0 | 0.2 | GO:0042288 | MHC class I protein binding(GO:0042288) |
Gene overrepresentation in curated gene sets: canonical pathways category:
| Log-likelihood per target | Total log-likelihood | Term | Description |
|---|---|---|---|
| 1.2 | 19.7 | PID TCR RAS PATHWAY | Ras signaling in the CD4+ TCR pathway |
| 1.0 | 50.9 | SIG REGULATION OF THE ACTIN CYTOSKELETON BY RHO GTPASES | Genes related to regulation of the actin cytoskeleton |
| 0.9 | 3.5 | PID WNT NONCANONICAL PATHWAY | Noncanonical Wnt signaling pathway |
| 0.8 | 5.0 | PID EPHB FWD PATHWAY | EPHB forward signaling |
| 0.6 | 24.6 | SIG CD40PATHWAYMAP | Genes related to CD40 signaling |
| 0.5 | 20.6 | PID IL23 PATHWAY | IL23-mediated signaling events |
| 0.5 | 14.1 | PID CXCR3 PATHWAY | CXCR3-mediated signaling events |
| 0.5 | 3.2 | PID TCR JNK PATHWAY | JNK signaling in the CD4+ TCR pathway |
| 0.4 | 4.4 | ST GRANULE CELL SURVIVAL PATHWAY | Granule Cell Survival Pathway is a specific case of more general PAC1 Receptor Pathway. |
| 0.4 | 7.7 | PID AMB2 NEUTROPHILS PATHWAY | amb2 Integrin signaling |
| 0.4 | 12.4 | ST DIFFERENTIATION PATHWAY IN PC12 CELLS | Differentiation Pathway in PC12 Cells; this is a specific case of PAC1 Receptor Pathway. |
| 0.4 | 21.5 | PID TNF PATHWAY | TNF receptor signaling pathway |
| 0.4 | 13.8 | PID BCR 5PATHWAY | BCR signaling pathway |
| 0.4 | 20.4 | PID FOXO PATHWAY | FoxO family signaling |
| 0.4 | 8.6 | PID PRL SIGNALING EVENTS PATHWAY | Signaling events mediated by PRL |
| 0.4 | 5.8 | PID CDC42 REG PATHWAY | Regulation of CDC42 activity |
| 0.4 | 19.3 | PID TCR PATHWAY | TCR signaling in naïve CD4+ T cells |
| 0.4 | 18.9 | PID CDC42 PATHWAY | CDC42 signaling events |
| 0.3 | 8.4 | PID AJDISS 2PATHWAY | Posttranslational regulation of adherens junction stability and dissassembly |
| 0.3 | 5.7 | PID IL8 CXCR2 PATHWAY | IL8- and CXCR2-mediated signaling events |
| 0.3 | 11.9 | NABA PROTEOGLYCANS | Genes encoding proteoglycans |
| 0.3 | 10.3 | PID RAC1 REG PATHWAY | Regulation of RAC1 activity |
| 0.3 | 6.0 | PID CXCR4 PATHWAY | CXCR4-mediated signaling events |
| 0.2 | 2.5 | PID P38 MK2 PATHWAY | p38 signaling mediated by MAPKAP kinases |
| 0.2 | 7.0 | PID MET PATHWAY | Signaling events mediated by Hepatocyte Growth Factor Receptor (c-Met) |
| 0.2 | 2.1 | PID UPA UPAR PATHWAY | Urokinase-type plasminogen activator (uPA) and uPAR-mediated signaling |
| 0.2 | 11.8 | PID REG GR PATHWAY | Glucocorticoid receptor regulatory network |
| 0.2 | 2.6 | PID ALK2 PATHWAY | ALK2 signaling events |
| 0.2 | 4.7 | PID INTEGRIN A4B1 PATHWAY | Alpha4 beta1 integrin signaling events |
| 0.2 | 4.8 | PID RHOA PATHWAY | RhoA signaling pathway |
| 0.2 | 1.7 | PID IL27 PATHWAY | IL27-mediated signaling events |
| 0.2 | 2.9 | PID INSULIN GLUCOSE PATHWAY | Insulin-mediated glucose transport |
| 0.2 | 6.4 | PID P53 REGULATION PATHWAY | p53 pathway |
| 0.2 | 8.2 | PID P75 NTR PATHWAY | p75(NTR)-mediated signaling |
| 0.2 | 8.0 | PID AP1 PATHWAY | AP-1 transcription factor network |
| 0.2 | 3.1 | PID ERBB1 INTERNALIZATION PATHWAY | Internalization of ErbB1 |
| 0.2 | 10.5 | PID HDAC CLASSI PATHWAY | Signaling events mediated by HDAC Class I |
| 0.2 | 3.2 | PID IL2 1PATHWAY | IL2-mediated signaling events |
| 0.2 | 3.5 | PID AURORA A PATHWAY | Aurora A signaling |
| 0.2 | 9.0 | PID E2F PATHWAY | E2F transcription factor network |
| 0.1 | 5.7 | PID PLK1 PATHWAY | PLK1 signaling events |
| 0.1 | 1.7 | PID MAPK TRK PATHWAY | Trk receptor signaling mediated by the MAPK pathway |
| 0.1 | 7.0 | PID AR PATHWAY | Coregulation of Androgen receptor activity |
| 0.1 | 2.5 | SIG PIP3 SIGNALING IN B LYMPHOCYTES | Genes related to PIP3 signaling in B lymphocytes |
| 0.1 | 2.2 | PID CERAMIDE PATHWAY | Ceramide signaling pathway |
| 0.1 | 0.9 | ST PHOSPHOINOSITIDE 3 KINASE PATHWAY | PI3K Pathway |
| 0.1 | 4.3 | PID DELTA NP63 PATHWAY | Validated transcriptional targets of deltaNp63 isoforms |
| 0.1 | 1.8 | PID HIF2PATHWAY | HIF-2-alpha transcription factor network |
| 0.1 | 1.9 | PID CONE PATHWAY | Visual signal transduction: Cones |
| 0.1 | 18.1 | NABA SECRETED FACTORS | Genes encoding secreted soluble factors |
| 0.1 | 0.8 | ST G ALPHA I PATHWAY | G alpha i Pathway |
| 0.1 | 2.3 | PID HNF3A PATHWAY | FOXA1 transcription factor network |
| 0.1 | 3.1 | PID CMYB PATHWAY | C-MYB transcription factor network |
| 0.1 | 2.0 | PID IL4 2PATHWAY | IL4-mediated signaling events |
| 0.0 | 0.4 | ST P38 MAPK PATHWAY | p38 MAPK Pathway |
| 0.0 | 0.6 | PID ARF 3PATHWAY | Arf1 pathway |
Gene overrepresentation in curated gene sets: REACTOME pathways category:
| Log-likelihood per target | Total log-likelihood | Term | Description |
|---|---|---|---|
| 3.1 | 43.6 | REACTOME SEROTONIN RECEPTORS | Genes involved in Serotonin receptors |
| 2.7 | 105.3 | REACTOME STRIATED MUSCLE CONTRACTION | Genes involved in Striated Muscle Contraction |
| 2.5 | 20.4 | REACTOME NEF MEDIATED DOWNREGULATION OF MHC CLASS I COMPLEX CELL SURFACE EXPRESSION | Genes involved in Nef mediated downregulation of MHC class I complex cell surface expression |
| 2.5 | 40.1 | REACTOME ACETYLCHOLINE NEUROTRANSMITTER RELEASE CYCLE | Genes involved in Acetylcholine Neurotransmitter Release Cycle |
| 1.9 | 50.3 | REACTOME RNA POL I PROMOTER OPENING | Genes involved in RNA Polymerase I Promoter Opening |
| 1.8 | 17.5 | REACTOME PURINE CATABOLISM | Genes involved in Purine catabolism |
| 1.7 | 18.8 | REACTOME CREATION OF C4 AND C2 ACTIVATORS | Genes involved in Creation of C4 and C2 activators |
| 1.6 | 31.0 | REACTOME PRE NOTCH PROCESSING IN GOLGI | Genes involved in Pre-NOTCH Processing in Golgi |
| 1.6 | 62.3 | REACTOME GLUCONEOGENESIS | Genes involved in Gluconeogenesis |
| 1.2 | 6.0 | REACTOME BINDING AND ENTRY OF HIV VIRION | Genes involved in Binding and entry of HIV virion |
| 1.2 | 16.5 | REACTOME SYNTHESIS OF PE | Genes involved in Synthesis of PE |
| 1.1 | 21.4 | REACTOME TRAFFICKING OF GLUR2 CONTAINING AMPA RECEPTORS | Genes involved in Trafficking of GluR2-containing AMPA receptors |
| 1.1 | 19.0 | REACTOME GABA A RECEPTOR ACTIVATION | Genes involved in GABA A receptor activation |
| 1.0 | 2.0 | REACTOME NEP NS2 INTERACTS WITH THE CELLULAR EXPORT MACHINERY | Genes involved in NEP/NS2 Interacts with the Cellular Export Machinery |
| 1.0 | 15.8 | REACTOME IONOTROPIC ACTIVITY OF KAINATE RECEPTORS | Genes involved in Ionotropic activity of Kainate Receptors |
| 1.0 | 6.8 | REACTOME TRANSLOCATION OF ZAP 70 TO IMMUNOLOGICAL SYNAPSE | Genes involved in Translocation of ZAP-70 to Immunological synapse |
| 1.0 | 12.4 | REACTOME GENERATION OF SECOND MESSENGER MOLECULES | Genes involved in Generation of second messenger molecules |
| 0.9 | 2.7 | REACTOME CDK MEDIATED PHOSPHORYLATION AND REMOVAL OF CDC6 | Genes involved in CDK-mediated phosphorylation and removal of Cdc6 |
| 0.8 | 44.7 | REACTOME NUCLEAR SIGNALING BY ERBB4 | Genes involved in Nuclear signaling by ERBB4 |
| 0.8 | 17.6 | REACTOME ACTIVATION OF RAC | Genes involved in Activation of Rac |
| 0.8 | 13.5 | REACTOME METABOLISM OF PORPHYRINS | Genes involved in Metabolism of porphyrins |
| 0.8 | 10.9 | REACTOME SPRY REGULATION OF FGF SIGNALING | Genes involved in Spry regulation of FGF signaling |
| 0.7 | 10.2 | REACTOME CS DS DEGRADATION | Genes involved in CS/DS degradation |
| 0.7 | 7.8 | REACTOME IL 6 SIGNALING | Genes involved in Interleukin-6 signaling |
| 0.7 | 18.2 | REACTOME METABOLISM OF NON CODING RNA | Genes involved in Metabolism of non-coding RNA |
| 0.7 | 15.7 | REACTOME DARPP 32 EVENTS | Genes involved in DARPP-32 events |
| 0.7 | 3.4 | REACTOME ACTIVATION OF NF KAPPAB IN B CELLS | Genes involved in Activation of NF-kappaB in B Cells |
| 0.7 | 18.4 | REACTOME BASIGIN INTERACTIONS | Genes involved in Basigin interactions |
| 0.6 | 6.9 | REACTOME LIGAND GATED ION CHANNEL TRANSPORT | Genes involved in Ligand-gated ion channel transport |
| 0.6 | 5.9 | REACTOME SCFSKP2 MEDIATED DEGRADATION OF P27 P21 | Genes involved in SCF(Skp2)-mediated degradation of p27/p21 |
| 0.6 | 2.8 | REACTOME IRAK1 RECRUITS IKK COMPLEX | Genes involved in IRAK1 recruits IKK complex |
| 0.5 | 8.7 | REACTOME N GLYCAN ANTENNAE ELONGATION | Genes involved in N-Glycan antennae elongation |
| 0.5 | 9.7 | REACTOME POST CHAPERONIN TUBULIN FOLDING PATHWAY | Genes involved in Post-chaperonin tubulin folding pathway |
| 0.5 | 6.3 | REACTOME TERMINATION OF O GLYCAN BIOSYNTHESIS | Genes involved in Termination of O-glycan biosynthesis |
| 0.5 | 11.5 | REACTOME CLASS C 3 METABOTROPIC GLUTAMATE PHEROMONE RECEPTORS | Genes involved in Class C/3 (Metabotropic glutamate/pheromone receptors) |
| 0.5 | 36.8 | REACTOME ANTIVIRAL MECHANISM BY IFN STIMULATED GENES | Genes involved in Antiviral mechanism by IFN-stimulated genes |
| 0.5 | 50.8 | REACTOME PEPTIDE CHAIN ELONGATION | Genes involved in Peptide chain elongation |
| 0.5 | 9.4 | REACTOME DOWNSTREAM TCR SIGNALING | Genes involved in Downstream TCR signaling |
| 0.5 | 23.3 | REACTOME SCF BETA TRCP MEDIATED DEGRADATION OF EMI1 | Genes involved in SCF-beta-TrCP mediated degradation of Emi1 |
| 0.5 | 4.2 | REACTOME MTORC1 MEDIATED SIGNALLING | Genes involved in mTORC1-mediated signalling |
| 0.4 | 6.7 | REACTOME GABA SYNTHESIS RELEASE REUPTAKE AND DEGRADATION | Genes involved in GABA synthesis, release, reuptake and degradation |
| 0.4 | 8.9 | REACTOME SYNTHESIS AND INTERCONVERSION OF NUCLEOTIDE DI AND TRIPHOSPHATES | Genes involved in Synthesis and interconversion of nucleotide di- and triphosphates |
| 0.4 | 4.0 | REACTOME CD28 DEPENDENT VAV1 PATHWAY | Genes involved in CD28 dependent Vav1 pathway |
| 0.4 | 9.4 | REACTOME SIGNALING BY ROBO RECEPTOR | Genes involved in Signaling by Robo receptor |
| 0.4 | 6.1 | REACTOME FORMATION OF ATP BY CHEMIOSMOTIC COUPLING | Genes involved in Formation of ATP by chemiosmotic coupling |
| 0.4 | 2.3 | REACTOME OLFACTORY SIGNALING PATHWAY | Genes involved in Olfactory Signaling Pathway |
| 0.4 | 6.3 | REACTOME OTHER SEMAPHORIN INTERACTIONS | Genes involved in Other semaphorin interactions |
| 0.4 | 29.0 | REACTOME G ALPHA1213 SIGNALLING EVENTS | Genes involved in G alpha (12/13) signalling events |
| 0.4 | 4.0 | REACTOME REGULATION OF IFNG SIGNALING | Genes involved in Regulation of IFNG signaling |
| 0.4 | 6.1 | REACTOME PREFOLDIN MEDIATED TRANSFER OF SUBSTRATE TO CCT TRIC | Genes involved in Prefoldin mediated transfer of substrate to CCT/TriC |
| 0.3 | 5.5 | REACTOME FACILITATIVE NA INDEPENDENT GLUCOSE TRANSPORTERS | Genes involved in Facilitative Na+-independent glucose transporters |
| 0.3 | 5.3 | REACTOME SYNTHESIS OF VERY LONG CHAIN FATTY ACYL COAS | Genes involved in Synthesis of very long-chain fatty acyl-CoAs |
| 0.3 | 4.3 | REACTOME PROTEOLYTIC CLEAVAGE OF SNARE COMPLEX PROTEINS | Genes involved in Proteolytic cleavage of SNARE complex proteins |
| 0.3 | 3.1 | REACTOME CTNNB1 PHOSPHORYLATION CASCADE | Genes involved in Beta-catenin phosphorylation cascade |
| 0.3 | 2.5 | REACTOME P38MAPK EVENTS | Genes involved in p38MAPK events |
| 0.2 | 3.4 | REACTOME MITOCHONDRIAL FATTY ACID BETA OXIDATION | Genes involved in Mitochondrial Fatty Acid Beta-Oxidation |
| 0.2 | 8.5 | REACTOME GLYCOSPHINGOLIPID METABOLISM | Genes involved in Glycosphingolipid metabolism |
| 0.2 | 6.0 | REACTOME MYOGENESIS | Genes involved in Myogenesis |
| 0.2 | 3.6 | REACTOME DOWNREGULATION OF SMAD2 3 SMAD4 TRANSCRIPTIONAL ACTIVITY | Genes involved in Downregulation of SMAD2/3:SMAD4 transcriptional activity |
| 0.2 | 6.7 | REACTOME INTERACTION BETWEEN L1 AND ANKYRINS | Genes involved in Interaction between L1 and Ankyrins |
| 0.2 | 3.8 | REACTOME SIGNALLING TO P38 VIA RIT AND RIN | Genes involved in Signalling to p38 via RIT and RIN |
| 0.2 | 6.2 | REACTOME CASPASE MEDIATED CLEAVAGE OF CYTOSKELETAL PROTEINS | Genes involved in Caspase-mediated cleavage of cytoskeletal proteins |
| 0.2 | 3.3 | REACTOME REGULATION OF HYPOXIA INDUCIBLE FACTOR HIF BY OXYGEN | Genes involved in Regulation of Hypoxia-inducible Factor (HIF) by Oxygen |
| 0.2 | 2.8 | REACTOME SIGNALING BY FGFR1 FUSION MUTANTS | Genes involved in Signaling by FGFR1 fusion mutants |
| 0.2 | 34.1 | REACTOME ANTIGEN PROCESSING UBIQUITINATION PROTEASOME DEGRADATION | Genes involved in Antigen processing: Ubiquitination & Proteasome degradation |
| 0.2 | 8.6 | REACTOME CHEMOKINE RECEPTORS BIND CHEMOKINES | Genes involved in Chemokine receptors bind chemokines |
| 0.2 | 4.2 | REACTOME PI3K EVENTS IN ERBB4 SIGNALING | Genes involved in PI3K events in ERBB4 signaling |
| 0.2 | 3.0 | REACTOME REGULATION OF INSULIN LIKE GROWTH FACTOR IGF ACTIVITY BY INSULIN LIKE GROWTH FACTOR BINDING PROTEINS IGFBPS | Genes involved in Regulation of Insulin-like Growth Factor (IGF) Activity by Insulin-like Growth Factor Binding Proteins (IGFBPs) |
| 0.1 | 1.8 | REACTOME VITAMIN B5 PANTOTHENATE METABOLISM | Genes involved in Vitamin B5 (pantothenate) metabolism |
| 0.1 | 3.6 | REACTOME TRANSPORT OF MATURE TRANSCRIPT TO CYTOPLASM | Genes involved in Transport of Mature Transcript to Cytoplasm |
| 0.1 | 2.8 | REACTOME GLUCAGON TYPE LIGAND RECEPTORS | Genes involved in Glucagon-type ligand receptors |
| 0.1 | 3.3 | REACTOME KINESINS | Genes involved in Kinesins |
| 0.1 | 1.8 | REACTOME CHYLOMICRON MEDIATED LIPID TRANSPORT | Genes involved in Chylomicron-mediated lipid transport |
| 0.1 | 1.9 | REACTOME ABCA TRANSPORTERS IN LIPID HOMEOSTASIS | Genes involved in ABCA transporters in lipid homeostasis |
| 0.1 | 4.5 | REACTOME CIRCADIAN CLOCK | Genes involved in Circadian Clock |
| 0.1 | 5.4 | REACTOME NUCLEAR RECEPTOR TRANSCRIPTION PATHWAY | Genes involved in Nuclear Receptor transcription pathway |
| 0.1 | 8.2 | REACTOME SIGNALING BY RHO GTPASES | Genes involved in Signaling by Rho GTPases |
| 0.1 | 2.7 | REACTOME ACTIVATION OF CHAPERONE GENES BY XBP1S | Genes involved in Activation of Chaperone Genes by XBP1(S) |
| 0.1 | 1.5 | REACTOME KERATAN SULFATE BIOSYNTHESIS | Genes involved in Keratan sulfate biosynthesis |
| 0.1 | 4.1 | REACTOME VOLTAGE GATED POTASSIUM CHANNELS | Genes involved in Voltage gated Potassium channels |
| 0.1 | 1.5 | REACTOME SIGNALING BY HIPPO | Genes involved in Signaling by Hippo |
| 0.1 | 1.8 | REACTOME AMINE LIGAND BINDING RECEPTORS | Genes involved in Amine ligand-binding receptors |
| 0.1 | 0.3 | REACTOME TRAF6 MEDIATED IRF7 ACTIVATION IN TLR7 8 OR 9 SIGNALING | Genes involved in TRAF6 mediated IRF7 activation in TLR7/8 or 9 signaling |
| 0.1 | 2.2 | REACTOME INTERFERON ALPHA BETA SIGNALING | Genes involved in Interferon alpha/beta signaling |
| 0.0 | 1.9 | REACTOME ION CHANNEL TRANSPORT | Genes involved in Ion channel transport |
| 0.0 | 0.9 | REACTOME SIGNALING BY BMP | Genes involved in Signaling by BMP |
| 0.0 | 0.8 | REACTOME NUCLEOTIDE LIKE PURINERGIC RECEPTORS | Genes involved in Nucleotide-like (purinergic) receptors |
| 0.0 | 0.7 | REACTOME FORMATION OF THE TERNARY COMPLEX AND SUBSEQUENTLY THE 43S COMPLEX | Genes involved in Formation of the ternary complex, and subsequently, the 43S complex |
| 0.0 | 0.9 | REACTOME PRE NOTCH EXPRESSION AND PROCESSING | Genes involved in Pre-NOTCH Expression and Processing |
| 0.0 | 0.8 | REACTOME PLC BETA MEDIATED EVENTS | Genes involved in PLC beta mediated events |
| 0.0 | 1.3 | REACTOME FACTORS INVOLVED IN MEGAKARYOCYTE DEVELOPMENT AND PLATELET PRODUCTION | Genes involved in Factors involved in megakaryocyte development and platelet production |
| 0.0 | 0.1 | REACTOME P53 DEPENDENT G1 DNA DAMAGE RESPONSE | Genes involved in p53-Dependent G1 DNA Damage Response |
| 0.0 | 0.8 | REACTOME MHC CLASS II ANTIGEN PRESENTATION | Genes involved in MHC class II antigen presentation |
| 0.0 | 0.1 | REACTOME RECYCLING OF BILE ACIDS AND SALTS | Genes involved in Recycling of bile acids and salts |