Project
GSE53960: rat RNA-Seq transcriptomic Bodymap
Navigation
Downloads
Results for Foxj3_Tbl1xr1
Z-value: 3.21
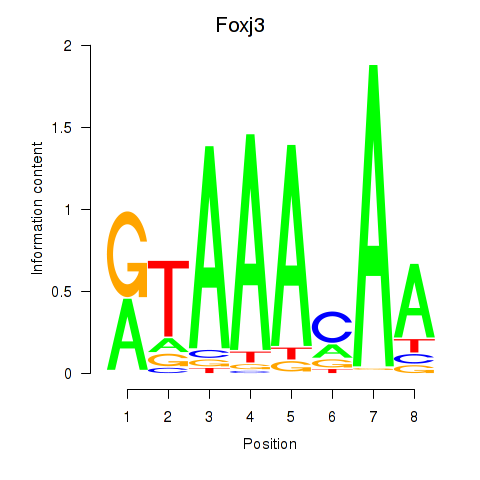
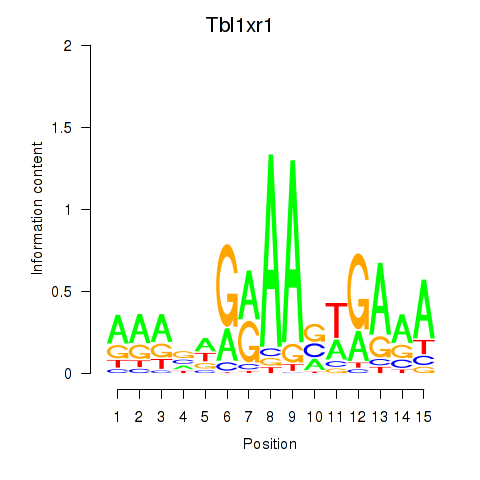
Motif logo
Transcription factors associated with Foxj3_Tbl1xr1
| Gene Symbol | Gene ID | Gene Info |
|---|---|---|
|
Foxj3
|
ENSRNOG00000061851 | forkhead box J3 |
|
Tbl1xr1
|
ENSRNOG00000011216 | transducin (beta)-like 1 X-linked receptor 1 |
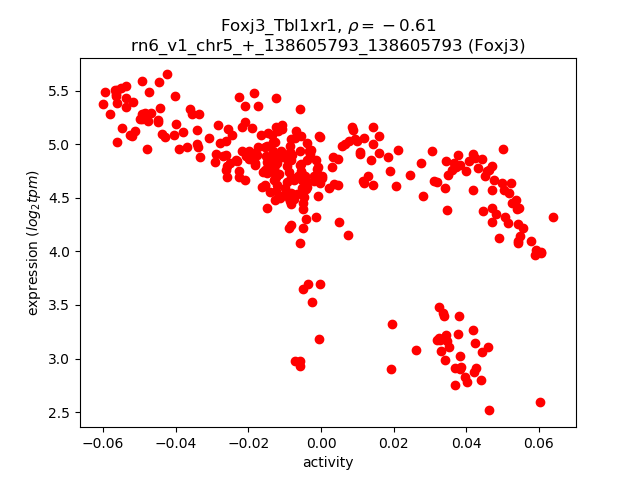
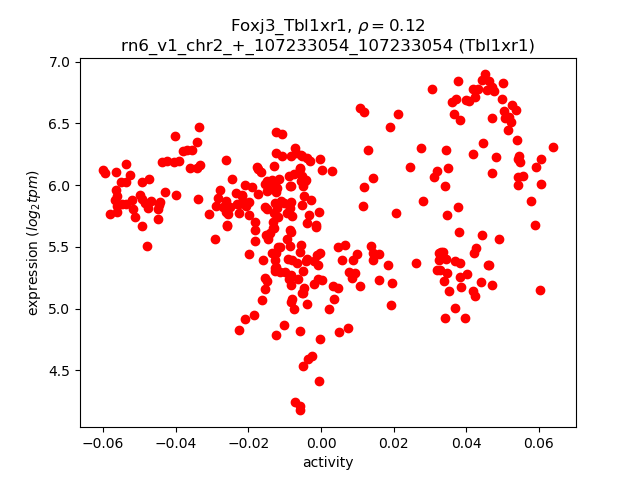
Activity-expression correlation:
| Gene | Promoter | Pearson corr. coef. | P-value | Plot |
|---|---|---|---|---|
| Foxj3 | rn6_v1_chr5_+_138605793_138605793 | -0.61 | 1.8e-34 | Click! |
| Tbl1xr1 | rn6_v1_chr2_+_107233054_107233054 | 0.12 | 3.8e-02 | Click! |
Activity profile of Foxj3_Tbl1xr1 motif
Sorted Z-values of Foxj3_Tbl1xr1 motif
| Promoter | Log-likelihood | Transcript | Gene | Gene Info |
|---|---|---|---|---|
| chr2_+_223029559 | 111.67 |
ENSRNOT00000045584
|
AABR07013111.1
|
|
| chr4_-_170912629 | 106.61 |
ENSRNOT00000055691
|
Erp27
|
endoplasmic reticulum protein 27 |
| chr4_+_69435703 | 104.68 |
ENSRNOT00000065485
|
LOC100911271
|
uncharacterized LOC100911271 |
| chr5_-_60191941 | 97.22 |
ENSRNOT00000033373
|
Pax5
|
paired box 5 |
| chr4_+_70614524 | 92.97 |
ENSRNOT00000041100
|
Prss3
|
protease, serine 3 |
| chr11_+_86094567 | 90.03 |
ENSRNOT00000086514
|
LOC100361706
|
lambda-chain C1-region-like |
| chr13_+_82369493 | 88.57 |
ENSRNOT00000003733
|
Sell
|
selectin L |
| chr1_-_259287684 | 88.17 |
ENSRNOT00000054724
|
Cyp2c22
|
cytochrome P450, family 2, subfamily c, polypeptide 22 |
| chr3_+_17546566 | 87.97 |
ENSRNOT00000050825
|
AABR07051583.1
|
|
| chr3_+_16413080 | 86.14 |
ENSRNOT00000040386
|
LOC100912707
|
Ig kappa chain V19-17-like |
| chr4_+_163349125 | 85.84 |
ENSRNOT00000084823
|
Klre1
|
killer cell lectin-like receptor, family E, member 1 |
| chr4_+_69457472 | 84.62 |
ENSRNOT00000067597
|
Trbv19
|
T cell receptor beta, variable 19 |
| chr11_+_86092468 | 83.21 |
ENSRNOT00000057971
|
LOC100361706
|
lambda-chain C1-region-like |
| chr4_+_70572942 | 83.18 |
ENSRNOT00000051964
|
AC142181.1
|
|
| chr4_+_70776046 | 81.20 |
ENSRNOT00000040403
|
Prss1
|
protease, serine 1 |
| chr11_+_54619129 | 80.72 |
ENSRNOT00000059924
|
Trat1
|
T cell receptor associated transmembrane adaptor 1 |
| chr4_-_70628470 | 80.10 |
ENSRNOT00000029319
|
Try5
|
trypsin 5 |
| chr4_+_69403735 | 75.22 |
ENSRNOT00000082012
|
Trbv13-1
|
T cell receptor beta, variable 13-1 |
| chr2_-_216443518 | 74.76 |
ENSRNOT00000022496
|
Amy1a
|
amylase, alpha 1A |
| chr2_-_203680083 | 74.63 |
ENSRNOT00000021268
|
Cd2
|
Cd2 molecule |
| chr4_-_69196430 | 74.00 |
ENSRNOT00000017673
|
LOC312273
|
Trypsin V-A |
| chr2_-_30458542 | 73.13 |
ENSRNOT00000072926
|
Naip6
|
NLR family, apoptosis inhibitory protein 6 |
| chr4_+_109497962 | 73.03 |
ENSRNOT00000057869
|
Reg1a
|
regenerating family member 1 alpha |
| chr14_+_22937421 | 71.56 |
ENSRNOT00000065079
|
RGD1559459
|
similar to Expressed sequence AI788959 |
| chr15_+_32817343 | 68.26 |
ENSRNOT00000073853
|
AABR07017902.1
|
|
| chr10_+_94944436 | 68.03 |
ENSRNOT00000078968
|
Milr1
|
mast cell immunoglobulin-like receptor 1 |
| chr13_-_56877611 | 67.28 |
ENSRNOT00000079040
ENSRNOT00000017195 |
Cfhr1
|
complement factor H-related 1 |
| chr15_+_31417147 | 66.98 |
ENSRNOT00000092182
|
AABR07017824.2
|
|
| chr2_-_216348194 | 66.13 |
ENSRNOT00000087839
|
LOC103689940
|
pancreatic alpha-amylase-like |
| chr4_+_69384145 | 66.09 |
ENSRNOT00000084834
|
Trbv13-2
|
T cell receptor beta, variable 13-2 |
| chr6_-_138508753 | 66.05 |
ENSRNOT00000006888
|
Ighm
|
immunoglobulin heavy constant mu |
| chr16_-_31301880 | 65.22 |
ENSRNOT00000084847
ENSRNOT00000083943 |
AABR07025272.1
|
|
| chr3_+_17107861 | 64.97 |
ENSRNOT00000043097
|
AABR07051563.1
|
|
| chr4_-_157433467 | 64.36 |
ENSRNOT00000028965
|
Lag3
|
lymphocyte activating 3 |
| chr1_+_198744050 | 64.35 |
ENSRNOT00000024404
|
Itgal
|
integrin subunit alpha L |
| chr3_+_17889972 | 64.28 |
ENSRNOT00000073021
|
AABR07051611.1
|
|
| chr4_-_163402561 | 64.27 |
ENSRNOT00000091890
|
Klrk1
|
killer cell lectin like receptor K1 |
| chr1_-_197821936 | 64.14 |
ENSRNOT00000055027
|
Cd19
|
CD19 molecule |
| chr10_+_70417108 | 64.11 |
ENSRNOT00000079325
|
Slfn4
|
schlafen 4 |
| chr11_-_60180031 | 64.09 |
ENSRNOT00000043020
ENSRNOT00000093731 |
Gcsam
|
germinal center-associated, signaling and motility |
| chr10_-_34242985 | 63.93 |
ENSRNOT00000046438
|
RGD1559575
|
similar to novel protein |
| chr13_-_55173692 | 62.84 |
ENSRNOT00000064785
ENSRNOT00000029878 ENSRNOT00000029865 ENSRNOT00000060292 ENSRNOT00000000814 |
Ptprc
|
protein tyrosine phosphatase, receptor type, C |
| chr4_-_103024841 | 62.58 |
ENSRNOT00000090283
|
AABR07061036.1
|
|
| chr4_-_70747226 | 62.38 |
ENSRNOT00000044960
|
LOC102554637
|
anionic trypsin-2-like |
| chrX_+_15378789 | 62.12 |
ENSRNOT00000029272
|
Gata1
|
GATA binding protein 1 |
| chr14_+_17195014 | 62.02 |
ENSRNOT00000031667
|
Cxcl11
|
C-X-C motif chemokine ligand 11 |
| chr7_+_118692851 | 61.38 |
ENSRNOT00000091911
|
LOC100911562
|
apolipoprotein L3-like |
| chr6_-_140216072 | 60.92 |
ENSRNOT00000072365
|
AABR07065750.1
|
|
| chr2_+_186685104 | 60.50 |
ENSRNOT00000057022
|
Cd5l
|
Cd5 molecule-like |
| chr4_-_164051812 | 60.08 |
ENSRNOT00000085719
|
AABR07062183.1
|
|
| chr17_+_47870611 | 59.90 |
ENSRNOT00000078555
|
AABR07027872.1
|
|
| chr3_+_16846412 | 59.81 |
ENSRNOT00000074266
|
AABR07051551.1
|
|
| chr2_-_216382244 | 59.71 |
ENSRNOT00000086695
ENSRNOT00000087259 |
LOC103689940
|
pancreatic alpha-amylase-like |
| chr6_+_139209936 | 59.63 |
ENSRNOT00000087620
|
AABR07065680.1
|
|
| chr10_-_56506446 | 59.55 |
ENSRNOT00000021357
|
Acap1
|
ArfGAP with coiled-coil, ankyrin repeat and PH domains 1 |
| chr15_+_30570483 | 59.49 |
ENSRNOT00000071740
|
AABR07017745.1
|
|
| chr13_-_61591139 | 59.48 |
ENSRNOT00000005324
|
Rgs18
|
regulator of G-protein signaling 18 |
| chr10_+_31880918 | 59.12 |
ENSRNOT00000059448
|
Timd4
|
T-cell immunoglobulin and mucin domain containing 4 |
| chr6_-_127337791 | 59.07 |
ENSRNOT00000032015
|
Ifi27l2b
|
interferon, alpha-inducible protein 27 like 2B |
| chrX_+_78372257 | 58.72 |
ENSRNOT00000046164
|
Gpr174
|
G protein-coupled receptor 174 |
| chr20_-_4863198 | 58.13 |
ENSRNOT00000001108
|
Ltb
|
lymphotoxin beta |
| chr12_-_46889082 | 57.93 |
ENSRNOT00000001525
|
Pla2g1b
|
phospholipase A2 group IB |
| chr3_+_19045214 | 57.78 |
ENSRNOT00000070878
|
AABR07051670.1
|
|
| chr4_-_163890801 | 57.46 |
ENSRNOT00000081946
|
Ly49si1
|
immunoreceptor Ly49si1 |
| chr3_+_16753703 | 57.33 |
ENSRNOT00000077741
|
AABR07051548.2
|
|
| chr13_+_89597138 | 57.31 |
ENSRNOT00000004662
|
Apoa2
|
apolipoprotein A2 |
| chr6_-_138550576 | 57.30 |
ENSRNOT00000075284
|
AABR07065645.1
|
|
| chr7_-_54778848 | 57.29 |
ENSRNOT00000005399
|
Glipr1
|
GLI pathogenesis-related 1 |
| chr1_-_73619356 | 56.79 |
ENSRNOT00000074352
|
Lilrb3
|
leukocyte immunoglobulin like receptor B3 |
| chr4_+_101645731 | 56.67 |
ENSRNOT00000087901
|
AABR07060953.1
|
|
| chr9_+_8054466 | 55.41 |
ENSRNOT00000081513
|
Adgre4
|
adhesion G protein-coupled receptor E4 |
| chr7_+_121841855 | 55.33 |
ENSRNOT00000024673
|
Grap2
|
GRB2-related adaptor protein 2 |
| chr20_+_3875706 | 55.16 |
ENSRNOT00000036900
|
RT1-Ha
|
RT1 class II, locus Ha |
| chr1_+_227670159 | 55.03 |
ENSRNOT00000072077
|
Ms4a6c
|
membrane-spanning 4-domains, subfamily A, member 6C |
| chr1_-_148119857 | 54.14 |
ENSRNOT00000040325
|
LOC100361547
|
Cytochrome P450, family 2, subfamily c, polypeptide 7-like |
| chr15_-_29761117 | 53.77 |
ENSRNOT00000075194
|
AABR07017658.2
|
|
| chr16_-_56900052 | 53.58 |
ENSRNOT00000017339
|
Msr1
|
macrophage scavenger receptor 1 |
| chr6_-_138565404 | 52.83 |
ENSRNOT00000079420
|
AABR07065645.2
|
|
| chr2_+_256964860 | 52.79 |
ENSRNOT00000073547
|
Ifi44l
|
interferon-induced protein 44-like |
| chrX_-_71168612 | 52.39 |
ENSRNOT00000075934
|
Il2rg
|
interleukin 2 receptor subunit gamma |
| chr4_+_154215250 | 52.35 |
ENSRNOT00000072465
|
Mug2
|
murinoglobulin 2 |
| chr4_+_154391647 | 52.10 |
ENSRNOT00000081488
ENSRNOT00000079192 |
Mug1
|
murinoglobulin 1 |
| chrX_-_79066932 | 51.87 |
ENSRNOT00000057460
|
RGD1561552
|
similar to WASP family 1 |
| chr3_-_16537433 | 51.84 |
ENSRNOT00000048523
|
AABR07051533.2
|
|
| chr15_+_32614002 | 51.80 |
ENSRNOT00000072962
|
AABR07017902.1
|
|
| chr15_+_27177900 | 51.74 |
ENSRNOT00000039925
|
Tlr11
|
toll-like receptor 11 |
| chr13_-_90022269 | 51.71 |
ENSRNOT00000035498
|
Ly9
|
lymphocyte antigen 9 |
| chr3_+_19174027 | 51.47 |
ENSRNOT00000074445
|
AABR07051678.1
|
|
| chr12_-_2438817 | 50.84 |
ENSRNOT00000037059
|
Ccl25
|
C-C motif chemokine ligand 25 |
| chr15_-_23969011 | 50.80 |
ENSRNOT00000014821
|
Gch1
|
GTP cyclohydrolase 1 |
| chr4_+_98337367 | 50.67 |
ENSRNOT00000042165
|
AABR07060872.1
|
|
| chr5_+_157222636 | 50.64 |
ENSRNOT00000022579
|
Pla2g2d
|
phospholipase A2, group IID |
| chr18_+_55391388 | 50.60 |
ENSRNOT00000071612
|
LOC100910934
|
interferon-inducible GTPase 1-like |
| chr18_-_6587080 | 50.57 |
ENSRNOT00000040815
|
LOC103694404
|
60S ribosomal protein L39 |
| chr1_+_173252058 | 50.28 |
ENSRNOT00000073421
|
LOC499229
|
similar to very large inducible GTPase 1 isoform A |
| chr13_+_90301006 | 50.17 |
ENSRNOT00000029315
|
Slamf6
|
SLAM family member 6 |
| chr4_-_103258134 | 50.05 |
ENSRNOT00000086827
|
AABR07061052.1
|
|
| chr3_+_28416954 | 49.94 |
ENSRNOT00000043533
|
Kynu
|
kynureninase |
| chr3_-_17081510 | 49.81 |
ENSRNOT00000063862
|
AABR07051562.1
|
|
| chr14_+_5928737 | 49.64 |
ENSRNOT00000071877
ENSRNOT00000040985 ENSRNOT00000074889 |
Mpa2l
|
macrophage activation 2 like |
| chr10_-_110232843 | 49.50 |
ENSRNOT00000054934
|
Cd7
|
Cd7 molecule |
| chr3_-_2853272 | 49.37 |
ENSRNOT00000023022
|
Fcna
|
ficolin A |
| chr7_-_18793289 | 48.81 |
ENSRNOT00000036375
|
AABR07056026.1
|
|
| chr7_-_29233392 | 48.78 |
ENSRNOT00000064241
|
Spic
|
Spi-C transcription factor |
| chr14_+_21177237 | 48.64 |
ENSRNOT00000004866
|
Jchain
|
immunoglobulin joining chain |
| chr4_+_99239115 | 48.60 |
ENSRNOT00000009515
|
Cd8a
|
CD8a molecule |
| chr4_-_70996395 | 48.54 |
ENSRNOT00000021485
|
Kel
|
Kell blood group, metallo-endopeptidase |
| chr13_+_92136290 | 48.53 |
ENSRNOT00000049819
|
Olr1587
|
olfactory receptor 1587 |
| chr16_-_29936307 | 48.51 |
ENSRNOT00000088707
|
Ddx60
|
DEAD (Asp-Glu-Ala-Asp) box polypeptide 60 |
| chr14_+_10692764 | 48.38 |
ENSRNOT00000003012
|
LOC100910270
|
uncharacterized LOC100910270 |
| chr14_+_10534423 | 48.20 |
ENSRNOT00000002983
|
Hpse
|
heparanase |
| chr5_-_146795866 | 47.88 |
ENSRNOT00000065640
|
Tlr12
|
toll-like receptor 12 |
| chr3_+_19366370 | 47.71 |
ENSRNOT00000086557
|
AABR07051689.1
|
|
| chr14_+_22724399 | 47.62 |
ENSRNOT00000002724
|
Ugt2b10
|
UDP glucuronosyltransferase 2 family, polypeptide B10 |
| chr2_+_190073815 | 47.28 |
ENSRNOT00000015473
|
S100a8
|
S100 calcium binding protein A8 |
| chr4_+_70755795 | 47.28 |
ENSRNOT00000043527
|
LOC683849
|
similar to Anionic trypsin II precursor (Pretrypsinogen II) |
| chr1_+_229642412 | 46.99 |
ENSRNOT00000017109
|
Lpxn
|
leupaxin |
| chr1_+_148240504 | 46.79 |
ENSRNOT00000085373
|
LOC100361547
|
Cytochrome P450, family 2, subfamily c, polypeptide 7-like |
| chr1_+_83714347 | 46.71 |
ENSRNOT00000085245
|
Cyp2a1
|
cytochrome P450, family 2, subfamily a, polypeptide 1 |
| chr3_+_110855000 | 46.68 |
ENSRNOT00000081613
|
Knl1
|
kinetochore scaffold 1 |
| chr1_+_147713892 | 46.60 |
ENSRNOT00000092985
ENSRNOT00000054742 ENSRNOT00000074103 |
Cyp2c6v1
|
cytochrome P450, family 2, subfamily C, polypeptide 6, variant 1 |
| chr16_+_54153054 | 46.53 |
ENSRNOT00000090644
ENSRNOT00000014248 |
Fgl1
|
fibrinogen-like 1 |
| chr6_-_138679665 | 46.42 |
ENSRNOT00000086777
|
AABR07065651.4
|
|
| chr8_-_49301125 | 46.13 |
ENSRNOT00000091190
|
Cd3e
|
CD3e molecule |
| chr6_-_141321108 | 46.11 |
ENSRNOT00000040556
|
AABR07065789.3
|
|
| chr10_-_12871965 | 45.84 |
ENSRNOT00000004583
|
Gm8225
|
predicted gene 8225 |
| chr13_-_91981432 | 45.83 |
ENSRNOT00000004637
|
AABR07021804.1
|
|
| chr5_-_124403195 | 45.78 |
ENSRNOT00000067850
|
C8a
|
complement C8 alpha chain |
| chr20_-_29029905 | 45.26 |
ENSRNOT00000075682
|
Oit3
|
oncoprotein induced transcript 3 |
| chr18_+_55666027 | 45.12 |
ENSRNOT00000045950
|
RGD1305184
|
similar to CDNA sequence BC023105 |
| chr3_+_19772056 | 45.06 |
ENSRNOT00000044455
|
AABR07051708.1
|
|
| chr20_+_5184515 | 44.72 |
ENSRNOT00000089411
|
LOC103694381
|
lymphotoxin-beta |
| chr14_-_71814523 | 44.70 |
ENSRNOT00000004094
|
Bst1
|
bone marrow stromal cell antigen 1 |
| chr1_+_213766758 | 44.57 |
ENSRNOT00000005645
|
Ifitm1
|
interferon induced transmembrane protein 1 |
| chr15_-_29548400 | 44.54 |
ENSRNOT00000078176
|
AABR07017639.2
|
|
| chr15_+_32355565 | 44.32 |
ENSRNOT00000072382
|
AABR07017900.1
|
|
| chr15_+_32828165 | 44.11 |
ENSRNOT00000060253
|
AABR07017902.1
|
|
| chr6_-_139747737 | 44.02 |
ENSRNOT00000090626
|
AABR07065705.3
|
|
| chr15_-_30323833 | 43.99 |
ENSRNOT00000071631
|
AABR07017714.1
|
|
| chr6_-_140102325 | 43.94 |
ENSRNOT00000072238
|
AABR07065750.2
|
|
| chr14_+_22375955 | 43.89 |
ENSRNOT00000063915
ENSRNOT00000034784 |
Ugt2b37
|
UDP-glucuronosyltransferase 2 family, member 37 |
| chr4_+_109467272 | 43.88 |
ENSRNOT00000008212
|
Reg3b
|
regenerating family member 3 beta |
| chr4_+_70689737 | 43.80 |
ENSRNOT00000018852
|
Prss2
|
protease, serine, 2 |
| chr7_-_107385528 | 43.77 |
ENSRNOT00000093352
|
Tmem71
|
transmembrane protein 71 |
| chr3_+_16610086 | 43.77 |
ENSRNOT00000046231
|
LOC100361009
|
rCG64257-like |
| chr13_+_47572219 | 43.68 |
ENSRNOT00000088449
ENSRNOT00000087664 ENSRNOT00000005853 |
Pigr
|
polymeric immunoglobulin receptor |
| chr3_+_16495748 | 43.66 |
ENSRNOT00000045492
|
AABR07051533.1
|
|
| chr6_+_128048099 | 43.44 |
ENSRNOT00000084685
ENSRNOT00000087017 |
LOC500712
|
Ab1-233 |
| chr2_-_173668555 | 43.36 |
ENSRNOT00000013452
|
Serpini2
|
serpin family I member 2 |
| chr3_-_55587946 | 43.17 |
ENSRNOT00000075107
|
Abcb11
|
ATP binding cassette subfamily B member 11 |
| chr15_-_45545875 | 43.00 |
ENSRNOT00000087678
|
Gucy1b2
|
guanylate cyclase 1 soluble subunit beta 2 |
| chr15_-_28104206 | 42.95 |
ENSRNOT00000032536
|
Ang2
|
angiogenin, ribonuclease A family, member 2 |
| chr4_-_167202106 | 42.81 |
ENSRNOT00000038581
|
Tas2r140
|
taste receptor, type 2, member 140 |
| chr4_+_14212925 | 42.81 |
ENSRNOT00000076946
|
LOC103690020
|
platelet glycoprotein 4-like |
| chr17_-_90149894 | 42.38 |
ENSRNOT00000024272
|
Apbb1ip
|
amyloid beta precursor protein binding family B member 1 interacting protein |
| chr18_+_55463308 | 42.32 |
ENSRNOT00000073388
|
LOC100910979
|
interferon-inducible GTPase 1-like |
| chr1_-_98521551 | 41.78 |
ENSRNOT00000081922
|
Siglec10
|
sialic acid binding Ig-like lectin 10 |
| chr8_+_49282460 | 41.75 |
ENSRNOT00000021488
|
Cd3d
|
CD3d molecule |
| chr4_+_98371184 | 41.71 |
ENSRNOT00000086911
|
AABR07060872.1
|
|
| chr4_-_163570803 | 41.18 |
ENSRNOT00000082002
ENSRNOT00000078642 |
Klri2
|
killer cell lectin-like receptor family I member 2 |
| chr2_+_104744461 | 41.15 |
ENSRNOT00000016083
ENSRNOT00000082627 |
Cp
|
ceruloplasmin |
| chr18_+_55466373 | 41.05 |
ENSRNOT00000074629
|
LOC102555392
|
interferon-inducible GTPase 1-like |
| chr3_-_76187045 | 41.05 |
ENSRNOT00000075650
|
LOC686683
|
similar to olfactory receptor 73 |
| chr18_+_86299463 | 40.85 |
ENSRNOT00000058152
|
Cd226
|
CD226 molecule |
| chr12_-_51965779 | 40.70 |
ENSRNOT00000056733
|
LOC100362927
|
replication protein A3-like |
| chr17_+_44760056 | 40.27 |
ENSRNOT00000052073
|
LOC690171
|
similar to H3 histone, family 3B |
| chr3_-_118959850 | 40.25 |
ENSRNOT00000092750
|
Atp8b4
|
ATPase phospholipid transporting 8B4 (putative) |
| chr15_-_24199341 | 40.24 |
ENSRNOT00000015553
|
Dlgap5
|
DLG associated protein 5 |
| chr6_-_138632159 | 39.97 |
ENSRNOT00000082921
ENSRNOT00000040702 |
Ighm
|
immunoglobulin heavy constant mu |
| chr13_+_53351717 | 39.96 |
ENSRNOT00000012038
|
Kif14
|
kinesin family member 14 |
| chr3_+_19274273 | 39.95 |
ENSRNOT00000040102
|
AABR07051684.1
|
|
| chr3_-_44177689 | 39.94 |
ENSRNOT00000006387
|
Cytip
|
cytohesin 1 interacting protein |
| chr2_+_186776644 | 39.85 |
ENSRNOT00000046778
|
Fcrl3
|
Fc receptor-like 3 |
| chr4_+_65110746 | 39.74 |
ENSRNOT00000017675
|
Akr1d1
|
aldo-keto reductase family 1, member D1 |
| chr17_+_43633675 | 39.72 |
ENSRNOT00000072119
|
LOC102549173
|
histone H3.2-like |
| chr14_-_19191863 | 39.71 |
ENSRNOT00000003921
|
Alb
|
albumin |
| chr9_+_95256627 | 39.69 |
ENSRNOT00000025291
|
Ugt1a5
|
UDP glucuronosyltransferase family 1 member A5 |
| chr17_-_43776460 | 39.64 |
ENSRNOT00000089055
|
Hist2h3c2
|
histone cluster 2, H3c2 |
| chr10_-_90415070 | 39.63 |
ENSRNOT00000055179
|
Itga2b
|
integrin subunit alpha 2b |
| chr1_-_258877045 | 39.60 |
ENSRNOT00000071633
|
Cyp2c13
|
cytochrome P450, family 2, subfamily c, polypeptide 13 |
| chr1_+_189328246 | 39.44 |
ENSRNOT00000084260
|
Acsm1
|
acyl-CoA synthetase medium-chain family member 1 |
| chr9_+_67763897 | 39.36 |
ENSRNOT00000071226
|
Icos
|
inducible T-cell co-stimulator |
| chr6_-_140572023 | 39.36 |
ENSRNOT00000072338
|
AABR07065772.1
|
|
| chr6_-_143065639 | 39.34 |
ENSRNOT00000070923
|
AABR07065827.1
|
|
| chr14_+_22517774 | 39.33 |
ENSRNOT00000047655
|
Ugt2b37
|
UDP-glucuronosyltransferase 2 family, member 37 |
| chr9_+_41006800 | 39.26 |
ENSRNOT00000079413
ENSRNOT00000034214 |
Prss39
|
protease, serine, 39 |
| chr1_+_223214132 | 39.06 |
ENSRNOT00000066559
|
AABR07006142.1
|
|
| chr20_+_4020317 | 38.99 |
ENSRNOT00000000526
|
RT1-DOb
|
RT1 class II, locus DOb |
| chr6_-_138662365 | 38.89 |
ENSRNOT00000066209
ENSRNOT00000084892 |
Ighm
|
immunoglobulin heavy constant mu |
| chr15_+_31642169 | 38.87 |
ENSRNOT00000072362
|
AABR07017833.1
|
|
| chr15_-_29246222 | 38.66 |
ENSRNOT00000081806
|
AABR07017617.1
|
|
| chr4_+_14151343 | 38.64 |
ENSRNOT00000061687
ENSRNOT00000076573 ENSRNOT00000077219 ENSRNOT00000008319 |
Cd36
|
CD36 molecule |
| chr12_+_30198822 | 38.62 |
ENSRNOT00000041645
|
Gusb
|
glucuronidase, beta |
| chr15_-_34479741 | 38.53 |
ENSRNOT00000027759
|
Ripk3
|
receptor-interacting serine-threonine kinase 3 |
| chr6_-_139102378 | 38.34 |
ENSRNOT00000086423
|
AABR07065656.5
|
|
| chr13_-_36101411 | 38.34 |
ENSRNOT00000074471
|
Tmem37
|
transmembrane protein 37 |
| chr4_-_157263890 | 38.31 |
ENSRNOT00000065416
|
Ptpn6
|
protein tyrosine phosphatase, non-receptor type 6 |
| chr12_-_2826378 | 38.18 |
ENSRNOT00000061749
|
Clec4m
|
C-type lectin domain family 4 member M |
| chr1_-_16687817 | 38.03 |
ENSRNOT00000091376
ENSRNOT00000081620 |
Myb
|
MYB proto-oncogene, transcription factor |
| chr1_-_216828581 | 38.02 |
ENSRNOT00000066943
ENSRNOT00000088856 |
Tnfrsf26
|
tumor necrosis factor receptor superfamily, member 26 |
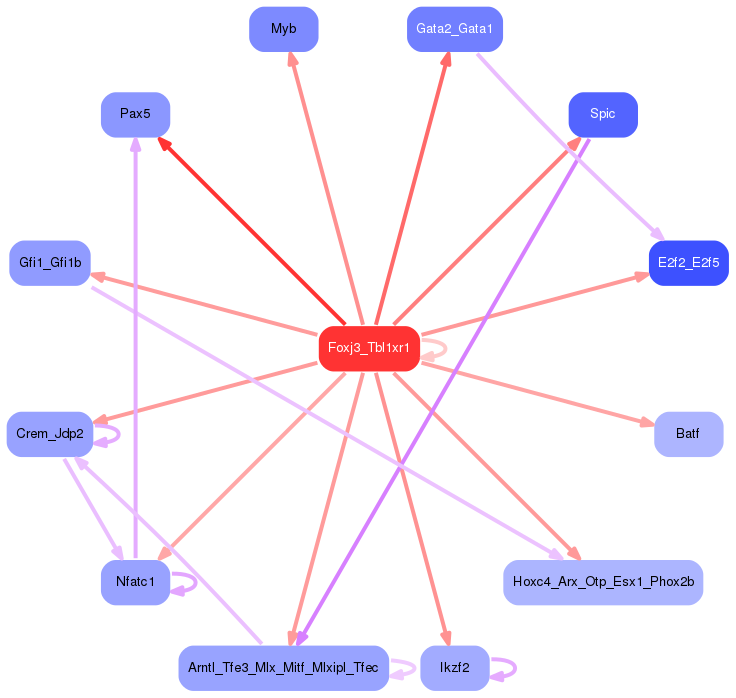
Network of associatons between targets according to the STRING database.

First level regulatory network of Foxj3_Tbl1xr1
Gene Ontology Analysis
Gene overrepresentation in biological process category:
| Log-likelihood per target | Total log-likelihood | Term | Description |
|---|---|---|---|
| 61.5 | 184.4 | GO:0002223 | stimulatory C-type lectin receptor signaling pathway(GO:0002223) |
| 28.5 | 170.7 | GO:0072564 | blood microparticle formation(GO:0072564) regulation of blood microparticle formation(GO:2000332) positive regulation of blood microparticle formation(GO:2000334) |
| 27.8 | 222.5 | GO:0050859 | negative regulation of B cell receptor signaling pathway(GO:0050859) |
| 26.0 | 78.0 | GO:0060369 | positive regulation of Fc receptor mediated stimulatory signaling pathway(GO:0060369) |
| 25.8 | 103.2 | GO:0019805 | quinolinate biosynthetic process(GO:0019805) |
| 25.2 | 75.6 | GO:0010903 | negative regulation of very-low-density lipoprotein particle remodeling(GO:0010903) |
| 23.0 | 23.0 | GO:0060101 | negative regulation of phagocytosis, engulfment(GO:0060101) |
| 22.4 | 67.2 | GO:0045085 | negative regulation of interleukin-2 biosynthetic process(GO:0045085) |
| 22.1 | 44.3 | GO:0034125 | negative regulation of MyD88-dependent toll-like receptor signaling pathway(GO:0034125) |
| 21.8 | 43.6 | GO:0034445 | regulation of plasma lipoprotein particle oxidation(GO:0034444) negative regulation of plasma lipoprotein particle oxidation(GO:0034445) |
| 21.4 | 64.2 | GO:1990869 | response to chemokine(GO:1990868) cellular response to chemokine(GO:1990869) |
| 21.2 | 148.7 | GO:0070269 | pyroptosis(GO:0070269) |
| 21.2 | 21.2 | GO:0045608 | negative regulation of auditory receptor cell differentiation(GO:0045608) |
| 20.7 | 62.1 | GO:0071733 | regulation of primitive erythrocyte differentiation(GO:0010725) transcriptional activation by promoter-enhancer looping(GO:0071733) gene looping(GO:0090202) dsDNA loop formation(GO:0090579) |
| 20.2 | 40.3 | GO:0002876 | positive regulation of chronic inflammatory response to antigenic stimulus(GO:0002876) |
| 19.8 | 79.0 | GO:0002378 | immunoglobulin biosynthetic process(GO:0002378) |
| 19.7 | 78.9 | GO:0070543 | response to linoleic acid(GO:0070543) |
| 19.2 | 57.7 | GO:0044240 | multicellular organism lipid catabolic process(GO:0044240) |
| 19.2 | 57.5 | GO:0045065 | cytotoxic T cell differentiation(GO:0045065) |
| 19.1 | 171.9 | GO:0052697 | xenobiotic glucuronidation(GO:0052697) |
| 18.9 | 510.4 | GO:0019373 | epoxygenase P450 pathway(GO:0019373) |
| 18.8 | 75.4 | GO:0002386 | immune response in mucosal-associated lymphoid tissue(GO:0002386) |
| 18.7 | 56.0 | GO:0071395 | response to jasmonic acid(GO:0009753) cellular response to jasmonic acid stimulus(GO:0071395) |
| 18.5 | 55.6 | GO:0052047 | interaction with other organism via secreted substance involved in symbiotic interaction(GO:0052047) |
| 18.3 | 54.9 | GO:0070175 | positive regulation of enamel mineralization(GO:0070175) |
| 17.6 | 70.5 | GO:0060332 | positive regulation of response to interferon-gamma(GO:0060332) positive regulation of interferon-gamma-mediated signaling pathway(GO:0060335) |
| 17.3 | 52.0 | GO:0010915 | regulation of very-low-density lipoprotein particle clearance(GO:0010915) negative regulation of very-low-density lipoprotein particle clearance(GO:0010916) |
| 17.3 | 189.9 | GO:0002291 | T cell activation via T cell receptor contact with antigen bound to MHC molecule on antigen presenting cell(GO:0002291) |
| 17.1 | 68.2 | GO:0002344 | peripheral B cell selection(GO:0002343) B cell affinity maturation(GO:0002344) |
| 17.0 | 68.0 | GO:1903576 | response to L-arginine(GO:1903576) |
| 16.9 | 50.8 | GO:0014916 | regulation of lung blood pressure(GO:0014916) |
| 16.8 | 50.3 | GO:2000449 | regulation of CD8-positive, alpha-beta T cell extravasation(GO:2000449) |
| 16.5 | 49.5 | GO:0070946 | neutrophil mediated killing of gram-positive bacterium(GO:0070946) |
| 16.5 | 49.4 | GO:0002215 | defense response to nematode(GO:0002215) |
| 16.4 | 32.9 | GO:0050713 | negative regulation of interleukin-1 beta secretion(GO:0050713) |
| 16.3 | 65.3 | GO:0002752 | cell surface pattern recognition receptor signaling pathway(GO:0002752) |
| 16.1 | 96.5 | GO:2000503 | positive regulation of natural killer cell chemotaxis(GO:2000503) |
| 16.1 | 48.2 | GO:0030200 | heparan sulfate proteoglycan catabolic process(GO:0030200) |
| 15.7 | 188.3 | GO:0002361 | CD4-positive, CD25-positive, alpha-beta regulatory T cell differentiation(GO:0002361) |
| 15.4 | 15.4 | GO:2000318 | positive regulation of T-helper 17 type immune response(GO:2000318) |
| 15.1 | 30.3 | GO:0060557 | positive regulation of vitamin metabolic process(GO:0046136) positive regulation of vitamin D biosynthetic process(GO:0060557) positive regulation of calcidiol 1-monooxygenase activity(GO:0060559) |
| 14.8 | 44.3 | GO:0002581 | negative regulation of antigen processing and presentation of peptide or polysaccharide antigen via MHC class II(GO:0002581) |
| 14.7 | 73.7 | GO:0002924 | negative regulation of humoral immune response mediated by circulating immunoglobulin(GO:0002924) |
| 14.5 | 29.0 | GO:0002727 | natural killer cell cytokine production(GO:0002370) regulation of natural killer cell cytokine production(GO:0002727) |
| 14.5 | 57.9 | GO:0007597 | blood coagulation, intrinsic pathway(GO:0007597) |
| 14.4 | 43.3 | GO:2000660 | negative regulation of interleukin-1-mediated signaling pathway(GO:2000660) |
| 14.4 | 43.2 | GO:0021698 | cerebellar cortex structural organization(GO:0021698) |
| 14.3 | 14.3 | GO:1903923 | protein processing in phagocytic vesicle(GO:1900756) regulation of protein processing in phagocytic vesicle(GO:1903921) positive regulation of protein processing in phagocytic vesicle(GO:1903923) |
| 14.2 | 42.7 | GO:2001183 | negative regulation of interleukin-12 secretion(GO:2001183) |
| 14.1 | 70.7 | GO:0045341 | MHC class I biosynthetic process(GO:0045341) regulation of MHC class I biosynthetic process(GO:0045343) positive regulation of MHC class I biosynthetic process(GO:0045345) |
| 14.1 | 98.8 | GO:0030101 | natural killer cell activation(GO:0030101) |
| 14.0 | 28.0 | GO:0002277 | myeloid dendritic cell activation involved in immune response(GO:0002277) |
| 13.9 | 27.8 | GO:1904580 | regulation of intracellular mRNA localization(GO:1904580) |
| 13.8 | 41.5 | GO:0035519 | protein K29-linked ubiquitination(GO:0035519) |
| 13.8 | 68.8 | GO:1903237 | negative regulation of leukocyte tethering or rolling(GO:1903237) |
| 13.6 | 40.9 | GO:2000458 | astrocyte chemotaxis(GO:0035700) regulation of astrocyte chemotaxis(GO:2000458) |
| 13.5 | 13.5 | GO:0051140 | regulation of NK T cell proliferation(GO:0051140) positive regulation of NK T cell proliferation(GO:0051142) |
| 13.5 | 161.9 | GO:0032740 | positive regulation of interleukin-17 production(GO:0032740) |
| 13.5 | 67.3 | GO:0043152 | induction of bacterial agglutination(GO:0043152) |
| 13.4 | 66.9 | GO:0006548 | histidine catabolic process(GO:0006548) |
| 13.3 | 26.6 | GO:0032701 | negative regulation of interleukin-18 production(GO:0032701) |
| 13.2 | 52.9 | GO:0034395 | regulation of transcription from RNA polymerase II promoter in response to iron(GO:0034395) |
| 13.0 | 52.0 | GO:0002669 | positive regulation of T cell anergy(GO:0002669) positive regulation of lymphocyte anergy(GO:0002913) |
| 12.8 | 25.7 | GO:2000422 | regulation of eosinophil chemotaxis(GO:2000422) positive regulation of eosinophil chemotaxis(GO:2000424) |
| 12.7 | 38.0 | GO:2000845 | positive regulation of testosterone secretion(GO:2000845) |
| 12.7 | 88.6 | GO:0051572 | negative regulation of histone H3-K4 methylation(GO:0051572) |
| 12.5 | 25.0 | GO:0002503 | MHC class II protein complex assembly(GO:0002399) peptide antigen assembly with MHC class II protein complex(GO:0002503) |
| 12.4 | 37.2 | GO:0002489 | antigen processing and presentation of endogenous peptide antigen via MHC class Ib via ER pathway(GO:0002488) antigen processing and presentation of endogenous peptide antigen via MHC class Ib via ER pathway, TAP-dependent(GO:0002489) |
| 12.4 | 136.0 | GO:0019886 | antigen processing and presentation of exogenous peptide antigen via MHC class II(GO:0019886) |
| 12.0 | 24.1 | GO:0070228 | regulation of lymphocyte apoptotic process(GO:0070228) |
| 12.0 | 36.1 | GO:0010897 | negative regulation of triglyceride catabolic process(GO:0010897) |
| 12.0 | 48.0 | GO:0051132 | NK T cell activation(GO:0051132) |
| 12.0 | 23.9 | GO:0033030 | negative regulation of neutrophil apoptotic process(GO:0033030) |
| 12.0 | 59.8 | GO:0002457 | T cell antigen processing and presentation(GO:0002457) |
| 11.8 | 47.2 | GO:0045084 | positive regulation of interleukin-12 biosynthetic process(GO:0045084) |
| 11.7 | 35.1 | GO:0098707 | ferrous iron import into cell(GO:0097460) ferrous iron import across plasma membrane(GO:0098707) |
| 11.7 | 46.7 | GO:0002331 | pre-B cell allelic exclusion(GO:0002331) |
| 11.6 | 23.3 | GO:0070947 | neutrophil mediated killing of fungus(GO:0070947) |
| 11.4 | 34.2 | GO:0030886 | negative regulation of myeloid dendritic cell activation(GO:0030886) |
| 11.4 | 11.4 | GO:0070268 | cornification(GO:0070268) |
| 11.3 | 56.6 | GO:0051919 | positive regulation of fibrinolysis(GO:0051919) |
| 11.3 | 22.6 | GO:0003330 | regulation of extracellular matrix constituent secretion(GO:0003330) positive regulation of extracellular matrix constituent secretion(GO:0003331) |
| 11.3 | 33.9 | GO:1901726 | negative regulation of histone deacetylase activity(GO:1901726) |
| 11.2 | 67.3 | GO:0061737 | leukotriene signaling pathway(GO:0061737) |
| 11.1 | 22.2 | GO:2001027 | negative regulation of endothelial cell chemotaxis(GO:2001027) |
| 11.1 | 22.1 | GO:0070839 | divalent metal ion export(GO:0070839) |
| 11.0 | 11.0 | GO:0045349 | interferon-alpha biosynthetic process(GO:0045349) regulation of interferon-alpha biosynthetic process(GO:0045354) |
| 11.0 | 33.0 | GO:0030208 | dermatan sulfate biosynthetic process(GO:0030208) |
| 10.9 | 65.2 | GO:0042535 | positive regulation of tumor necrosis factor biosynthetic process(GO:0042535) |
| 10.8 | 75.5 | GO:0015722 | canalicular bile acid transport(GO:0015722) |
| 10.8 | 118.6 | GO:0010818 | T cell chemotaxis(GO:0010818) |
| 10.8 | 32.3 | GO:0002337 | B-1a B cell differentiation(GO:0002337) |
| 10.7 | 21.3 | GO:0002579 | positive regulation of antigen processing and presentation(GO:0002579) |
| 10.6 | 31.7 | GO:0071461 | cellular response to redox state(GO:0071461) |
| 10.5 | 284.3 | GO:0006335 | DNA replication-dependent nucleosome assembly(GO:0006335) DNA replication-dependent nucleosome organization(GO:0034723) |
| 10.5 | 10.5 | GO:0045402 | interleukin-4 biosynthetic process(GO:0042097) regulation of interleukin-4 biosynthetic process(GO:0045402) positive regulation of interleukin-4 biosynthetic process(GO:0045404) |
| 10.5 | 31.4 | GO:1904444 | regulation of establishment of Sertoli cell barrier(GO:1904444) |
| 10.3 | 41.3 | GO:0045590 | negative regulation of regulatory T cell differentiation(GO:0045590) |
| 10.2 | 20.3 | GO:1990169 | detoxification of copper ion(GO:0010273) stress response to copper ion(GO:1990169) |
| 10.1 | 60.6 | GO:0010961 | cellular magnesium ion homeostasis(GO:0010961) |
| 10.0 | 20.1 | GO:0033364 | mast cell secretory granule organization(GO:0033364) |
| 9.9 | 39.7 | GO:0001907 | killing by symbiont of host cells(GO:0001907) disruption by symbiont of host cell(GO:0044004) |
| 9.9 | 88.8 | GO:2000484 | positive regulation of interleukin-8 secretion(GO:2000484) |
| 9.8 | 29.4 | GO:0002455 | humoral immune response mediated by circulating immunoglobulin(GO:0002455) |
| 9.7 | 291.6 | GO:0006958 | complement activation, classical pathway(GO:0006958) |
| 9.7 | 38.7 | GO:0034240 | negative regulation of macrophage fusion(GO:0034240) |
| 9.6 | 19.2 | GO:0046874 | quinolinate metabolic process(GO:0046874) |
| 9.6 | 38.4 | GO:0009992 | cellular water homeostasis(GO:0009992) |
| 9.6 | 47.9 | GO:0015755 | fructose transport(GO:0015755) |
| 9.6 | 296.5 | GO:0035458 | cellular response to interferon-beta(GO:0035458) |
| 9.5 | 19.1 | GO:0010034 | response to acetate(GO:0010034) |
| 9.5 | 57.2 | GO:0060267 | positive regulation of respiratory burst(GO:0060267) |
| 9.5 | 76.2 | GO:0010216 | maintenance of DNA methylation(GO:0010216) |
| 9.5 | 66.5 | GO:0045091 | single stranded viral RNA replication via double stranded DNA intermediate(GO:0039692) regulation of single stranded viral RNA replication via double stranded DNA intermediate(GO:0045091) |
| 9.5 | 28.4 | GO:1902412 | regulation of mitotic cytokinesis(GO:1902412) |
| 9.4 | 47.0 | GO:0006957 | complement activation, alternative pathway(GO:0006957) |
| 9.4 | 112.5 | GO:0002523 | leukocyte migration involved in inflammatory response(GO:0002523) |
| 9.4 | 28.1 | GO:0046061 | dATP catabolic process(GO:0046061) |
| 9.3 | 130.5 | GO:0006956 | complement activation(GO:0006956) |
| 9.3 | 18.5 | GO:0019884 | antigen processing and presentation of exogenous antigen(GO:0019884) |
| 9.3 | 46.3 | GO:0010037 | response to carbon dioxide(GO:0010037) |
| 9.2 | 27.6 | GO:0019677 | NAD catabolic process(GO:0019677) |
| 9.2 | 91.8 | GO:0050862 | positive regulation of T cell receptor signaling pathway(GO:0050862) |
| 9.2 | 55.1 | GO:1990086 | lens fiber cell apoptotic process(GO:1990086) |
| 9.1 | 27.4 | GO:0046864 | isoprenoid transport(GO:0046864) terpenoid transport(GO:0046865) |
| 9.1 | 9.1 | GO:0042253 | granulocyte macrophage colony-stimulating factor biosynthetic process(GO:0042253) regulation of granulocyte macrophage colony-stimulating factor biosynthetic process(GO:0045423) |
| 9.0 | 9.0 | GO:0060235 | lens induction in camera-type eye(GO:0060235) |
| 9.0 | 135.4 | GO:0034501 | protein localization to kinetochore(GO:0034501) |
| 8.9 | 62.5 | GO:0010886 | positive regulation of cholesterol storage(GO:0010886) |
| 8.9 | 8.9 | GO:0072566 | chemokine (C-X-C motif) ligand 1 production(GO:0072566) regulation of chemokine (C-X-C motif) ligand 1 production(GO:2000338) |
| 8.9 | 62.2 | GO:0031640 | killing of cells of other organism(GO:0031640) disruption of cells of other organism(GO:0044364) |
| 8.9 | 124.1 | GO:0042832 | defense response to protozoan(GO:0042832) |
| 8.8 | 70.3 | GO:0002360 | T cell lineage commitment(GO:0002360) |
| 8.7 | 8.7 | GO:0046618 | drug export(GO:0046618) |
| 8.7 | 69.6 | GO:0015679 | plasma membrane copper ion transport(GO:0015679) |
| 8.6 | 25.8 | GO:0002756 | MyD88-independent toll-like receptor signaling pathway(GO:0002756) |
| 8.6 | 42.8 | GO:0009115 | xanthine catabolic process(GO:0009115) |
| 8.5 | 42.7 | GO:0006569 | tryptophan catabolic process(GO:0006569) tryptophan catabolic process to kynurenine(GO:0019441) indole-containing compound catabolic process(GO:0042436) indolalkylamine catabolic process(GO:0046218) |
| 8.5 | 34.0 | GO:1902741 | type I interferon secretion(GO:0072641) interferon-alpha secretion(GO:0072642) regulation of interferon-alpha secretion(GO:1902739) positive regulation of interferon-alpha secretion(GO:1902741) |
| 8.5 | 17.0 | GO:1902226 | regulation of macrophage colony-stimulating factor signaling pathway(GO:1902226) regulation of response to macrophage colony-stimulating factor(GO:1903969) regulation of cellular response to macrophage colony-stimulating factor stimulus(GO:1903972) |
| 8.5 | 25.4 | GO:0051005 | negative regulation of lipoprotein lipase activity(GO:0051005) |
| 8.4 | 50.4 | GO:0033031 | positive regulation of neutrophil apoptotic process(GO:0033031) |
| 8.4 | 25.2 | GO:0019265 | glycine biosynthetic process, by transamination of glyoxylate(GO:0019265) |
| 8.4 | 16.7 | GO:0001810 | regulation of type I hypersensitivity(GO:0001810) type I hypersensitivity(GO:0016068) |
| 8.3 | 16.6 | GO:0032621 | interleukin-18 production(GO:0032621) |
| 8.3 | 91.2 | GO:0002517 | T cell tolerance induction(GO:0002517) |
| 8.3 | 99.4 | GO:0043374 | CD8-positive, alpha-beta T cell differentiation(GO:0043374) |
| 8.3 | 33.1 | GO:1904975 | response to bleomycin(GO:1904975) |
| 8.3 | 41.4 | GO:0033625 | positive regulation of integrin activation(GO:0033625) |
| 8.3 | 33.0 | GO:0016998 | cell wall macromolecule catabolic process(GO:0016998) |
| 8.2 | 73.8 | GO:0045059 | positive thymic T cell selection(GO:0045059) |
| 8.2 | 40.9 | GO:0000706 | meiotic DNA double-strand break processing(GO:0000706) |
| 8.1 | 105.9 | GO:0035634 | response to stilbenoid(GO:0035634) |
| 8.1 | 24.4 | GO:0000738 | DNA catabolic process, exonucleolytic(GO:0000738) |
| 8.1 | 40.6 | GO:2000108 | positive regulation of leukocyte apoptotic process(GO:2000108) |
| 8.1 | 24.3 | GO:0045416 | positive regulation of interleukin-8 biosynthetic process(GO:0045416) |
| 8.1 | 8.1 | GO:2000097 | regulation of smooth muscle cell-matrix adhesion(GO:2000097) |
| 8.0 | 24.1 | GO:0071169 | establishment of protein localization to chromatin(GO:0071169) |
| 8.0 | 16.0 | GO:0034197 | acylglycerol transport(GO:0034196) triglyceride transport(GO:0034197) |
| 7.9 | 102.6 | GO:0051573 | negative regulation of histone H3-K9 methylation(GO:0051573) |
| 7.8 | 31.1 | GO:0006272 | leading strand elongation(GO:0006272) |
| 7.8 | 31.0 | GO:2000402 | negative regulation of lymphocyte migration(GO:2000402) |
| 7.8 | 23.3 | GO:0070602 | regulation of centromeric sister chromatid cohesion(GO:0070602) |
| 7.7 | 30.9 | GO:0043305 | negative regulation of mast cell degranulation(GO:0043305) |
| 7.6 | 38.2 | GO:0046642 | negative regulation of alpha-beta T cell proliferation(GO:0046642) |
| 7.6 | 60.8 | GO:0000050 | urea cycle(GO:0000050) |
| 7.5 | 15.1 | GO:0097278 | complement-dependent cytotoxicity(GO:0097278) |
| 7.5 | 30.1 | GO:0032827 | natural killer cell differentiation involved in immune response(GO:0002325) negative regulation of natural killer cell differentiation(GO:0032824) regulation of natural killer cell differentiation involved in immune response(GO:0032826) negative regulation of natural killer cell differentiation involved in immune response(GO:0032827) |
| 7.5 | 7.5 | GO:2000630 | positive regulation of miRNA metabolic process(GO:2000630) |
| 7.5 | 67.7 | GO:0022614 | membrane to membrane docking(GO:0022614) |
| 7.5 | 60.1 | GO:0001865 | NK T cell differentiation(GO:0001865) |
| 7.5 | 22.5 | GO:0038172 | interleukin-33-mediated signaling pathway(GO:0038172) |
| 7.5 | 112.5 | GO:0015671 | oxygen transport(GO:0015671) |
| 7.5 | 7.5 | GO:1904170 | regulation of bleb assembly(GO:1904170) |
| 7.5 | 29.9 | GO:0002315 | marginal zone B cell differentiation(GO:0002315) |
| 7.4 | 74.5 | GO:0051315 | attachment of mitotic spindle microtubules to kinetochore(GO:0051315) |
| 7.4 | 29.8 | GO:0048687 | positive regulation of sprouting of injured axon(GO:0048687) positive regulation of axon extension involved in regeneration(GO:0048691) |
| 7.4 | 51.8 | GO:0016584 | nucleosome positioning(GO:0016584) |
| 7.4 | 7.4 | GO:0002780 | antimicrobial peptide biosynthetic process(GO:0002777) antibacterial peptide biosynthetic process(GO:0002780) |
| 7.4 | 66.5 | GO:0006968 | cellular defense response(GO:0006968) |
| 7.4 | 14.8 | GO:0002439 | chronic inflammatory response to antigenic stimulus(GO:0002439) |
| 7.3 | 29.2 | GO:0097527 | necroptotic signaling pathway(GO:0097527) |
| 7.3 | 65.3 | GO:0035456 | response to interferon-beta(GO:0035456) |
| 7.2 | 7.2 | GO:0042509 | regulation of tyrosine phosphorylation of STAT protein(GO:0042509) positive regulation of tyrosine phosphorylation of STAT protein(GO:0042531) |
| 7.2 | 28.8 | GO:0019371 | cyclooxygenase pathway(GO:0019371) |
| 7.2 | 21.6 | GO:0044806 | G-quadruplex DNA unwinding(GO:0044806) |
| 7.2 | 28.7 | GO:0001834 | trophectodermal cell proliferation(GO:0001834) |
| 7.1 | 14.3 | GO:0071459 | protein localization to chromosome, centromeric region(GO:0071459) |
| 7.1 | 21.4 | GO:0002281 | macrophage activation involved in immune response(GO:0002281) |
| 7.1 | 21.3 | GO:0006116 | NADH oxidation(GO:0006116) |
| 7.1 | 28.4 | GO:1905168 | positive regulation of double-strand break repair via homologous recombination(GO:1905168) |
| 7.1 | 28.4 | GO:0090290 | positive regulation of osteoclast proliferation(GO:0090290) |
| 7.1 | 99.0 | GO:0006067 | ethanol metabolic process(GO:0006067) |
| 7.0 | 28.1 | GO:2000255 | negative regulation of male germ cell proliferation(GO:2000255) |
| 7.0 | 21.1 | GO:0014739 | positive regulation of muscle hyperplasia(GO:0014739) |
| 6.9 | 20.8 | GO:0006547 | histidine metabolic process(GO:0006547) |
| 6.9 | 48.5 | GO:0032074 | negative regulation of nuclease activity(GO:0032074) |
| 6.9 | 13.9 | GO:1901523 | leukotriene catabolic process(GO:0036100) leukotriene B4 catabolic process(GO:0036101) leukotriene B4 metabolic process(GO:0036102) icosanoid catabolic process(GO:1901523) fatty acid derivative catabolic process(GO:1901569) |
| 6.9 | 20.7 | GO:0002408 | myeloid dendritic cell chemotaxis(GO:0002408) |
| 6.9 | 20.7 | GO:0030576 | Cajal body organization(GO:0030576) |
| 6.9 | 27.6 | GO:0034421 | post-translational protein acetylation(GO:0034421) |
| 6.9 | 13.8 | GO:0070433 | negative regulation of nucleotide-binding oligomerization domain containing signaling pathway(GO:0070425) negative regulation of nucleotide-binding oligomerization domain containing 2 signaling pathway(GO:0070433) |
| 6.9 | 20.6 | GO:1903173 | phytol metabolic process(GO:0033306) fatty alcohol metabolic process(GO:1903173) |
| 6.9 | 6.9 | GO:0071226 | cellular response to molecule of fungal origin(GO:0071226) |
| 6.9 | 20.6 | GO:0034769 | basement membrane disassembly(GO:0034769) |
| 6.8 | 13.6 | GO:0007066 | female meiosis sister chromatid cohesion(GO:0007066) |
| 6.8 | 61.0 | GO:0043368 | positive T cell selection(GO:0043368) |
| 6.8 | 20.3 | GO:0038110 | interleukin-2-mediated signaling pathway(GO:0038110) |
| 6.7 | 13.4 | GO:0046967 | cytosol to ER transport(GO:0046967) peptide antigen transport(GO:0046968) |
| 6.7 | 6.7 | GO:0010716 | negative regulation of extracellular matrix disassembly(GO:0010716) |
| 6.7 | 13.3 | GO:0071259 | cellular response to magnetism(GO:0071259) |
| 6.7 | 40.0 | GO:0033623 | regulation of integrin activation(GO:0033623) |
| 6.7 | 26.6 | GO:0019853 | L-ascorbic acid biosynthetic process(GO:0019853) |
| 6.6 | 33.0 | GO:0010032 | meiotic chromosome condensation(GO:0010032) |
| 6.6 | 19.8 | GO:0051977 | lysophospholipid transport(GO:0051977) |
| 6.5 | 19.6 | GO:1990743 | protein sialylation(GO:1990743) |
| 6.5 | 13.1 | GO:1903595 | positive regulation of histamine secretion by mast cell(GO:1903595) |
| 6.5 | 6.5 | GO:0061470 | T follicular helper cell differentiation(GO:0061470) |
| 6.5 | 25.9 | GO:0045903 | positive regulation of translational fidelity(GO:0045903) |
| 6.5 | 25.9 | GO:0071608 | macrophage inflammatory protein-1 alpha production(GO:0071608) regulation of macrophage inflammatory protein 1 alpha production(GO:0071640) |
| 6.4 | 25.8 | GO:0016554 | cytidine to uridine editing(GO:0016554) |
| 6.4 | 77.1 | GO:0006707 | cholesterol catabolic process(GO:0006707) sterol catabolic process(GO:0016127) |
| 6.4 | 63.7 | GO:0006570 | tyrosine metabolic process(GO:0006570) |
| 6.2 | 18.6 | GO:1903860 | negative regulation of dendrite extension(GO:1903860) |
| 6.1 | 6.1 | GO:0002644 | negative regulation of tolerance induction(GO:0002644) |
| 6.1 | 18.4 | GO:0039534 | negative regulation of MDA-5 signaling pathway(GO:0039534) |
| 6.1 | 18.4 | GO:0090187 | positive regulation of pancreatic juice secretion(GO:0090187) |
| 6.1 | 18.4 | GO:0036378 | calcitriol biosynthetic process from calciol(GO:0036378) |
| 6.1 | 220.2 | GO:0002474 | antigen processing and presentation of peptide antigen via MHC class I(GO:0002474) |
| 6.1 | 30.5 | GO:0010360 | negative regulation of anion channel activity(GO:0010360) |
| 6.0 | 48.4 | GO:0002726 | positive regulation of T cell cytokine production(GO:0002726) |
| 6.0 | 42.1 | GO:0042730 | fibrinolysis(GO:0042730) |
| 6.0 | 17.9 | GO:0042222 | interleukin-1 biosynthetic process(GO:0042222) |
| 6.0 | 6.0 | GO:0009624 | response to nematode(GO:0009624) |
| 5.9 | 29.7 | GO:0034145 | positive regulation of toll-like receptor 4 signaling pathway(GO:0034145) |
| 5.9 | 29.6 | GO:0002322 | B cell proliferation involved in immune response(GO:0002322) |
| 5.9 | 5.9 | GO:0090467 | L-arginine import(GO:0043091) arginine import(GO:0090467) L-arginine transport(GO:1902023) |
| 5.9 | 23.6 | GO:0060155 | platelet dense granule organization(GO:0060155) |
| 5.9 | 35.4 | GO:0015860 | purine nucleoside transmembrane transport(GO:0015860) |
| 5.9 | 64.4 | GO:0010603 | regulation of cytoplasmic mRNA processing body assembly(GO:0010603) |
| 5.8 | 23.4 | GO:2000705 | regulation of dense core granule biogenesis(GO:2000705) |
| 5.7 | 28.6 | GO:0006269 | DNA replication, synthesis of RNA primer(GO:0006269) |
| 5.7 | 22.9 | GO:0002507 | tolerance induction(GO:0002507) |
| 5.7 | 22.7 | GO:0046645 | positive regulation of gamma-delta T cell differentiation(GO:0045588) positive regulation of gamma-delta T cell activation(GO:0046645) |
| 5.7 | 22.7 | GO:0001574 | ganglioside biosynthetic process(GO:0001574) |
| 5.6 | 33.8 | GO:0030916 | otic vesicle formation(GO:0030916) |
| 5.6 | 5.6 | GO:0046654 | tetrahydrofolate biosynthetic process(GO:0046654) |
| 5.6 | 11.2 | GO:0003162 | atrioventricular node development(GO:0003162) |
| 5.6 | 22.4 | GO:0097681 | double-strand break repair via alternative nonhomologous end joining(GO:0097681) |
| 5.6 | 11.1 | GO:0032757 | positive regulation of interleukin-8 production(GO:0032757) |
| 5.5 | 27.7 | GO:0089700 | protein kinase D signaling(GO:0089700) |
| 5.5 | 16.6 | GO:0007056 | spindle assembly involved in female meiosis(GO:0007056) |
| 5.5 | 22.1 | GO:0009441 | glycolate metabolic process(GO:0009441) |
| 5.5 | 82.8 | GO:0010838 | positive regulation of keratinocyte proliferation(GO:0010838) |
| 5.5 | 27.6 | GO:0006297 | nucleotide-excision repair, DNA gap filling(GO:0006297) |
| 5.5 | 66.1 | GO:0038094 | Fc-gamma receptor signaling pathway(GO:0038094) |
| 5.5 | 22.0 | GO:0032485 | regulation of Ral protein signal transduction(GO:0032485) |
| 5.5 | 120.8 | GO:0030574 | collagen catabolic process(GO:0030574) |
| 5.5 | 11.0 | GO:0019364 | NADP catabolic process(GO:0006742) pyridine nucleotide catabolic process(GO:0019364) |
| 5.5 | 103.9 | GO:0001833 | inner cell mass cell proliferation(GO:0001833) |
| 5.4 | 10.9 | GO:0031666 | positive regulation of lipopolysaccharide-mediated signaling pathway(GO:0031666) |
| 5.4 | 70.3 | GO:0002551 | mast cell chemotaxis(GO:0002551) |
| 5.4 | 10.8 | GO:0060003 | copper ion export(GO:0060003) |
| 5.4 | 26.9 | GO:0050798 | activated T cell proliferation(GO:0050798) |
| 5.4 | 10.8 | GO:0042360 | vitamin E metabolic process(GO:0042360) |
| 5.4 | 21.5 | GO:0061113 | pancreas morphogenesis(GO:0061113) |
| 5.4 | 48.2 | GO:0046598 | positive regulation of viral entry into host cell(GO:0046598) |
| 5.4 | 10.7 | GO:0002426 | immunoglobulin production in mucosal tissue(GO:0002426) |
| 5.3 | 16.0 | GO:2000587 | negative regulation of platelet-derived growth factor receptor-beta signaling pathway(GO:2000587) |
| 5.3 | 21.4 | GO:1903334 | positive regulation of protein folding(GO:1903334) |
| 5.3 | 96.0 | GO:0046597 | negative regulation of viral entry into host cell(GO:0046597) |
| 5.3 | 16.0 | GO:2000348 | regulation of CD40 signaling pathway(GO:2000348) |
| 5.3 | 26.5 | GO:1903925 | response to bisphenol A(GO:1903925) |
| 5.3 | 42.3 | GO:0000083 | regulation of transcription involved in G1/S transition of mitotic cell cycle(GO:0000083) |
| 5.3 | 47.5 | GO:0070493 | thrombin receptor signaling pathway(GO:0070493) |
| 5.3 | 15.8 | GO:0016267 | O-glycan processing, core 1(GO:0016267) |
| 5.3 | 10.5 | GO:2000645 | negative regulation of receptor catabolic process(GO:2000645) |
| 5.2 | 15.6 | GO:0090135 | actin filament branching(GO:0090135) |
| 5.2 | 15.6 | GO:1901423 | response to benzene(GO:1901423) |
| 5.2 | 20.8 | GO:1902093 | positive regulation of sperm motility(GO:1902093) |
| 5.2 | 5.2 | GO:2000054 | negative regulation of Wnt signaling pathway involved in dorsal/ventral axis specification(GO:2000054) |
| 5.1 | 36.0 | GO:0051026 | chiasma assembly(GO:0051026) |
| 5.1 | 30.8 | GO:0045329 | carnitine biosynthetic process(GO:0045329) |
| 5.1 | 40.8 | GO:0048535 | lymph node development(GO:0048535) |
| 5.1 | 5.1 | GO:0000270 | peptidoglycan metabolic process(GO:0000270) peptidoglycan catabolic process(GO:0009253) |
| 5.1 | 111.6 | GO:0006855 | drug transmembrane transport(GO:0006855) |
| 5.1 | 25.3 | GO:0035672 | oligopeptide transmembrane transport(GO:0035672) |
| 5.1 | 10.1 | GO:0060167 | regulation of adenosine receptor signaling pathway(GO:0060167) |
| 5.0 | 5.0 | GO:0071460 | cellular response to cell-matrix adhesion(GO:0071460) |
| 5.0 | 15.0 | GO:0030221 | basophil differentiation(GO:0030221) |
| 5.0 | 49.9 | GO:0006265 | DNA topological change(GO:0006265) |
| 5.0 | 5.0 | GO:0060847 | endothelial cell fate specification(GO:0060847) |
| 5.0 | 49.7 | GO:1990001 | inhibition of cysteine-type endopeptidase activity involved in apoptotic process(GO:1990001) |
| 5.0 | 14.9 | GO:0060718 | chorionic trophoblast cell differentiation(GO:0060718) |
| 4.9 | 14.8 | GO:0097350 | neutrophil clearance(GO:0097350) |
| 4.9 | 14.8 | GO:0060066 | oviduct development(GO:0060066) |
| 4.9 | 44.5 | GO:0003360 | brainstem development(GO:0003360) |
| 4.9 | 4.9 | GO:0010873 | positive regulation of cholesterol esterification(GO:0010873) |
| 4.9 | 24.5 | GO:0060298 | positive regulation of sarcomere organization(GO:0060298) |
| 4.9 | 9.8 | GO:0035408 | histone H3-T6 phosphorylation(GO:0035408) |
| 4.9 | 9.8 | GO:0016098 | monoterpenoid metabolic process(GO:0016098) |
| 4.9 | 24.4 | GO:0050917 | sensory perception of umami taste(GO:0050917) |
| 4.8 | 24.2 | GO:0006177 | GMP biosynthetic process(GO:0006177) |
| 4.8 | 14.5 | GO:1904569 | regulation of selenocysteine incorporation(GO:1904569) |
| 4.8 | 53.1 | GO:0002227 | innate immune response in mucosa(GO:0002227) |
| 4.8 | 14.3 | GO:0019303 | D-ribose catabolic process(GO:0019303) |
| 4.8 | 28.6 | GO:0045579 | positive regulation of B cell differentiation(GO:0045579) |
| 4.8 | 19.1 | GO:0048252 | lauric acid metabolic process(GO:0048252) |
| 4.8 | 14.3 | GO:0009227 | nucleotide-sugar catabolic process(GO:0009227) |
| 4.8 | 4.8 | GO:0070541 | response to platinum ion(GO:0070541) |
| 4.8 | 14.3 | GO:0007403 | glial cell fate determination(GO:0007403) |
| 4.7 | 9.5 | GO:2000567 | memory T cell activation(GO:0035709) regulation of memory T cell activation(GO:2000567) positive regulation of memory T cell activation(GO:2000568) |
| 4.7 | 4.7 | GO:2001181 | positive regulation of interleukin-10 secretion(GO:2001181) |
| 4.7 | 9.5 | GO:0048560 | establishment of anatomical structure orientation(GO:0048560) |
| 4.7 | 18.9 | GO:0006685 | sphingomyelin catabolic process(GO:0006685) |
| 4.7 | 14.2 | GO:0070212 | protein poly-ADP-ribosylation(GO:0070212) |
| 4.7 | 4.7 | GO:0000966 | RNA 5'-end processing(GO:0000966) |
| 4.7 | 9.4 | GO:0038145 | macrophage colony-stimulating factor signaling pathway(GO:0038145) |
| 4.7 | 28.2 | GO:0090267 | positive regulation of spindle checkpoint(GO:0090232) positive regulation of mitotic cell cycle spindle assembly checkpoint(GO:0090267) |
| 4.7 | 18.7 | GO:1990830 | response to leukemia inhibitory factor(GO:1990823) cellular response to leukemia inhibitory factor(GO:1990830) |
| 4.7 | 9.4 | GO:1903347 | negative regulation of bicellular tight junction assembly(GO:1903347) |
| 4.7 | 14.0 | GO:0018992 | germ-line sex determination(GO:0018992) |
| 4.6 | 9.2 | GO:1902569 | regulation of activation of JAK2 kinase activity(GO:0010534) activation of JAK2 kinase activity(GO:0042977) negative regulation of activation of JAK2 kinase activity(GO:1902569) |
| 4.6 | 9.1 | GO:1904479 | negative regulation of intestinal absorption(GO:1904479) |
| 4.5 | 40.9 | GO:0043306 | positive regulation of mast cell activation involved in immune response(GO:0033008) positive regulation of mast cell degranulation(GO:0043306) |
| 4.5 | 22.7 | GO:0051594 | detection of carbohydrate stimulus(GO:0009730) detection of hexose stimulus(GO:0009732) detection of monosaccharide stimulus(GO:0034287) detection of glucose(GO:0051594) |
| 4.5 | 13.6 | GO:0090487 | toxin catabolic process(GO:0009407) mycotoxin catabolic process(GO:0043387) aflatoxin catabolic process(GO:0046223) secondary metabolite catabolic process(GO:0090487) organic heteropentacyclic compound catabolic process(GO:1901377) |
| 4.5 | 22.5 | GO:0070170 | regulation of tooth mineralization(GO:0070170) |
| 4.5 | 13.5 | GO:2000661 | positive regulation of interleukin-1-mediated signaling pathway(GO:2000661) |
| 4.4 | 13.2 | GO:0090306 | spindle assembly involved in meiosis(GO:0090306) |
| 4.4 | 119.0 | GO:0000027 | ribosomal large subunit assembly(GO:0000027) |
| 4.4 | 13.2 | GO:0042126 | nitrate metabolic process(GO:0042126) |
| 4.4 | 4.4 | GO:0006014 | D-ribose metabolic process(GO:0006014) |
| 4.4 | 26.4 | GO:0002504 | antigen processing and presentation of peptide or polysaccharide antigen via MHC class II(GO:0002504) |
| 4.4 | 8.8 | GO:0046490 | isopentenyl diphosphate biosynthetic process(GO:0009240) isopentenyl diphosphate metabolic process(GO:0046490) |
| 4.4 | 26.3 | GO:0070973 | protein localization to endoplasmic reticulum exit site(GO:0070973) |
| 4.4 | 17.5 | GO:0060586 | multicellular organismal iron ion homeostasis(GO:0060586) |
| 4.4 | 4.4 | GO:0048102 | autophagic cell death(GO:0048102) |
| 4.3 | 13.0 | GO:0006045 | N-acetylglucosamine biosynthetic process(GO:0006045) N-acetylneuraminate biosynthetic process(GO:0046380) |
| 4.3 | 12.9 | GO:0019660 | fermentation(GO:0006113) glucose catabolic process to lactate(GO:0019659) glycolytic fermentation(GO:0019660) glucose catabolic process to lactate via pyruvate(GO:0019661) |
| 4.3 | 4.3 | GO:0035740 | CD8-positive, alpha-beta T cell proliferation(GO:0035740) |
| 4.2 | 17.0 | GO:0019585 | uronic acid metabolic process(GO:0006063) glucuronate metabolic process(GO:0019585) |
| 4.2 | 29.7 | GO:0033004 | negative regulation of mast cell activation(GO:0033004) |
| 4.2 | 21.2 | GO:0035376 | sterol import(GO:0035376) cholesterol import(GO:0070508) |
| 4.2 | 25.4 | GO:0035726 | common myeloid progenitor cell proliferation(GO:0035726) |
| 4.2 | 4.2 | GO:0046338 | phosphatidylethanolamine catabolic process(GO:0046338) |
| 4.2 | 12.6 | GO:0072697 | protein localization to cell cortex(GO:0072697) |
| 4.2 | 21.0 | GO:0010587 | miRNA catabolic process(GO:0010587) |
| 4.2 | 4.2 | GO:1902659 | regulation of glucose mediated signaling pathway(GO:1902659) |
| 4.2 | 16.8 | GO:0045409 | negative regulation of interleukin-6 biosynthetic process(GO:0045409) |
| 4.2 | 130.0 | GO:0006953 | acute-phase response(GO:0006953) |
| 4.2 | 8.3 | GO:0045357 | interferon-beta biosynthetic process(GO:0045350) regulation of interferon-beta biosynthetic process(GO:0045357) |
| 4.2 | 33.3 | GO:1900264 | regulation of DNA-directed DNA polymerase activity(GO:1900262) positive regulation of DNA-directed DNA polymerase activity(GO:1900264) |
| 4.2 | 8.3 | GO:0043316 | cytotoxic T cell degranulation(GO:0043316) |
| 4.1 | 4.1 | GO:0006975 | DNA damage induced protein phosphorylation(GO:0006975) |
| 4.1 | 8.3 | GO:0002326 | B cell lineage commitment(GO:0002326) |
| 4.1 | 32.9 | GO:0042905 | 9-cis-retinoic acid biosynthetic process(GO:0042904) 9-cis-retinoic acid metabolic process(GO:0042905) |
| 4.1 | 20.5 | GO:0002827 | positive regulation of T-helper 1 type immune response(GO:0002827) |
| 4.1 | 4.1 | GO:0009436 | glyoxylate catabolic process(GO:0009436) |
| 4.1 | 12.2 | GO:0046015 | regulation of transcription by glucose(GO:0046015) |
| 4.0 | 72.8 | GO:0071803 | positive regulation of podosome assembly(GO:0071803) |
| 4.0 | 12.1 | GO:0019626 | short-chain fatty acid catabolic process(GO:0019626) |
| 4.0 | 12.1 | GO:0045414 | interleukin-8 biosynthetic process(GO:0042228) regulation of interleukin-8 biosynthetic process(GO:0045414) |
| 4.0 | 12.0 | GO:0016240 | autophagosome docking(GO:0016240) |
| 4.0 | 15.9 | GO:0038165 | oncostatin-M-mediated signaling pathway(GO:0038165) |
| 4.0 | 4.0 | GO:1905204 | negative regulation of connective tissue replacement(GO:1905204) |
| 4.0 | 8.0 | GO:2001280 | positive regulation of prostaglandin biosynthetic process(GO:0031394) positive regulation of glycogen catabolic process(GO:0045819) positive regulation of unsaturated fatty acid biosynthetic process(GO:2001280) |
| 4.0 | 11.9 | GO:0045347 | negative regulation of MHC class II biosynthetic process(GO:0045347) |
| 3.9 | 15.8 | GO:0046641 | positive regulation of alpha-beta T cell proliferation(GO:0046641) |
| 3.9 | 7.9 | GO:1904354 | negative regulation of telomere capping(GO:1904354) |
| 3.9 | 19.7 | GO:0061086 | negative regulation of histone H3-K27 methylation(GO:0061086) |
| 3.9 | 11.8 | GO:0048749 | compound eye development(GO:0048749) |
| 3.9 | 23.4 | GO:0000255 | allantoin metabolic process(GO:0000255) |
| 3.9 | 3.9 | GO:0008582 | regulation of synaptic growth at neuromuscular junction(GO:0008582) |
| 3.9 | 7.8 | GO:0002339 | B cell selection(GO:0002339) |
| 3.9 | 34.9 | GO:0001771 | immunological synapse formation(GO:0001771) |
| 3.9 | 3.9 | GO:0038095 | Fc-epsilon receptor signaling pathway(GO:0038095) |
| 3.9 | 3.9 | GO:0007060 | male meiosis chromosome segregation(GO:0007060) |
| 3.9 | 7.7 | GO:0042668 | auditory receptor cell fate determination(GO:0042668) |
| 3.9 | 11.6 | GO:1901535 | protection of DNA demethylation of female pronucleus(GO:0044726) regulation of DNA demethylation(GO:1901535) negative regulation of DNA demethylation(GO:1901536) |
| 3.8 | 11.5 | GO:0090166 | Golgi disassembly(GO:0090166) |
| 3.8 | 3.8 | GO:0072429 | response to intra-S DNA damage checkpoint signaling(GO:0072429) |
| 3.8 | 15.2 | GO:0043137 | DNA replication, removal of RNA primer(GO:0043137) |
| 3.8 | 26.6 | GO:0007096 | regulation of exit from mitosis(GO:0007096) |
| 3.8 | 11.3 | GO:1904211 | membrane protein proteolysis involved in retrograde protein transport, ER to cytosol(GO:1904211) |
| 3.8 | 3.8 | GO:0046687 | response to chromate(GO:0046687) |
| 3.8 | 15.0 | GO:0044339 | canonical Wnt signaling pathway involved in osteoblast differentiation(GO:0044339) |
| 3.7 | 11.2 | GO:0090081 | regulation of heart induction by regulation of canonical Wnt signaling pathway(GO:0090081) |
| 3.7 | 48.4 | GO:0006309 | apoptotic DNA fragmentation(GO:0006309) |
| 3.7 | 14.9 | GO:2000271 | positive regulation of fibroblast apoptotic process(GO:2000271) |
| 3.7 | 3.7 | GO:0002414 | immunoglobulin transcytosis in epithelial cells(GO:0002414) |
| 3.7 | 107.9 | GO:0000028 | ribosomal small subunit assembly(GO:0000028) |
| 3.7 | 11.1 | GO:0060743 | epithelial cell maturation involved in prostate gland development(GO:0060743) |
| 3.7 | 3.7 | GO:0045348 | positive regulation of MHC class II biosynthetic process(GO:0045348) |
| 3.7 | 70.0 | GO:0032814 | regulation of natural killer cell activation(GO:0032814) |
| 3.7 | 36.8 | GO:0002467 | germinal center formation(GO:0002467) |
| 3.7 | 36.6 | GO:0007076 | mitotic chromosome condensation(GO:0007076) |
| 3.7 | 47.5 | GO:0006880 | intracellular sequestering of iron ion(GO:0006880) sequestering of iron ion(GO:0097577) |
| 3.6 | 10.9 | GO:0071031 | nuclear mRNA surveillance of mRNA 3'-end processing(GO:0071031) nuclear polyadenylation-dependent tRNA catabolic process(GO:0071038) nuclear retention of pre-mRNA with aberrant 3'-ends at the site of transcription(GO:0071049) |
| 3.6 | 10.9 | GO:0030505 | inorganic diphosphate transport(GO:0030505) |
| 3.6 | 10.9 | GO:0006011 | UDP-glucose metabolic process(GO:0006011) |
| 3.6 | 14.4 | GO:0002407 | dendritic cell chemotaxis(GO:0002407) |
| 3.6 | 10.8 | GO:0006642 | triglyceride mobilization(GO:0006642) |
| 3.6 | 10.8 | GO:0009609 | response to symbiotic bacterium(GO:0009609) |
| 3.6 | 21.6 | GO:0070544 | histone H3-K36 demethylation(GO:0070544) |
| 3.6 | 25.2 | GO:0071377 | cellular response to glucagon stimulus(GO:0071377) |
| 3.6 | 35.9 | GO:0070935 | 3'-UTR-mediated mRNA stabilization(GO:0070935) |
| 3.6 | 35.9 | GO:0002430 | complement receptor mediated signaling pathway(GO:0002430) |
| 3.6 | 10.7 | GO:0019230 | proprioception(GO:0019230) |
| 3.5 | 7.1 | GO:0046391 | 5-phosphoribose 1-diphosphate biosynthetic process(GO:0006015) 5-phosphoribose 1-diphosphate metabolic process(GO:0046391) |
| 3.5 | 14.1 | GO:0019372 | lipoxygenase pathway(GO:0019372) |
| 3.5 | 17.6 | GO:0070309 | lens fiber cell morphogenesis(GO:0070309) |
| 3.5 | 14.0 | GO:0075522 | IRES-dependent viral translational initiation(GO:0075522) |
| 3.5 | 3.5 | GO:0008588 | release of cytoplasmic sequestered NF-kappaB(GO:0008588) |
| 3.5 | 20.8 | GO:2001270 | regulation of cysteine-type endopeptidase activity involved in execution phase of apoptosis(GO:2001270) negative regulation of cysteine-type endopeptidase activity involved in execution phase of apoptosis(GO:2001271) |
| 3.5 | 10.4 | GO:0070904 | L-ascorbic acid transport(GO:0015882) transepithelial L-ascorbic acid transport(GO:0070904) |
| 3.5 | 17.3 | GO:0010528 | regulation of transposition(GO:0010528) negative regulation of transposition(GO:0010529) |
| 3.5 | 13.8 | GO:2000354 | regulation of ovarian follicle development(GO:2000354) |
| 3.4 | 3.4 | GO:0097029 | mature conventional dendritic cell differentiation(GO:0097029) |
| 3.4 | 10.2 | GO:0046060 | dATP metabolic process(GO:0046060) |
| 3.4 | 34.1 | GO:2000234 | positive regulation of ribosome biogenesis(GO:0090070) positive regulation of rRNA processing(GO:2000234) |
| 3.4 | 17.0 | GO:0045591 | positive regulation of regulatory T cell differentiation(GO:0045591) |
| 3.4 | 6.8 | GO:0007356 | thorax and anterior abdomen determination(GO:0007356) |
| 3.4 | 10.2 | GO:1902714 | negative regulation of interferon-gamma secretion(GO:1902714) |
| 3.4 | 747.5 | GO:0010951 | negative regulation of endopeptidase activity(GO:0010951) |
| 3.4 | 6.8 | GO:0044208 | 'de novo' AMP biosynthetic process(GO:0044208) |
| 3.4 | 10.2 | GO:1900060 | negative regulation of ceramide biosynthetic process(GO:1900060) |
| 3.4 | 50.8 | GO:0006691 | leukotriene metabolic process(GO:0006691) |
| 3.4 | 6.7 | GO:0043504 | mitochondrial DNA repair(GO:0043504) |
| 3.4 | 23.6 | GO:0060330 | regulation of response to interferon-gamma(GO:0060330) |
| 3.3 | 26.6 | GO:0042130 | negative regulation of T cell proliferation(GO:0042130) |
| 3.3 | 6.7 | GO:0042726 | flavin-containing compound metabolic process(GO:0042726) |
| 3.3 | 49.9 | GO:0050869 | negative regulation of B cell activation(GO:0050869) |
| 3.3 | 13.3 | GO:0072757 | cellular response to camptothecin(GO:0072757) |
| 3.3 | 26.5 | GO:0045717 | negative regulation of fatty acid biosynthetic process(GO:0045717) |
| 3.3 | 9.9 | GO:0061010 | gall bladder development(GO:0061010) |
| 3.3 | 16.5 | GO:0006556 | S-adenosylmethionine biosynthetic process(GO:0006556) |
| 3.3 | 3.3 | GO:1901630 | negative regulation of presynaptic membrane organization(GO:1901630) |
| 3.3 | 3.3 | GO:0034135 | regulation of toll-like receptor 2 signaling pathway(GO:0034135) positive regulation of toll-like receptor 2 signaling pathway(GO:0034137) response to L-glutamine(GO:1904844) cellular response to L-glutamine(GO:1904845) |
| 3.3 | 6.5 | GO:0042197 | chlorinated hydrocarbon metabolic process(GO:0042196) halogenated hydrocarbon metabolic process(GO:0042197) |
| 3.3 | 9.8 | GO:0033299 | secretion of lysosomal enzymes(GO:0033299) |
| 3.3 | 3.3 | GO:1990478 | response to ultrasound(GO:1990478) |
| 3.3 | 13.0 | GO:0010266 | response to vitamin B1(GO:0010266) |
| 3.3 | 6.5 | GO:2001267 | regulation of cysteine-type endopeptidase activity involved in apoptotic signaling pathway(GO:2001267) positive regulation of cysteine-type endopeptidase activity involved in apoptotic signaling pathway(GO:2001269) |
| 3.2 | 16.2 | GO:0075525 | viral translational termination-reinitiation(GO:0075525) |
| 3.2 | 9.7 | GO:0019474 | lysine catabolic process(GO:0006554) L-lysine catabolic process to acetyl-CoA(GO:0019474) L-lysine catabolic process(GO:0019477) L-lysine metabolic process(GO:0046440) |
| 3.2 | 12.9 | GO:0009223 | pyrimidine deoxyribonucleotide catabolic process(GO:0009223) |
| 3.2 | 16.1 | GO:0010898 | positive regulation of triglyceride catabolic process(GO:0010898) |
| 3.2 | 22.4 | GO:0006782 | protoporphyrinogen IX biosynthetic process(GO:0006782) |
| 3.2 | 3.2 | GO:0032645 | granulocyte macrophage colony-stimulating factor production(GO:0032604) regulation of granulocyte macrophage colony-stimulating factor production(GO:0032645) |
| 3.2 | 15.9 | GO:0000711 | meiotic DNA repair synthesis(GO:0000711) |
| 3.2 | 19.0 | GO:1900016 | negative regulation of cytokine production involved in inflammatory response(GO:1900016) |
| 3.2 | 9.5 | GO:0021569 | rhombomere 3 development(GO:0021569) |
| 3.2 | 15.8 | GO:0035627 | ceramide transport(GO:0035627) |
| 3.2 | 9.5 | GO:0060383 | positive regulation of DNA strand elongation(GO:0060383) |
| 3.1 | 3.1 | GO:1903936 | cellular response to sodium arsenite(GO:1903936) |
| 3.1 | 15.5 | GO:0048387 | negative regulation of retinoic acid receptor signaling pathway(GO:0048387) |
| 3.1 | 46.3 | GO:0040015 | negative regulation of multicellular organism growth(GO:0040015) |
| 3.1 | 15.4 | GO:0071603 | endothelial cell-cell adhesion(GO:0071603) |
| 3.1 | 3.1 | GO:0010958 | regulation of amino acid import(GO:0010958) |
| 3.1 | 18.4 | GO:0010918 | positive regulation of mitochondrial membrane potential(GO:0010918) |
| 3.1 | 3.1 | GO:0002085 | inhibition of neuroepithelial cell differentiation(GO:0002085) |
| 3.1 | 3.1 | GO:1901740 | negative regulation of myoblast fusion(GO:1901740) |
| 3.0 | 6.1 | GO:0048850 | hypophysis morphogenesis(GO:0048850) |
| 3.0 | 3.0 | GO:0046671 | negative regulation of retinal cell programmed cell death(GO:0046671) |
| 3.0 | 45.3 | GO:0060218 | hematopoietic stem cell differentiation(GO:0060218) |
| 3.0 | 9.0 | GO:0006214 | thymidine catabolic process(GO:0006214) pyrimidine deoxyribonucleoside catabolic process(GO:0046127) |
| 3.0 | 12.0 | GO:0007084 | mitotic nuclear envelope reassembly(GO:0007084) |
| 3.0 | 6.0 | GO:1902809 | regulation of skeletal muscle fiber differentiation(GO:1902809) |
| 3.0 | 5.9 | GO:0044130 | negative regulation of growth of symbiont in host(GO:0044130) negative regulation of growth of symbiont involved in interaction with host(GO:0044146) |
| 3.0 | 11.9 | GO:0060340 | positive regulation of type I interferon-mediated signaling pathway(GO:0060340) |
| 3.0 | 8.9 | GO:0021524 | visceral motor neuron differentiation(GO:0021524) |
| 3.0 | 3.0 | GO:0003241 | growth involved in heart morphogenesis(GO:0003241) |
| 3.0 | 14.8 | GO:0014901 | regulation of satellite cell activation involved in skeletal muscle regeneration(GO:0014717) satellite cell activation involved in skeletal muscle regeneration(GO:0014901) |
| 2.9 | 8.8 | GO:0016102 | retinoic acid biosynthetic process(GO:0002138) diterpenoid biosynthetic process(GO:0016102) |
| 2.9 | 5.9 | GO:0071104 | response to interleukin-9(GO:0071104) |
| 2.9 | 17.7 | GO:0001878 | response to yeast(GO:0001878) |
| 2.9 | 8.8 | GO:0046351 | disaccharide biosynthetic process(GO:0046351) |
| 2.9 | 8.8 | GO:0046833 | positive regulation of RNA export from nucleus(GO:0046833) |
| 2.9 | 8.8 | GO:0097010 | eukaryotic translation initiation factor 4F complex assembly(GO:0097010) |
| 2.9 | 26.4 | GO:0032731 | positive regulation of interleukin-1 beta production(GO:0032731) |
| 2.9 | 5.8 | GO:0000973 | posttranscriptional tethering of RNA polymerase II gene DNA at nuclear periphery(GO:0000973) |
| 2.9 | 8.7 | GO:0097680 | double-strand break repair via classical nonhomologous end joining(GO:0097680) |
| 2.9 | 14.5 | GO:0090160 | Golgi to lysosome transport(GO:0090160) |
| 2.9 | 28.9 | GO:0070989 | oxidative demethylation(GO:0070989) |
| 2.9 | 11.5 | GO:0006189 | 'de novo' IMP biosynthetic process(GO:0006189) |
| 2.9 | 8.6 | GO:2000667 | interleukin-5 secretion(GO:0072603) interleukin-13 secretion(GO:0072611) regulation of interleukin-5 secretion(GO:2000662) positive regulation of interleukin-5 secretion(GO:2000664) regulation of interleukin-13 secretion(GO:2000665) positive regulation of interleukin-13 secretion(GO:2000667) |
| 2.9 | 11.5 | GO:0001579 | medium-chain fatty acid transport(GO:0001579) |
| 2.9 | 11.5 | GO:0042167 | porphyrin-containing compound catabolic process(GO:0006787) tetrapyrrole catabolic process(GO:0033015) heme catabolic process(GO:0042167) pigment catabolic process(GO:0046149) |
| 2.9 | 31.6 | GO:0046784 | viral mRNA export from host cell nucleus(GO:0046784) |
| 2.9 | 20.0 | GO:0036462 | TRAIL-activated apoptotic signaling pathway(GO:0036462) |
| 2.8 | 5.7 | GO:0072717 | cellular response to actinomycin D(GO:0072717) |
| 2.8 | 5.7 | GO:2000516 | positive regulation of CD4-positive, alpha-beta T cell activation(GO:2000516) |
| 2.8 | 8.5 | GO:0048210 | Golgi vesicle fusion to target membrane(GO:0048210) |
| 2.8 | 8.5 | GO:0033575 | protein glycosylation at cell surface(GO:0033575) protein galactosylation at cell surface(GO:0033580) protein galactosylation(GO:0042125) |
| 2.8 | 215.0 | GO:0045814 | negative regulation of gene expression, epigenetic(GO:0045814) |
| 2.8 | 2.8 | GO:1904868 | telomerase catalytic core complex assembly(GO:1904868) regulation of telomerase catalytic core complex assembly(GO:1904882) positive regulation of telomerase catalytic core complex assembly(GO:1904884) |
| 2.8 | 8.4 | GO:0060054 | positive regulation of epithelial cell proliferation involved in wound healing(GO:0060054) |
| 2.8 | 16.9 | GO:0090026 | positive regulation of monocyte chemotaxis(GO:0090026) |
| 2.8 | 22.5 | GO:0010668 | ectodermal cell differentiation(GO:0010668) |
| 2.8 | 5.6 | GO:0033123 | positive regulation of purine nucleotide catabolic process(GO:0033123) |
| 2.8 | 8.4 | GO:0036018 | cellular response to erythropoietin(GO:0036018) |
| 2.8 | 2.8 | GO:1990791 | dorsal root ganglion development(GO:1990791) |
| 2.8 | 2.8 | GO:0045351 | type I interferon biosynthetic process(GO:0045351) |
| 2.7 | 13.7 | GO:0048478 | replication fork protection(GO:0048478) |
| 2.7 | 19.1 | GO:2000401 | regulation of lymphocyte migration(GO:2000401) |
| 2.7 | 35.5 | GO:0061436 | establishment of skin barrier(GO:0061436) |
| 2.7 | 16.4 | GO:1901299 | negative regulation of hydrogen peroxide-mediated programmed cell death(GO:1901299) |
| 2.7 | 5.4 | GO:0042795 | snRNA transcription from RNA polymerase II promoter(GO:0042795) |
| 2.7 | 5.4 | GO:0030423 | targeting of mRNA for destruction involved in RNA interference(GO:0030423) |
| 2.7 | 8.1 | GO:0098507 | polynucleotide 5' dephosphorylation(GO:0098507) |
| 2.7 | 8.1 | GO:1900740 | regulation of protein insertion into mitochondrial membrane involved in apoptotic signaling pathway(GO:1900739) positive regulation of protein insertion into mitochondrial membrane involved in apoptotic signaling pathway(GO:1900740) |
| 2.7 | 5.4 | GO:0000212 | meiotic spindle organization(GO:0000212) |
| 2.7 | 8.1 | GO:1990167 | protein K27-linked deubiquitination(GO:1990167) |
| 2.7 | 27.0 | GO:0043950 | positive regulation of cAMP-mediated signaling(GO:0043950) |
| 2.7 | 5.4 | GO:0033567 | DNA replication, Okazaki fragment processing(GO:0033567) |
| 2.7 | 2.7 | GO:0060460 | left lung morphogenesis(GO:0060460) |
| 2.7 | 29.6 | GO:0033601 | positive regulation of mammary gland epithelial cell proliferation(GO:0033601) |
| 2.7 | 8.1 | GO:0070318 | positive regulation of G0 to G1 transition(GO:0070318) |
| 2.7 | 10.7 | GO:0001682 | tRNA 5'-leader removal(GO:0001682) |
| 2.7 | 13.4 | GO:0060708 | spongiotrophoblast differentiation(GO:0060708) |
| 2.7 | 18.7 | GO:0043686 | co-translational protein modification(GO:0043686) |
| 2.7 | 18.6 | GO:0021979 | hypothalamus cell differentiation(GO:0021979) |
| 2.6 | 7.9 | GO:0046077 | dUDP biosynthetic process(GO:0006227) pyrimidine nucleoside diphosphate biosynthetic process(GO:0009139) pyrimidine deoxyribonucleoside diphosphate metabolic process(GO:0009196) pyrimidine deoxyribonucleoside diphosphate biosynthetic process(GO:0009197) dUDP metabolic process(GO:0046077) |
| 2.6 | 13.2 | GO:0032020 | ISG15-protein conjugation(GO:0032020) |
| 2.6 | 2.6 | GO:0046831 | regulation of RNA export from nucleus(GO:0046831) |
| 2.6 | 65.7 | GO:0001580 | detection of chemical stimulus involved in sensory perception of bitter taste(GO:0001580) |
| 2.6 | 7.9 | GO:1904798 | positive regulation of core promoter binding(GO:1904798) |
| 2.6 | 7.8 | GO:0033540 | fatty acid beta-oxidation using acyl-CoA oxidase(GO:0033540) |
| 2.6 | 15.7 | GO:0043249 | erythrocyte maturation(GO:0043249) |
| 2.6 | 7.8 | GO:0010626 | negative regulation of Schwann cell proliferation(GO:0010626) |
| 2.6 | 13.0 | GO:0006741 | NADP biosynthetic process(GO:0006741) |
| 2.6 | 15.5 | GO:0032674 | regulation of interleukin-5 production(GO:0032674) |
| 2.6 | 7.7 | GO:0021797 | forebrain anterior/posterior pattern specification(GO:0021797) |
| 2.5 | 5.1 | GO:0015684 | ferrous iron transport(GO:0015684) ferrous iron transmembrane transport(GO:1903874) |
| 2.5 | 5.1 | GO:0035772 | interleukin-13-mediated signaling pathway(GO:0035772) |
| 2.5 | 2.5 | GO:0030997 | regulation of centriole-centriole cohesion(GO:0030997) |
| 2.5 | 2.5 | GO:0046487 | glyoxylate metabolic process(GO:0046487) |
| 2.5 | 7.6 | GO:0031204 | posttranslational protein targeting to membrane, translocation(GO:0031204) |
| 2.5 | 45.5 | GO:0007095 | mitotic G2 DNA damage checkpoint(GO:0007095) G2 DNA damage checkpoint(GO:0031572) |
| 2.5 | 5.1 | GO:0036123 | histone H3-K9 dimethylation(GO:0036123) |
| 2.5 | 10.1 | GO:0051574 | positive regulation of histone H3-K9 methylation(GO:0051574) |
| 2.5 | 7.6 | GO:0009256 | 10-formyltetrahydrofolate metabolic process(GO:0009256) |
| 2.5 | 17.6 | GO:0042866 | pyruvate biosynthetic process(GO:0042866) |
| 2.5 | 15.0 | GO:0032693 | negative regulation of interleukin-10 production(GO:0032693) |
| 2.5 | 7.5 | GO:1901094 | regulation of protein tetramerization(GO:1901090) negative regulation of protein tetramerization(GO:1901091) regulation of protein homotetramerization(GO:1901093) negative regulation of protein homotetramerization(GO:1901094) |
| 2.5 | 2.5 | GO:1900112 | regulation of histone H3-K9 trimethylation(GO:1900112) |
| 2.5 | 10.0 | GO:0071718 | sodium-independent icosanoid transport(GO:0071718) |
| 2.5 | 12.5 | GO:0015838 | amino-acid betaine transport(GO:0015838) |
| 2.5 | 10.0 | GO:1900194 | negative regulation of oocyte maturation(GO:1900194) |
| 2.5 | 9.9 | GO:0002023 | reduction of food intake in response to dietary excess(GO:0002023) |
| 2.5 | 14.9 | GO:0007021 | tubulin complex assembly(GO:0007021) |
| 2.5 | 5.0 | GO:0031125 | rRNA 3'-end processing(GO:0031125) |
| 2.5 | 12.4 | GO:0071500 | cellular response to nitrosative stress(GO:0071500) |
| 2.5 | 5.0 | GO:0044268 | multicellular organismal protein metabolic process(GO:0044268) |
| 2.5 | 7.4 | GO:0080144 | amino acid homeostasis(GO:0080144) |
| 2.5 | 12.3 | GO:0000480 | endonucleolytic cleavage in 5'-ETS of tricistronic rRNA transcript (SSU-rRNA, 5.8S rRNA, LSU-rRNA)(GO:0000480) |
| 2.5 | 51.8 | GO:0071346 | cellular response to interferon-gamma(GO:0071346) |
| 2.5 | 24.7 | GO:0002283 | neutrophil activation involved in immune response(GO:0002283) |
| 2.5 | 2.5 | GO:0061511 | centriole elongation(GO:0061511) |
| 2.4 | 12.2 | GO:0031119 | tRNA pseudouridine synthesis(GO:0031119) |
| 2.4 | 41.6 | GO:0045671 | negative regulation of osteoclast differentiation(GO:0045671) |
| 2.4 | 9.8 | GO:0090403 | oxidative stress-induced premature senescence(GO:0090403) |
| 2.4 | 65.8 | GO:0048384 | retinoic acid receptor signaling pathway(GO:0048384) |
| 2.4 | 2.4 | GO:0030263 | apoptotic chromosome condensation(GO:0030263) |
| 2.4 | 24.3 | GO:0042178 | xenobiotic catabolic process(GO:0042178) |
| 2.4 | 26.7 | GO:0035562 | negative regulation of chromatin binding(GO:0035562) |
| 2.4 | 12.1 | GO:0001835 | blastocyst hatching(GO:0001835) hatching(GO:0035188) organism emergence from protective structure(GO:0071684) |
| 2.4 | 29.0 | GO:0046415 | urate metabolic process(GO:0046415) |
| 2.4 | 7.2 | GO:0097198 | histone H3-K36 trimethylation(GO:0097198) |
| 2.4 | 24.0 | GO:0015760 | hexose phosphate transport(GO:0015712) glucose-6-phosphate transport(GO:0015760) |
| 2.4 | 4.8 | GO:0002191 | cap-dependent translational initiation(GO:0002191) |
| 2.4 | 9.6 | GO:1903608 | protein localization to cytoplasmic stress granule(GO:1903608) |
| 2.4 | 2.4 | GO:0031086 | nuclear-transcribed mRNA catabolic process, deadenylation-independent decay(GO:0031086) |
| 2.4 | 26.1 | GO:0035589 | G-protein coupled purinergic nucleotide receptor signaling pathway(GO:0035589) |
| 2.4 | 4.7 | GO:0043587 | tongue morphogenesis(GO:0043587) |
| 2.3 | 2.3 | GO:0006307 | DNA dealkylation involved in DNA repair(GO:0006307) |
| 2.3 | 91.3 | GO:0033209 | tumor necrosis factor-mediated signaling pathway(GO:0033209) |
| 2.3 | 32.7 | GO:0050830 | defense response to Gram-positive bacterium(GO:0050830) |
| 2.3 | 7.0 | GO:0006206 | pyrimidine nucleobase metabolic process(GO:0006206) |
| 2.3 | 11.7 | GO:0001992 | regulation of systemic arterial blood pressure by vasopressin(GO:0001992) |
| 2.3 | 14.0 | GO:0000733 | DNA strand renaturation(GO:0000733) |
| 2.3 | 18.6 | GO:0016446 | somatic hypermutation of immunoglobulin genes(GO:0016446) |
| 2.3 | 2.3 | GO:0097089 | methyl-branched fatty acid metabolic process(GO:0097089) |
| 2.3 | 23.2 | GO:0006388 | tRNA splicing, via endonucleolytic cleavage and ligation(GO:0006388) |
| 2.3 | 9.2 | GO:0060700 | regulation of ribonuclease activity(GO:0060700) |
| 2.3 | 13.8 | GO:0043304 | regulation of mast cell activation involved in immune response(GO:0033006) regulation of mast cell degranulation(GO:0043304) |
| 2.3 | 4.6 | GO:1903377 | negative regulation of oxidative stress-induced neuron intrinsic apoptotic signaling pathway(GO:1903377) |
| 2.3 | 11.5 | GO:0045063 | T-helper 1 cell differentiation(GO:0045063) |
| 2.3 | 4.6 | GO:0010979 | regulation of vitamin D 24-hydroxylase activity(GO:0010979) positive regulation of vitamin D 24-hydroxylase activity(GO:0010980) |
| 2.3 | 13.7 | GO:1901098 | positive regulation of autophagosome maturation(GO:1901098) |
| 2.3 | 20.5 | GO:0043402 | glucocorticoid mediated signaling pathway(GO:0043402) |
| 2.3 | 11.4 | GO:0010991 | negative regulation of SMAD protein complex assembly(GO:0010991) |
| 2.3 | 6.8 | GO:0006478 | peptidyl-tyrosine sulfation(GO:0006478) |
| 2.3 | 9.0 | GO:0032025 | response to cobalt ion(GO:0032025) |
| 2.2 | 22.3 | GO:0001731 | formation of translation preinitiation complex(GO:0001731) |
| 2.2 | 11.1 | GO:0008295 | spermidine biosynthetic process(GO:0008295) |
| 2.2 | 26.7 | GO:1901407 | regulation of phosphorylation of RNA polymerase II C-terminal domain(GO:1901407) positive regulation of phosphorylation of RNA polymerase II C-terminal domain(GO:1901409) |
| 2.2 | 4.4 | GO:0016321 | female meiosis chromosome segregation(GO:0016321) |
| 2.2 | 8.8 | GO:0000972 | transcription-dependent tethering of RNA polymerase II gene DNA at nuclear periphery(GO:0000972) |
| 2.2 | 4.4 | GO:0090038 | negative regulation of protein kinase C signaling(GO:0090038) |
| 2.2 | 17.5 | GO:0010815 | bradykinin catabolic process(GO:0010815) |
| 2.2 | 6.5 | GO:0001832 | blastocyst growth(GO:0001832) |
| 2.2 | 62.9 | GO:0002260 | lymphocyte homeostasis(GO:0002260) |
| 2.2 | 4.3 | GO:0035964 | COPI-coated vesicle budding(GO:0035964) |
| 2.2 | 4.3 | GO:0018076 | N-terminal peptidyl-lysine acetylation(GO:0018076) |
| 2.1 | 2757.9 | GO:0050911 | detection of chemical stimulus involved in sensory perception of smell(GO:0050911) |
| 2.1 | 6.4 | GO:0021747 | cochlear nucleus development(GO:0021747) |
| 2.1 | 62.1 | GO:0006284 | base-excision repair(GO:0006284) |
| 2.1 | 74.9 | GO:0090502 | RNA phosphodiester bond hydrolysis, endonucleolytic(GO:0090502) |
| 2.1 | 10.6 | GO:0060056 | mammary gland involution(GO:0060056) |
| 2.1 | 10.6 | GO:0006432 | phenylalanyl-tRNA aminoacylation(GO:0006432) |
| 2.1 | 10.6 | GO:0033211 | adiponectin-activated signaling pathway(GO:0033211) |
| 2.1 | 8.4 | GO:0002230 | positive regulation of defense response to virus by host(GO:0002230) |
| 2.1 | 2.1 | GO:0031999 | negative regulation of fatty acid beta-oxidation(GO:0031999) |
| 2.1 | 4.2 | GO:2000359 | regulation of binding of sperm to zona pellucida(GO:2000359) negative regulation of binding of sperm to zona pellucida(GO:2000360) |
| 2.1 | 16.8 | GO:0006703 | estrogen biosynthetic process(GO:0006703) |
| 2.1 | 4.2 | GO:0035600 | tRNA methylthiolation(GO:0035600) |
| 2.1 | 8.4 | GO:0051095 | regulation of helicase activity(GO:0051095) positive regulation of helicase activity(GO:0051096) |
| 2.1 | 16.6 | GO:0046473 | phosphatidic acid metabolic process(GO:0046473) |
| 2.1 | 4.2 | GO:0071034 | CUT catabolic process(GO:0071034) CUT metabolic process(GO:0071043) |
| 2.1 | 39.4 | GO:0009225 | nucleotide-sugar metabolic process(GO:0009225) |
| 2.1 | 60.2 | GO:0051028 | mRNA transport(GO:0051028) |
| 2.1 | 60.1 | GO:0000462 | maturation of SSU-rRNA from tricistronic rRNA transcript (SSU-rRNA, 5.8S rRNA, LSU-rRNA)(GO:0000462) |
| 2.1 | 6.2 | GO:0097327 | response to antineoplastic agent(GO:0097327) |
| 2.1 | 16.5 | GO:0051299 | centrosome separation(GO:0051299) |
| 2.1 | 6.2 | GO:0035582 | sequestering of BMP in extracellular matrix(GO:0035582) |
| 2.1 | 4.1 | GO:0002380 | immunoglobulin secretion involved in immune response(GO:0002380) |
| 2.1 | 6.2 | GO:1900378 | positive regulation of melanin biosynthetic process(GO:0048023) positive regulation of secondary metabolite biosynthetic process(GO:1900378) |
| 2.0 | 6.1 | GO:0060244 | negative regulation of cell proliferation involved in contact inhibition(GO:0060244) |
| 2.0 | 4.0 | GO:0043032 | positive regulation of macrophage activation(GO:0043032) |
| 2.0 | 60.3 | GO:0051607 | defense response to virus(GO:0051607) |
| 2.0 | 6.0 | GO:0006545 | glycine biosynthetic process(GO:0006545) |
| 2.0 | 4.0 | GO:0019323 | pentose catabolic process(GO:0019323) |
| 2.0 | 2.0 | GO:1901656 | glycoside transport(GO:1901656) |
| 2.0 | 6.0 | GO:0003278 | apoptotic process involved in heart morphogenesis(GO:0003278) |
| 2.0 | 5.9 | GO:0006532 | aspartate biosynthetic process(GO:0006532) |
| 2.0 | 21.8 | GO:0050912 | detection of chemical stimulus involved in sensory perception of taste(GO:0050912) |
| 2.0 | 7.9 | GO:0016560 | protein import into peroxisome matrix, docking(GO:0016560) |
| 2.0 | 7.9 | GO:0060126 | somatotropin secreting cell differentiation(GO:0060126) |
| 2.0 | 5.9 | GO:0010193 | response to ozone(GO:0010193) |
| 2.0 | 5.9 | GO:0002922 | positive regulation of humoral immune response(GO:0002922) |
| 2.0 | 11.8 | GO:0051661 | maintenance of centrosome location(GO:0051661) |
| 1.9 | 17.5 | GO:0071447 | cellular response to hydroperoxide(GO:0071447) |
| 1.9 | 5.8 | GO:2000541 | positive regulation of synaptic growth at neuromuscular junction(GO:0045887) regulation of protein geranylgeranylation(GO:2000539) positive regulation of protein geranylgeranylation(GO:2000541) |
| 1.9 | 55.8 | GO:0000184 | nuclear-transcribed mRNA catabolic process, nonsense-mediated decay(GO:0000184) |
| 1.9 | 9.6 | GO:0061085 | regulation of histone H3-K27 methylation(GO:0061085) |
| 1.9 | 11.4 | GO:0060527 | prostate glandular acinus morphogenesis(GO:0060526) prostate epithelial cord arborization involved in prostate glandular acinus morphogenesis(GO:0060527) |
| 1.9 | 5.7 | GO:0046501 | protoporphyrinogen IX metabolic process(GO:0046501) |
| 1.9 | 46.9 | GO:0006270 | DNA replication initiation(GO:0006270) |
| 1.9 | 7.5 | GO:0070966 | nuclear-transcribed mRNA catabolic process, no-go decay(GO:0070966) |
| 1.9 | 13.1 | GO:2000210 | positive regulation of anoikis(GO:2000210) |
| 1.9 | 1.9 | GO:1905132 | metaphase/anaphase transition of meiotic cell cycle(GO:0044785) regulation of metaphase/anaphase transition of meiotic cell cycle(GO:1902102) negative regulation of metaphase/anaphase transition of meiotic cell cycle(GO:1902103) regulation of meiotic chromosome separation(GO:1905132) negative regulation of meiotic chromosome separation(GO:1905133) |
| 1.8 | 7.4 | GO:0000707 | meiotic DNA recombinase assembly(GO:0000707) |
| 1.8 | 18.4 | GO:0032525 | somite rostral/caudal axis specification(GO:0032525) |
| 1.8 | 12.8 | GO:0070816 | phosphorylation of RNA polymerase II C-terminal domain(GO:0070816) |
| 1.8 | 9.2 | GO:0002675 | positive regulation of acute inflammatory response(GO:0002675) |
| 1.8 | 11.0 | GO:0006308 | DNA catabolic process(GO:0006308) |
| 1.8 | 7.3 | GO:0071698 | olfactory placode formation(GO:0030910) olfactory placode development(GO:0071698) olfactory placode morphogenesis(GO:0071699) |
| 1.8 | 19.8 | GO:0051014 | actin filament severing(GO:0051014) |
| 1.8 | 1.8 | GO:0021603 | cranial nerve formation(GO:0021603) |
| 1.8 | 91.3 | GO:0090501 | RNA phosphodiester bond hydrolysis(GO:0090501) |
| 1.8 | 7.2 | GO:0070828 | heterochromatin organization(GO:0070828) |
| 1.8 | 14.3 | GO:0090286 | cytoskeletal anchoring at nuclear membrane(GO:0090286) |
| 1.8 | 5.3 | GO:0042226 | interleukin-6 biosynthetic process(GO:0042226) |
| 1.8 | 5.3 | GO:0051409 | response to nitrosative stress(GO:0051409) |
| 1.8 | 3.5 | GO:0031448 | regulation of fast-twitch skeletal muscle fiber contraction(GO:0031446) positive regulation of fast-twitch skeletal muscle fiber contraction(GO:0031448) |
| 1.8 | 5.3 | GO:0030854 | positive regulation of granulocyte differentiation(GO:0030854) |
| 1.8 | 10.5 | GO:0032000 | positive regulation of fatty acid beta-oxidation(GO:0032000) |
| 1.8 | 21.0 | GO:0043968 | histone H2A acetylation(GO:0043968) |
| 1.7 | 3.5 | GO:0032258 | CVT pathway(GO:0032258) |
| 1.7 | 5.2 | GO:2000542 | negative regulation of endodermal cell differentiation(GO:1903225) negative regulation of gastrulation(GO:2000542) |
| 1.7 | 13.9 | GO:0098734 | macromolecule depalmitoylation(GO:0098734) |
| 1.7 | 3.5 | GO:0046601 | positive regulation of centriole replication(GO:0046601) |
| 1.7 | 3.5 | GO:2000158 | positive regulation of ubiquitin-specific protease activity(GO:2000158) |
| 1.7 | 12.1 | GO:0030259 | lipid glycosylation(GO:0030259) |
| 1.7 | 3.4 | GO:0042699 | follicle-stimulating hormone signaling pathway(GO:0042699) |
| 1.7 | 5.2 | GO:1990737 | response to manganese-induced endoplasmic reticulum stress(GO:1990737) |
| 1.7 | 12.0 | GO:0033119 | negative regulation of RNA splicing(GO:0033119) |
| 1.7 | 5.1 | GO:2001013 | epithelial cell proliferation involved in renal tubule morphogenesis(GO:2001013) |
| 1.7 | 1.7 | GO:1901837 | negative regulation of transcription of nuclear large rRNA transcript from RNA polymerase I promoter(GO:1901837) |
| 1.7 | 5.1 | GO:0030718 | germ-line stem cell population maintenance(GO:0030718) |
| 1.7 | 57.9 | GO:0000387 | spliceosomal snRNP assembly(GO:0000387) |
| 1.7 | 16.9 | GO:0032237 | activation of store-operated calcium channel activity(GO:0032237) |
| 1.7 | 3.4 | GO:0032916 | transforming growth factor beta3 production(GO:0032907) regulation of transforming growth factor beta3 production(GO:0032910) positive regulation of transforming growth factor beta3 production(GO:0032916) |
| 1.7 | 6.7 | GO:0034080 | CENP-A containing nucleosome assembly(GO:0034080) CENP-A containing chromatin organization(GO:0061641) |
| 1.7 | 5.1 | GO:0007352 | zygotic specification of dorsal/ventral axis(GO:0007352) |
| 1.7 | 5.1 | GO:0032727 | positive regulation of interferon-alpha production(GO:0032727) |
| 1.7 | 16.8 | GO:0070098 | chemokine-mediated signaling pathway(GO:0070098) |
| 1.7 | 1.7 | GO:0042256 | mature ribosome assembly(GO:0042256) |
| 1.7 | 5.0 | GO:0021539 | subthalamus development(GO:0021539) |
| 1.7 | 3.4 | GO:1902445 | regulation of mitochondrial membrane permeability involved in programmed necrotic cell death(GO:1902445) |
| 1.7 | 8.4 | GO:0009298 | GDP-mannose biosynthetic process(GO:0009298) |
| 1.7 | 18.4 | GO:1990845 | adaptive thermogenesis(GO:1990845) |
| 1.7 | 15.0 | GO:0046599 | regulation of centriole replication(GO:0046599) |
| 1.7 | 3.3 | GO:0060689 | cell differentiation involved in salivary gland development(GO:0060689) |
| 1.6 | 3.3 | GO:0071400 | cellular response to oleic acid(GO:0071400) |
| 1.6 | 1.6 | GO:0021997 | neural plate axis specification(GO:0021997) |
| 1.6 | 9.8 | GO:0045654 | positive regulation of megakaryocyte differentiation(GO:0045654) |
| 1.6 | 1.6 | GO:1904587 | response to glycoprotein(GO:1904587) |
| 1.6 | 6.5 | GO:1903251 | multi-ciliated epithelial cell differentiation(GO:1903251) |
| 1.6 | 3.2 | GO:0046322 | negative regulation of fatty acid oxidation(GO:0046322) |
| 1.6 | 3.2 | GO:1904674 | positive regulation of somatic stem cell population maintenance(GO:1904674) |
| 1.6 | 8.1 | GO:0009162 | deoxyribonucleoside monophosphate metabolic process(GO:0009162) |
| 1.6 | 71.0 | GO:0042273 | ribosomal large subunit biogenesis(GO:0042273) |
| 1.6 | 14.5 | GO:0071044 | histone mRNA catabolic process(GO:0071044) |
| 1.6 | 8.1 | GO:0035278 | miRNA mediated inhibition of translation(GO:0035278) negative regulation of translation, ncRNA-mediated(GO:0040033) regulation of translation, ncRNA-mediated(GO:0045974) |
| 1.6 | 27.3 | GO:0050728 | negative regulation of inflammatory response(GO:0050728) |
| 1.6 | 9.6 | GO:0038170 | somatostatin receptor signaling pathway(GO:0038169) somatostatin signaling pathway(GO:0038170) |
| 1.6 | 4.8 | GO:0018199 | peptidyl-glutamine modification(GO:0018199) |
| 1.6 | 3.2 | GO:0046292 | formaldehyde metabolic process(GO:0046292) |
| 1.6 | 4.8 | GO:0009396 | folic acid-containing compound biosynthetic process(GO:0009396) |
| 1.6 | 4.8 | GO:0002553 | histamine production involved in inflammatory response(GO:0002349) histamine secretion involved in inflammatory response(GO:0002441) histamine secretion by mast cell(GO:0002553) |
| 1.6 | 1.6 | GO:1902965 | regulation of protein localization to early endosome(GO:1902965) positive regulation of protein localization to early endosome(GO:1902966) |
| 1.6 | 1.6 | GO:0038028 | insulin receptor signaling pathway via phosphatidylinositol 3-kinase(GO:0038028) |
| 1.6 | 3.2 | GO:0007493 | endodermal cell fate determination(GO:0007493) negative regulation of transforming growth factor beta2 production(GO:0032912) |
| 1.6 | 14.3 | GO:0018298 | protein-chromophore linkage(GO:0018298) |
| 1.6 | 4.8 | GO:2000251 | positive regulation of actin cytoskeleton reorganization(GO:2000251) |
| 1.6 | 6.3 | GO:0060662 | tube lumen cavitation(GO:0060605) salivary gland cavitation(GO:0060662) |
| 1.6 | 7.9 | GO:0035588 | G-protein coupled purinergic receptor signaling pathway(GO:0035588) |
| 1.6 | 6.3 | GO:1903142 | positive regulation of endothelial cell development(GO:1901552) positive regulation of establishment of endothelial barrier(GO:1903142) |
| 1.6 | 9.4 | GO:0097068 | response to thyroxine(GO:0097068) |
| 1.6 | 6.2 | GO:0070562 | regulation of vitamin D receptor signaling pathway(GO:0070562) |
| 1.6 | 7.8 | GO:0033194 | response to hydroperoxide(GO:0033194) |
| 1.6 | 3.1 | GO:1902527 | positive regulation of protein monoubiquitination(GO:1902527) |
| 1.6 | 18.7 | GO:0009263 | deoxyribonucleotide biosynthetic process(GO:0009263) |
| 1.6 | 21.8 | GO:0034508 | centromere complex assembly(GO:0034508) |
| 1.5 | 7.7 | GO:0007144 | female meiosis I(GO:0007144) |
| 1.5 | 10.7 | GO:0007603 | phototransduction, visible light(GO:0007603) |
| 1.5 | 1.5 | GO:0044209 | AMP salvage(GO:0044209) |
| 1.5 | 12.2 | GO:0090224 | regulation of mitotic spindle organization(GO:0060236) regulation of spindle organization(GO:0090224) |
| 1.5 | 12.2 | GO:0045056 | transcytosis(GO:0045056) |
| 1.5 | 3.0 | GO:0070858 | negative regulation of bile acid biosynthetic process(GO:0070858) negative regulation of bile acid metabolic process(GO:1904252) |
| 1.5 | 1.5 | GO:0006553 | lysine metabolic process(GO:0006553) |
| 1.5 | 16.6 | GO:0035855 | megakaryocyte development(GO:0035855) |
| 1.5 | 4.5 | GO:0000460 | maturation of 5.8S rRNA(GO:0000460) |
| 1.5 | 3.0 | GO:0014908 | myotube differentiation involved in skeletal muscle regeneration(GO:0014908) |
| 1.5 | 7.4 | GO:0000066 | mitochondrial ornithine transport(GO:0000066) |
| 1.5 | 3.0 | GO:0010040 | response to iron(II) ion(GO:0010040) |
| 1.5 | 3.0 | GO:0097037 | heme export(GO:0097037) |
| 1.5 | 3.0 | GO:0000012 | single strand break repair(GO:0000012) |
| 1.5 | 4.4 | GO:0006290 | pyrimidine dimer repair(GO:0006290) |
| 1.5 | 4.4 | GO:1903966 | monounsaturated fatty acid metabolic process(GO:1903964) monounsaturated fatty acid biosynthetic process(GO:1903966) |
| 1.5 | 8.8 | GO:0032717 | negative regulation of interleukin-8 production(GO:0032717) |
| 1.5 | 7.3 | GO:2000781 | positive regulation of double-strand break repair(GO:2000781) |
| 1.5 | 8.8 | GO:0046146 | tetrahydrobiopterin metabolic process(GO:0046146) |
| 1.5 | 4.4 | GO:0042088 | T-helper 1 type immune response(GO:0042088) |
| 1.5 | 4.4 | GO:0060455 | negative regulation of gastric acid secretion(GO:0060455) |
| 1.5 | 7.3 | GO:0033133 | positive regulation of glucokinase activity(GO:0033133) positive regulation of hexokinase activity(GO:1903301) |
| 1.5 | 45.0 | GO:0051310 | metaphase plate congression(GO:0051310) |
| 1.4 | 8.6 | GO:0035743 | CD4-positive, alpha-beta T cell cytokine production(GO:0035743) |
| 1.4 | 1.4 | GO:0071027 | nuclear RNA surveillance(GO:0071027) nuclear mRNA surveillance(GO:0071028) |
| 1.4 | 2.9 | GO:2000523 | regulation of T cell costimulation(GO:2000523) positive regulation of T cell costimulation(GO:2000525) |
| 1.4 | 5.7 | GO:0048664 | neuron fate determination(GO:0048664) |
| 1.4 | 109.0 | GO:0006637 | acyl-CoA metabolic process(GO:0006637) thioester metabolic process(GO:0035383) |
| 1.4 | 8.5 | GO:0015677 | copper ion import(GO:0015677) |
| 1.4 | 8.5 | GO:0006999 | nuclear pore organization(GO:0006999) |
| 1.4 | 5.6 | GO:0070537 | histone H2A K63-linked deubiquitination(GO:0070537) |
| 1.4 | 4.2 | GO:0000291 | nuclear-transcribed mRNA catabolic process, exonucleolytic(GO:0000291) |
| 1.4 | 76.9 | GO:0006334 | nucleosome assembly(GO:0006334) |
| 1.4 | 23.6 | GO:0009303 | rRNA transcription(GO:0009303) |
| 1.4 | 11.1 | GO:0006021 | inositol biosynthetic process(GO:0006021) |
| 1.4 | 5.5 | GO:0070601 | centromeric sister chromatid cohesion(GO:0070601) |
| 1.4 | 4.1 | GO:0006636 | unsaturated fatty acid biosynthetic process(GO:0006636) |
| 1.4 | 2.8 | GO:1904154 | positive regulation of retrograde protein transport, ER to cytosol(GO:1904154) |
| 1.4 | 2.7 | GO:2000301 | negative regulation of synaptic vesicle exocytosis(GO:2000301) |
| 1.4 | 1.4 | GO:1901073 | glucosamine-containing compound biosynthetic process(GO:1901073) |
| 1.4 | 4.1 | GO:0007296 | vitellogenesis(GO:0007296) |
| 1.4 | 4.1 | GO:0051799 | negative regulation of hair follicle development(GO:0051799) |
| 1.3 | 5.4 | GO:0017187 | peptidyl-glutamic acid carboxylation(GO:0017187) protein carboxylation(GO:0018214) |
| 1.3 | 10.8 | GO:0009130 | UMP biosynthetic process(GO:0006222) pyrimidine nucleoside monophosphate biosynthetic process(GO:0009130) pyrimidine ribonucleoside monophosphate metabolic process(GO:0009173) pyrimidine ribonucleoside monophosphate biosynthetic process(GO:0009174) UMP metabolic process(GO:0046049) |
| 1.3 | 2.7 | GO:0000393 | generation of catalytic spliceosome for second transesterification step(GO:0000350) spliceosomal conformational changes to generate catalytic conformation(GO:0000393) |
| 1.3 | 9.3 | GO:0035067 | negative regulation of histone acetylation(GO:0035067) |
| 1.3 | 8.0 | GO:0032986 | protein-DNA complex disassembly(GO:0032986) |
| 1.3 | 13.3 | GO:0016973 | poly(A)+ mRNA export from nucleus(GO:0016973) |
| 1.3 | 4.0 | GO:0045764 | positive regulation of cellular amino acid metabolic process(GO:0045764) |
| 1.3 | 1.3 | GO:0045910 | negative regulation of DNA recombination(GO:0045910) |
| 1.3 | 9.3 | GO:0032483 | regulation of Rab protein signal transduction(GO:0032483) |
| 1.3 | 23.8 | GO:0045576 | mast cell activation(GO:0045576) |
| 1.3 | 5.3 | GO:0085020 | protein K6-linked ubiquitination(GO:0085020) |
| 1.3 | 7.9 | GO:1904667 | negative regulation of ubiquitin protein ligase activity(GO:1904667) |
| 1.3 | 3.9 | GO:0015772 | disaccharide transport(GO:0015766) sucrose transport(GO:0015770) oligosaccharide transport(GO:0015772) |
| 1.3 | 11.8 | GO:0045738 | negative regulation of DNA repair(GO:0045738) negative regulation of double-strand break repair(GO:2000780) |
| 1.3 | 5.2 | GO:0042976 | activation of Janus kinase activity(GO:0042976) |
| 1.3 | 14.3 | GO:0046051 | UTP biosynthetic process(GO:0006228) UTP metabolic process(GO:0046051) |
| 1.3 | 2.6 | GO:1903774 | positive regulation of viral budding via host ESCRT complex(GO:1903774) |
| 1.3 | 3.9 | GO:0046532 | regulation of photoreceptor cell differentiation(GO:0046532) |
| 1.3 | 6.5 | GO:0045647 | negative regulation of erythrocyte differentiation(GO:0045647) |
| 1.3 | 3.9 | GO:0046167 | glycerol-3-phosphate biosynthetic process(GO:0046167) |
| 1.3 | 3.9 | GO:0006369 | termination of RNA polymerase II transcription(GO:0006369) |
| 1.3 | 3.9 | GO:0006574 | valine catabolic process(GO:0006574) |
| 1.3 | 3.9 | GO:2000853 | negative regulation of corticosterone secretion(GO:2000853) |
| 1.3 | 8.9 | GO:0031293 | membrane protein intracellular domain proteolysis(GO:0031293) |
| 1.3 | 2.5 | GO:1903588 | negative regulation of blood vessel endothelial cell proliferation involved in sprouting angiogenesis(GO:1903588) |
| 1.3 | 2.5 | GO:0032802 | low-density lipoprotein particle receptor catabolic process(GO:0032802) regulation of low-density lipoprotein particle receptor catabolic process(GO:0032803) |
| 1.3 | 2.5 | GO:0031860 | telomeric 3' overhang formation(GO:0031860) |
| 1.3 | 2.5 | GO:0010833 | telomere maintenance via telomere lengthening(GO:0010833) |
| 1.3 | 3.8 | GO:0070232 | regulation of T cell apoptotic process(GO:0070232) |
| 1.2 | 2.5 | GO:0016445 | somatic diversification of immunoglobulins(GO:0016445) |
| 1.2 | 24.7 | GO:0006805 | xenobiotic metabolic process(GO:0006805) |
| 1.2 | 7.4 | GO:0045002 | DNA double-strand break processing involved in repair via single-strand annealing(GO:0010792) double-strand break repair via single-strand annealing(GO:0045002) |
| 1.2 | 6.1 | GO:0006776 | vitamin A metabolic process(GO:0006776) |
| 1.2 | 3.7 | GO:0048254 | snoRNA localization(GO:0048254) |
| 1.2 | 3.6 | GO:0000055 | ribosomal large subunit export from nucleus(GO:0000055) |
| 1.2 | 6.0 | GO:2000741 | positive regulation of mesenchymal stem cell differentiation(GO:2000741) |
| 1.2 | 16.7 | GO:0061099 | negative regulation of protein tyrosine kinase activity(GO:0061099) |
| 1.2 | 1.2 | GO:0032417 | positive regulation of sodium:proton antiporter activity(GO:0032417) |
| 1.2 | 9.5 | GO:0010569 | regulation of double-strand break repair via homologous recombination(GO:0010569) |
| 1.2 | 8.3 | GO:0090435 | protein localization to nuclear envelope(GO:0090435) |
| 1.2 | 19.0 | GO:0006360 | transcription from RNA polymerase I promoter(GO:0006360) |
| 1.2 | 4.7 | GO:1900019 | regulation of protein kinase C activity(GO:1900019) positive regulation of protein kinase C activity(GO:1900020) |
| 1.2 | 3.5 | GO:0070673 | response to interleukin-18(GO:0070673) |
| 1.2 | 7.1 | GO:0000722 | telomere maintenance via recombination(GO:0000722) |
| 1.2 | 3.5 | GO:0006824 | cobalt ion transport(GO:0006824) |
| 1.2 | 5.9 | GO:1904749 | regulation of protein localization to nucleolus(GO:1904749) |
| 1.2 | 7.0 | GO:0006353 | DNA-templated transcription, termination(GO:0006353) |
| 1.2 | 24.6 | GO:0048873 | homeostasis of number of cells within a tissue(GO:0048873) |
| 1.2 | 12.9 | GO:0046827 | positive regulation of protein export from nucleus(GO:0046827) |
| 1.2 | 2.3 | GO:0010070 | zygote asymmetric cell division(GO:0010070) |
| 1.2 | 8.2 | GO:0070863 | positive regulation of protein exit from endoplasmic reticulum(GO:0070863) |
| 1.2 | 10.5 | GO:0006614 | SRP-dependent cotranslational protein targeting to membrane(GO:0006614) |
| 1.2 | 4.6 | GO:1902570 | protein localization to nucleolus(GO:1902570) |
| 1.2 | 6.9 | GO:0018206 | peptidyl-methionine modification(GO:0018206) |
| 1.2 | 2.3 | GO:2000049 | positive regulation of cell-cell adhesion mediated by cadherin(GO:2000049) |
| 1.2 | 4.6 | GO:0046836 | glycolipid transport(GO:0046836) |
| 1.2 | 5.8 | GO:0045820 | negative regulation of glycolytic process(GO:0045820) |
| 1.1 | 4.6 | GO:0060337 | type I interferon signaling pathway(GO:0060337) cellular response to type I interferon(GO:0071357) |
| 1.1 | 4.6 | GO:2000825 | positive regulation of androgen receptor activity(GO:2000825) |
| 1.1 | 2.3 | GO:0014028 | notochord formation(GO:0014028) |
| 1.1 | 3.4 | GO:0060486 | Clara cell differentiation(GO:0060486) |
| 1.1 | 3.4 | GO:2000400 | positive regulation of T cell differentiation in thymus(GO:0033089) positive regulation of thymocyte aggregation(GO:2000400) |
| 1.1 | 20.2 | GO:0070534 | protein K63-linked ubiquitination(GO:0070534) |
| 1.1 | 10.1 | GO:0050872 | white fat cell differentiation(GO:0050872) |
| 1.1 | 7.8 | GO:0071712 | ER-associated misfolded protein catabolic process(GO:0071712) |
| 1.1 | 11.1 | GO:1901741 | positive regulation of myoblast fusion(GO:1901741) |
| 1.1 | 11.1 | GO:0001516 | prostaglandin biosynthetic process(GO:0001516) prostanoid biosynthetic process(GO:0046457) |
| 1.1 | 1.1 | GO:0035166 | post-embryonic hemopoiesis(GO:0035166) |
| 1.1 | 12.1 | GO:0045742 | positive regulation of epidermal growth factor receptor signaling pathway(GO:0045742) positive regulation of ERBB signaling pathway(GO:1901186) |
| 1.1 | 59.2 | GO:0031638 | zymogen activation(GO:0031638) |
| 1.1 | 4.4 | GO:2001199 | negative regulation of dendritic cell differentiation(GO:2001199) |
| 1.1 | 3.3 | GO:0033505 | floor plate morphogenesis(GO:0033505) |
| 1.1 | 17.4 | GO:0006491 | N-glycan processing(GO:0006491) |
| 1.1 | 5.4 | GO:0071243 | cellular response to arsenic-containing substance(GO:0071243) |
| 1.1 | 22.8 | GO:0030183 | B cell differentiation(GO:0030183) |
| 1.1 | 14.1 | GO:0007099 | centriole replication(GO:0007099) |
| 1.1 | 2.2 | GO:0031998 | regulation of fatty acid beta-oxidation(GO:0031998) |
| 1.1 | 2.2 | GO:1903699 | histone H3-K36 dimethylation(GO:0097676) tarsal gland development(GO:1903699) |
| 1.1 | 6.5 | GO:0042635 | positive regulation of hair cycle(GO:0042635) positive regulation of hair follicle development(GO:0051798) |
| 1.1 | 7.5 | GO:0045616 | regulation of keratinocyte differentiation(GO:0045616) |
| 1.1 | 7.5 | GO:0000956 | nuclear-transcribed mRNA catabolic process(GO:0000956) |
| 1.1 | 7.5 | GO:0051451 | myoblast migration(GO:0051451) |
| 1.1 | 10.7 | GO:0006012 | galactose metabolic process(GO:0006012) |
| 1.1 | 2.1 | GO:0038033 | positive regulation of endothelial cell chemotaxis by VEGF-activated vascular endothelial growth factor receptor signaling pathway(GO:0038033) |
| 1.1 | 4.2 | GO:0002525 | acute inflammatory response to non-antigenic stimulus(GO:0002525) |
| 1.1 | 514.6 | GO:0006412 | translation(GO:0006412) |
| 1.1 | 2.1 | GO:2000121 | regulation of removal of superoxide radicals(GO:2000121) |
| 1.1 | 4.2 | GO:0090666 | scaRNA localization to Cajal body(GO:0090666) |
| 1.1 | 2.1 | GO:0070213 | protein auto-ADP-ribosylation(GO:0070213) |
| 1.1 | 11.6 | GO:0019369 | arachidonic acid metabolic process(GO:0019369) |
| 1.0 | 25.2 | GO:0070936 | protein K48-linked ubiquitination(GO:0070936) |
| 1.0 | 4.2 | GO:1902534 | single-organism membrane invagination(GO:1902534) |
| 1.0 | 1.0 | GO:0090648 | response to environmental enrichment(GO:0090648) |
| 1.0 | 5.2 | GO:1990173 | protein localization to nuclear body(GO:1903405) protein localization to Cajal body(GO:1904867) regulation of protein localization to Cajal body(GO:1904869) positive regulation of protein localization to Cajal body(GO:1904871) protein localization to nucleoplasm(GO:1990173) |
| 1.0 | 4.2 | GO:0044351 | macropinocytosis(GO:0044351) |
| 1.0 | 8.3 | GO:0030490 | maturation of SSU-rRNA(GO:0030490) |
| 1.0 | 5.2 | GO:0031848 | protection from non-homologous end joining at telomere(GO:0031848) |
| 1.0 | 4.1 | GO:0048096 | chromatin-mediated maintenance of transcription(GO:0048096) |
| 1.0 | 3.1 | GO:0060448 | dichotomous subdivision of terminal units involved in lung branching(GO:0060448) |
| 1.0 | 2.1 | GO:0070189 | kynurenine metabolic process(GO:0070189) |
| 1.0 | 2.1 | GO:0042414 | epinephrine metabolic process(GO:0042414) |
| 1.0 | 3.1 | GO:0042357 | thiamine diphosphate metabolic process(GO:0042357) |
| 1.0 | 4.1 | GO:0051958 | methotrexate transport(GO:0051958) |
| 1.0 | 2.0 | GO:0042780 | tRNA 3'-end processing(GO:0042780) |
| 1.0 | 2.0 | GO:0045656 | negative regulation of monocyte differentiation(GO:0045656) |
| 1.0 | 2.0 | GO:0019249 | lactate biosynthetic process from pyruvate(GO:0019244) lactate biosynthetic process(GO:0019249) |
| 1.0 | 1.0 | GO:0015809 | arginine transport(GO:0015809) |
| 1.0 | 380.0 | GO:0006955 | immune response(GO:0006955) |
| 1.0 | 6.0 | GO:0035372 | protein localization to microtubule(GO:0035372) |
| 1.0 | 7.9 | GO:2000059 | negative regulation of protein ubiquitination involved in ubiquitin-dependent protein catabolic process(GO:2000059) |
| 1.0 | 6.9 | GO:0035520 | monoubiquitinated protein deubiquitination(GO:0035520) |
| 1.0 | 2.9 | GO:0046882 | negative regulation of follicle-stimulating hormone secretion(GO:0046882) |
| 1.0 | 4.9 | GO:0050995 | negative regulation of lipid catabolic process(GO:0050995) |
| 1.0 | 2.9 | GO:2000382 | positive regulation of mesoderm development(GO:2000382) |
| 1.0 | 2.9 | GO:0010041 | response to iron(III) ion(GO:0010041) |
| 1.0 | 3.9 | GO:0070345 | negative regulation of fat cell proliferation(GO:0070345) |
| 1.0 | 4.9 | GO:0043518 | negative regulation of DNA damage response, signal transduction by p53 class mediator(GO:0043518) |
| 1.0 | 4.8 | GO:0033384 | geranyl diphosphate metabolic process(GO:0033383) geranyl diphosphate biosynthetic process(GO:0033384) |
| 1.0 | 5.8 | GO:0034773 | histone H4-K20 trimethylation(GO:0034773) |
| 1.0 | 1.0 | GO:0003340 | negative regulation of mesenchymal to epithelial transition involved in metanephros morphogenesis(GO:0003340) |
| 0.9 | 5.7 | GO:0006868 | glutamine transport(GO:0006868) |
| 0.9 | 2.8 | GO:0042851 | L-alanine metabolic process(GO:0042851) |
| 0.9 | 1.9 | GO:1901318 | negative regulation of sperm motility(GO:1901318) |
| 0.9 | 0.9 | GO:0040009 | regulation of growth rate(GO:0040009) |
| 0.9 | 6.6 | GO:0046498 | S-adenosylhomocysteine metabolic process(GO:0046498) |
| 0.9 | 10.3 | GO:0001675 | acrosome assembly(GO:0001675) |
| 0.9 | 0.9 | GO:0002930 | trabecular meshwork development(GO:0002930) |
| 0.9 | 8.4 | GO:1904262 | negative regulation of TORC1 signaling(GO:1904262) |
| 0.9 | 2.8 | GO:0071168 | protein localization to chromatin(GO:0071168) |
| 0.9 | 1.8 | GO:0070574 | cadmium ion transport(GO:0015691) cadmium ion transmembrane transport(GO:0070574) |
| 0.9 | 2.7 | GO:0033147 | negative regulation of intracellular estrogen receptor signaling pathway(GO:0033147) |
| 0.9 | 3.6 | GO:0060005 | vestibular reflex(GO:0060005) |
| 0.9 | 14.4 | GO:0009584 | detection of visible light(GO:0009584) |
| 0.9 | 1.8 | GO:0031663 | lipopolysaccharide-mediated signaling pathway(GO:0031663) |
| 0.9 | 5.3 | GO:0034312 | diol biosynthetic process(GO:0034312) |
| 0.9 | 5.3 | GO:0034214 | protein hexamerization(GO:0034214) |
| 0.9 | 4.4 | GO:0034227 | tRNA thio-modification(GO:0034227) |
| 0.9 | 1.7 | GO:0002036 | regulation of L-glutamate transport(GO:0002036) |
| 0.9 | 1.7 | GO:1902237 | positive regulation of endoplasmic reticulum stress-induced intrinsic apoptotic signaling pathway(GO:1902237) |
| 0.9 | 1.7 | GO:0060760 | positive regulation of response to cytokine stimulus(GO:0060760) |
| 0.9 | 4.3 | GO:0043923 | positive regulation by host of viral transcription(GO:0043923) |
| 0.9 | 1.7 | GO:0019448 | cysteine catabolic process(GO:0009093) L-cysteine catabolic process(GO:0019448) L-cysteine metabolic process(GO:0046439) |
| 0.8 | 4.2 | GO:0070164 | negative regulation of adiponectin secretion(GO:0070164) |
| 0.8 | 2.5 | GO:0070417 | cellular response to cold(GO:0070417) |
| 0.8 | 3.4 | GO:0034244 | negative regulation of transcription elongation from RNA polymerase II promoter(GO:0034244) |
| 0.8 | 1.7 | GO:1902953 | positive regulation of ER to Golgi vesicle-mediated transport(GO:1902953) |
| 0.8 | 1.7 | GO:0070084 | protein initiator methionine removal(GO:0070084) |
| 0.8 | 9.2 | GO:0006471 | protein ADP-ribosylation(GO:0006471) |
| 0.8 | 0.8 | GO:0016561 | protein import into peroxisome matrix, translocation(GO:0016561) |
| 0.8 | 5.0 | GO:0006517 | protein deglycosylation(GO:0006517) |
| 0.8 | 2.5 | GO:2000189 | positive regulation of cholesterol homeostasis(GO:2000189) |
| 0.8 | 4.1 | GO:0009750 | response to fructose(GO:0009750) |
| 0.8 | 0.8 | GO:0031627 | telomeric loop formation(GO:0031627) |
| 0.8 | 2.5 | GO:0006613 | cotranslational protein targeting to membrane(GO:0006613) |
| 0.8 | 4.1 | GO:0002548 | monocyte chemotaxis(GO:0002548) |
| 0.8 | 2.5 | GO:1903445 | intermembrane transport(GO:0046909) protein transport from ciliary membrane to plasma membrane(GO:1903445) |
| 0.8 | 4.1 | GO:0030261 | chromosome condensation(GO:0030261) |
| 0.8 | 1.6 | GO:0000454 | snoRNA guided rRNA pseudouridine synthesis(GO:0000454) rRNA pseudouridine synthesis(GO:0031118) |
| 0.8 | 3.3 | GO:0006054 | N-acetylneuraminate metabolic process(GO:0006054) |
| 0.8 | 9.8 | GO:0043277 | apoptotic cell clearance(GO:0043277) |
| 0.8 | 13.0 | GO:0048240 | sperm capacitation(GO:0048240) |
| 0.8 | 1.6 | GO:0045297 | mating plug formation(GO:0042628) post-mating behavior(GO:0045297) |
| 0.8 | 0.8 | GO:0035262 | gonad morphogenesis(GO:0035262) |
| 0.8 | 4.1 | GO:1990822 | basic amino acid transmembrane transport(GO:1990822) |
| 0.8 | 13.0 | GO:0008206 | bile acid metabolic process(GO:0008206) |
| 0.8 | 7.9 | GO:0006544 | glycine metabolic process(GO:0006544) |
| 0.8 | 5.5 | GO:0030851 | granulocyte differentiation(GO:0030851) |
| 0.8 | 0.8 | GO:0072711 | cellular response to hydroxyurea(GO:0072711) |
| 0.8 | 2.3 | GO:0048631 | regulation of skeletal muscle tissue growth(GO:0048631) |
| 0.8 | 0.8 | GO:0060018 | astrocyte fate commitment(GO:0060018) |
| 0.8 | 6.2 | GO:0006783 | heme biosynthetic process(GO:0006783) |
| 0.8 | 3.9 | GO:1904948 | midbrain dopaminergic neuron differentiation(GO:1904948) |
| 0.8 | 1.6 | GO:0042255 | ribosome assembly(GO:0042255) |
| 0.8 | 7.0 | GO:1904152 | regulation of retrograde protein transport, ER to cytosol(GO:1904152) |
| 0.8 | 4.6 | GO:0032463 | negative regulation of protein homooligomerization(GO:0032463) |
| 0.8 | 0.8 | GO:0001555 | oocyte growth(GO:0001555) |
| 0.8 | 0.8 | GO:0097201 | negative regulation of transcription from RNA polymerase II promoter in response to stress(GO:0097201) |
| 0.8 | 5.3 | GO:0003376 | sphingosine-1-phosphate signaling pathway(GO:0003376) |
| 0.7 | 0.7 | GO:0090172 | microtubule cytoskeleton organization involved in homologous chromosome segregation(GO:0090172) |
| 0.7 | 3.7 | GO:0003223 | ventricular compact myocardium morphogenesis(GO:0003223) |
| 0.7 | 3.0 | GO:0022417 | protein maturation by protein folding(GO:0022417) |
| 0.7 | 17.1 | GO:0006611 | protein export from nucleus(GO:0006611) |
| 0.7 | 1.5 | GO:0006271 | DNA strand elongation involved in DNA replication(GO:0006271) |
| 0.7 | 4.4 | GO:0035590 | purinergic nucleotide receptor signaling pathway(GO:0035590) |
| 0.7 | 0.7 | GO:0043038 | amino acid activation(GO:0043038) |
| 0.7 | 3.7 | GO:0048368 | lateral mesoderm development(GO:0048368) |
| 0.7 | 3.7 | GO:0019509 | L-methionine biosynthetic process from methylthioadenosine(GO:0019509) |
| 0.7 | 2.9 | GO:0045039 | protein import into mitochondrial inner membrane(GO:0045039) |
| 0.7 | 1.4 | GO:2000609 | regulation of thyroid hormone generation(GO:2000609) |
| 0.7 | 6.4 | GO:0060009 | Sertoli cell development(GO:0060009) |
| 0.7 | 8.5 | GO:0031069 | hair follicle morphogenesis(GO:0031069) |
| 0.7 | 12.7 | GO:0030514 | negative regulation of BMP signaling pathway(GO:0030514) |
| 0.7 | 2.8 | GO:0045835 | negative regulation of meiotic nuclear division(GO:0045835) |
| 0.7 | 3.5 | GO:0033523 | histone H2B ubiquitination(GO:0033523) |
| 0.7 | 1.4 | GO:0010499 | proteasomal ubiquitin-independent protein catabolic process(GO:0010499) |
| 0.7 | 1.4 | GO:0007253 | cytoplasmic sequestering of NF-kappaB(GO:0007253) |
| 0.7 | 10.4 | GO:0016180 | snRNA processing(GO:0016180) |
| 0.7 | 5.5 | GO:0036092 | phosphatidylinositol-3-phosphate biosynthetic process(GO:0036092) |
| 0.7 | 2.1 | GO:1904016 | response to Thyroglobulin triiodothyronine(GO:1904016) cellular response to Thyroglobulin triiodothyronine(GO:1904017) |
| 0.7 | 1.4 | GO:1904426 | positive regulation of GTP binding(GO:1904426) |
| 0.7 | 4.1 | GO:0055070 | copper ion homeostasis(GO:0055070) |
| 0.7 | 0.7 | GO:0070475 | rRNA base methylation(GO:0070475) |
| 0.7 | 0.7 | GO:0072143 | renal interstitial fibroblast development(GO:0072141) mesangial cell development(GO:0072143) glomerular mesangial cell development(GO:0072144) |
| 0.7 | 1.4 | GO:1904823 | purine nucleobase transmembrane transport(GO:1904823) |
| 0.7 | 0.7 | GO:0009650 | UV protection(GO:0009650) |
| 0.7 | 1.3 | GO:2001160 | histone H3-K79 methylation(GO:0034729) regulation of histone H3-K79 methylation(GO:2001160) |
| 0.7 | 2.7 | GO:0036265 | RNA (guanine-N7)-methylation(GO:0036265) |
| 0.7 | 2.0 | GO:0045721 | negative regulation of gluconeogenesis(GO:0045721) |
| 0.7 | 3.3 | GO:0051151 | negative regulation of smooth muscle cell differentiation(GO:0051151) |
| 0.7 | 3.3 | GO:0042359 | vitamin D metabolic process(GO:0042359) |
| 0.7 | 6.6 | GO:2000772 | regulation of cellular senescence(GO:2000772) |
| 0.7 | 5.9 | GO:0030212 | hyaluronan metabolic process(GO:0030212) |
| 0.7 | 0.7 | GO:0008298 | intracellular mRNA localization(GO:0008298) |
| 0.7 | 0.7 | GO:0045723 | positive regulation of fatty acid biosynthetic process(GO:0045723) |
| 0.7 | 3.9 | GO:0080009 | mRNA methylation(GO:0080009) |
| 0.6 | 0.6 | GO:1901526 | positive regulation of macromitophagy(GO:1901526) positive regulation of mitophagy in response to mitochondrial depolarization(GO:1904925) |
| 0.6 | 62.0 | GO:0042157 | lipoprotein metabolic process(GO:0042157) |
| 0.6 | 2.6 | GO:0032204 | regulation of telomere maintenance(GO:0032204) |
| 0.6 | 1.3 | GO:0070813 | hydrogen sulfide metabolic process(GO:0070813) |
| 0.6 | 5.7 | GO:0048536 | spleen development(GO:0048536) |
| 0.6 | 24.6 | GO:0006182 | cGMP biosynthetic process(GO:0006182) |
| 0.6 | 12.6 | GO:0031163 | iron-sulfur cluster assembly(GO:0016226) metallo-sulfur cluster assembly(GO:0031163) |
| 0.6 | 2.4 | GO:1901029 | negative regulation of mitochondrial outer membrane permeabilization involved in apoptotic signaling pathway(GO:1901029) |
| 0.6 | 1.2 | GO:0060800 | regulation of cell differentiation involved in embryonic placenta development(GO:0060800) |
| 0.6 | 1.2 | GO:0050434 | positive regulation of viral transcription(GO:0050434) |
| 0.6 | 12.2 | GO:0007004 | RNA-dependent DNA biosynthetic process(GO:0006278) telomere maintenance via telomerase(GO:0007004) |
| 0.6 | 0.6 | GO:0060900 | optic cup morphogenesis involved in camera-type eye development(GO:0002072) embryonic camera-type eye formation(GO:0060900) |
| 0.6 | 2.4 | GO:0021633 | optic nerve structural organization(GO:0021633) |
| 0.6 | 1.2 | GO:0032695 | negative regulation of interleukin-12 production(GO:0032695) |
| 0.6 | 1.2 | GO:0046653 | tetrahydrofolate metabolic process(GO:0046653) |
| 0.6 | 2.9 | GO:0016266 | O-glycan processing(GO:0016266) |
| 0.6 | 24.6 | GO:0090305 | nucleic acid phosphodiester bond hydrolysis(GO:0090305) |
| 0.6 | 1.7 | GO:1902751 | positive regulation of G2/M transition of mitotic cell cycle(GO:0010971) positive regulation of cell cycle G2/M phase transition(GO:1902751) |
| 0.6 | 1.1 | GO:0033686 | positive regulation of luteinizing hormone secretion(GO:0033686) |
| 0.6 | 1.7 | GO:0006848 | pyruvate transport(GO:0006848) pyruvate transmembrane transport(GO:1901475) |
| 0.6 | 0.6 | GO:1903862 | positive regulation of oxidative phosphorylation(GO:1903862) |
| 0.6 | 1.7 | GO:1900108 | negative regulation of nodal signaling pathway(GO:1900108) |
| 0.6 | 1.7 | GO:0006983 | ER overload response(GO:0006983) |
| 0.5 | 0.5 | GO:0046113 | nucleobase catabolic process(GO:0046113) |
| 0.5 | 0.5 | GO:0042264 | peptidyl-aspartic acid hydroxylation(GO:0042264) |
| 0.5 | 1.1 | GO:0051660 | establishment of centrosome localization(GO:0051660) |
| 0.5 | 1.6 | GO:1901844 | regulation of cell communication by electrical coupling involved in cardiac conduction(GO:1901844) |
| 0.5 | 2.7 | GO:0060670 | branching involved in labyrinthine layer morphogenesis(GO:0060670) |
| 0.5 | 2.1 | GO:0032486 | Rap protein signal transduction(GO:0032486) |
| 0.5 | 1.6 | GO:0070914 | UV-damage excision repair(GO:0070914) |
| 0.5 | 0.5 | GO:0034086 | maintenance of sister chromatid cohesion(GO:0034086) maintenance of mitotic sister chromatid cohesion(GO:0034088) |
| 0.5 | 1.0 | GO:0060327 | cytoplasmic actin-based contraction involved in cell motility(GO:0060327) |
| 0.5 | 2.1 | GO:0019348 | dolichol metabolic process(GO:0019348) |
| 0.5 | 2.1 | GO:0009235 | cobalamin metabolic process(GO:0009235) |
| 0.5 | 1.0 | GO:0038171 | cannabinoid signaling pathway(GO:0038171) |
| 0.5 | 0.5 | GO:0038129 | ERBB3 signaling pathway(GO:0038129) |
| 0.5 | 2.6 | GO:0042789 | mRNA transcription from RNA polymerase II promoter(GO:0042789) |
| 0.5 | 1.5 | GO:0060707 | trophoblast giant cell differentiation(GO:0060707) |
| 0.5 | 5.4 | GO:0006378 | mRNA polyadenylation(GO:0006378) |
| 0.5 | 1.0 | GO:0048630 | skeletal muscle tissue growth(GO:0048630) |
| 0.5 | 2.0 | GO:1901725 | regulation of histone deacetylase activity(GO:1901725) |
| 0.5 | 2.0 | GO:0021526 | medial motor column neuron differentiation(GO:0021526) |
| 0.5 | 1.0 | GO:0061484 | hematopoietic stem cell homeostasis(GO:0061484) |
| 0.5 | 0.5 | GO:0045054 | constitutive secretory pathway(GO:0045054) |
| 0.5 | 2.9 | GO:0007143 | female meiotic division(GO:0007143) |
| 0.5 | 0.5 | GO:0050968 | detection of chemical stimulus involved in sensory perception of pain(GO:0050968) |
| 0.5 | 5.1 | GO:1902042 | negative regulation of extrinsic apoptotic signaling pathway via death domain receptors(GO:1902042) |
| 0.5 | 0.5 | GO:0003219 | cardiac right ventricle formation(GO:0003219) |
| 0.5 | 1.8 | GO:0060770 | negative regulation of epithelial cell proliferation involved in prostate gland development(GO:0060770) |
| 0.4 | 6.7 | GO:0043248 | proteasome assembly(GO:0043248) |
| 0.4 | 6.2 | GO:0032958 | inositol phosphate biosynthetic process(GO:0032958) |
| 0.4 | 0.9 | GO:0006567 | threonine catabolic process(GO:0006567) |
| 0.4 | 0.4 | GO:0000492 | box C/D snoRNP assembly(GO:0000492) |
| 0.4 | 0.4 | GO:0032747 | positive regulation of interleukin-23 production(GO:0032747) |
| 0.4 | 3.0 | GO:0030046 | parallel actin filament bundle assembly(GO:0030046) |
| 0.4 | 2.1 | GO:0045040 | protein import into mitochondrial outer membrane(GO:0045040) |
| 0.4 | 1.3 | GO:0070314 | G1 to G0 transition(GO:0070314) |
| 0.4 | 0.8 | GO:0036414 | protein citrullination(GO:0018101) histone citrullination(GO:0036414) |
| 0.4 | 0.8 | GO:0032277 | negative regulation of gonadotropin secretion(GO:0032277) |
| 0.4 | 0.8 | GO:0046726 | positive regulation by virus of viral protein levels in host cell(GO:0046726) |
| 0.4 | 0.8 | GO:0061101 | neuroendocrine cell differentiation(GO:0061101) |
| 0.4 | 1.2 | GO:0090481 | pyrimidine nucleotide-sugar transmembrane transport(GO:0090481) |
| 0.4 | 0.8 | GO:0046100 | hypoxanthine metabolic process(GO:0046100) hypoxanthine biosynthetic process(GO:0046101) |
| 0.4 | 0.8 | GO:0031444 | slow-twitch skeletal muscle fiber contraction(GO:0031444) |
| 0.4 | 2.3 | GO:0043486 | histone exchange(GO:0043486) |
| 0.4 | 1.1 | GO:0060014 | granulosa cell differentiation(GO:0060014) |
| 0.4 | 0.4 | GO:1902309 | blood vessel endothelial cell proliferation involved in sprouting angiogenesis(GO:0002043) negative regulation of peptidyl-serine dephosphorylation(GO:1902309) regulation of blood vessel endothelial cell proliferation involved in sprouting angiogenesis(GO:1903587) |
| 0.4 | 2.3 | GO:1902622 | regulation of neutrophil migration(GO:1902622) |
| 0.4 | 3.8 | GO:0019511 | peptidyl-proline hydroxylation(GO:0019511) |
| 0.4 | 0.4 | GO:0036093 | germ cell proliferation(GO:0036093) |
| 0.4 | 2.6 | GO:0031297 | replication fork processing(GO:0031297) |
| 0.4 | 0.7 | GO:0048341 | paraxial mesoderm formation(GO:0048341) |
| 0.4 | 1.5 | GO:0018317 | protein C-linked glycosylation(GO:0018103) peptidyl-tryptophan modification(GO:0018211) protein C-linked glycosylation via tryptophan(GO:0018317) protein C-linked glycosylation via 2'-alpha-mannosyl-L-tryptophan(GO:0018406) |
| 0.4 | 4.4 | GO:0006541 | glutamine metabolic process(GO:0006541) |
| 0.4 | 1.1 | GO:1901097 | negative regulation of autophagosome maturation(GO:1901097) |
| 0.4 | 1.4 | GO:0007252 | I-kappaB phosphorylation(GO:0007252) |
| 0.4 | 1.1 | GO:1901873 | regulation of post-translational protein modification(GO:1901873) |
| 0.4 | 0.7 | GO:0005984 | disaccharide metabolic process(GO:0005984) |
| 0.4 | 2.1 | GO:0046085 | adenosine metabolic process(GO:0046085) |
| 0.3 | 1.7 | GO:2000786 | positive regulation of autophagosome assembly(GO:2000786) |
| 0.3 | 1.4 | GO:0046040 | IMP metabolic process(GO:0046040) |
| 0.3 | 0.7 | GO:0042322 | negative regulation of circadian sleep/wake cycle, REM sleep(GO:0042322) |
| 0.3 | 1.7 | GO:0071157 | negative regulation of cell cycle arrest(GO:0071157) |
| 0.3 | 0.7 | GO:0033700 | phospholipid efflux(GO:0033700) |
| 0.3 | 0.7 | GO:2000346 | negative regulation of hepatocyte proliferation(GO:2000346) |
| 0.3 | 5.9 | GO:0009988 | cell-cell recognition(GO:0009988) |
| 0.3 | 0.3 | GO:0010157 | response to chlorate(GO:0010157) |
| 0.3 | 0.6 | GO:0030091 | protein repair(GO:0030091) |
| 0.3 | 0.6 | GO:0018963 | phthalate metabolic process(GO:0018963) |
| 0.3 | 0.6 | GO:0042412 | taurine biosynthetic process(GO:0042412) |
| 0.3 | 6.7 | GO:0006376 | mRNA splice site selection(GO:0006376) |
| 0.3 | 0.3 | GO:1903894 | regulation of IRE1-mediated unfolded protein response(GO:1903894) |
| 0.3 | 2.6 | GO:0071354 | cellular response to interleukin-6(GO:0071354) |
| 0.3 | 0.3 | GO:0006408 | snRNA export from nucleus(GO:0006408) |
| 0.3 | 1.1 | GO:0019321 | pentose metabolic process(GO:0019321) |
| 0.3 | 1.1 | GO:1990440 | positive regulation of transcription from RNA polymerase II promoter in response to endoplasmic reticulum stress(GO:1990440) |
| 0.3 | 1.4 | GO:0043482 | endosome to melanosome transport(GO:0035646) pigment accumulation(GO:0043476) cellular pigment accumulation(GO:0043482) endosome to pigment granule transport(GO:0043485) pigment granule maturation(GO:0048757) |
| 0.3 | 0.8 | GO:0033615 | mitochondrial proton-transporting ATP synthase complex assembly(GO:0033615) |
| 0.3 | 2.4 | GO:0051988 | regulation of attachment of spindle microtubules to kinetochore(GO:0051988) |
| 0.3 | 0.8 | GO:0038158 | granulocyte colony-stimulating factor signaling pathway(GO:0038158) |
| 0.3 | 4.1 | GO:0030520 | intracellular estrogen receptor signaling pathway(GO:0030520) |
| 0.3 | 2.1 | GO:0006596 | polyamine biosynthetic process(GO:0006596) |
| 0.3 | 0.5 | GO:0043418 | homocysteine catabolic process(GO:0043418) |
| 0.3 | 7.0 | GO:0006261 | DNA-dependent DNA replication(GO:0006261) |
| 0.2 | 1.2 | GO:0034551 | respiratory chain complex III assembly(GO:0017062) mitochondrial respiratory chain complex III assembly(GO:0034551) |
| 0.2 | 1.0 | GO:0045743 | positive regulation of fibroblast growth factor receptor signaling pathway(GO:0045743) |
| 0.2 | 0.5 | GO:0006552 | leucine catabolic process(GO:0006552) |
| 0.2 | 1.2 | GO:0070875 | positive regulation of glycogen biosynthetic process(GO:0045725) positive regulation of glycogen metabolic process(GO:0070875) |
| 0.2 | 0.2 | GO:1904313 | response to methamphetamine hydrochloride(GO:1904313) |
| 0.2 | 2.5 | GO:0006879 | cellular iron ion homeostasis(GO:0006879) |
| 0.2 | 0.9 | GO:0033234 | negative regulation of protein sumoylation(GO:0033234) |
| 0.2 | 0.7 | GO:0032474 | otolith morphogenesis(GO:0032474) |
| 0.2 | 1.4 | GO:0015866 | ADP transport(GO:0015866) |
| 0.2 | 0.7 | GO:0051444 | negative regulation of ligase activity(GO:0051352) negative regulation of ubiquitin-protein transferase activity(GO:0051444) |
| 0.2 | 0.7 | GO:0051461 | positive regulation of corticotropin secretion(GO:0051461) |
| 0.2 | 0.4 | GO:0033566 | gamma-tubulin complex localization(GO:0033566) |
| 0.2 | 0.7 | GO:0042985 | negative regulation of amyloid precursor protein biosynthetic process(GO:0042985) |
| 0.2 | 0.8 | GO:0071386 | cellular response to corticosterone stimulus(GO:0071386) |
| 0.2 | 1.2 | GO:0060158 | phospholipase C-activating dopamine receptor signaling pathway(GO:0060158) |
| 0.2 | 2.6 | GO:0006646 | phosphatidylethanolamine biosynthetic process(GO:0006646) |
| 0.2 | 1.0 | GO:0032508 | DNA duplex unwinding(GO:0032508) |
| 0.2 | 0.4 | GO:0071409 | cellular response to cycloheximide(GO:0071409) |
| 0.2 | 0.6 | GO:0034224 | cellular response to zinc ion starvation(GO:0034224) |
| 0.2 | 3.8 | GO:0006383 | transcription from RNA polymerase III promoter(GO:0006383) |
| 0.2 | 0.4 | GO:1901979 | regulation of inward rectifier potassium channel activity(GO:1901979) |
| 0.2 | 0.9 | GO:0003413 | chondrocyte differentiation involved in endochondral bone morphogenesis(GO:0003413) |
| 0.2 | 0.3 | GO:0031584 | activation of phospholipase D activity(GO:0031584) |
| 0.2 | 0.2 | GO:0072162 | metanephric mesenchymal cell differentiation(GO:0072162) |
| 0.2 | 0.7 | GO:0030730 | sequestering of triglyceride(GO:0030730) |
| 0.2 | 0.7 | GO:0046884 | follicle-stimulating hormone secretion(GO:0046884) |
| 0.2 | 0.9 | GO:0051085 | chaperone mediated protein folding requiring cofactor(GO:0051085) |
| 0.2 | 0.5 | GO:0009052 | pentose-phosphate shunt, non-oxidative branch(GO:0009052) |
| 0.2 | 0.6 | GO:0035990 | tendon cell differentiation(GO:0035990) tendon formation(GO:0035992) |
| 0.1 | 0.3 | GO:0010992 | ubiquitin homeostasis(GO:0010992) |
| 0.1 | 0.8 | GO:0006474 | N-terminal protein amino acid acetylation(GO:0006474) |
| 0.1 | 0.7 | GO:0051970 | negative regulation of transmission of nerve impulse(GO:0051970) |
| 0.1 | 0.9 | GO:0042744 | hydrogen peroxide catabolic process(GO:0042744) |
| 0.1 | 0.5 | GO:0070389 | chaperone cofactor-dependent protein refolding(GO:0070389) |
| 0.1 | 0.2 | GO:0051974 | negative regulation of telomerase activity(GO:0051974) |
| 0.1 | 0.4 | GO:0006004 | fucose metabolic process(GO:0006004) |
| 0.1 | 0.1 | GO:0090116 | C-5 methylation of cytosine(GO:0090116) |
| 0.1 | 1.9 | GO:0031581 | hemidesmosome assembly(GO:0031581) |
| 0.1 | 2.1 | GO:0000079 | regulation of cyclin-dependent protein serine/threonine kinase activity(GO:0000079) |
| 0.1 | 0.4 | GO:0007250 | activation of NF-kappaB-inducing kinase activity(GO:0007250) |
| 0.1 | 1.8 | GO:0051092 | positive regulation of NF-kappaB transcription factor activity(GO:0051092) |
| 0.1 | 0.2 | GO:0030242 | pexophagy(GO:0030242) |
| 0.1 | 0.5 | GO:0046485 | ether lipid metabolic process(GO:0046485) |
| 0.1 | 0.1 | GO:1903772 | regulation of viral budding via host ESCRT complex(GO:1903772) |
| 0.1 | 0.3 | GO:0030970 | retrograde protein transport, ER to cytosol(GO:0030970) |
| 0.1 | 0.2 | GO:0021773 | striatal medium spiny neuron differentiation(GO:0021773) |
| 0.0 | 0.1 | GO:0034393 | positive regulation of smooth muscle cell apoptotic process(GO:0034393) |
| 0.0 | 0.9 | GO:0010501 | RNA secondary structure unwinding(GO:0010501) |
| 0.0 | 0.5 | GO:0010447 | response to acidic pH(GO:0010447) |
| 0.0 | 0.1 | GO:2001106 | regulation of Rho guanyl-nucleotide exchange factor activity(GO:2001106) |
| 0.0 | 0.2 | GO:0032506 | cytokinetic process(GO:0032506) |
| 0.0 | 0.3 | GO:1900028 | negative regulation of ruffle assembly(GO:1900028) |
| 0.0 | 0.1 | GO:0033227 | dsRNA transport(GO:0033227) |
| 0.0 | 0.1 | GO:0033539 | fatty acid beta-oxidation using acyl-CoA dehydrogenase(GO:0033539) |
| 0.0 | 0.1 | GO:0006220 | pyrimidine nucleotide metabolic process(GO:0006220) |
Gene overrepresentation in cellular component category:
| Log-likelihood per target | Total log-likelihood | Term | Description |
|---|---|---|---|
| 29.0 | 232.3 | GO:0042105 | alpha-beta T cell receptor complex(GO:0042105) |
| 23.0 | 115.0 | GO:0072557 | IPAF inflammasome complex(GO:0072557) |
| 18.8 | 75.0 | GO:0044218 | other organism cell membrane(GO:0044218) other organism membrane(GO:0044279) |
| 17.2 | 172.0 | GO:0042101 | T cell receptor complex(GO:0042101) |
| 16.9 | 33.8 | GO:0097169 | AIM2 inflammasome complex(GO:0097169) |
| 16.9 | 50.6 | GO:0072559 | NLRP3 inflammasome complex(GO:0072559) |
| 16.0 | 256.4 | GO:0042613 | MHC class II protein complex(GO:0042613) |
| 15.9 | 143.1 | GO:0034366 | spherical high-density lipoprotein particle(GO:0034366) |
| 15.3 | 61.1 | GO:0071065 | alpha9-beta1 integrin-vascular cell adhesion molecule-1 complex(GO:0071065) |
| 15.0 | 60.0 | GO:0042571 | immunoglobulin complex, circulating(GO:0042571) |
| 13.6 | 40.9 | GO:0097125 | cyclin B1-CDK1 complex(GO:0097125) |
| 13.5 | 40.6 | GO:0005944 | phosphatidylinositol 3-kinase complex, class IB(GO:0005944) |
| 13.5 | 80.8 | GO:0005579 | membrane attack complex(GO:0005579) |
| 13.3 | 53.0 | GO:0009330 | DNA topoisomerase complex (ATP-hydrolyzing)(GO:0009330) |
| 12.3 | 135.6 | GO:0005833 | hemoglobin complex(GO:0005833) |
| 11.7 | 70.0 | GO:0097342 | ripoptosome(GO:0097342) |
| 11.4 | 320.4 | GO:0000788 | nuclear nucleosome(GO:0000788) |
| 11.1 | 22.2 | GO:0036398 | TCR signalosome(GO:0036398) |
| 10.6 | 42.4 | GO:1990712 | HFE-transferrin receptor complex(GO:1990712) |
| 10.5 | 31.4 | GO:0032398 | MHC class Ib protein complex(GO:0032398) |
| 9.9 | 29.8 | GO:1990423 | RZZ complex(GO:1990423) |
| 9.8 | 29.4 | GO:0019814 | immunoglobulin complex(GO:0019814) B cell receptor complex(GO:0019815) |
| 9.8 | 39.0 | GO:0031436 | BRCA1-BARD1 complex(GO:0031436) |
| 9.6 | 9.6 | GO:0034363 | intermediate-density lipoprotein particle(GO:0034363) |
| 9.2 | 73.6 | GO:0005577 | fibrinogen complex(GO:0005577) |
| 8.8 | 964.0 | GO:0072562 | blood microparticle(GO:0072562) |
| 8.1 | 24.3 | GO:0031680 | G-protein beta/gamma-subunit complex(GO:0031680) |
| 7.9 | 23.8 | GO:0000811 | GINS complex(GO:0000811) |
| 7.8 | 62.7 | GO:0000796 | condensin complex(GO:0000796) |
| 7.8 | 242.9 | GO:0042588 | zymogen granule(GO:0042588) |
| 7.4 | 66.3 | GO:0001931 | uropod(GO:0001931) cell trailing edge(GO:0031254) |
| 7.3 | 87.1 | GO:0042612 | MHC class I protein complex(GO:0042612) |
| 7.1 | 92.8 | GO:0000940 | condensed chromosome outer kinetochore(GO:0000940) |
| 7.1 | 247.5 | GO:0001772 | immunological synapse(GO:0001772) |
| 7.1 | 106.0 | GO:0034364 | high-density lipoprotein particle(GO:0034364) |
| 6.7 | 13.3 | GO:0035692 | macrophage migration inhibitory factor receptor complex(GO:0035692) |
| 6.6 | 52.8 | GO:0005658 | alpha DNA polymerase:primase complex(GO:0005658) |
| 6.4 | 19.2 | GO:0005896 | interleukin-6 receptor complex(GO:0005896) |
| 6.4 | 446.0 | GO:0000786 | nucleosome(GO:0000786) |
| 6.3 | 31.7 | GO:0000778 | condensed nuclear chromosome kinetochore(GO:0000778) |
| 6.3 | 1859.2 | GO:0009897 | external side of plasma membrane(GO:0009897) |
| 6.3 | 31.3 | GO:0043625 | delta DNA polymerase complex(GO:0043625) |
| 6.2 | 18.5 | GO:0008537 | proteasome activator complex(GO:0008537) |
| 6.2 | 30.9 | GO:0097425 | smooth endoplasmic reticulum membrane(GO:0030868) smooth endoplasmic reticulum part(GO:0097425) |
| 6.0 | 30.0 | GO:0033063 | Rad51B-Rad51C-Rad51D-XRCC2 complex(GO:0033063) |
| 5.8 | 17.4 | GO:0097629 | extrinsic component of omegasome membrane(GO:0097629) |
| 5.8 | 17.4 | GO:0070821 | tertiary granule membrane(GO:0070821) |
| 5.6 | 22.2 | GO:0020016 | ciliary pocket(GO:0020016) ciliary pocket membrane(GO:0020018) |
| 5.6 | 22.2 | GO:0030478 | actin cap(GO:0030478) |
| 5.5 | 33.3 | GO:0005663 | DNA replication factor C complex(GO:0005663) |
| 5.5 | 27.6 | GO:0035985 | senescence-associated heterochromatin focus(GO:0035985) |
| 5.5 | 38.6 | GO:0005683 | U7 snRNP(GO:0005683) |
| 5.5 | 22.0 | GO:0032777 | Piccolo NuA4 histone acetyltransferase complex(GO:0032777) |
| 5.3 | 42.1 | GO:0019907 | cyclin-dependent protein kinase activating kinase holoenzyme complex(GO:0019907) |
| 5.2 | 20.8 | GO:0002947 | tumor necrosis factor receptor superfamily complex(GO:0002947) |
| 5.2 | 10.3 | GO:0032133 | chromosome passenger complex(GO:0032133) |
| 5.1 | 5.1 | GO:0030981 | cortical microtubule cytoskeleton(GO:0030981) |
| 5.0 | 34.8 | GO:0042824 | MHC class I peptide loading complex(GO:0042824) TAP complex(GO:0042825) |
| 5.0 | 39.7 | GO:0072669 | tRNA-splicing ligase complex(GO:0072669) |
| 5.0 | 14.9 | GO:0070826 | paraferritin complex(GO:0070826) |
| 4.8 | 23.9 | GO:0008622 | epsilon DNA polymerase complex(GO:0008622) |
| 4.8 | 19.1 | GO:0000444 | MIS12/MIND type complex(GO:0000444) |
| 4.7 | 47.5 | GO:0034663 | endoplasmic reticulum chaperone complex(GO:0034663) |
| 4.7 | 18.8 | GO:0005971 | ribonucleoside-diphosphate reductase complex(GO:0005971) |
| 4.7 | 337.7 | GO:0022627 | cytosolic small ribosomal subunit(GO:0022627) |
| 4.7 | 14.0 | GO:1990826 | nucleoplasmic periphery of the nuclear pore complex(GO:1990826) |
| 4.7 | 18.6 | GO:0020005 | symbiont-containing vacuole membrane(GO:0020005) |
| 4.6 | 64.8 | GO:0031616 | spindle pole centrosome(GO:0031616) |
| 4.6 | 97.2 | GO:0042629 | mast cell granule(GO:0042629) |
| 4.5 | 45.0 | GO:0031080 | nuclear pore outer ring(GO:0031080) |
| 4.5 | 433.6 | GO:0022625 | cytosolic large ribosomal subunit(GO:0022625) |
| 4.4 | 30.8 | GO:0097524 | sperm plasma membrane(GO:0097524) |
| 4.3 | 13.0 | GO:0055087 | Ski complex(GO:0055087) |
| 4.3 | 13.0 | GO:0009328 | phenylalanine-tRNA ligase complex(GO:0009328) |
| 4.3 | 25.5 | GO:0005672 | transcription factor TFIIA complex(GO:0005672) |
| 4.2 | 21.1 | GO:0030015 | CCR4-NOT core complex(GO:0030015) |
| 4.2 | 21.1 | GO:0070195 | growth hormone receptor complex(GO:0070195) |
| 4.2 | 12.5 | GO:0097651 | phosphatidylinositol 3-kinase complex, class IA(GO:0005943) phosphatidylinositol 3-kinase complex, class I(GO:0097651) |
| 4.2 | 16.7 | GO:0097149 | centralspindlin complex(GO:0097149) |
| 4.2 | 62.3 | GO:0070938 | contractile ring(GO:0070938) |
| 4.1 | 4.1 | GO:0030870 | Mre11 complex(GO:0030870) |
| 4.1 | 53.0 | GO:0046581 | intercellular canaliculus(GO:0046581) |
| 4.0 | 11.9 | GO:0071149 | TEAD-2-YAP complex(GO:0071149) |
| 4.0 | 11.9 | GO:0033186 | CAF-1 complex(GO:0033186) |
| 3.9 | 7.7 | GO:0072558 | NLRP1 inflammasome complex(GO:0072558) |
| 3.8 | 23.0 | GO:0000974 | Prp19 complex(GO:0000974) |
| 3.8 | 11.5 | GO:0031262 | Ndc80 complex(GO:0031262) |
| 3.8 | 7.6 | GO:0008278 | cohesin complex(GO:0008278) |
| 3.7 | 40.4 | GO:0042555 | MCM complex(GO:0042555) |
| 3.5 | 24.5 | GO:0005687 | U4 snRNP(GO:0005687) |
| 3.4 | 20.4 | GO:0031904 | endosome lumen(GO:0031904) |
| 3.4 | 20.3 | GO:1990111 | spermatoproteasome complex(GO:1990111) |
| 3.3 | 16.3 | GO:0034455 | t-UTP complex(GO:0034455) |
| 3.2 | 41.9 | GO:0000801 | central element(GO:0000801) |
| 3.2 | 9.5 | GO:0035867 | alphav-beta3 integrin-IGF-1-IGF1R complex(GO:0035867) |
| 3.2 | 82.0 | GO:0035145 | exon-exon junction complex(GO:0035145) |
| 3.1 | 9.4 | GO:1990682 | CSF1-CSF1R complex(GO:1990682) |
| 3.1 | 58.9 | GO:0031907 | peroxisomal matrix(GO:0005782) microbody lumen(GO:0031907) |
| 3.1 | 12.3 | GO:0044299 | C-fiber(GO:0044299) |
| 3.0 | 42.4 | GO:0030894 | DNA replication factor A complex(GO:0005662) replisome(GO:0030894) nuclear replisome(GO:0043601) |
| 3.0 | 12.1 | GO:0043564 | Ku70:Ku80 complex(GO:0043564) |
| 3.0 | 9.0 | GO:1990590 | ATF1-ATF4 transcription factor complex(GO:1990590) |
| 3.0 | 9.0 | GO:0033093 | Weibel-Palade body(GO:0033093) |
| 2.9 | 2.9 | GO:0033290 | eukaryotic 48S preinitiation complex(GO:0033290) |
| 2.9 | 11.7 | GO:0000938 | GARP complex(GO:0000938) |
| 2.9 | 17.5 | GO:0034388 | Pwp2p-containing subcomplex of 90S preribosome(GO:0034388) |
| 2.9 | 17.2 | GO:0031298 | replication fork protection complex(GO:0031298) |
| 2.8 | 25.6 | GO:0033256 | I-kappaB/NF-kappaB complex(GO:0033256) |
| 2.8 | 25.5 | GO:0031010 | ISWI-type complex(GO:0031010) |
| 2.8 | 64.4 | GO:0005721 | pericentric heterochromatin(GO:0005721) |
| 2.8 | 19.6 | GO:0000780 | condensed nuclear chromosome, centromeric region(GO:0000780) |
| 2.7 | 8.2 | GO:0005726 | perichromatin fibrils(GO:0005726) |
| 2.7 | 10.7 | GO:0034774 | secretory granule lumen(GO:0034774) |
| 2.7 | 58.6 | GO:0005657 | replication fork(GO:0005657) |
| 2.6 | 10.6 | GO:1990005 | granular vesicle(GO:1990005) |
| 2.6 | 26.1 | GO:0043020 | NADPH oxidase complex(GO:0043020) |
| 2.6 | 40.8 | GO:0043240 | Fanconi anaemia nuclear complex(GO:0043240) |
| 2.5 | 10.2 | GO:0035339 | SPOTS complex(GO:0035339) |
| 2.5 | 17.4 | GO:0097197 | tetraspanin-enriched microdomain(GO:0097197) |
| 2.4 | 7.3 | GO:0097058 | CRLF-CLCF1 complex(GO:0097058) |
| 2.4 | 17.0 | GO:0042406 | extrinsic component of endoplasmic reticulum membrane(GO:0042406) |
| 2.3 | 11.7 | GO:1990726 | Lsm1-7-Pat1 complex(GO:1990726) |
| 2.3 | 23.2 | GO:0000347 | THO complex(GO:0000347) THO complex part of transcription export complex(GO:0000445) |
| 2.3 | 13.8 | GO:0036128 | CatSper complex(GO:0036128) |
| 2.3 | 36.8 | GO:0035686 | sperm fibrous sheath(GO:0035686) |
| 2.3 | 6.9 | GO:0000839 | Hrd1p ubiquitin ligase ERAD-L complex(GO:0000839) |
| 2.3 | 27.4 | GO:0005736 | DNA-directed RNA polymerase I complex(GO:0005736) |
| 2.3 | 6.8 | GO:0044530 | supraspliceosomal complex(GO:0044530) |
| 2.3 | 15.8 | GO:0070449 | elongin complex(GO:0070449) |
| 2.3 | 11.3 | GO:0097165 | nuclear stress granule(GO:0097165) |
| 2.2 | 53.4 | GO:0008074 | guanylate cyclase complex, soluble(GO:0008074) |
| 2.2 | 57.7 | GO:0030687 | preribosome, large subunit precursor(GO:0030687) |
| 2.2 | 15.5 | GO:0016600 | flotillin complex(GO:0016600) |
| 2.2 | 6.6 | GO:0005899 | insulin receptor complex(GO:0005899) |
| 2.2 | 15.5 | GO:0005664 | origin recognition complex(GO:0000808) nuclear origin of replication recognition complex(GO:0005664) |
| 2.2 | 2.2 | GO:0070993 | translation preinitiation complex(GO:0070993) |
| 2.2 | 24.1 | GO:0042581 | specific granule(GO:0042581) |
| 2.2 | 19.7 | GO:0008541 | proteasome regulatory particle, lid subcomplex(GO:0008541) |
| 2.2 | 10.9 | GO:0005642 | annulate lamellae(GO:0005642) |
| 2.2 | 8.7 | GO:0071014 | post-mRNA release spliceosomal complex(GO:0071014) |
| 2.2 | 15.2 | GO:0071556 | integral component of cytoplasmic side of endoplasmic reticulum membrane(GO:0071458) integral component of lumenal side of endoplasmic reticulum membrane(GO:0071556) lumenal side of endoplasmic reticulum membrane(GO:0098553) |
| 2.2 | 12.9 | GO:0097209 | epidermal lamellar body(GO:0097209) |
| 2.2 | 4.3 | GO:0042585 | germinal vesicle(GO:0042585) |
| 2.1 | 12.8 | GO:0032444 | activin responsive factor complex(GO:0032444) |
| 2.1 | 6.4 | GO:0033165 | interphotoreceptor matrix(GO:0033165) |
| 2.1 | 21.3 | GO:0002199 | zona pellucida receptor complex(GO:0002199) |
| 2.1 | 23.3 | GO:0017071 | intracellular cyclic nucleotide activated cation channel complex(GO:0017071) |
| 2.1 | 6.4 | GO:0044611 | nuclear pore inner ring(GO:0044611) |
| 2.1 | 14.8 | GO:0034993 | microtubule organizing center attachment site(GO:0034992) LINC complex(GO:0034993) |
| 2.1 | 8.4 | GO:1990630 | IRE1-RACK1-PP2A complex(GO:1990630) |
| 2.1 | 16.7 | GO:0097550 | transcriptional preinitiation complex(GO:0097550) |
| 2.1 | 8.4 | GO:0044614 | nuclear pore cytoplasmic filaments(GO:0044614) |
| 2.1 | 41.6 | GO:0030057 | desmosome(GO:0030057) |
| 2.1 | 6.2 | GO:0005760 | gamma DNA polymerase complex(GO:0005760) |
| 2.1 | 153.6 | GO:0045095 | keratin filament(GO:0045095) |
| 2.0 | 12.3 | GO:0030677 | nucleolar ribonuclease P complex(GO:0005655) ribonuclease P complex(GO:0030677) multimeric ribonuclease P complex(GO:0030681) |
| 2.0 | 13.9 | GO:0031415 | NatA complex(GO:0031415) |
| 2.0 | 2.0 | GO:0000798 | nuclear cohesin complex(GO:0000798) |
| 2.0 | 2.0 | GO:0020003 | symbiont-containing vacuole(GO:0020003) |
| 2.0 | 9.8 | GO:0090543 | Flemming body(GO:0090543) |
| 1.9 | 7.8 | GO:0030121 | AP-1 adaptor complex(GO:0030121) |
| 1.9 | 34.9 | GO:0005852 | eukaryotic translation initiation factor 3 complex(GO:0005852) |
| 1.9 | 34.6 | GO:0046930 | pore complex(GO:0046930) |
| 1.9 | 9.6 | GO:0005784 | Sec61 translocon complex(GO:0005784) translocon complex(GO:0071256) |
| 1.9 | 9.6 | GO:0035061 | interchromatin granule(GO:0035061) |
| 1.9 | 7.6 | GO:0045098 | type III intermediate filament(GO:0045098) |
| 1.9 | 5.7 | GO:0000438 | core TFIIH complex portion of holo TFIIH complex(GO:0000438) |
| 1.9 | 13.2 | GO:0016281 | eukaryotic translation initiation factor 4F complex(GO:0016281) |
| 1.9 | 41.1 | GO:0001891 | phagocytic cup(GO:0001891) |
| 1.9 | 5.6 | GO:0070531 | BRCA1-A complex(GO:0070531) |
| 1.8 | 59.1 | GO:0005720 | nuclear heterochromatin(GO:0005720) |
| 1.8 | 86.1 | GO:0005643 | nuclear pore(GO:0005643) |
| 1.8 | 1.8 | GO:0032807 | DNA-dependent protein kinase-DNA ligase 4 complex(GO:0005958) DNA ligase IV complex(GO:0032807) nonhomologous end joining complex(GO:0070419) |
| 1.8 | 5.3 | GO:0070421 | DNA ligase III-XRCC1 complex(GO:0070421) |
| 1.7 | 18.8 | GO:0008385 | IkappaB kinase complex(GO:0008385) |
| 1.7 | 32.5 | GO:0030056 | hemidesmosome(GO:0030056) |
| 1.7 | 6.8 | GO:0070552 | BRISC complex(GO:0070552) |
| 1.7 | 3.4 | GO:1990589 | ATF4-CREB1 transcription factor complex(GO:1990589) |
| 1.7 | 5.0 | GO:0002944 | cyclin K-CDK12 complex(GO:0002944) |
| 1.7 | 11.7 | GO:0001939 | female pronucleus(GO:0001939) |
| 1.6 | 28.9 | GO:0005689 | U12-type spliceosomal complex(GO:0005689) |
| 1.6 | 9.5 | GO:0097136 | Bcl-2 family protein complex(GO:0097136) |
| 1.6 | 1.6 | GO:0097232 | lamellar body membrane(GO:0097232) alveolar lamellar body membrane(GO:0097233) |
| 1.5 | 60.0 | GO:0016235 | aggresome(GO:0016235) |
| 1.5 | 6.1 | GO:0005675 | holo TFIIH complex(GO:0005675) |
| 1.5 | 9.2 | GO:0036194 | muscle cell projection(GO:0036194) muscle cell projection membrane(GO:0036195) |
| 1.5 | 15.2 | GO:0044754 | autolysosome(GO:0044754) |
| 1.5 | 25.9 | GO:0008250 | oligosaccharyltransferase complex(GO:0008250) |
| 1.5 | 3.0 | GO:0001651 | dense fibrillar component(GO:0001651) |
| 1.5 | 3.0 | GO:0070761 | pre-snoRNP complex(GO:0070761) |
| 1.5 | 22.2 | GO:0048188 | Set1C/COMPASS complex(GO:0048188) |
| 1.5 | 8.9 | GO:0071547 | piP-body(GO:0071547) |
| 1.5 | 4.4 | GO:0031308 | intrinsic component of nuclear outer membrane(GO:0031308) integral component of nuclear outer membrane(GO:0031309) |
| 1.5 | 2.9 | GO:0033588 | Elongator holoenzyme complex(GO:0033588) |
| 1.5 | 5.8 | GO:0033553 | rDNA heterochromatin(GO:0033553) |
| 1.4 | 10.1 | GO:0032806 | carboxy-terminal domain protein kinase complex(GO:0032806) |
| 1.4 | 5.7 | GO:0000322 | storage vacuole(GO:0000322) |
| 1.4 | 59.0 | GO:0042645 | nucleoid(GO:0009295) mitochondrial nucleoid(GO:0042645) |
| 1.4 | 11.2 | GO:0070971 | endoplasmic reticulum exit site(GO:0070971) |
| 1.4 | 4.1 | GO:0043511 | inhibin complex(GO:0043511) |
| 1.4 | 8.2 | GO:0035068 | micro-ribonucleoprotein complex(GO:0035068) |
| 1.4 | 12.2 | GO:0030688 | preribosome, small subunit precursor(GO:0030688) |
| 1.4 | 6.8 | GO:0051286 | cell tip(GO:0051286) |
| 1.3 | 32.3 | GO:0000307 | cyclin-dependent protein kinase holoenzyme complex(GO:0000307) |
| 1.3 | 14.7 | GO:0000176 | nuclear exosome (RNase complex)(GO:0000176) |
| 1.3 | 8.0 | GO:0071204 | histone pre-mRNA 3'end processing complex(GO:0071204) |
| 1.3 | 9.3 | GO:0000127 | transcription factor TFIIIC complex(GO:0000127) |
| 1.3 | 5.2 | GO:0005588 | collagen type V trimer(GO:0005588) |
| 1.3 | 14.3 | GO:0001673 | male germ cell nucleus(GO:0001673) |
| 1.3 | 5.1 | GO:0097422 | tubular endosome(GO:0097422) |
| 1.3 | 17.8 | GO:0005942 | phosphatidylinositol 3-kinase complex(GO:0005942) |
| 1.3 | 5.0 | GO:0070876 | SOSS complex(GO:0070876) |
| 1.2 | 5.0 | GO:0097413 | Lewy body(GO:0097413) |
| 1.2 | 12.4 | GO:0031528 | microvillus membrane(GO:0031528) |
| 1.2 | 8.5 | GO:0005828 | kinetochore microtubule(GO:0005828) |
| 1.2 | 15.4 | GO:0030014 | CCR4-NOT complex(GO:0030014) |
| 1.2 | 24.8 | GO:0000795 | synaptonemal complex(GO:0000795) |
| 1.2 | 4.7 | GO:0042382 | paraspeckles(GO:0042382) |
| 1.2 | 103.3 | GO:0090575 | RNA polymerase II transcription factor complex(GO:0090575) |
| 1.2 | 280.3 | GO:0005667 | transcription factor complex(GO:0005667) |
| 1.2 | 10.5 | GO:0044215 | other organism(GO:0044215) other organism cell(GO:0044216) other organism part(GO:0044217) |
| 1.2 | 2.3 | GO:0044322 | endoplasmic reticulum quality control compartment(GO:0044322) |
| 1.1 | 3.4 | GO:0043190 | ATP-binding cassette (ABC) transporter complex(GO:0043190) |
| 1.1 | 84.4 | GO:0071013 | catalytic step 2 spliceosome(GO:0071013) |
| 1.1 | 6.7 | GO:0097431 | mitotic spindle pole(GO:0097431) |
| 1.1 | 14.4 | GO:0005665 | DNA-directed RNA polymerase II, core complex(GO:0005665) |
| 1.1 | 11.1 | GO:0019013 | viral nucleocapsid(GO:0019013) |
| 1.1 | 166.1 | GO:0005840 | ribosome(GO:0005840) |
| 1.1 | 31.2 | GO:0000777 | condensed chromosome kinetochore(GO:0000777) |
| 1.1 | 4.2 | GO:0005732 | small nucleolar ribonucleoprotein complex(GO:0005732) |
| 1.0 | 15.5 | GO:0005892 | acetylcholine-gated channel complex(GO:0005892) |
| 1.0 | 4.1 | GO:0070436 | Grb2-EGFR complex(GO:0070436) |
| 1.0 | 14.0 | GO:0032039 | integrator complex(GO:0032039) |
| 1.0 | 6.0 | GO:0072687 | meiotic spindle(GO:0072687) |
| 1.0 | 4.8 | GO:0098536 | deuterosome(GO:0098536) |
| 0.9 | 67.4 | GO:0016605 | PML body(GO:0016605) |
| 0.9 | 1.9 | GO:0070937 | CRD-mediated mRNA stability complex(GO:0070937) |
| 0.9 | 0.9 | GO:0005688 | U6 snRNP(GO:0005688) |
| 0.9 | 1151.8 | GO:0005615 | extracellular space(GO:0005615) |
| 0.9 | 7.4 | GO:0031597 | cytosolic proteasome complex(GO:0031597) |
| 0.9 | 21.0 | GO:0080008 | Cul4-RING E3 ubiquitin ligase complex(GO:0080008) |
| 0.8 | 0.8 | GO:0032994 | protein-lipid complex(GO:0032994) |
| 0.8 | 5.9 | GO:0005862 | muscle thin filament tropomyosin(GO:0005862) |
| 0.8 | 8.4 | GO:0035102 | PRC1 complex(GO:0035102) |
| 0.8 | 10.9 | GO:0034518 | mRNA cap binding complex(GO:0005845) RNA cap binding complex(GO:0034518) |
| 0.8 | 14.9 | GO:0005839 | proteasome core complex(GO:0005839) |
| 0.8 | 3.9 | GO:0016442 | RISC complex(GO:0016442) RNAi effector complex(GO:0031332) |
| 0.8 | 73.0 | GO:0001669 | acrosomal vesicle(GO:0001669) |
| 0.8 | 0.8 | GO:0035577 | azurophil granule membrane(GO:0035577) |
| 0.8 | 0.8 | GO:0000346 | transcription export complex(GO:0000346) |
| 0.7 | 4.4 | GO:0030877 | beta-catenin destruction complex(GO:0030877) |
| 0.7 | 7.1 | GO:0016580 | Sin3 complex(GO:0016580) |
| 0.7 | 8.5 | GO:0030670 | phagocytic vesicle membrane(GO:0030670) |
| 0.7 | 3.5 | GO:0061617 | MICOS complex(GO:0061617) |
| 0.7 | 37.4 | GO:0000781 | chromosome, telomeric region(GO:0000781) |
| 0.7 | 72.1 | GO:0001650 | fibrillar center(GO:0001650) |
| 0.6 | 13.3 | GO:0000152 | nuclear ubiquitin ligase complex(GO:0000152) |
| 0.6 | 1.9 | GO:0072487 | MSL complex(GO:0072487) |
| 0.6 | 35.1 | GO:0000932 | cytoplasmic mRNA processing body(GO:0000932) |
| 0.6 | 1.8 | GO:0005940 | septin ring(GO:0005940) septin collar(GO:0032173) |
| 0.6 | 3.0 | GO:1903767 | sweet taste receptor complex(GO:1903767) taste receptor complex(GO:1903768) |
| 0.6 | 8.8 | GO:0005849 | mRNA cleavage factor complex(GO:0005849) |
| 0.6 | 4.7 | GO:0000235 | astral microtubule(GO:0000235) aster(GO:0005818) |
| 0.6 | 30.0 | GO:0005788 | endoplasmic reticulum lumen(GO:0005788) |
| 0.6 | 1.1 | GO:1990622 | CHOP-ATF3 complex(GO:1990622) |
| 0.6 | 4.5 | GO:0005786 | signal recognition particle, endoplasmic reticulum targeting(GO:0005786) |
| 0.5 | 3.6 | GO:1990316 | ATG1/ULK1 kinase complex(GO:1990316) |
| 0.5 | 1.0 | GO:0030663 | COPI-coated vesicle membrane(GO:0030663) |
| 0.5 | 5.3 | GO:0044453 | integral component of nuclear inner membrane(GO:0005639) intrinsic component of nuclear inner membrane(GO:0031229) nuclear membrane part(GO:0044453) |
| 0.5 | 23.5 | GO:0000775 | chromosome, centromeric region(GO:0000775) |
| 0.5 | 1.4 | GO:0031074 | nucleocytoplasmic shuttling complex(GO:0031074) |
| 0.5 | 1.8 | GO:0071817 | MMXD complex(GO:0071817) |
| 0.5 | 0.9 | GO:0031510 | SUMO activating enzyme complex(GO:0031510) |
| 0.4 | 1.3 | GO:0005749 | mitochondrial respiratory chain complex II, succinate dehydrogenase complex (ubiquinone)(GO:0005749) succinate dehydrogenase complex (ubiquinone)(GO:0045257) fumarate reductase complex(GO:0045283) |
| 0.4 | 0.9 | GO:1990429 | Pex17p-Pex14p docking complex(GO:1990415) peroxisomal importomer complex(GO:1990429) |
| 0.4 | 2.6 | GO:0005638 | lamin filament(GO:0005638) |
| 0.4 | 0.9 | GO:0036117 | hyaluranon cable(GO:0036117) |
| 0.4 | 5.6 | GO:0030126 | COPI vesicle coat(GO:0030126) |
| 0.4 | 1.3 | GO:0030891 | VCB complex(GO:0030891) |
| 0.4 | 292.9 | GO:0042175 | nuclear outer membrane-endoplasmic reticulum membrane network(GO:0042175) |
| 0.4 | 4.4 | GO:0071564 | npBAF complex(GO:0071564) |
| 0.4 | 0.8 | GO:0048476 | Holliday junction resolvase complex(GO:0048476) |
| 0.4 | 1.9 | GO:0043527 | tRNA methyltransferase complex(GO:0043527) |
| 0.4 | 20.3 | GO:0016363 | nuclear matrix(GO:0016363) |
| 0.4 | 1.5 | GO:0031417 | NatC complex(GO:0031417) |
| 0.4 | 0.8 | GO:0099524 | region of cytosol(GO:0099522) postsynaptic cytosol(GO:0099524) |
| 0.4 | 4.5 | GO:0005861 | troponin complex(GO:0005861) |
| 0.4 | 12.2 | GO:0008023 | transcription elongation factor complex(GO:0008023) |
| 0.4 | 1.1 | GO:0005960 | glycine cleavage complex(GO:0005960) |
| 0.4 | 16.2 | GO:0005778 | peroxisomal membrane(GO:0005778) microbody membrane(GO:0031903) |
| 0.4 | 2.9 | GO:0000812 | Swr1 complex(GO:0000812) |
| 0.4 | 1.4 | GO:0045120 | pronucleus(GO:0045120) |
| 0.4 | 2.8 | GO:0035631 | CD40 receptor complex(GO:0035631) |
| 0.3 | 0.7 | GO:0035355 | Toll-like receptor 2-Toll-like receptor 6 protein complex(GO:0035355) |
| 0.3 | 9.0 | GO:0000502 | proteasome complex(GO:0000502) |
| 0.3 | 2.6 | GO:0035098 | ESC/E(Z) complex(GO:0035098) |
| 0.3 | 2.2 | GO:0097504 | Gemini of coiled bodies(GO:0097504) |
| 0.3 | 4.4 | GO:0051233 | spindle midzone(GO:0051233) |
| 0.3 | 1.2 | GO:0033503 | HULC complex(GO:0033503) |
| 0.3 | 1.7 | GO:1990635 | proximal dendrite(GO:1990635) |
| 0.3 | 5.8 | GO:0005844 | polysome(GO:0005844) |
| 0.3 | 2.7 | GO:0070652 | HAUS complex(GO:0070652) |
| 0.2 | 3.2 | GO:0031519 | PcG protein complex(GO:0031519) |
| 0.2 | 9.7 | GO:0005811 | lipid particle(GO:0005811) |
| 0.2 | 1.3 | GO:0045179 | apical cortex(GO:0045179) |
| 0.2 | 0.7 | GO:0035748 | myelin sheath abaxonal region(GO:0035748) |
| 0.2 | 5.6 | GO:0030173 | integral component of Golgi membrane(GO:0030173) |
| 0.2 | 4.3 | GO:0015030 | Cajal body(GO:0015030) |
| 0.2 | 4.6 | GO:0005793 | endoplasmic reticulum-Golgi intermediate compartment(GO:0005793) |
| 0.2 | 1.0 | GO:0000792 | heterochromatin(GO:0000792) |
| 0.2 | 1.1 | GO:0071986 | Ragulator complex(GO:0071986) |
| 0.1 | 0.4 | GO:0061689 | tricellular tight junction(GO:0061689) |
| 0.1 | 0.5 | GO:0042719 | mitochondrial intermembrane space protein transporter complex(GO:0042719) |
| 0.1 | 1.3 | GO:0005666 | DNA-directed RNA polymerase III complex(GO:0005666) |
| 0.1 | 0.3 | GO:0044233 | ER-mitochondrion membrane contact site(GO:0044233) |
| 0.1 | 0.6 | GO:0005879 | axonemal microtubule(GO:0005879) |
| 0.1 | 0.6 | GO:0000813 | ESCRT I complex(GO:0000813) |
| 0.1 | 0.3 | GO:0030289 | protein phosphatase 4 complex(GO:0030289) |
| 0.0 | 0.2 | GO:0000178 | exosome (RNase complex)(GO:0000178) |
| 0.0 | 0.4 | GO:0005750 | mitochondrial respiratory chain complex III(GO:0005750) |
Gene overrepresentation in molecular function category:
| Log-likelihood per target | Total log-likelihood | Term | Description |
|---|---|---|---|
| 66.9 | 200.6 | GO:0004556 | alpha-amylase activity(GO:0004556) |
| 33.3 | 166.6 | GO:0070892 | lipoteichoic acid receptor activity(GO:0070892) |
| 27.5 | 82.5 | GO:0031735 | CCR10 chemokine receptor binding(GO:0031735) |
| 26.3 | 105.1 | GO:0048248 | CXCR3 chemokine receptor binding(GO:0048248) |
| 25.2 | 75.6 | GO:0070653 | high-density lipoprotein particle receptor binding(GO:0070653) |
| 21.6 | 64.7 | GO:0004522 | ribonuclease A activity(GO:0004522) |
| 20.6 | 123.8 | GO:0019976 | interleukin-2 binding(GO:0019976) |
| 20.6 | 102.8 | GO:0043120 | tumor necrosis factor binding(GO:0043120) |
| 19.4 | 58.3 | GO:0031721 | hemoglobin alpha binding(GO:0031721) |
| 19.1 | 57.4 | GO:0004704 | NF-kappaB-inducing kinase activity(GO:0004704) |
| 18.1 | 108.6 | GO:0042289 | MHC class II protein binding(GO:0042289) |
| 17.5 | 525.2 | GO:0008392 | arachidonic acid epoxygenase activity(GO:0008392) |
| 17.5 | 70.0 | GO:0019763 | immunoglobulin receptor activity(GO:0019763) |
| 17.4 | 52.1 | GO:0016823 | hydrolase activity, acting on acid carbon-carbon bonds(GO:0016822) hydrolase activity, acting on acid carbon-carbon bonds, in ketonic substances(GO:0016823) |
| 17.4 | 52.1 | GO:0003953 | NAD+ nucleosidase activity(GO:0003953) |
| 17.2 | 51.5 | GO:0047787 | delta4-3-oxosteroid 5beta-reductase activity(GO:0047787) |
| 17.0 | 68.0 | GO:0003918 | DNA topoisomerase type II (ATP-hydrolyzing) activity(GO:0003918) DNA topoisomerase II activity(GO:0061505) |
| 16.4 | 49.1 | GO:0047023 | androsterone dehydrogenase activity(GO:0047023) |
| 15.6 | 483.8 | GO:0015020 | glucuronosyltransferase activity(GO:0015020) |
| 15.2 | 91.1 | GO:0019767 | IgE receptor activity(GO:0019767) |
| 15.0 | 60.1 | GO:0045159 | myosin II binding(GO:0045159) |
| 14.8 | 44.5 | GO:0004833 | tryptophan 2,3-dioxygenase activity(GO:0004833) |
| 14.3 | 358.2 | GO:0042288 | MHC class I protein binding(GO:0042288) |
| 13.7 | 13.7 | GO:0015038 | glutathione disulfide oxidoreductase activity(GO:0015038) |
| 13.5 | 67.6 | GO:0019862 | IgA binding(GO:0019862) |
| 13.4 | 120.6 | GO:0019198 | transmembrane receptor protein tyrosine phosphatase activity(GO:0005001) transmembrane receptor protein phosphatase activity(GO:0019198) |
| 12.5 | 75.0 | GO:0031726 | CCR1 chemokine receptor binding(GO:0031726) |
| 12.4 | 74.5 | GO:0035662 | Toll-like receptor 4 binding(GO:0035662) |
| 12.1 | 36.3 | GO:0019863 | IgE binding(GO:0019863) |
| 11.5 | 46.1 | GO:0005136 | interleukin-4 receptor binding(GO:0005136) |
| 11.5 | 34.6 | GO:0004566 | beta-glucuronidase activity(GO:0004566) |
| 11.3 | 33.8 | GO:0004478 | methionine adenosyltransferase activity(GO:0004478) |
| 11.3 | 11.3 | GO:0004069 | L-aspartate:2-oxoglutarate aminotransferase activity(GO:0004069) |
| 11.2 | 89.6 | GO:0003996 | acyl-CoA ligase activity(GO:0003996) |
| 11.1 | 44.4 | GO:0030345 | extracellular matrix structural constituent conferring compression resistance(GO:0030021) structural constituent of tooth enamel(GO:0030345) |
| 11.0 | 44.1 | GO:0016716 | oxidoreductase activity, acting on paired donors, with incorporation or reduction of molecular oxygen, another compound as one donor, and incorporation of one atom of oxygen(GO:0016716) |
| 11.0 | 32.9 | GO:0019115 | all-trans retinal binding(GO:0005503) benzaldehyde dehydrogenase activity(GO:0019115) S-(hydroxymethyl)glutathione dehydrogenase activity(GO:0051903) |
| 10.8 | 43.2 | GO:0042287 | MHC protein binding(GO:0042287) |
| 10.7 | 43.0 | GO:0031493 | nucleosomal histone binding(GO:0031493) |
| 10.7 | 106.7 | GO:1901702 | urate transmembrane transporter activity(GO:0015143) salt transmembrane transporter activity(GO:1901702) |
| 10.5 | 116.0 | GO:0055102 | lipase inhibitor activity(GO:0055102) |
| 10.5 | 31.5 | GO:0001069 | regulatory region RNA binding(GO:0001069) |
| 10.4 | 72.9 | GO:0019238 | cyclohydrolase activity(GO:0019238) |
| 10.1 | 100.7 | GO:0019957 | C-C chemokine binding(GO:0019957) |
| 9.7 | 67.6 | GO:0035375 | zymogen binding(GO:0035375) |
| 9.6 | 28.8 | GO:0008481 | sphinganine kinase activity(GO:0008481) |
| 9.5 | 28.6 | GO:0004060 | arylamine N-acetyltransferase activity(GO:0004060) |
| 9.4 | 28.3 | GO:0015322 | proton-dependent oligopeptide secondary active transmembrane transporter activity(GO:0005427) secondary active oligopeptide transmembrane transporter activity(GO:0015322) |
| 9.3 | 37.4 | GO:0004687 | myosin light chain kinase activity(GO:0004687) |
| 9.3 | 37.2 | GO:0044378 | non-sequence-specific DNA binding, bending(GO:0044378) |
| 9.3 | 120.7 | GO:1990405 | protein antigen binding(GO:1990405) |
| 9.0 | 36.1 | GO:0047619 | acylcarnitine hydrolase activity(GO:0047619) |
| 9.0 | 17.9 | GO:0031720 | haptoglobin binding(GO:0031720) |
| 8.8 | 44.0 | GO:1990932 | 5.8S rRNA binding(GO:1990932) |
| 8.7 | 8.7 | GO:0042296 | ISG15 transferase activity(GO:0042296) |
| 8.7 | 34.8 | GO:0005415 | nucleoside:sodium symporter activity(GO:0005415) |
| 8.7 | 43.5 | GO:0005550 | pheromone binding(GO:0005550) |
| 8.6 | 34.6 | GO:0008309 | double-stranded DNA exodeoxyribonuclease activity(GO:0008309) |
| 8.6 | 25.9 | GO:0042806 | fucose binding(GO:0042806) |
| 8.6 | 42.8 | GO:0004854 | xanthine dehydrogenase activity(GO:0004854) oxidoreductase activity, acting on CH or CH2 groups, NAD or NADP as acceptor(GO:0016726) |
| 8.5 | 25.6 | GO:0004464 | leukotriene-C4 synthase activity(GO:0004464) |
| 8.5 | 67.7 | GO:0032052 | bile acid binding(GO:0032052) |
| 8.3 | 58.2 | GO:0001849 | complement component C1q binding(GO:0001849) |
| 8.2 | 73.4 | GO:0047498 | calcium-dependent phospholipase A2 activity(GO:0047498) |
| 8.2 | 48.9 | GO:0047961 | glycine N-acyltransferase activity(GO:0047961) |
| 7.9 | 23.8 | GO:0051734 | ATP-dependent polydeoxyribonucleotide 5'-hydroxyl-kinase activity(GO:0046404) polydeoxyribonucleotide kinase activity(GO:0051733) ATP-dependent polynucleotide kinase activity(GO:0051734) |
| 7.9 | 158.2 | GO:0005537 | mannose binding(GO:0005537) |
| 7.9 | 94.8 | GO:0001848 | complement binding(GO:0001848) |
| 7.8 | 38.8 | GO:0071987 | WD40-repeat domain binding(GO:0071987) |
| 7.8 | 23.3 | GO:0047757 | chondroitin-glucuronate 5-epimerase activity(GO:0047757) |
| 7.8 | 62.1 | GO:0004908 | interleukin-1 receptor activity(GO:0004908) |
| 7.5 | 30.1 | GO:0016019 | peptidoglycan receptor activity(GO:0016019) |
| 7.5 | 60.0 | GO:0016494 | C-X-C chemokine receptor activity(GO:0016494) |
| 7.3 | 29.4 | GO:0004771 | sterol esterase activity(GO:0004771) |
| 7.3 | 36.6 | GO:0004974 | leukotriene receptor activity(GO:0004974) |
| 7.3 | 29.1 | GO:0000829 | inositol heptakisphosphate kinase activity(GO:0000829) |
| 7.2 | 14.4 | GO:0004743 | pyruvate kinase activity(GO:0004743) |
| 7.2 | 28.8 | GO:0004027 | alcohol sulfotransferase activity(GO:0004027) |
| 7.1 | 7.1 | GO:0050294 | steroid sulfotransferase activity(GO:0050294) |
| 7.1 | 91.7 | GO:0097200 | cysteine-type endopeptidase activity involved in execution phase of apoptosis(GO:0097200) |
| 7.0 | 41.9 | GO:0032554 | purine deoxyribonucleotide binding(GO:0032554) |
| 6.9 | 83.2 | GO:0048406 | nerve growth factor binding(GO:0048406) |
| 6.9 | 13.9 | GO:0050051 | leukotriene-B4 20-monooxygenase activity(GO:0050051) tocopherol omega-hydroxylase activity(GO:0052870) alpha-tocopherol omega-hydroxylase activity(GO:0052871) |
| 6.9 | 41.3 | GO:0071723 | lipopeptide binding(GO:0071723) |
| 6.8 | 47.4 | GO:0003956 | NAD(P)+-protein-arginine ADP-ribosyltransferase activity(GO:0003956) |
| 6.7 | 26.9 | GO:0015057 | thrombin receptor activity(GO:0015057) |
| 6.7 | 26.8 | GO:0001225 | RNA polymerase II transcription coactivator binding(GO:0001225) |
| 6.7 | 20.0 | GO:0080130 | L-phenylalanine:2-oxoglutarate aminotransferase activity(GO:0080130) |
| 6.7 | 746.6 | GO:0004867 | serine-type endopeptidase inhibitor activity(GO:0004867) |
| 6.7 | 20.0 | GO:0019961 | interferon binding(GO:0019961) |
| 6.6 | 6.6 | GO:0016532 | superoxide dismutase copper chaperone activity(GO:0016532) |
| 6.6 | 46.2 | GO:0016899 | oxidoreductase activity, acting on the CH-OH group of donors, oxygen as acceptor(GO:0016899) |
| 6.5 | 71.8 | GO:0008131 | primary amine oxidase activity(GO:0008131) |
| 6.5 | 117.3 | GO:0005149 | interleukin-1 receptor binding(GO:0005149) |
| 6.4 | 45.0 | GO:0051575 | 5'-deoxyribose-5-phosphate lyase activity(GO:0051575) |
| 6.4 | 44.8 | GO:0003896 | DNA primase activity(GO:0003896) |
| 6.3 | 100.8 | GO:0019825 | oxygen binding(GO:0019825) |
| 6.3 | 1372.1 | GO:0004252 | serine-type endopeptidase activity(GO:0004252) |
| 6.3 | 62.9 | GO:0004950 | chemokine receptor activity(GO:0004950) |
| 6.3 | 43.9 | GO:0033300 | dehydroascorbic acid transporter activity(GO:0033300) |
| 6.3 | 18.8 | GO:0034988 | Fc-gamma receptor I complex binding(GO:0034988) |
| 6.2 | 458.9 | GO:0003823 | antigen binding(GO:0003823) |
| 6.2 | 43.3 | GO:0016812 | hydrolase activity, acting on carbon-nitrogen (but not peptide) bonds, in cyclic amides(GO:0016812) |
| 6.2 | 6.2 | GO:0004645 | phosphorylase activity(GO:0004645) |
| 6.2 | 36.9 | GO:0034647 | histone demethylase activity (H3-trimethyl-K4 specific)(GO:0034647) |
| 6.0 | 30.2 | GO:0016841 | ammonia-lyase activity(GO:0016841) |
| 6.0 | 30.2 | GO:0008453 | alanine-glyoxylate transaminase activity(GO:0008453) |
| 6.0 | 30.2 | GO:0005134 | interleukin-2 receptor binding(GO:0005134) |
| 6.0 | 23.8 | GO:0004967 | glucagon receptor activity(GO:0004967) |
| 5.9 | 11.8 | GO:0019166 | trans-2-enoyl-CoA reductase (NADPH) activity(GO:0019166) |
| 5.9 | 17.7 | GO:0071208 | histone pre-mRNA DCP binding(GO:0071208) |
| 5.9 | 64.6 | GO:0070513 | death domain binding(GO:0070513) |
| 5.9 | 17.6 | GO:0004392 | heme oxygenase (decyclizing) activity(GO:0004392) |
| 5.7 | 17.0 | GO:0005157 | macrophage colony-stimulating factor receptor binding(GO:0005157) |
| 5.6 | 16.8 | GO:0016414 | carnitine O-octanoyltransferase activity(GO:0008458) O-octanoyltransferase activity(GO:0016414) |
| 5.5 | 27.5 | GO:0070087 | chromo shadow domain binding(GO:0070087) |
| 5.5 | 44.0 | GO:0045545 | syndecan binding(GO:0045545) |
| 5.5 | 71.4 | GO:0008097 | 5S rRNA binding(GO:0008097) |
| 5.5 | 16.5 | GO:0030626 | U12 snRNA binding(GO:0030626) |
| 5.5 | 27.3 | GO:0008310 | single-stranded DNA 3'-5' exodeoxyribonuclease activity(GO:0008310) |
| 5.4 | 10.8 | GO:0036310 | annealing helicase activity(GO:0036310) |
| 5.4 | 194.0 | GO:0005044 | scavenger receptor activity(GO:0005044) |
| 5.4 | 5.4 | GO:0018685 | alkane 1-monooxygenase activity(GO:0018685) |
| 5.3 | 21.4 | GO:0005534 | galactose binding(GO:0005534) |
| 5.3 | 132.7 | GO:0070330 | aromatase activity(GO:0070330) |
| 5.3 | 21.1 | GO:0004903 | growth hormone receptor activity(GO:0004903) |
| 5.3 | 15.8 | GO:0016263 | glycoprotein-N-acetylgalactosamine 3-beta-galactosyltransferase activity(GO:0016263) |
| 5.3 | 31.5 | GO:0008508 | bile acid:sodium symporter activity(GO:0008508) |
| 5.2 | 78.4 | GO:0016303 | 1-phosphatidylinositol-3-kinase activity(GO:0016303) |
| 5.2 | 196.3 | GO:0005164 | tumor necrosis factor receptor binding(GO:0005164) |
| 5.1 | 5.1 | GO:0045340 | mercury ion binding(GO:0045340) |
| 5.1 | 25.4 | GO:0070180 | large ribosomal subunit rRNA binding(GO:0070180) |
| 5.1 | 10.2 | GO:0055104 | ligase inhibitor activity(GO:0055104) ubiquitin ligase inhibitor activity(GO:1990948) |
| 5.1 | 5.1 | GO:0008745 | N-acetylmuramoyl-L-alanine amidase activity(GO:0008745) |
| 5.0 | 5.0 | GO:0004040 | amidase activity(GO:0004040) |
| 5.0 | 10.0 | GO:0008297 | single-stranded DNA exodeoxyribonuclease activity(GO:0008297) |
| 5.0 | 39.7 | GO:0030292 | protein tyrosine kinase inhibitor activity(GO:0030292) |
| 5.0 | 34.7 | GO:0004064 | arylesterase activity(GO:0004064) |
| 5.0 | 29.7 | GO:0019103 | pyrimidine nucleotide binding(GO:0019103) |
| 5.0 | 14.9 | GO:0070835 | cadmium ion transmembrane transporter activity(GO:0015086) lead ion transmembrane transporter activity(GO:0015094) nickel cation transmembrane transporter activity(GO:0015099) vanadium ion transmembrane transporter activity(GO:0015100) ferrous iron uptake transmembrane transporter activity(GO:0015639) chromium ion transmembrane transporter activity(GO:0070835) |
| 4.9 | 14.8 | GO:0008142 | oxysterol binding(GO:0008142) |
| 4.9 | 24.7 | GO:0005138 | interleukin-6 receptor binding(GO:0005138) |
| 4.9 | 19.7 | GO:0001226 | RNA polymerase II transcription corepressor binding(GO:0001226) |
| 4.9 | 44.0 | GO:0016174 | NAD(P)H oxidase activity(GO:0016174) |
| 4.9 | 29.3 | GO:0015093 | ferrous iron transmembrane transporter activity(GO:0015093) |
| 4.9 | 19.5 | GO:0005143 | interleukin-12 receptor binding(GO:0005143) |
| 4.8 | 14.5 | GO:0000991 | transcription factor activity, core RNA polymerase II binding(GO:0000991) |
| 4.8 | 14.5 | GO:0016508 | long-chain-enoyl-CoA hydratase activity(GO:0016508) |
| 4.7 | 14.2 | GO:0032810 | sterol response element binding(GO:0032810) |
| 4.7 | 4.7 | GO:0016623 | aldehyde oxidase activity(GO:0004031) oxidoreductase activity, acting on the aldehyde or oxo group of donors, oxygen as acceptor(GO:0016623) |
| 4.7 | 9.4 | GO:0008384 | IkappaB kinase activity(GO:0008384) |
| 4.6 | 9.3 | GO:0005381 | iron ion transmembrane transporter activity(GO:0005381) |
| 4.6 | 9.2 | GO:0031727 | CCR2 chemokine receptor binding(GO:0031727) |
| 4.6 | 13.7 | GO:0031762 | follicle-stimulating hormone receptor binding(GO:0031762) |
| 4.6 | 22.9 | GO:0004008 | copper-exporting ATPase activity(GO:0004008) copper-transporting ATPase activity(GO:0043682) |
| 4.5 | 13.6 | GO:0001099 | basal transcription machinery binding(GO:0001098) basal RNA polymerase II transcription machinery binding(GO:0001099) |
| 4.5 | 36.1 | GO:0004875 | complement receptor activity(GO:0004875) |
| 4.5 | 67.3 | GO:0005035 | tumor necrosis factor-activated receptor activity(GO:0005031) death receptor activity(GO:0005035) |
| 4.5 | 4.5 | GO:0060230 | lipoprotein lipase activator activity(GO:0060230) |
| 4.5 | 8.9 | GO:0034185 | apolipoprotein binding(GO:0034185) |
| 4.4 | 13.3 | GO:0004852 | uroporphyrinogen-III synthase activity(GO:0004852) |
| 4.4 | 13.3 | GO:0004924 | oncostatin-M receptor activity(GO:0004924) |
| 4.4 | 8.8 | GO:0034987 | immunoglobulin receptor binding(GO:0034987) |
| 4.4 | 17.6 | GO:0005131 | growth hormone receptor binding(GO:0005131) |
| 4.4 | 30.7 | GO:1990446 | U1 snRNP binding(GO:1990446) |
| 4.4 | 8.8 | GO:0045236 | CXCR chemokine receptor binding(GO:0045236) |
| 4.3 | 17.2 | GO:0016712 | oxidoreductase activity, acting on paired donors, with incorporation or reduction of molecular oxygen, reduced flavin or flavoprotein as one donor, and incorporation of one atom of oxygen(GO:0016712) |
| 4.3 | 21.4 | GO:0005384 | manganese ion transmembrane transporter activity(GO:0005384) |
| 4.3 | 8.5 | GO:0008732 | threonine aldolase activity(GO:0004793) L-allo-threonine aldolase activity(GO:0008732) |
| 4.2 | 12.7 | GO:0035403 | histone kinase activity (H3-T6 specific)(GO:0035403) |
| 4.2 | 16.9 | GO:0016647 | oxidoreductase activity, acting on the CH-NH group of donors, oxygen as acceptor(GO:0016647) |
| 4.2 | 29.1 | GO:0015526 | hexose phosphate transmembrane transporter activity(GO:0015119) organophosphate:inorganic phosphate antiporter activity(GO:0015315) hexose-phosphate:inorganic phosphate antiporter activity(GO:0015526) glucose 6-phosphate:inorganic phosphate antiporter activity(GO:0061513) |
| 4.1 | 53.4 | GO:0016889 | endodeoxyribonuclease activity, producing 3'-phosphomonoesters(GO:0016889) |
| 4.1 | 16.4 | GO:0004514 | nicotinate-nucleotide diphosphorylase (carboxylating) activity(GO:0004514) |
| 4.1 | 24.5 | GO:0015037 | peptide disulfide oxidoreductase activity(GO:0015037) |
| 4.1 | 8.1 | GO:0004651 | polynucleotide 5'-phosphatase activity(GO:0004651) |
| 4.1 | 1098.8 | GO:0030246 | carbohydrate binding(GO:0030246) |
| 4.1 | 8.1 | GO:0008296 | 3'-5'-exodeoxyribonuclease activity(GO:0008296) |
| 4.0 | 24.2 | GO:0008429 | phosphatidylethanolamine binding(GO:0008429) |
| 4.0 | 56.5 | GO:0008301 | DNA binding, bending(GO:0008301) |
| 4.0 | 12.0 | GO:0000403 | Y-form DNA binding(GO:0000403) |
| 4.0 | 20.0 | GO:0005052 | peroxisome matrix targeting signal-1 binding(GO:0005052) |
| 4.0 | 15.9 | GO:0005087 | Ran guanyl-nucleotide exchange factor activity(GO:0005087) |
| 4.0 | 8.0 | GO:0031893 | vasopressin receptor binding(GO:0031893) |
| 3.9 | 31.6 | GO:0001162 | RNA polymerase II intronic transcription regulatory region sequence-specific DNA binding(GO:0001162) |
| 3.9 | 19.7 | GO:0047035 | testosterone dehydrogenase (NAD+) activity(GO:0047035) |
| 3.9 | 11.7 | GO:0009384 | N-acylmannosamine kinase activity(GO:0009384) |
| 3.9 | 27.3 | GO:0030151 | molybdenum ion binding(GO:0030151) |
| 3.9 | 23.2 | GO:0035650 | AP-1 adaptor complex binding(GO:0035650) |
| 3.9 | 15.5 | GO:0004052 | arachidonate 12-lipoxygenase activity(GO:0004052) |
| 3.8 | 49.9 | GO:0045125 | bioactive lipid receptor activity(GO:0045125) |
| 3.8 | 15.1 | GO:0031683 | G-protein beta/gamma-subunit complex binding(GO:0031683) |
| 3.8 | 959.4 | GO:0003735 | structural constituent of ribosome(GO:0003735) |
| 3.8 | 18.8 | GO:0016728 | ribonucleoside-diphosphate reductase activity, thioredoxin disulfide as acceptor(GO:0004748) oxidoreductase activity, acting on CH or CH2 groups, disulfide as acceptor(GO:0016728) ribonucleoside-diphosphate reductase activity(GO:0061731) |
| 3.7 | 3.7 | GO:0005345 | purine nucleobase transmembrane transporter activity(GO:0005345) pyrimidine nucleobase transmembrane transporter activity(GO:0005350) nucleobase transmembrane transporter activity(GO:0015205) |
| 3.7 | 14.9 | GO:0070568 | guanylyltransferase activity(GO:0070568) |
| 3.7 | 25.9 | GO:0043423 | 3-phosphoinositide-dependent protein kinase binding(GO:0043423) |
| 3.7 | 22.1 | GO:0005332 | gamma-aminobutyric acid:sodium symporter activity(GO:0005332) |
| 3.7 | 51.1 | GO:0043142 | single-stranded DNA-dependent ATPase activity(GO:0043142) |
| 3.6 | 65.6 | GO:0003950 | NAD+ ADP-ribosyltransferase activity(GO:0003950) |
| 3.6 | 21.7 | GO:0009008 | DNA-methyltransferase activity(GO:0009008) |
| 3.6 | 17.9 | GO:0001054 | RNA polymerase I activity(GO:0001054) |
| 3.5 | 21.2 | GO:0042500 | aspartic endopeptidase activity, intramembrane cleaving(GO:0042500) |
| 3.5 | 10.5 | GO:0015199 | amino-acid betaine transmembrane transporter activity(GO:0015199) carnitine transmembrane transporter activity(GO:0015226) |
| 3.4 | 20.6 | GO:0004468 | lysine N-acetyltransferase activity, acting on acetyl phosphate as donor(GO:0004468) |
| 3.4 | 13.7 | GO:0042608 | T cell receptor binding(GO:0042608) |
| 3.4 | 54.5 | GO:0008199 | ferric iron binding(GO:0008199) |
| 3.4 | 27.2 | GO:0019864 | IgG binding(GO:0019864) |
| 3.4 | 10.2 | GO:0004809 | tRNA (guanine-N2-)-methyltransferase activity(GO:0004809) |
| 3.4 | 37.3 | GO:0016886 | ligase activity, forming phosphoric ester bonds(GO:0016886) |
| 3.4 | 16.9 | GO:0034191 | apolipoprotein A-I receptor binding(GO:0034191) |
| 3.4 | 13.5 | GO:0004920 | interleukin-10 receptor activity(GO:0004920) |
| 3.3 | 20.0 | GO:0016724 | ferroxidase activity(GO:0004322) oxidoreductase activity, oxidizing metal ions, oxygen as acceptor(GO:0016724) |
| 3.3 | 55.4 | GO:0043295 | glutathione binding(GO:0043295) |
| 3.3 | 9.8 | GO:0004536 | deoxyribonuclease activity(GO:0004536) |
| 3.2 | 6.5 | GO:0046977 | TAP binding(GO:0046977) TAP1 binding(GO:0046978) TAP2 binding(GO:0046979) |
| 3.2 | 29.2 | GO:0015232 | heme transporter activity(GO:0015232) |
| 3.2 | 22.6 | GO:0005068 | transmembrane receptor protein tyrosine kinase adaptor activity(GO:0005068) |
| 3.2 | 54.8 | GO:0004745 | retinol dehydrogenase activity(GO:0004745) |
| 3.2 | 16.1 | GO:0061676 | importin-alpha family protein binding(GO:0061676) |
| 3.1 | 12.5 | GO:0030350 | iron-responsive element binding(GO:0030350) |
| 3.1 | 24.9 | GO:0001055 | RNA polymerase II activity(GO:0001055) |
| 3.1 | 24.9 | GO:0016505 | peptidase activator activity involved in apoptotic process(GO:0016505) |
| 3.1 | 9.3 | GO:0050265 | RNA uridylyltransferase activity(GO:0050265) |
| 3.1 | 3.1 | GO:0004519 | endonuclease activity(GO:0004519) |
| 3.1 | 33.9 | GO:0015924 | mannosyl-oligosaccharide 1,2-alpha-mannosidase activity(GO:0004571) mannosyl-oligosaccharide mannosidase activity(GO:0015924) |
| 3.1 | 55.1 | GO:0048027 | mRNA 5'-UTR binding(GO:0048027) |
| 3.1 | 58.2 | GO:0008353 | RNA polymerase II carboxy-terminal domain kinase activity(GO:0008353) |
| 3.0 | 6.1 | GO:0002060 | purine nucleobase binding(GO:0002060) |
| 3.0 | 9.1 | GO:1903924 | estradiol binding(GO:1903924) |
| 3.0 | 12.0 | GO:0097100 | supercoiled DNA binding(GO:0097100) |
| 3.0 | 9.0 | GO:0017113 | uracil binding(GO:0002058) pyrimidine nucleobase binding(GO:0002061) dihydrouracil dehydrogenase (NAD+) activity(GO:0004159) dihydropyrimidine dehydrogenase (NADP+) activity(GO:0017113) |
| 3.0 | 60.0 | GO:0017127 | cholesterol transporter activity(GO:0017127) |
| 3.0 | 119.7 | GO:0001205 | transcriptional activator activity, RNA polymerase II distal enhancer sequence-specific binding(GO:0001205) |
| 3.0 | 12.0 | GO:0047276 | N-acetyllactosaminide 3-alpha-galactosyltransferase activity(GO:0047276) |
| 3.0 | 6.0 | GO:0070012 | oligopeptidase activity(GO:0070012) |
| 3.0 | 47.5 | GO:0008574 | ATP-dependent microtubule motor activity, plus-end-directed(GO:0008574) |
| 3.0 | 26.7 | GO:0043515 | kinetochore binding(GO:0043515) |
| 3.0 | 11.8 | GO:0030280 | structural constituent of epidermis(GO:0030280) |
| 2.9 | 20.6 | GO:0016634 | oxidoreductase activity, acting on the CH-CH group of donors, oxygen as acceptor(GO:0016634) |
| 2.9 | 14.7 | GO:0051864 | histone demethylase activity (H3-K36 specific)(GO:0051864) |
| 2.9 | 8.8 | GO:0034057 | RNA strand-exchange activity(GO:0034057) |
| 2.9 | 5.9 | GO:0046974 | histone methyltransferase activity (H3-K9 specific)(GO:0046974) |
| 2.9 | 8.7 | GO:0042134 | rRNA primary transcript binding(GO:0042134) |
| 2.9 | 11.5 | GO:0016802 | adenosylhomocysteinase activity(GO:0004013) trialkylsulfonium hydrolase activity(GO:0016802) |
| 2.9 | 17.3 | GO:0042954 | lipoprotein transporter activity(GO:0042954) |
| 2.9 | 20.1 | GO:0008432 | JUN kinase binding(GO:0008432) |
| 2.9 | 8.6 | GO:0004046 | aminoacylase activity(GO:0004046) |
| 2.8 | 2.8 | GO:0032405 | MutLalpha complex binding(GO:0032405) |
| 2.8 | 14.0 | GO:1990226 | histone methyltransferase binding(GO:1990226) |
| 2.8 | 5.6 | GO:0033592 | RNA strand annealing activity(GO:0033592) |
| 2.8 | 27.7 | GO:0004526 | ribonuclease P activity(GO:0004526) |
| 2.7 | 46.4 | GO:0001594 | trace-amine receptor activity(GO:0001594) |
| 2.7 | 5.5 | GO:0031686 | A1 adenosine receptor binding(GO:0031686) |
| 2.7 | 27.3 | GO:0008061 | chitin binding(GO:0008061) |
| 2.7 | 10.9 | GO:0004768 | stearoyl-CoA 9-desaturase activity(GO:0004768) |
| 2.7 | 10.9 | GO:0005324 | long-chain fatty acid transporter activity(GO:0005324) |
| 2.7 | 10.8 | GO:0061578 | Lys63-specific deubiquitinase activity(GO:0061578) |
| 2.7 | 13.5 | GO:0004652 | polynucleotide adenylyltransferase activity(GO:0004652) |
| 2.7 | 489.2 | GO:0042393 | histone binding(GO:0042393) |
| 2.7 | 72.5 | GO:0016849 | cyclase activity(GO:0009975) phosphorus-oxygen lyase activity(GO:0016849) |
| 2.7 | 21.4 | GO:0042609 | CD4 receptor binding(GO:0042609) |
| 2.7 | 18.6 | GO:0050664 | oxidoreductase activity, acting on NAD(P)H, oxygen as acceptor(GO:0050664) |
| 2.6 | 7.9 | GO:0009041 | uridylate kinase activity(GO:0009041) |
| 2.6 | 42.3 | GO:0004806 | triglyceride lipase activity(GO:0004806) |
| 2.6 | 10.6 | GO:0004459 | L-lactate dehydrogenase activity(GO:0004459) |
| 2.6 | 10.5 | GO:0003835 | beta-galactoside alpha-2,6-sialyltransferase activity(GO:0003835) |
| 2.6 | 26.3 | GO:0045028 | G-protein coupled nucleotide receptor activity(GO:0001608) G-protein coupled purinergic nucleotide receptor activity(GO:0045028) |
| 2.6 | 31.4 | GO:0005223 | intracellular cGMP activated cation channel activity(GO:0005223) |
| 2.6 | 7.8 | GO:0070698 | type I activin receptor binding(GO:0070698) |
| 2.6 | 59.5 | GO:0008009 | chemokine activity(GO:0008009) |
| 2.6 | 7.7 | GO:0017077 | oxidative phosphorylation uncoupler activity(GO:0017077) |
| 2.6 | 20.6 | GO:0070016 | armadillo repeat domain binding(GO:0070016) |
| 2.6 | 7.7 | GO:0016316 | phosphatidylinositol-3,4-bisphosphate 4-phosphatase activity(GO:0016316) |
| 2.5 | 7.6 | GO:0001716 | L-amino-acid oxidase activity(GO:0001716) |
| 2.5 | 20.3 | GO:0042301 | phosphate ion binding(GO:0042301) |
| 2.5 | 1018.4 | GO:0005549 | odorant binding(GO:0005549) |
| 2.5 | 20.2 | GO:0005049 | nuclear export signal receptor activity(GO:0005049) |
| 2.5 | 7.5 | GO:0044715 | 8-oxo-dGDP phosphatase activity(GO:0044715) |
| 2.5 | 35.1 | GO:0019104 | DNA N-glycosylase activity(GO:0019104) |
| 2.5 | 7.5 | GO:0003922 | GMP synthase activity(GO:0003921) GMP synthase (glutamine-hydrolyzing) activity(GO:0003922) |
| 2.5 | 19.8 | GO:0016004 | phospholipase activator activity(GO:0016004) |
| 2.5 | 105.5 | GO:0004896 | cytokine receptor activity(GO:0004896) |
| 2.5 | 9.8 | GO:0004719 | protein-L-isoaspartate (D-aspartate) O-methyltransferase activity(GO:0004719) |
| 2.4 | 129.8 | GO:0004715 | non-membrane spanning protein tyrosine kinase activity(GO:0004715) |
| 2.4 | 224.6 | GO:0004866 | endopeptidase inhibitor activity(GO:0004866) |
| 2.4 | 14.6 | GO:0015562 | efflux transmembrane transporter activity(GO:0015562) |
| 2.4 | 14.4 | GO:0070051 | fibrinogen binding(GO:0070051) |
| 2.4 | 38.4 | GO:0042975 | peroxisome proliferator activated receptor binding(GO:0042975) |
| 2.4 | 9.6 | GO:0000293 | ferric-chelate reductase activity(GO:0000293) |
| 2.4 | 9.5 | GO:0033192 | calcium-dependent protein serine/threonine phosphatase activity(GO:0004723) calmodulin-dependent protein phosphatase activity(GO:0033192) |
| 2.4 | 16.6 | GO:0030621 | U4 snRNA binding(GO:0030621) |
| 2.4 | 9.5 | GO:1990955 | G-rich single-stranded DNA binding(GO:1990955) |
| 2.4 | 9.4 | GO:0004452 | isopentenyl-diphosphate delta-isomerase activity(GO:0004452) |
| 2.3 | 4.7 | GO:0004335 | galactokinase activity(GO:0004335) |
| 2.3 | 25.6 | GO:0070182 | DNA polymerase binding(GO:0070182) |
| 2.3 | 58.0 | GO:0001784 | phosphotyrosine binding(GO:0001784) |
| 2.3 | 9.2 | GO:0004062 | aryl sulfotransferase activity(GO:0004062) |
| 2.3 | 18.3 | GO:0016884 | carbon-nitrogen ligase activity, with glutamine as amido-N-donor(GO:0016884) |
| 2.3 | 4.6 | GO:0001077 | transcriptional activator activity, RNA polymerase II core promoter proximal region sequence-specific binding(GO:0001077) |
| 2.3 | 16.0 | GO:1990247 | N6-methyladenosine-containing RNA binding(GO:1990247) |
| 2.3 | 29.7 | GO:0003796 | lysozyme activity(GO:0003796) |
| 2.3 | 6.8 | GO:0008476 | protein-tyrosine sulfotransferase activity(GO:0008476) |
| 2.2 | 22.5 | GO:0003810 | protein-glutamine gamma-glutamyltransferase activity(GO:0003810) |
| 2.2 | 11.2 | GO:1990829 | C-rich single-stranded DNA binding(GO:1990829) |
| 2.2 | 8.9 | GO:0060698 | endoribonuclease inhibitor activity(GO:0060698) |
| 2.2 | 108.5 | GO:0003684 | damaged DNA binding(GO:0003684) |
| 2.2 | 11.1 | GO:0010997 | anaphase-promoting complex binding(GO:0010997) |
| 2.2 | 15.5 | GO:0004957 | prostaglandin E receptor activity(GO:0004957) |
| 2.2 | 4.4 | GO:0048408 | epidermal growth factor binding(GO:0048408) |
| 2.2 | 2.2 | GO:0001010 | transcription factor activity, sequence-specific DNA binding transcription factor recruiting(GO:0001010) |
| 2.2 | 13.2 | GO:0004953 | icosanoid receptor activity(GO:0004953) |
| 2.2 | 54.6 | GO:0004364 | glutathione transferase activity(GO:0004364) |
| 2.2 | 8.7 | GO:0030942 | endoplasmic reticulum signal peptide binding(GO:0030942) |
| 2.2 | 6.5 | GO:0004655 | porphobilinogen synthase activity(GO:0004655) |
| 2.2 | 15.2 | GO:0098599 | palmitoyl-(protein) hydrolase activity(GO:0008474) palmitoyl hydrolase activity(GO:0098599) |
| 2.2 | 10.8 | GO:0051033 | nucleic acid transmembrane transporter activity(GO:0051032) RNA transmembrane transporter activity(GO:0051033) |
| 2.1 | 19.0 | GO:0004003 | ATP-dependent DNA helicase activity(GO:0004003) |
| 2.1 | 14.7 | GO:0061133 | endopeptidase activator activity(GO:0061133) |
| 2.1 | 22.9 | GO:0032036 | myosin heavy chain binding(GO:0032036) |
| 2.1 | 8.3 | GO:1990189 | peptide-serine-N-acetyltransferase activity(GO:1990189) |
| 2.1 | 2.1 | GO:0070546 | L-phenylalanine aminotransferase activity(GO:0070546) |
| 2.1 | 6.2 | GO:0016015 | morphogen activity(GO:0016015) |
| 2.1 | 24.6 | GO:0008143 | poly(A) binding(GO:0008143) |
| 2.0 | 4.1 | GO:0046935 | 1-phosphatidylinositol-3-kinase regulator activity(GO:0046935) |
| 2.0 | 8.2 | GO:0034584 | piRNA binding(GO:0034584) |
| 2.0 | 10.2 | GO:0046624 | sphingolipid transporter activity(GO:0046624) |
| 2.0 | 10.1 | GO:0005148 | prolactin receptor binding(GO:0005148) |
| 2.0 | 34.3 | GO:0015288 | porin activity(GO:0015288) |
| 2.0 | 6.0 | GO:0016748 | succinyltransferase activity(GO:0016748) |
| 2.0 | 10.0 | GO:0005111 | type 2 fibroblast growth factor receptor binding(GO:0005111) |
| 2.0 | 4.0 | GO:0051425 | PTB domain binding(GO:0051425) |
| 2.0 | 41.6 | GO:0047617 | acyl-CoA hydrolase activity(GO:0047617) |
| 2.0 | 7.9 | GO:1901567 | icosanoid binding(GO:0050542) fatty acid derivative binding(GO:1901567) |
| 2.0 | 1738.8 | GO:0004984 | olfactory receptor activity(GO:0004984) |
| 2.0 | 7.8 | GO:0003839 | gamma-glutamylcyclotransferase activity(GO:0003839) |
| 2.0 | 7.8 | GO:0015349 | thyroid hormone transmembrane transporter activity(GO:0015349) |
| 1.9 | 7.8 | GO:0043199 | sulfate binding(GO:0043199) |
| 1.9 | 3.9 | GO:0004370 | glycerol kinase activity(GO:0004370) |
| 1.9 | 11.6 | GO:0015189 | L-lysine transmembrane transporter activity(GO:0015189) |
| 1.9 | 28.9 | GO:0003887 | DNA-directed DNA polymerase activity(GO:0003887) |
| 1.9 | 51.9 | GO:1990841 | promoter-specific chromatin binding(GO:1990841) |
| 1.9 | 5.7 | GO:0001094 | TFIID-class transcription factor binding(GO:0001094) |
| 1.9 | 3.8 | GO:0000822 | inositol hexakisphosphate binding(GO:0000822) |
| 1.9 | 9.5 | GO:0004301 | epoxide hydrolase activity(GO:0004301) |
| 1.9 | 3.7 | GO:0001007 | transcription factor activity, RNA polymerase III transcription factor binding(GO:0001007) |
| 1.9 | 5.6 | GO:1901375 | acetylcholine transmembrane transporter activity(GO:0005277) acetate ester transmembrane transporter activity(GO:1901375) |
| 1.9 | 7.4 | GO:0046975 | histone methyltransferase activity (H3-K36 specific)(GO:0046975) |
| 1.9 | 9.3 | GO:0009019 | tRNA (guanine-N1-)-methyltransferase activity(GO:0009019) |
| 1.9 | 18.5 | GO:0042162 | telomeric DNA binding(GO:0042162) |
| 1.8 | 1.8 | GO:0016300 | tRNA (uracil) methyltransferase activity(GO:0016300) |
| 1.8 | 9.2 | GO:0030229 | very-low-density lipoprotein particle receptor activity(GO:0030229) |
| 1.8 | 3.7 | GO:0019237 | centromeric DNA binding(GO:0019237) |
| 1.8 | 160.4 | GO:0004540 | ribonuclease activity(GO:0004540) |
| 1.8 | 10.8 | GO:0070728 | leucine binding(GO:0070728) |
| 1.8 | 19.8 | GO:0043138 | 3'-5' DNA helicase activity(GO:0043138) |
| 1.8 | 9.0 | GO:0005176 | ErbB-2 class receptor binding(GO:0005176) |
| 1.8 | 12.5 | GO:0047134 | protein-disulfide reductase activity(GO:0047134) |
| 1.8 | 14.3 | GO:0009881 | photoreceptor activity(GO:0009881) |
| 1.8 | 7.1 | GO:0003691 | double-stranded telomeric DNA binding(GO:0003691) |
| 1.8 | 10.6 | GO:0004826 | phenylalanine-tRNA ligase activity(GO:0004826) |
| 1.8 | 12.3 | GO:0051525 | NFAT protein binding(GO:0051525) |
| 1.7 | 29.7 | GO:0016706 | oxidoreductase activity, acting on paired donors, with incorporation or reduction of molecular oxygen, 2-oxoglutarate as one donor, and incorporation of one atom each of oxygen into both donors(GO:0016706) |
| 1.7 | 17.5 | GO:0038024 | cargo receptor activity(GO:0038024) |
| 1.7 | 15.6 | GO:0003746 | translation elongation factor activity(GO:0003746) |
| 1.7 | 278.1 | GO:0001047 | core promoter binding(GO:0001047) |
| 1.7 | 3.5 | GO:0035800 | deubiquitinase activator activity(GO:0035800) |
| 1.7 | 55.3 | GO:0061631 | ubiquitin conjugating enzyme activity(GO:0061631) |
| 1.7 | 39.7 | GO:0004623 | phospholipase A2 activity(GO:0004623) |
| 1.7 | 20.5 | GO:0045294 | alpha-catenin binding(GO:0045294) |
| 1.7 | 8.5 | GO:0052851 | cupric reductase activity(GO:0008823) ferric-chelate reductase (NADPH) activity(GO:0052851) |
| 1.7 | 5.1 | GO:0031127 | galactoside 2-alpha-L-fucosyltransferase activity(GO:0008107) alpha-(1,2)-fucosyltransferase activity(GO:0031127) |
| 1.7 | 33.9 | GO:0004601 | peroxidase activity(GO:0004601) |
| 1.7 | 8.5 | GO:1990459 | transferrin receptor binding(GO:1990459) |
| 1.7 | 13.3 | GO:0052834 | inositol monophosphate 4-phosphatase activity(GO:0052833) inositol monophosphate phosphatase activity(GO:0052834) |
| 1.7 | 5.0 | GO:0047057 | oxidoreductase activity, acting on the CH-OH group of donors, disulfide as acceptor(GO:0016900) vitamin-K-epoxide reductase (warfarin-sensitive) activity(GO:0047057) |
| 1.7 | 5.0 | GO:0016857 | racemase and epimerase activity, acting on carbohydrates and derivatives(GO:0016857) |
| 1.7 | 10.0 | GO:0008467 | [heparan sulfate]-glucosamine 3-sulfotransferase 1 activity(GO:0008467) |
| 1.7 | 11.6 | GO:0001135 | transcription factor activity, RNA polymerase II transcription factor recruiting(GO:0001135) |
| 1.6 | 6.6 | GO:0004169 | dolichyl-phosphate-mannose-protein mannosyltransferase activity(GO:0004169) |
| 1.6 | 16.3 | GO:0015125 | bile acid transmembrane transporter activity(GO:0015125) |
| 1.6 | 3.2 | GO:0045322 | unmethylated CpG binding(GO:0045322) |
| 1.6 | 9.6 | GO:0004994 | somatostatin receptor activity(GO:0004994) |
| 1.6 | 14.4 | GO:0001730 | 2'-5'-oligoadenylate synthetase activity(GO:0001730) |
| 1.6 | 3.2 | GO:0016520 | growth hormone-releasing hormone receptor activity(GO:0016520) |
| 1.6 | 6.4 | GO:0003987 | acetate-CoA ligase activity(GO:0003987) |
| 1.6 | 26.8 | GO:0019843 | rRNA binding(GO:0019843) |
| 1.6 | 23.6 | GO:0016922 | ligand-dependent nuclear receptor binding(GO:0016922) |
| 1.6 | 4.7 | GO:0004774 | succinate-CoA ligase activity(GO:0004774) succinate-CoA ligase (ADP-forming) activity(GO:0004775) |
| 1.5 | 15.4 | GO:0008641 | small protein activating enzyme activity(GO:0008641) |
| 1.5 | 12.2 | GO:0008430 | selenium binding(GO:0008430) |
| 1.5 | 4.6 | GO:0031711 | bradykinin receptor binding(GO:0031711) |
| 1.5 | 12.1 | GO:0004415 | hyalurononglucosaminidase activity(GO:0004415) |
| 1.5 | 6.0 | GO:0016742 | hydroxymethyl-, formyl- and related transferase activity(GO:0016742) |
| 1.5 | 6.0 | GO:0043024 | ribosomal small subunit binding(GO:0043024) |
| 1.5 | 22.4 | GO:0004697 | protein kinase C activity(GO:0004697) |
| 1.5 | 4.5 | GO:0046790 | virion binding(GO:0046790) |
| 1.5 | 7.4 | GO:0000064 | L-ornithine transmembrane transporter activity(GO:0000064) |
| 1.5 | 25.2 | GO:0017056 | structural constituent of nuclear pore(GO:0017056) |
| 1.5 | 8.8 | GO:0004126 | cytidine deaminase activity(GO:0004126) |
| 1.4 | 20.0 | GO:0005092 | GDP-dissociation inhibitor activity(GO:0005092) |
| 1.4 | 57.5 | GO:0000049 | tRNA binding(GO:0000049) |
| 1.4 | 8.4 | GO:0070742 | C2H2 zinc finger domain binding(GO:0070742) |
| 1.4 | 4.2 | GO:0016423 | tRNA (guanine) methyltransferase activity(GO:0016423) |
| 1.4 | 5.5 | GO:0051377 | mannose-ethanolamine phosphotransferase activity(GO:0051377) |
| 1.4 | 13.8 | GO:0005000 | vasopressin receptor activity(GO:0005000) |
| 1.4 | 19.3 | GO:0004579 | oligosaccharyl transferase activity(GO:0004576) dolichyl-diphosphooligosaccharide-protein glycotransferase activity(GO:0004579) |
| 1.4 | 48.3 | GO:0003727 | single-stranded RNA binding(GO:0003727) |
| 1.4 | 6.9 | GO:0072345 | NAADP-sensitive calcium-release channel activity(GO:0072345) |
| 1.4 | 4.1 | GO:0016722 | oxidoreductase activity, oxidizing metal ions(GO:0016722) |
| 1.4 | 2.7 | GO:0004466 | long-chain-acyl-CoA dehydrogenase activity(GO:0004466) |
| 1.4 | 2.7 | GO:0033142 | progesterone receptor binding(GO:0033142) |
| 1.4 | 6.8 | GO:0003857 | 3-hydroxyacyl-CoA dehydrogenase activity(GO:0003857) |
| 1.3 | 13.5 | GO:0070410 | co-SMAD binding(GO:0070410) |
| 1.3 | 6.7 | GO:0003988 | acetyl-CoA C-acyltransferase activity(GO:0003988) |
| 1.3 | 4.0 | GO:0004505 | phenylalanine 4-monooxygenase activity(GO:0004505) |
| 1.3 | 5.3 | GO:0019002 | GMP binding(GO:0019002) |
| 1.3 | 3.9 | GO:0008506 | sucrose:proton symporter activity(GO:0008506) sucrose transmembrane transporter activity(GO:0008515) disaccharide transmembrane transporter activity(GO:0015154) oligosaccharide transmembrane transporter activity(GO:0015157) |
| 1.3 | 10.5 | GO:1901611 | phosphatidylglycerol binding(GO:1901611) |
| 1.3 | 3.9 | GO:0015252 | hydrogen ion channel activity(GO:0015252) |
| 1.3 | 32.3 | GO:0004298 | threonine-type endopeptidase activity(GO:0004298) threonine-type peptidase activity(GO:0070003) |
| 1.3 | 78.4 | GO:0031490 | chromatin DNA binding(GO:0031490) |
| 1.3 | 6.4 | GO:0031849 | olfactory receptor binding(GO:0031849) |
| 1.3 | 2.5 | GO:0031531 | thyrotropin-releasing hormone receptor binding(GO:0031531) |
| 1.2 | 2.5 | GO:0005166 | neurotrophin p75 receptor binding(GO:0005166) |
| 1.2 | 5.0 | GO:0003989 | acetyl-CoA carboxylase activity(GO:0003989) |
| 1.2 | 19.5 | GO:0043274 | phospholipase binding(GO:0043274) |
| 1.2 | 2.4 | GO:0004303 | estradiol 17-beta-dehydrogenase activity(GO:0004303) |
| 1.2 | 16.7 | GO:0005159 | insulin-like growth factor receptor binding(GO:0005159) |
| 1.2 | 3.6 | GO:0004694 | eukaryotic translation initiation factor 2alpha kinase activity(GO:0004694) |
| 1.2 | 4.7 | GO:0008597 | calcium-dependent protein serine/threonine phosphatase regulator activity(GO:0008597) |
| 1.2 | 5.8 | GO:0001609 | G-protein coupled adenosine receptor activity(GO:0001609) |
| 1.2 | 5.8 | GO:0004886 | 9-cis retinoic acid receptor activity(GO:0004886) |
| 1.2 | 6.9 | GO:0009931 | calcium-dependent protein serine/threonine kinase activity(GO:0009931) |
| 1.1 | 26.2 | GO:0016538 | cyclin-dependent protein serine/threonine kinase regulator activity(GO:0016538) |
| 1.1 | 15.7 | GO:0016628 | oxidoreductase activity, acting on the CH-CH group of donors, NAD or NADP as acceptor(GO:0016628) |
| 1.1 | 5.6 | GO:0050833 | pyruvate transmembrane transporter activity(GO:0050833) |
| 1.1 | 1.1 | GO:0004618 | phosphoglycerate kinase activity(GO:0004618) |
| 1.1 | 9.9 | GO:0017034 | Rap guanyl-nucleotide exchange factor activity(GO:0017034) |
| 1.1 | 1.1 | GO:0047760 | butyrate-CoA ligase activity(GO:0047760) |
| 1.1 | 17.6 | GO:0005070 | SH3/SH2 adaptor activity(GO:0005070) |
| 1.1 | 5.5 | GO:0098639 | collagen binding involved in cell-matrix adhesion(GO:0098639) |
| 1.1 | 22.9 | GO:0042800 | histone methyltransferase activity (H3-K4 specific)(GO:0042800) |
| 1.1 | 17.4 | GO:0031434 | mitogen-activated protein kinase kinase binding(GO:0031434) |
| 1.1 | 15.1 | GO:0000993 | RNA polymerase II core binding(GO:0000993) |
| 1.1 | 7.6 | GO:0016778 | diphosphotransferase activity(GO:0016778) |
| 1.1 | 3.2 | GO:0031765 | galanin receptor binding(GO:0031763) type 2 galanin receptor binding(GO:0031765) type 3 galanin receptor binding(GO:0031766) |
| 1.1 | 3.2 | GO:0048019 | receptor antagonist activity(GO:0048019) |
| 1.1 | 10.7 | GO:1904264 | ubiquitin protein ligase activity involved in ERAD pathway(GO:1904264) |
| 1.1 | 2.1 | GO:0008035 | high-density lipoprotein particle binding(GO:0008035) |
| 1.1 | 11.7 | GO:0030414 | peptidase inhibitor activity(GO:0030414) |
| 1.1 | 77.4 | GO:0004197 | cysteine-type endopeptidase activity(GO:0004197) |
| 1.1 | 10.6 | GO:0004596 | peptide alpha-N-acetyltransferase activity(GO:0004596) |
| 1.0 | 5.2 | GO:0050733 | RS domain binding(GO:0050733) |
| 1.0 | 2.1 | GO:0003689 | DNA clamp loader activity(GO:0003689) protein-DNA loading ATPase activity(GO:0033170) |
| 1.0 | 10.4 | GO:0051400 | BH domain binding(GO:0051400) |
| 1.0 | 3.1 | GO:0044020 | histone methyltransferase activity (H4-R3 specific)(GO:0044020) |
| 1.0 | 45.7 | GO:0033613 | activating transcription factor binding(GO:0033613) |
| 1.0 | 3.1 | GO:0042809 | vitamin D receptor binding(GO:0042809) |
| 1.0 | 2.1 | GO:0019865 | immunoglobulin binding(GO:0019865) |
| 1.0 | 3.1 | GO:0035596 | methylthiotransferase activity(GO:0035596) transferase activity, transferring alkylthio groups(GO:0050497) |
| 1.0 | 59.1 | GO:0003743 | translation initiation factor activity(GO:0003743) |
| 1.0 | 7.1 | GO:0001056 | RNA polymerase III activity(GO:0001056) |
| 1.0 | 6.1 | GO:0034713 | type I transforming growth factor beta receptor binding(GO:0034713) |
| 1.0 | 9.0 | GO:0051428 | peptide hormone receptor binding(GO:0051428) |
| 1.0 | 4.0 | GO:0001972 | retinoic acid binding(GO:0001972) |
| 1.0 | 2.0 | GO:0032190 | acrosin binding(GO:0032190) |
| 1.0 | 1.0 | GO:0000990 | transcription factor activity, core RNA polymerase binding(GO:0000990) |
| 1.0 | 25.3 | GO:0030515 | snoRNA binding(GO:0030515) |
| 1.0 | 4.8 | GO:0004337 | dimethylallyltranstransferase activity(GO:0004161) geranyltranstransferase activity(GO:0004337) |
| 1.0 | 26.1 | GO:0008527 | taste receptor activity(GO:0008527) |
| 1.0 | 17.4 | GO:0098641 | cadherin binding involved in cell-cell adhesion(GO:0098641) |
| 1.0 | 3.8 | GO:0003917 | DNA topoisomerase type I activity(GO:0003917) |
| 0.9 | 6.6 | GO:0045295 | gamma-catenin binding(GO:0045295) |
| 0.9 | 2.8 | GO:0004021 | L-alanine:2-oxoglutarate aminotransferase activity(GO:0004021) alanine-oxo-acid transaminase activity(GO:0047635) |
| 0.9 | 3.7 | GO:0001134 | transcription factor activity, transcription factor recruiting(GO:0001134) |
| 0.9 | 1.8 | GO:0010484 | H3 histone acetyltransferase activity(GO:0010484) |
| 0.9 | 9.0 | GO:0035586 | purinergic receptor activity(GO:0035586) |
| 0.9 | 15.3 | GO:0017025 | TBP-class protein binding(GO:0017025) |
| 0.9 | 8.8 | GO:0003678 | DNA helicase activity(GO:0003678) |
| 0.9 | 0.9 | GO:0016453 | C-acetyltransferase activity(GO:0016453) |
| 0.9 | 1.7 | GO:0004647 | phosphoserine phosphatase activity(GO:0004647) |
| 0.9 | 11.2 | GO:0070063 | RNA polymerase binding(GO:0070063) |
| 0.9 | 3.4 | GO:0055077 | gap junction hemi-channel activity(GO:0055077) |
| 0.8 | 1.7 | GO:0038100 | nodal binding(GO:0038100) |
| 0.8 | 2.5 | GO:0051990 | (R)-2-hydroxyglutarate dehydrogenase activity(GO:0051990) |
| 0.8 | 41.4 | GO:0020037 | heme binding(GO:0020037) |
| 0.8 | 1.7 | GO:0032137 | guanine/thymine mispair binding(GO:0032137) |
| 0.8 | 2.5 | GO:0003945 | N-acetyllactosamine synthase activity(GO:0003945) |
| 0.8 | 11.5 | GO:0009982 | pseudouridine synthase activity(GO:0009982) |
| 0.8 | 9.8 | GO:0000980 | RNA polymerase II distal enhancer sequence-specific DNA binding(GO:0000980) |
| 0.8 | 4.1 | GO:0052629 | phosphatidylinositol-3,5-bisphosphate 3-phosphatase activity(GO:0052629) |
| 0.8 | 3.2 | GO:0051431 | corticotropin-releasing hormone receptor 2 binding(GO:0051431) |
| 0.8 | 2.4 | GO:0016309 | 1-phosphatidylinositol-5-phosphate 4-kinase activity(GO:0016309) |
| 0.8 | 5.6 | GO:0098748 | clathrin adaptor activity(GO:0035615) endocytic adaptor activity(GO:0098748) |
| 0.8 | 3.9 | GO:0004726 | non-membrane spanning protein tyrosine phosphatase activity(GO:0004726) |
| 0.8 | 6.2 | GO:0008172 | S-methyltransferase activity(GO:0008172) |
| 0.8 | 2.3 | GO:0004832 | valine-tRNA ligase activity(GO:0004832) |
| 0.8 | 1.5 | GO:0000253 | 3-keto sterol reductase activity(GO:0000253) |
| 0.8 | 23.4 | GO:0001085 | RNA polymerase II transcription factor binding(GO:0001085) |
| 0.8 | 15.1 | GO:0071889 | 14-3-3 protein binding(GO:0071889) |
| 0.7 | 1.5 | GO:0016840 | carbon-nitrogen lyase activity(GO:0016840) |
| 0.7 | 23.0 | GO:0005160 | transforming growth factor beta receptor binding(GO:0005160) |
| 0.7 | 11.4 | GO:0070001 | aspartic-type peptidase activity(GO:0070001) |
| 0.7 | 2.8 | GO:0004740 | pyruvate dehydrogenase (acetyl-transferring) kinase activity(GO:0004740) |
| 0.7 | 3.4 | GO:0005499 | vitamin D binding(GO:0005499) |
| 0.7 | 2.1 | GO:0031752 | D5 dopamine receptor binding(GO:0031752) |
| 0.7 | 2.0 | GO:0004609 | phosphatidylserine decarboxylase activity(GO:0004609) |
| 0.7 | 1.3 | GO:0035368 | selenocysteine insertion sequence binding(GO:0035368) |
| 0.7 | 7.9 | GO:0071933 | Arp2/3 complex binding(GO:0071933) |
| 0.7 | 1.3 | GO:0004731 | purine-nucleoside phosphorylase activity(GO:0004731) |
| 0.7 | 4.6 | GO:0050700 | CARD domain binding(GO:0050700) |
| 0.7 | 2.0 | GO:0004563 | beta-N-acetylhexosaminidase activity(GO:0004563) |
| 0.6 | 3.9 | GO:0070888 | E-box binding(GO:0070888) |
| 0.6 | 1.9 | GO:0000026 | alpha-1,2-mannosyltransferase activity(GO:0000026) |
| 0.6 | 3.8 | GO:0005005 | transmembrane-ephrin receptor activity(GO:0005005) |
| 0.6 | 7.5 | GO:0015379 | potassium:chloride symporter activity(GO:0015379) potassium ion symporter activity(GO:0022820) |
| 0.6 | 2.5 | GO:0003726 | double-stranded RNA adenosine deaminase activity(GO:0003726) |
| 0.6 | 4.9 | GO:0008525 | phosphatidylcholine transporter activity(GO:0008525) |
| 0.6 | 7.9 | GO:0004527 | exonuclease activity(GO:0004527) |
| 0.6 | 1.8 | GO:0005375 | copper ion transmembrane transporter activity(GO:0005375) |
| 0.6 | 3.0 | GO:0046965 | retinoid X receptor binding(GO:0046965) |
| 0.6 | 7.6 | GO:0019789 | SUMO transferase activity(GO:0019789) |
| 0.6 | 5.2 | GO:0035497 | cAMP response element binding(GO:0035497) |
| 0.6 | 5.7 | GO:0004331 | fructose-2,6-bisphosphate 2-phosphatase activity(GO:0004331) |
| 0.6 | 31.1 | GO:0003697 | single-stranded DNA binding(GO:0003697) |
| 0.5 | 2.7 | GO:0004427 | inorganic diphosphatase activity(GO:0004427) |
| 0.5 | 3.8 | GO:0034711 | inhibin binding(GO:0034711) |
| 0.5 | 3.8 | GO:0018024 | histone-lysine N-methyltransferase activity(GO:0018024) |
| 0.5 | 2.1 | GO:0047184 | 1-acylglycerophosphocholine O-acyltransferase activity(GO:0047184) |
| 0.5 | 2.7 | GO:0070034 | telomerase RNA binding(GO:0070034) |
| 0.5 | 12.4 | GO:0001106 | RNA polymerase II transcription corepressor activity(GO:0001106) |
| 0.5 | 3.0 | GO:1990825 | sequence-specific mRNA binding(GO:1990825) |
| 0.5 | 2.5 | GO:0008094 | DNA-dependent ATPase activity(GO:0008094) |
| 0.5 | 1.5 | GO:0008502 | melatonin receptor activity(GO:0008502) |
| 0.5 | 3.0 | GO:0017151 | DEAD/H-box RNA helicase binding(GO:0017151) |
| 0.5 | 1.5 | GO:0004711 | ribosomal protein S6 kinase activity(GO:0004711) |
| 0.5 | 1.5 | GO:0004827 | proline-tRNA ligase activity(GO:0004827) |
| 0.5 | 84.4 | GO:0003682 | chromatin binding(GO:0003682) |
| 0.5 | 4.7 | GO:0051766 | inositol trisphosphate kinase activity(GO:0051766) |
| 0.5 | 164.3 | GO:0005525 | GTP binding(GO:0005525) |
| 0.5 | 1.9 | GO:0016833 | oxo-acid-lyase activity(GO:0016833) |
| 0.5 | 6.0 | GO:0071837 | HMG box domain binding(GO:0071837) |
| 0.5 | 2.7 | GO:0005487 | nucleocytoplasmic transporter activity(GO:0005487) |
| 0.4 | 22.0 | GO:0008026 | ATP-dependent helicase activity(GO:0008026) purine NTP-dependent helicase activity(GO:0070035) |
| 0.4 | 1.8 | GO:0050252 | retinol O-fatty-acyltransferase activity(GO:0050252) |
| 0.4 | 5.2 | GO:0016702 | oxidoreductase activity, acting on single donors with incorporation of molecular oxygen(GO:0016701) oxidoreductase activity, acting on single donors with incorporation of molecular oxygen, incorporation of two atoms of oxygen(GO:0016702) |
| 0.4 | 2.1 | GO:0004849 | uridine kinase activity(GO:0004849) |
| 0.4 | 5.0 | GO:0016868 | intramolecular transferase activity, phosphotransferases(GO:0016868) |
| 0.4 | 1.2 | GO:0015203 | polyamine transmembrane transporter activity(GO:0015203) putrescine transmembrane transporter activity(GO:0015489) |
| 0.4 | 2.4 | GO:0051022 | Rho GDP-dissociation inhibitor binding(GO:0051022) |
| 0.4 | 3.6 | GO:0019841 | retinol binding(GO:0019841) |
| 0.4 | 107.5 | GO:0000978 | RNA polymerase II core promoter proximal region sequence-specific DNA binding(GO:0000978) |
| 0.4 | 4.4 | GO:0000295 | adenine nucleotide transmembrane transporter activity(GO:0000295) purine ribonucleotide transmembrane transporter activity(GO:0005346) |
| 0.4 | 1.6 | GO:0004594 | pantothenate kinase activity(GO:0004594) |
| 0.4 | 2.4 | GO:0005338 | nucleotide-sugar transmembrane transporter activity(GO:0005338) |
| 0.4 | 6.3 | GO:0008536 | Ran GTPase binding(GO:0008536) |
| 0.4 | 3.1 | GO:0030306 | ADP-ribosylation factor binding(GO:0030306) |
| 0.4 | 1.1 | GO:0035184 | histone threonine kinase activity(GO:0035184) |
| 0.4 | 5.3 | GO:0008376 | acetylgalactosaminyltransferase activity(GO:0008376) |
| 0.4 | 1.1 | GO:0016888 | endodeoxyribonuclease activity, producing 5'-phosphomonoesters(GO:0016888) |
| 0.4 | 0.4 | GO:0032795 | heterotrimeric G-protein binding(GO:0032795) |
| 0.3 | 0.3 | GO:0015929 | hexosaminidase activity(GO:0015929) |
| 0.3 | 280.8 | GO:0003677 | DNA binding(GO:0003677) |
| 0.3 | 0.7 | GO:0005146 | leukemia inhibitory factor receptor binding(GO:0005146) |
| 0.3 | 0.9 | GO:0016635 | oxidoreductase activity, acting on the CH-CH group of donors, quinone or related compound as acceptor(GO:0016635) |
| 0.3 | 0.6 | GO:0004517 | nitric-oxide synthase activity(GO:0004517) |
| 0.3 | 4.3 | GO:0051010 | microtubule plus-end binding(GO:0051010) |
| 0.3 | 1.6 | GO:0043023 | ribosomal large subunit binding(GO:0043023) |
| 0.3 | 2.6 | GO:0047372 | acylglycerol lipase activity(GO:0047372) |
| 0.3 | 0.8 | GO:0016971 | flavin-linked sulfhydryl oxidase activity(GO:0016971) |
| 0.2 | 1.0 | GO:0030172 | troponin C binding(GO:0030172) |
| 0.2 | 0.5 | GO:0055105 | ubiquitin-protein transferase inhibitor activity(GO:0055105) |
| 0.2 | 0.7 | GO:0035198 | miRNA binding(GO:0035198) |
| 0.2 | 1.2 | GO:0004969 | histamine receptor activity(GO:0004969) |
| 0.2 | 2.3 | GO:0051959 | dynein light intermediate chain binding(GO:0051959) |
| 0.2 | 4.4 | GO:0005247 | voltage-gated chloride channel activity(GO:0005247) |
| 0.2 | 0.5 | GO:0016289 | CoA hydrolase activity(GO:0016289) |
| 0.2 | 4.1 | GO:0016209 | antioxidant activity(GO:0016209) |
| 0.2 | 0.6 | GO:0004307 | ethanolaminephosphotransferase activity(GO:0004307) |
| 0.2 | 0.6 | GO:0033743 | peptide-methionine (R)-S-oxide reductase activity(GO:0033743) |
| 0.2 | 0.4 | GO:0004176 | ATP-dependent peptidase activity(GO:0004176) |
| 0.2 | 2.3 | GO:0005225 | volume-sensitive anion channel activity(GO:0005225) |
| 0.2 | 0.8 | GO:0019136 | deoxynucleoside kinase activity(GO:0019136) |
| 0.2 | 0.6 | GO:0072542 | protein phosphatase activator activity(GO:0072542) |
| 0.2 | 1.8 | GO:0032794 | GTPase activating protein binding(GO:0032794) |
| 0.2 | 1.0 | GO:0046912 | transferase activity, transferring acyl groups, acyl groups converted into alkyl on transfer(GO:0046912) |
| 0.2 | 0.4 | GO:0004582 | dolichyl-phosphate beta-D-mannosyltransferase activity(GO:0004582) |
| 0.2 | 2.9 | GO:0017017 | MAP kinase tyrosine/serine/threonine phosphatase activity(GO:0017017) |
| 0.2 | 0.8 | GO:0004300 | enoyl-CoA hydratase activity(GO:0004300) |
| 0.2 | 1.0 | GO:0015174 | basic amino acid transmembrane transporter activity(GO:0015174) |
| 0.2 | 2.8 | GO:0043325 | phosphatidylinositol-3,4-bisphosphate binding(GO:0043325) |
| 0.2 | 0.5 | GO:0042974 | retinoic acid receptor binding(GO:0042974) |
| 0.2 | 1.1 | GO:0035612 | AP-2 adaptor complex binding(GO:0035612) |
| 0.1 | 3.1 | GO:0005212 | structural constituent of eye lens(GO:0005212) |
| 0.1 | 4.3 | GO:0031593 | polyubiquitin binding(GO:0031593) |
| 0.1 | 0.4 | GO:0015184 | L-cystine transmembrane transporter activity(GO:0015184) |
| 0.1 | 0.5 | GO:0050308 | carbohydrate phosphatase activity(GO:0019203) sugar-phosphatase activity(GO:0050308) |
| 0.1 | 2.2 | GO:0008373 | sialyltransferase activity(GO:0008373) |
| 0.1 | 1.6 | GO:0015035 | protein disulfide oxidoreductase activity(GO:0015035) |
| 0.1 | 3.0 | GO:0002039 | p53 binding(GO:0002039) |
| 0.1 | 0.7 | GO:0008603 | cAMP-dependent protein kinase regulator activity(GO:0008603) |
| 0.1 | 0.5 | GO:0004366 | glycerol-3-phosphate O-acyltransferase activity(GO:0004366) |
| 0.1 | 1.9 | GO:0030374 | ligand-dependent nuclear receptor transcription coactivator activity(GO:0030374) |
| 0.1 | 0.3 | GO:0019776 | Atg8 ligase activity(GO:0019776) |
| 0.1 | 0.8 | GO:0036002 | pre-mRNA binding(GO:0036002) |
| 0.1 | 0.6 | GO:0000774 | adenyl-nucleotide exchange factor activity(GO:0000774) |
| 0.1 | 0.2 | GO:1990380 | Lys48-specific deubiquitinase activity(GO:1990380) |
| 0.1 | 0.2 | GO:0004586 | ornithine decarboxylase activity(GO:0004586) |
| 0.0 | 0.1 | GO:0031770 | growth hormone-releasing hormone receptor binding(GO:0031770) |
| 0.0 | 0.1 | GO:0004167 | dopachrome isomerase activity(GO:0004167) |
| 0.0 | 0.2 | GO:0050072 | m7G(5')pppN diphosphatase activity(GO:0050072) |
| 0.0 | 0.5 | GO:0008171 | O-methyltransferase activity(GO:0008171) |
| 0.0 | 0.0 | GO:0004813 | alanine-tRNA ligase activity(GO:0004813) |
| 0.0 | 0.1 | GO:0046527 | glucosyltransferase activity(GO:0046527) |
| 0.0 | 0.0 | GO:0004127 | cytidylate kinase activity(GO:0004127) |
Gene overrepresentation in curated gene sets: canonical pathways category:
| Log-likelihood per target | Total log-likelihood | Term | Description |
|---|---|---|---|
| 17.7 | 35.4 | PID IL8 CXCR2 PATHWAY | IL8- and CXCR2-mediated signaling events |
| 12.0 | 23.9 | PID TCR RAS PATHWAY | Ras signaling in the CD4+ TCR pathway |
| 11.6 | 360.9 | PID INTEGRIN2 PATHWAY | Beta2 integrin cell surface interactions |
| 10.4 | 146.0 | ST INTERFERON GAMMA PATHWAY | Interferon gamma pathway. |
| 9.1 | 598.5 | PID CD8 TCR PATHWAY | TCR signaling in naïve CD8+ T cells |
| 8.8 | 157.8 | SA MMP CYTOKINE CONNECTION | Cytokines can induce activation of matrix metalloproteinases, which degrade extracellular matrix. |
| 8.1 | 48.4 | ST IL 13 PATHWAY | Interleukin 13 (IL-13) Pathway |
| 7.6 | 45.4 | PID CD40 PATHWAY | CD40/CD40L signaling |
| 7.2 | 43.2 | PID IL5 PATHWAY | IL5-mediated signaling events |
| 6.1 | 194.9 | PID IL23 PATHWAY | IL23-mediated signaling events |
| 5.8 | 193.0 | PID IL2 STAT5 PATHWAY | IL2 signaling events mediated by STAT5 |
| 5.3 | 85.5 | PID TCR PATHWAY | TCR signaling in naïve CD4+ T cells |
| 5.0 | 248.4 | PID BCR 5PATHWAY | BCR signaling pathway |
| 5.0 | 14.9 | ST PAC1 RECEPTOR PATHWAY | PAC1 Receptor Pathway |
| 4.9 | 38.9 | SA G2 AND M PHASES | Cdc25 activates the cdc2/cyclin B complex to induce the G2/M transition. |
| 4.7 | 51.8 | SA REG CASCADE OF CYCLIN EXPR | Expression of cyclins regulates progression through the cell cycle by activating cyclin-dependent kinases. |
| 4.6 | 129.5 | PID HIV NEF PATHWAY | HIV-1 Nef: Negative effector of Fas and TNF-alpha |
| 4.5 | 116.5 | PID IL1 PATHWAY | IL1-mediated signaling events |
| 4.5 | 147.5 | PID AMB2 NEUTROPHILS PATHWAY | amb2 Integrin signaling |
| 4.3 | 234.9 | PID FANCONI PATHWAY | Fanconi anemia pathway |
| 4.1 | 8.2 | SIG PIP3 SIGNALING IN B LYMPHOCYTES | Genes related to PIP3 signaling in B lymphocytes |
| 4.0 | 177.2 | PID NFAT TFPATHWAY | Calcineurin-regulated NFAT-dependent transcription in lymphocytes |
| 3.9 | 109.7 | PID FCER1 PATHWAY | Fc-epsilon receptor I signaling in mast cells |
| 3.9 | 260.7 | PID CMYB PATHWAY | C-MYB transcription factor network |
| 3.8 | 61.1 | PID TOLL ENDOGENOUS PATHWAY | Endogenous TLR signaling |
| 3.6 | 39.3 | PID CD8 TCR DOWNSTREAM PATHWAY | Downstream signaling in naïve CD8+ T cells |
| 3.3 | 165.0 | PID HNF3B PATHWAY | FOXA2 and FOXA3 transcription factor networks |
| 3.2 | 25.6 | SA G1 AND S PHASES | Cdk2, 4, and 6 bind cyclin D in G1, while cdk2/cyclin E promotes the G1/S transition. |
| 3.1 | 83.8 | PID IL4 2PATHWAY | IL4-mediated signaling events |
| 3.1 | 156.7 | PID E2F PATHWAY | E2F transcription factor network |
| 3.1 | 702.5 | NABA ECM REGULATORS | Genes encoding enzymes and their regulators involved in the remodeling of the extracellular matrix |
| 3.0 | 12.0 | PID A6B1 A6B4 INTEGRIN PATHWAY | a6b1 and a6b4 Integrin signaling |
| 2.9 | 34.7 | PID NFKAPPAB CANONICAL PATHWAY | Canonical NF-kappaB pathway |
| 2.8 | 33.3 | PID THROMBIN PAR4 PATHWAY | PAR4-mediated thrombin signaling events |
| 2.7 | 65.5 | PID FOXM1 PATHWAY | FOXM1 transcription factor network |
| 2.7 | 103.7 | PID CASPASE PATHWAY | Caspase cascade in apoptosis |
| 2.7 | 103.4 | PID AURORA B PATHWAY | Aurora B signaling |
| 2.7 | 54.4 | PID IL12 2PATHWAY | IL12-mediated signaling events |
| 2.7 | 64.7 | PID CXCR3 PATHWAY | CXCR3-mediated signaling events |
| 2.6 | 18.0 | PID ENDOTHELIN PATHWAY | Endothelins |
| 2.4 | 29.3 | PID BARD1 PATHWAY | BARD1 signaling events |
| 2.4 | 9.8 | ST TYPE I INTERFERON PATHWAY | Type I Interferon (alpha/beta IFN) Pathway |
| 2.4 | 56.5 | ST WNT CA2 CYCLIC GMP PATHWAY | Wnt/Ca2+/cyclic GMP signaling. |
| 2.2 | 15.4 | PID NFKAPPAB ATYPICAL PATHWAY | Atypical NF-kappaB pathway |
| 2.2 | 48.3 | PID CERAMIDE PATHWAY | Ceramide signaling pathway |
| 2.2 | 107.1 | PID DELTA NP63 PATHWAY | Validated transcriptional targets of deltaNp63 isoforms |
| 2.1 | 2.1 | PID PI3KCI AKT PATHWAY | Class I PI3K signaling events mediated by Akt |
| 2.1 | 27.1 | PID EPHRINB REV PATHWAY | Ephrin B reverse signaling |
| 2.0 | 34.8 | PID TCPTP PATHWAY | Signaling events mediated by TCPTP |
| 1.9 | 29.8 | PID IL6 7 PATHWAY | IL6-mediated signaling events |
| 1.9 | 9.3 | PID ATR PATHWAY | ATR signaling pathway |
| 1.9 | 7.4 | SA PROGRAMMED CELL DEATH | Programmed cell death, or apoptosis, eliminates damaged or unneeded cells. |
| 1.8 | 30.7 | PID UPA UPAR PATHWAY | Urokinase-type plasminogen activator (uPA) and uPAR-mediated signaling |
| 1.7 | 28.0 | PID ERB GENOMIC PATHWAY | Validated nuclear estrogen receptor beta network |
| 1.7 | 31.9 | PID TXA2PATHWAY | Thromboxane A2 receptor signaling |
| 1.6 | 11.1 | PID GMCSF PATHWAY | GMCSF-mediated signaling events |
| 1.5 | 10.6 | PID EPO PATHWAY | EPO signaling pathway |
| 1.4 | 2.9 | PID MYC PATHWAY | C-MYC pathway |
| 1.4 | 54.0 | PID RAC1 PATHWAY | RAC1 signaling pathway |
| 1.4 | 24.0 | PID REG GR PATHWAY | Glucocorticoid receptor regulatory network |
| 1.4 | 53.3 | PID PLK1 PATHWAY | PLK1 signaling events |
| 1.2 | 6.1 | PID FOXO PATHWAY | FoxO family signaling |
| 1.2 | 5.9 | PID PI3KCI PATHWAY | Class I PI3K signaling events |
| 1.1 | 12.6 | PID P38 MKK3 6PATHWAY | p38 MAPK signaling pathway |
| 1.1 | 64.7 | PID MYC REPRESS PATHWAY | Validated targets of C-MYC transcriptional repression |
| 1.0 | 8.4 | PID S1P META PATHWAY | Sphingosine 1-phosphate (S1P) pathway |
| 1.0 | 16.0 | PID RETINOIC ACID PATHWAY | Retinoic acid receptors-mediated signaling |
| 1.0 | 2.9 | ST PHOSPHOINOSITIDE 3 KINASE PATHWAY | PI3K Pathway |
| 0.9 | 20.9 | PID HNF3A PATHWAY | FOXA1 transcription factor network |
| 0.9 | 6.1 | PID ANGIOPOIETIN RECEPTOR PATHWAY | Angiopoietin receptor Tie2-mediated signaling |
| 0.8 | 1.7 | ST INTERLEUKIN 4 PATHWAY | Interleukin 4 (IL-4) Pathway |
| 0.8 | 6.6 | PID PRL SIGNALING EVENTS PATHWAY | Signaling events mediated by PRL |
| 0.8 | 31.0 | PID SMAD2 3NUCLEAR PATHWAY | Regulation of nuclear SMAD2/3 signaling |
| 0.7 | 4.4 | PID RANBP2 PATHWAY | Sumoylation by RanBP2 regulates transcriptional repression |
| 0.7 | 106.2 | NABA ECM AFFILIATED | Genes encoding proteins affiliated structurally or functionally to extracellular matrix proteins |
| 0.7 | 22.1 | PID ERA GENOMIC PATHWAY | Validated nuclear estrogen receptor alpha network |
| 0.7 | 21.0 | PID TELOMERASE PATHWAY | Regulation of Telomerase |
| 0.7 | 5.9 | ST ERK1 ERK2 MAPK PATHWAY | ERK1/ERK2 MAPK Pathway |
| 0.6 | 27.3 | PID HIF1 TFPATHWAY | HIF-1-alpha transcription factor network |
| 0.6 | 36.7 | PID MYC ACTIV PATHWAY | Validated targets of C-MYC transcriptional activation |
| 0.6 | 9.4 | PID HIF2PATHWAY | HIF-2-alpha transcription factor network |
| 0.6 | 24.1 | PID ERBB1 DOWNSTREAM PATHWAY | ErbB1 downstream signaling |
| 0.6 | 11.3 | PID RXR VDR PATHWAY | RXR and RAR heterodimerization with other nuclear receptor |
| 0.6 | 1.2 | PID THROMBIN PAR1 PATHWAY | PAR1-mediated thrombin signaling events |
| 0.6 | 3.5 | PID TRAIL PATHWAY | TRAIL signaling pathway |
| 0.5 | 3.8 | PID WNT NONCANONICAL PATHWAY | Noncanonical Wnt signaling pathway |
| 0.5 | 11.0 | PID RHODOPSIN PATHWAY | Visual signal transduction: Rods |
| 0.5 | 4.0 | ST TUMOR NECROSIS FACTOR PATHWAY | Tumor Necrosis Factor Pathway. |
| 0.5 | 1.0 | PID SYNDECAN 1 PATHWAY | Syndecan-1-mediated signaling events |
| 0.5 | 118.5 | NABA SECRETED FACTORS | Genes encoding secreted soluble factors |
| 0.4 | 10.8 | PID RHOA PATHWAY | RhoA signaling pathway |
| 0.4 | 0.9 | PID IL27 PATHWAY | IL27-mediated signaling events |
| 0.4 | 2.9 | SIG BCR SIGNALING PATHWAY | Members of the BCR signaling pathway |
| 0.4 | 0.8 | PID IFNG PATHWAY | IFN-gamma pathway |
| 0.4 | 5.0 | PID SYNDECAN 2 PATHWAY | Syndecan-2-mediated signaling events |
| 0.3 | 2.6 | PID SMAD2 3PATHWAY | Regulation of cytoplasmic and nuclear SMAD2/3 signaling |
| 0.3 | 3.1 | PID INSULIN GLUCOSE PATHWAY | Insulin-mediated glucose transport |
| 0.2 | 1.0 | ST GAQ PATHWAY | G alpha q Pathway |
| 0.2 | 3.9 | PID WNT SIGNALING PATHWAY | Wnt signaling network |
| 0.2 | 5.4 | PID P53 REGULATION PATHWAY | p53 pathway |
| 0.2 | 1.0 | PID IL2 1PATHWAY | IL2-mediated signaling events |
| 0.1 | 1.0 | PID DNA PK PATHWAY | DNA-PK pathway in nonhomologous end joining |
| 0.1 | 3.2 | PID P73PATHWAY | p73 transcription factor network |
| 0.1 | 1.1 | PID ATM PATHWAY | ATM pathway |
| 0.0 | 0.1 | PID IL8 CXCR1 PATHWAY | IL8- and CXCR1-mediated signaling events |
| 0.0 | 0.6 | PID MTOR 4PATHWAY | mTOR signaling pathway |
Gene overrepresentation in curated gene sets: REACTOME pathways category:
| Log-likelihood per target | Total log-likelihood | Term | Description |
|---|---|---|---|
| 24.0 | 192.3 | REACTOME TRANSLOCATION OF ZAP 70 TO IMMUNOLOGICAL SYNAPSE | Genes involved in Translocation of ZAP-70 to Immunological synapse |
| 19.6 | 117.7 | REACTOME PD1 SIGNALING | Genes involved in PD-1 signaling |
| 18.8 | 847.4 | REACTOME IMMUNOREGULATORY INTERACTIONS BETWEEN A LYMPHOID AND A NON LYMPHOID CELL | Genes involved in Immunoregulatory interactions between a Lymphoid and a non-Lymphoid cell |
| 16.5 | 313.8 | REACTOME GLUCURONIDATION | Genes involved in Glucuronidation |
| 16.3 | 146.8 | REACTOME TRYPTOPHAN CATABOLISM | Genes involved in Tryptophan catabolism |
| 16.0 | 64.1 | REACTOME PHOSPHORYLATION OF CD3 AND TCR ZETA CHAINS | Genes involved in Phosphorylation of CD3 and TCR zeta chains |
| 13.7 | 82.3 | REACTOME DIGESTION OF DIETARY CARBOHYDRATE | Genes involved in Digestion of dietary carbohydrate |
| 12.0 | 191.3 | REACTOME COMMON PATHWAY | Genes involved in Common Pathway |
| 11.4 | 377.1 | REACTOME COMPLEMENT CASCADE | Genes involved in Complement cascade |
| 11.4 | 91.1 | REACTOME DEFENSINS | Genes involved in Defensins |
| 10.6 | 158.9 | REACTOME IL 7 SIGNALING | Genes involved in Interleukin-7 signaling |
| 10.4 | 124.5 | REACTOME RECYCLING OF BILE ACIDS AND SALTS | Genes involved in Recycling of bile acids and salts |
| 10.1 | 474.7 | REACTOME CHEMOKINE RECEPTORS BIND CHEMOKINES | Genes involved in Chemokine receptors bind chemokines |
| 8.9 | 151.8 | REACTOME CHYLOMICRON MEDIATED LIPID TRANSPORT | Genes involved in Chylomicron-mediated lipid transport |
| 8.7 | 52.0 | REACTOME GAMMA CARBOXYLATION TRANSPORT AND AMINO TERMINAL CLEAVAGE OF PROTEINS | Genes involved in Gamma-carboxylation, transport, and amino-terminal cleavage of proteins |
| 8.2 | 131.9 | REACTOME ACYL CHAIN REMODELLING OF PS | Genes involved in Acyl chain remodelling of PS |
| 7.6 | 84.0 | REACTOME APOPTOSIS INDUCED DNA FRAGMENTATION | Genes involved in Apoptosis induced DNA fragmentation |
| 7.4 | 191.6 | REACTOME DEGRADATION OF THE EXTRACELLULAR MATRIX | Genes involved in Degradation of the extracellular matrix |
| 7.3 | 138.6 | REACTOME INFLAMMASOMES | Genes involved in Inflammasomes |
| 7.1 | 120.1 | REACTOME REPAIR SYNTHESIS FOR GAP FILLING BY DNA POL IN TC NER | Genes involved in Repair synthesis for gap-filling by DNA polymerase in TC-NER |
| 6.7 | 87.0 | REACTOME HYALURONAN UPTAKE AND DEGRADATION | Genes involved in Hyaluronan uptake and degradation |
| 6.6 | 125.1 | REACTOME GENERATION OF SECOND MESSENGER MOLECULES | Genes involved in Generation of second messenger molecules |
| 6.5 | 71.5 | REACTOME SYNTHESIS OF BILE ACIDS AND BILE SALTS VIA 24 HYDROXYCHOLESTEROL | Genes involved in Synthesis of bile acids and bile salts via 24-hydroxycholesterol |
| 6.4 | 19.3 | REACTOME XENOBIOTICS | Genes involved in Xenobiotics |
| 6.4 | 44.8 | REACTOME POL SWITCHING | Genes involved in Polymerase switching |
| 6.3 | 75.7 | REACTOME IL 6 SIGNALING | Genes involved in Interleukin-6 signaling |
| 6.2 | 67.9 | REACTOME G2 M DNA DAMAGE CHECKPOINT | Genes involved in G2/M DNA damage checkpoint |
| 6.2 | 117.2 | REACTOME TCR SIGNALING | Genes involved in TCR signaling |
| 6.0 | 89.4 | REACTOME GRB2 SOS PROVIDES LINKAGE TO MAPK SIGNALING FOR INTERGRINS | Genes involved in GRB2:SOS provides linkage to MAPK signaling for Intergrins |
| 5.9 | 153.8 | REACTOME RNA POL I PROMOTER OPENING | Genes involved in RNA Polymerase I Promoter Opening |
| 5.8 | 46.7 | REACTOME NFKB ACTIVATION THROUGH FADD RIP1 PATHWAY MEDIATED BY CASPASE 8 AND10 | Genes involved in NF-kB activation through FADD/RIP-1 pathway mediated by caspase-8 and -10 |
| 5.6 | 83.3 | REACTOME GPVI MEDIATED ACTIVATION CASCADE | Genes involved in GPVI-mediated activation cascade |
| 5.5 | 87.6 | REACTOME INTRINSIC PATHWAY | Genes involved in Intrinsic Pathway |
| 5.4 | 130.4 | REACTOME FANCONI ANEMIA PATHWAY | Genes involved in Fanconi Anemia pathway |
| 5.4 | 101.8 | REACTOME IL RECEPTOR SHC SIGNALING | Genes involved in Interleukin receptor SHC signaling |
| 5.0 | 34.8 | REACTOME TRAF6 MEDIATED IRF7 ACTIVATION IN TLR7 8 OR 9 SIGNALING | Genes involved in TRAF6 mediated IRF7 activation in TLR7/8 or 9 signaling |
| 4.9 | 9.8 | REACTOME ENDOSOMAL VACUOLAR PATHWAY | Genes involved in Endosomal/Vacuolar pathway |
| 4.9 | 48.8 | REACTOME PURINE CATABOLISM | Genes involved in Purine catabolism |
| 4.8 | 38.5 | REACTOME TETRAHYDROBIOPTERIN BH4 SYNTHESIS RECYCLING SALVAGE AND REGULATION | Genes involved in Tetrahydrobiopterin (BH4) synthesis, recycling, salvage and regulation |
| 4.7 | 32.6 | REACTOME CDC6 ASSOCIATION WITH THE ORC ORIGIN COMPLEX | Genes involved in CDC6 association with the ORC:origin complex |
| 4.5 | 443.1 | REACTOME PEPTIDE CHAIN ELONGATION | Genes involved in Peptide chain elongation |
| 4.4 | 62.2 | REACTOME EICOSANOID LIGAND BINDING RECEPTORS | Genes involved in Eicosanoid ligand-binding receptors |
| 4.4 | 308.3 | REACTOME ANTIGEN PROCESSING CROSS PRESENTATION | Genes involved in Antigen processing-Cross presentation |
| 4.3 | 43.1 | REACTOME ACTIVATION OF IRF3 IRF7 MEDIATED BY TBK1 IKK EPSILON | Genes involved in Activation of IRF3/IRF7 mediated by TBK1/IKK epsilon |
| 4.2 | 46.5 | REACTOME UNWINDING OF DNA | Genes involved in Unwinding of DNA |
| 4.2 | 4.2 | REACTOME REGULATION OF INSULIN SECRETION BY ACETYLCHOLINE | Genes involved in Regulation of Insulin Secretion by Acetylcholine |
| 4.2 | 58.5 | REACTOME ACTIVATION OF THE PRE REPLICATIVE COMPLEX | Genes involved in Activation of the pre-replicative complex |
| 4.2 | 45.9 | REACTOME NUCLEOTIDE BINDING DOMAIN LEUCINE RICH REPEAT CONTAINING RECEPTOR NLR SIGNALING PATHWAYS | Genes involved in Nucleotide-binding domain, leucine rich repeat containing receptor (NLR) signaling pathways |
| 4.2 | 99.6 | REACTOME DEPOSITION OF NEW CENPA CONTAINING NUCLEOSOMES AT THE CENTROMERE | Genes involved in Deposition of New CENPA-containing Nucleosomes at the Centromere |
| 4.1 | 28.5 | REACTOME ACTIVATION OF NF KAPPAB IN B CELLS | Genes involved in Activation of NF-kappaB in B Cells |
| 4.0 | 68.4 | REACTOME METABOLISM OF PORPHYRINS | Genes involved in Metabolism of porphyrins |
| 3.9 | 23.1 | REACTOME SYNTHESIS SECRETION AND INACTIVATION OF GIP | Genes involved in Synthesis, Secretion, and Inactivation of Glucose-dependent Insulinotropic Polypeptide (GIP) |
| 3.8 | 11.4 | REACTOME INHIBITION OF REPLICATION INITIATION OF DAMAGED DNA BY RB1 E2F1 | Genes involved in Inhibition of replication initiation of damaged DNA by RB1/E2F1 |
| 3.8 | 234.3 | REACTOME PHASE II CONJUGATION | Genes involved in Phase II conjugation |
| 3.8 | 18.8 | REACTOME PLATELET SENSITIZATION BY LDL | Genes involved in Platelet sensitization by LDL |
| 3.8 | 63.8 | REACTOME FACILITATIVE NA INDEPENDENT GLUCOSE TRANSPORTERS | Genes involved in Facilitative Na+-independent glucose transporters |
| 3.7 | 29.9 | REACTOME ETHANOL OXIDATION | Genes involved in Ethanol oxidation |
| 3.7 | 291.5 | REACTOME MITOTIC PROMETAPHASE | Genes involved in Mitotic Prometaphase |
| 3.7 | 3.7 | REACTOME SPRY REGULATION OF FGF SIGNALING | Genes involved in Spry regulation of FGF signaling |
| 3.5 | 38.6 | REACTOME SLBP DEPENDENT PROCESSING OF REPLICATION DEPENDENT HISTONE PRE MRNAS | Genes involved in SLBP Dependent Processing of Replication-Dependent Histone Pre-mRNAs |
| 3.5 | 171.0 | REACTOME COSTIMULATION BY THE CD28 FAMILY | Genes involved in Costimulation by the CD28 family |
| 3.4 | 63.9 | REACTOME ANTIGEN ACTIVATES B CELL RECEPTOR LEADING TO GENERATION OF SECOND MESSENGERS | Genes involved in Antigen Activates B Cell Receptor Leading to Generation of Second Messengers |
| 3.3 | 32.6 | REACTOME GLYCOPROTEIN HORMONES | Genes involved in Glycoprotein hormones |
| 3.3 | 39.1 | REACTOME PURINE RIBONUCLEOSIDE MONOPHOSPHATE BIOSYNTHESIS | Genes involved in Purine ribonucleoside monophosphate biosynthesis |
| 3.1 | 120.4 | REACTOME INTERFERON GAMMA SIGNALING | Genes involved in Interferon gamma signaling |
| 2.9 | 17.1 | REACTOME AUTODEGRADATION OF THE E3 UBIQUITIN LIGASE COP1 | Genes involved in Autodegradation of the E3 ubiquitin ligase COP1 |
| 2.8 | 2.8 | REACTOME CONVERSION FROM APC C CDC20 TO APC C CDH1 IN LATE ANAPHASE | Genes involved in Conversion from APC/C:Cdc20 to APC/C:Cdh1 in late anaphase |
| 2.8 | 16.8 | REACTOME HORMONE LIGAND BINDING RECEPTORS | Genes involved in Hormone ligand-binding receptors |
| 2.8 | 58.3 | REACTOME DOWNREGULATION OF SMAD2 3 SMAD4 TRANSCRIPTIONAL ACTIVITY | Genes involved in Downregulation of SMAD2/3:SMAD4 transcriptional activity |
| 2.8 | 55.5 | REACTOME NEGATIVE REGULATORS OF RIG I MDA5 SIGNALING | Genes involved in Negative regulators of RIG-I/MDA5 signaling |
| 2.8 | 47.0 | REACTOME G0 AND EARLY G1 | Genes involved in G0 and Early G1 |
| 2.6 | 2.6 | REACTOME CIRCADIAN REPRESSION OF EXPRESSION BY REV ERBA | Genes involved in Circadian Repression of Expression by REV-ERBA |
| 2.6 | 89.1 | REACTOME IL1 SIGNALING | Genes involved in Interleukin-1 signaling |
| 2.5 | 27.7 | REACTOME P2Y RECEPTORS | Genes involved in P2Y receptors |
| 2.5 | 69.6 | REACTOME INTERFERON ALPHA BETA SIGNALING | Genes involved in Interferon alpha/beta signaling |
| 2.4 | 2.4 | REACTOME TRANSPORT OF MATURE MRNA DERIVED FROM AN INTRONLESS TRANSCRIPT | Genes involved in Transport of Mature mRNA Derived from an Intronless Transcript |
| 2.4 | 46.2 | REACTOME DESTABILIZATION OF MRNA BY BRF1 | Genes involved in Destabilization of mRNA by Butyrate Response Factor 1 (BRF1) |
| 2.4 | 26.0 | REACTOME EXTRINSIC PATHWAY FOR APOPTOSIS | Genes involved in Extrinsic Pathway for Apoptosis |
| 2.3 | 37.3 | REACTOME AMYLOIDS | Genes involved in Amyloids |
| 2.2 | 4.5 | REACTOME DESTABILIZATION OF MRNA BY TRISTETRAPROLIN TTP | Genes involved in Destabilization of mRNA by Tristetraprolin (TTP) |
| 2.2 | 33.3 | REACTOME VIRAL MESSENGER RNA SYNTHESIS | Genes involved in Viral Messenger RNA Synthesis |
| 2.2 | 2.2 | REACTOME INCRETIN SYNTHESIS SECRETION AND INACTIVATION | Genes involved in Incretin Synthesis, Secretion, and Inactivation |
| 2.1 | 10.7 | REACTOME SCFSKP2 MEDIATED DEGRADATION OF P27 P21 | Genes involved in SCF(Skp2)-mediated degradation of p27/p21 |
| 2.1 | 2.1 | REACTOME REMOVAL OF THE FLAP INTERMEDIATE FROM THE C STRAND | Genes involved in Removal of the Flap Intermediate from the C-strand |
| 2.1 | 50.1 | REACTOME DEADENYLATION OF MRNA | Genes involved in Deadenylation of mRNA |
| 2.0 | 55.3 | REACTOME RNA POL II TRANSCRIPTION PRE INITIATION AND PROMOTER OPENING | Genes involved in RNA Polymerase II Transcription Pre-Initiation And Promoter Opening |
| 2.0 | 19.6 | REACTOME PYRIMIDINE CATABOLISM | Genes involved in Pyrimidine catabolism |
| 1.9 | 15.0 | REACTOME OPSINS | Genes involved in Opsins |
| 1.9 | 5.6 | REACTOME LATENT INFECTION OF HOMO SAPIENS WITH MYCOBACTERIUM TUBERCULOSIS | Genes involved in Latent infection of Homo sapiens with Mycobacterium tuberculosis |
| 1.8 | 32.9 | REACTOME PROCESSING OF INTRONLESS PRE MRNAS | Genes involved in Processing of Intronless Pre-mRNAs |
| 1.8 | 18.0 | REACTOME TIE2 SIGNALING | Genes involved in Tie2 Signaling |
| 1.8 | 37.7 | REACTOME MRNA SPLICING MINOR PATHWAY | Genes involved in mRNA Splicing - Minor Pathway |
| 1.8 | 23.3 | REACTOME BASE FREE SUGAR PHOSPHATE REMOVAL VIA THE SINGLE NUCLEOTIDE REPLACEMENT PATHWAY | Genes involved in Base-free sugar-phosphate removal via the single-nucleotide replacement pathway |
| 1.8 | 3.6 | REACTOME P53 DEPENDENT G1 DNA DAMAGE RESPONSE | Genes involved in p53-Dependent G1 DNA Damage Response |
| 1.7 | 25.0 | REACTOME SIGNALING BY ILS | Genes involved in Signaling by Interleukins |
| 1.6 | 12.8 | REACTOME ALPHA LINOLENIC ACID ALA METABOLISM | Genes involved in alpha-linolenic acid (ALA) metabolism |
| 1.6 | 22.1 | REACTOME APC C CDH1 MEDIATED DEGRADATION OF CDC20 AND OTHER APC C CDH1 TARGETED PROTEINS IN LATE MITOSIS EARLY G1 | Genes involved in APC/C:Cdh1 mediated degradation of Cdc20 and other APC/C:Cdh1 targeted proteins in late mitosis/early G1 |
| 1.6 | 53.6 | REACTOME GLUCOSE TRANSPORT | Genes involved in Glucose transport |
| 1.5 | 3.1 | REACTOME SOS MEDIATED SIGNALLING | Genes involved in SOS-mediated signalling |
| 1.5 | 33.8 | REACTOME ANTIVIRAL MECHANISM BY IFN STIMULATED GENES | Genes involved in Antiviral mechanism by IFN-stimulated genes |
| 1.5 | 21.4 | REACTOME SYNTHESIS SECRETION AND DEACYLATION OF GHRELIN | Genes involved in Synthesis, Secretion, and Deacylation of Ghrelin |
| 1.5 | 197.7 | REACTOME METABOLISM OF AMINO ACIDS AND DERIVATIVES | Genes involved in Metabolism of amino acids and derivatives |
| 1.5 | 1.5 | REACTOME PLATELET ADHESION TO EXPOSED COLLAGEN | Genes involved in Platelet Adhesion to exposed collagen |
| 1.5 | 7.5 | REACTOME TRAF6 MEDIATED IRF7 ACTIVATION | Genes involved in TRAF6 mediated IRF7 activation |
| 1.5 | 44.4 | REACTOME REGULATION OF BETA CELL DEVELOPMENT | Genes involved in Regulation of beta-cell development |
| 1.4 | 4.3 | REACTOME SIGNALING BY WNT | Genes involved in Signaling by Wnt |
| 1.4 | 19.8 | REACTOME PYRIMIDINE METABOLISM | Genes involved in Pyrimidine metabolism |
| 1.4 | 15.5 | REACTOME G1 PHASE | Genes involved in G1 Phase |
| 1.4 | 82.6 | REACTOME MRNA SPLICING | Genes involved in mRNA Splicing |
| 1.4 | 5.5 | REACTOME ACYL CHAIN REMODELLING OF PI | Genes involved in Acyl chain remodelling of PI |
| 1.3 | 5.3 | REACTOME RESOLUTION OF AP SITES VIA THE SINGLE NUCLEOTIDE REPLACEMENT PATHWAY | Genes involved in Resolution of AP sites via the single-nucleotide replacement pathway |
| 1.3 | 38.3 | REACTOME METAL ION SLC TRANSPORTERS | Genes involved in Metal ion SLC transporters |
| 1.3 | 23.7 | REACTOME SRP DEPENDENT COTRANSLATIONAL PROTEIN TARGETING TO MEMBRANE | Genes involved in SRP-dependent cotranslational protein targeting to membrane |
| 1.3 | 11.6 | REACTOME HOMOLOGOUS RECOMBINATION REPAIR OF REPLICATION INDEPENDENT DOUBLE STRAND BREAKS | Genes involved in Homologous recombination repair of replication-independent double-strand breaks |
| 1.3 | 6.4 | REACTOME CYCLIN E ASSOCIATED EVENTS DURING G1 S TRANSITION | Genes involved in Cyclin E associated events during G1/S transition |
| 1.3 | 44.1 | REACTOME CELL SURFACE INTERACTIONS AT THE VASCULAR WALL | Genes involved in Cell surface interactions at the vascular wall |
| 1.3 | 25.1 | REACTOME MEIOTIC RECOMBINATION | Genes involved in Meiotic Recombination |
| 1.2 | 5.0 | REACTOME SYNTHESIS OF BILE ACIDS AND BILE SALTS VIA 7ALPHA HYDROXYCHOLESTEROL | Genes involved in Synthesis of bile acids and bile salts via 7alpha-hydroxycholesterol |
| 1.2 | 33.6 | REACTOME MEIOTIC SYNAPSIS | Genes involved in Meiotic Synapsis |
| 1.2 | 5.8 | REACTOME NUCLEOTIDE LIKE PURINERGIC RECEPTORS | Genes involved in Nucleotide-like (purinergic) receptors |
| 1.1 | 20.2 | REACTOME PRE NOTCH PROCESSING IN GOLGI | Genes involved in Pre-NOTCH Processing in Golgi |
| 1.0 | 17.8 | REACTOME ABCA TRANSPORTERS IN LIPID HOMEOSTASIS | Genes involved in ABCA transporters in lipid homeostasis |
| 1.0 | 40.1 | REACTOME AMINO ACID TRANSPORT ACROSS THE PLASMA MEMBRANE | Genes involved in Amino acid transport across the plasma membrane |
| 1.0 | 8.2 | REACTOME N GLYCAN TRIMMING IN THE ER AND CALNEXIN CALRETICULIN CYCLE | Genes involved in N-glycan trimming in the ER and Calnexin/Calreticulin cycle |
| 1.0 | 29.4 | REACTOME TRANSLATION | Genes involved in Translation |
| 1.0 | 88.3 | REACTOME FACTORS INVOLVED IN MEGAKARYOCYTE DEVELOPMENT AND PLATELET PRODUCTION | Genes involved in Factors involved in megakaryocyte development and platelet production |
| 1.0 | 12.7 | REACTOME CYTOCHROME P450 ARRANGED BY SUBSTRATE TYPE | Genes involved in Cytochrome P450 - arranged by substrate type |
| 1.0 | 8.6 | REACTOME MRNA DECAY BY 5 TO 3 EXORIBONUCLEASE | Genes involved in mRNA Decay by 5' to 3' Exoribonuclease |
| 0.9 | 0.9 | REACTOME VIF MEDIATED DEGRADATION OF APOBEC3G | Genes involved in Vif-mediated degradation of APOBEC3G |
| 0.9 | 21.6 | REACTOME LIPID DIGESTION MOBILIZATION AND TRANSPORT | Genes involved in Lipid digestion, mobilization, and transport |
| 0.9 | 12.7 | REACTOME NONSENSE MEDIATED DECAY ENHANCED BY THE EXON JUNCTION COMPLEX | Genes involved in Nonsense Mediated Decay Enhanced by the Exon Junction Complex |
| 0.9 | 12.6 | REACTOME MITOCHONDRIAL FATTY ACID BETA OXIDATION | Genes involved in Mitochondrial Fatty Acid Beta-Oxidation |
| 0.8 | 11.6 | REACTOME SYNTHESIS OF PE | Genes involved in Synthesis of PE |
| 0.8 | 12.4 | REACTOME SIGNALING BY NODAL | Genes involved in Signaling by NODAL |
| 0.8 | 25.6 | REACTOME ASSOCIATION OF TRIC CCT WITH TARGET PROTEINS DURING BIOSYNTHESIS | Genes involved in Association of TriC/CCT with target proteins during biosynthesis |
| 0.8 | 17.3 | REACTOME SMOOTH MUSCLE CONTRACTION | Genes involved in Smooth Muscle Contraction |
| 0.7 | 6.1 | REACTOME EARLY PHASE OF HIV LIFE CYCLE | Genes involved in Early Phase of HIV Life Cycle |
| 0.6 | 9.7 | REACTOME RNA POL I TRANSCRIPTION INITIATION | Genes involved in RNA Polymerase I Transcription Initiation |
| 0.6 | 19.2 | REACTOME METABOLISM OF STEROID HORMONES AND VITAMINS A AND D | Genes involved in Metabolism of steroid hormones and vitamins A and D |
| 0.6 | 3.4 | REACTOME RECEPTOR LIGAND BINDING INITIATES THE SECOND PROTEOLYTIC CLEAVAGE OF NOTCH RECEPTOR | Genes involved in Receptor-ligand binding initiates the second proteolytic cleavage of Notch receptor |
| 0.6 | 7.9 | REACTOME PERK REGULATED GENE EXPRESSION | Genes involved in PERK regulated gene expression |
| 0.5 | 1.1 | REACTOME INTERACTIONS OF VPR WITH HOST CELLULAR PROTEINS | Genes involved in Interactions of Vpr with host cellular proteins |
| 0.5 | 2.6 | REACTOME CHROMOSOME MAINTENANCE | Genes involved in Chromosome Maintenance |
| 0.5 | 7.3 | REACTOME SYNTHESIS OF PIPS AT THE EARLY ENDOSOME MEMBRANE | Genes involved in Synthesis of PIPs at the early endosome membrane |
| 0.5 | 7.9 | REACTOME SYNTHESIS OF SUBSTRATES IN N GLYCAN BIOSYTHESIS | Genes involved in Synthesis of substrates in N-glycan biosythesis |
| 0.5 | 12.8 | REACTOME CYTOSOLIC TRNA AMINOACYLATION | Genes involved in Cytosolic tRNA aminoacylation |
| 0.4 | 3.8 | REACTOME REGULATORY RNA PATHWAYS | Genes involved in Regulatory RNA pathways |
| 0.4 | 3.6 | REACTOME FORMATION OF INCISION COMPLEX IN GG NER | Genes involved in Formation of incision complex in GG-NER |
| 0.4 | 8.7 | REACTOME CHOLESTEROL BIOSYNTHESIS | Genes involved in Cholesterol biosynthesis |
| 0.4 | 19.7 | REACTOME METABOLISM OF VITAMINS AND COFACTORS | Genes involved in Metabolism of vitamins and cofactors |
| 0.4 | 2.2 | REACTOME SMAD2 SMAD3 SMAD4 HETEROTRIMER REGULATES TRANSCRIPTION | Genes involved in SMAD2/SMAD3:SMAD4 heterotrimer regulates transcription |
| 0.3 | 2.8 | REACTOME ANTIGEN PRESENTATION FOLDING ASSEMBLY AND PEPTIDE LOADING OF CLASS I MHC | Genes involved in Antigen Presentation: Folding, assembly and peptide loading of class I MHC |
| 0.3 | 4.6 | REACTOME PURINE SALVAGE | Genes involved in Purine salvage |
| 0.3 | 1.1 | REACTOME CELL CYCLE CHECKPOINTS | Genes involved in Cell Cycle Checkpoints |
| 0.3 | 2.9 | REACTOME PIP3 ACTIVATES AKT SIGNALING | Genes involved in PIP3 activates AKT signaling |
| 0.2 | 5.4 | REACTOME INTRINSIC PATHWAY FOR APOPTOSIS | Genes involved in Intrinsic Pathway for Apoptosis |
| 0.2 | 3.4 | REACTOME BIOSYNTHESIS OF THE N GLYCAN PRECURSOR DOLICHOL LIPID LINKED OLIGOSACCHARIDE LLO AND TRANSFER TO A NASCENT PROTEIN | Genes involved in Biosynthesis of the N-glycan precursor (dolichol lipid-linked oligosaccharide, LLO) and transfer to a nascent protein |
| 0.2 | 0.9 | REACTOME FGFR4 LIGAND BINDING AND ACTIVATION | Genes involved in FGFR4 ligand binding and activation |
| 0.2 | 3.1 | REACTOME DNA REPAIR | Genes involved in DNA Repair |
| 0.2 | 3.8 | REACTOME HIV LIFE CYCLE | Genes involved in HIV Life Cycle |
| 0.2 | 1.7 | REACTOME REGULATION OF RHEB GTPASE ACTIVITY BY AMPK | Genes involved in Regulation of Rheb GTPase activity by AMPK |
| 0.2 | 1.2 | REACTOME TRAFFICKING AND PROCESSING OF ENDOSOMAL TLR | Genes involved in Trafficking and processing of endosomal TLR |
| 0.2 | 1.2 | REACTOME PROLACTIN RECEPTOR SIGNALING | Genes involved in Prolactin receptor signaling |
| 0.2 | 2.3 | REACTOME SEMA4D IN SEMAPHORIN SIGNALING | Genes involved in Sema4D in semaphorin signaling |
| 0.1 | 8.4 | REACTOME RESPONSE TO ELEVATED PLATELET CYTOSOLIC CA2 | Genes involved in Response to elevated platelet cytosolic Ca2+ |
| 0.1 | 1.4 | REACTOME MRNA PROCESSING | Genes involved in mRNA Processing |
| 0.1 | 2.8 | REACTOME RNA POL III TRANSCRIPTION | Genes involved in RNA Polymerase III Transcription |
| 0.1 | 0.3 | REACTOME ACYL CHAIN REMODELLING OF PG | Genes involved in Acyl chain remodelling of PG |
| 0.0 | 0.8 | REACTOME SYNTHESIS OF PIPS AT THE PLASMA MEMBRANE | Genes involved in Synthesis of PIPs at the plasma membrane |
| 0.0 | 0.2 | REACTOME SIGNALING BY FGFR1 FUSION MUTANTS | Genes involved in Signaling by FGFR1 fusion mutants |