Project
GSE53960: rat RNA-Seq transcriptomic Bodymap
Navigation
Downloads
Results for Foxi1_Foxo1
Z-value: 0.92
Motif logo
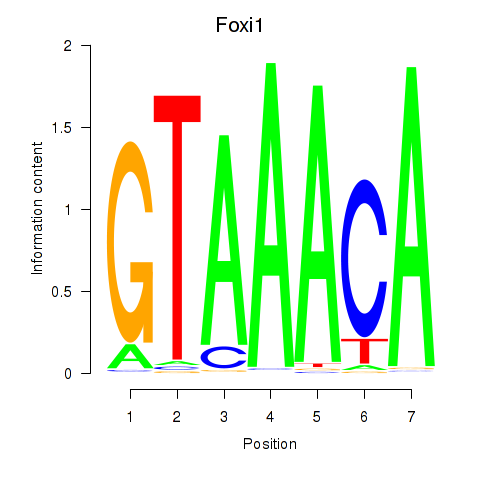
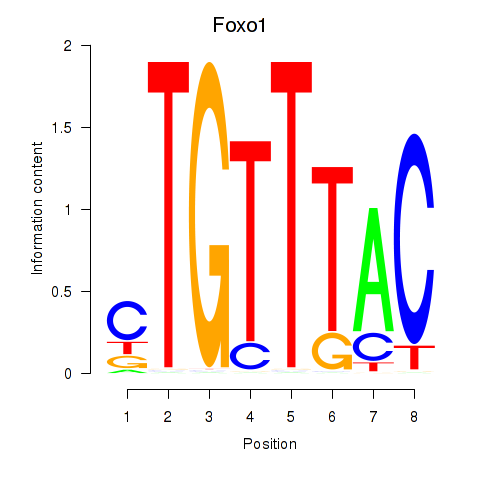
Transcription factors associated with Foxi1_Foxo1
| Gene Symbol | Gene ID | Gene Info |
|---|---|---|
|
Foxi1
|
ENSRNOG00000006293 | forkhead box I1 |
|
Foxo1
|
ENSRNOG00000013397 | forkhead box O1 |
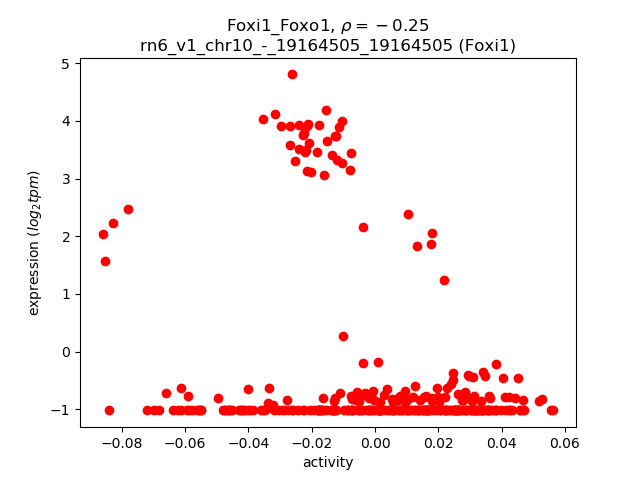
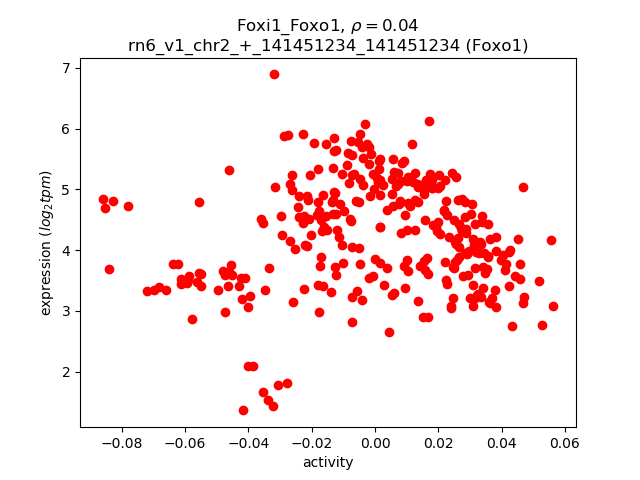
Activity-expression correlation:
| Gene | Promoter | Pearson corr. coef. | P-value | Plot |
|---|---|---|---|---|
| Foxi1 | rn6_v1_chr10_-_19164505_19164505 | -0.25 | 6.0e-06 | Click! |
| Foxo1 | rn6_v1_chr2_+_141451234_141451234 | 0.04 | 5.0e-01 | Click! |
Activity profile of Foxi1_Foxo1 motif
Sorted Z-values of Foxi1_Foxo1 motif
| Promoter | Log-likelihood | Transcript | Gene | Gene Info |
|---|---|---|---|---|
| chr4_+_14001761 | 38.57 |
ENSRNOT00000076519
|
Cd36
|
CD36 molecule |
| chr13_+_89597138 | 25.07 |
ENSRNOT00000004662
|
Apoa2
|
apolipoprotein A2 |
| chr2_-_180914940 | 24.93 |
ENSRNOT00000015732
|
Tdo2
|
tryptophan 2,3-dioxygenase |
| chr1_-_148119857 | 24.13 |
ENSRNOT00000040325
|
LOC100361547
|
Cytochrome P450, family 2, subfamily c, polypeptide 7-like |
| chr16_+_50152008 | 22.14 |
ENSRNOT00000019237
|
Klkb1
|
kallikrein B1 |
| chr7_-_119689938 | 20.37 |
ENSRNOT00000000200
|
Tmprss6
|
transmembrane protease, serine 6 |
| chr13_-_56763981 | 19.98 |
ENSRNOT00000087916
|
LOC100361907
|
complement factor H-related protein B |
| chr20_-_4863198 | 19.81 |
ENSRNOT00000001108
|
Ltb
|
lymphotoxin beta |
| chr20_+_5184515 | 19.00 |
ENSRNOT00000089411
|
LOC103694381
|
lymphotoxin-beta |
| chr1_-_48559162 | 18.67 |
ENSRNOT00000080352
|
Plg
|
plasminogen |
| chr20_-_4863011 | 18.44 |
ENSRNOT00000079503
|
Ltb
|
lymphotoxin beta |
| chr1_+_227670159 | 18.36 |
ENSRNOT00000072077
|
Ms4a6c
|
membrane-spanning 4-domains, subfamily A, member 6C |
| chr4_-_30556814 | 17.88 |
ENSRNOT00000012760
|
Pdk4
|
pyruvate dehydrogenase kinase 4 |
| chr4_+_62380914 | 17.83 |
ENSRNOT00000029845
|
Tmem140
|
transmembrane protein 140 |
| chr2_+_256964860 | 17.37 |
ENSRNOT00000073547
|
Ifi44l
|
interferon-induced protein 44-like |
| chr5_+_157282669 | 17.27 |
ENSRNOT00000022827
|
Pla2g2a
|
phospholipase A2 group IIA |
| chr2_+_54466280 | 17.00 |
ENSRNOT00000033112
|
C6
|
complement C6 |
| chr2_+_190073815 | 16.58 |
ENSRNOT00000015473
|
S100a8
|
S100 calcium binding protein A8 |
| chr4_+_69457472 | 16.58 |
ENSRNOT00000067597
|
Trbv19
|
T cell receptor beta, variable 19 |
| chr14_+_44889287 | 16.53 |
ENSRNOT00000091312
ENSRNOT00000032273 |
Tmem156
|
transmembrane protein 156 |
| chr4_+_119225040 | 16.38 |
ENSRNOT00000012365
|
Bmp10
|
bone morphogenetic protein 10 |
| chr4_-_157433467 | 16.32 |
ENSRNOT00000028965
|
Lag3
|
lymphocyte activating 3 |
| chr1_+_148240504 | 15.84 |
ENSRNOT00000085373
|
LOC100361547
|
Cytochrome P450, family 2, subfamily c, polypeptide 7-like |
| chr4_-_154855098 | 15.79 |
ENSRNOT00000041957
|
LOC297568
|
alpha-1-inhibitor III |
| chr10_-_103687425 | 14.60 |
ENSRNOT00000039284
|
Cd300lf
|
Cd300 molecule-like family member F |
| chr13_-_56877611 | 14.33 |
ENSRNOT00000079040
ENSRNOT00000017195 |
Cfhr1
|
complement factor H-related 1 |
| chr4_+_70828894 | 14.33 |
ENSRNOT00000064892
|
Trbc2
|
T cell receptor beta, constant 2 |
| chr14_+_81819799 | 14.09 |
ENSRNOT00000076840
|
Mxd4
|
Max dimerization protein 4 |
| chr5_-_76756140 | 14.01 |
ENSRNOT00000022107
ENSRNOT00000089251 |
Ptbp3
|
polypyrimidine tract binding protein 3 |
| chr13_-_47377703 | 13.85 |
ENSRNOT00000005461
|
C4bpa
|
complement component 4 binding protein, alpha |
| chr4_+_148782479 | 13.70 |
ENSRNOT00000018133
|
LOC500300
|
similar to hypothetical protein MGC6835 |
| chr4_+_102489916 | 13.62 |
ENSRNOT00000082031
|
AABR07061001.1
|
|
| chrX_-_65400298 | 13.61 |
ENSRNOT00000032121
|
Vsig4
|
V-set and immunoglobulin domain containing 4 |
| chr13_-_56693968 | 13.45 |
ENSRNOT00000060160
|
AABR07021096.1
|
|
| chr7_-_107391184 | 13.40 |
ENSRNOT00000056793
|
Tmem71
|
transmembrane protein 71 |
| chr1_-_263762785 | 13.12 |
ENSRNOT00000018221
|
Cpn1
|
carboxypeptidase N subunit 1 |
| chr11_-_32550539 | 12.90 |
ENSRNOT00000002715
|
Rcan1
|
regulator of calcineurin 1 |
| chr17_+_47870611 | 12.69 |
ENSRNOT00000078555
|
AABR07027872.1
|
|
| chr10_+_86337728 | 12.66 |
ENSRNOT00000085408
|
Tcap
|
titin-cap |
| chr10_+_96639924 | 12.63 |
ENSRNOT00000004756
|
Apoh
|
apolipoprotein H |
| chr11_+_86092468 | 12.46 |
ENSRNOT00000057971
|
LOC100361706
|
lambda-chain C1-region-like |
| chr13_-_98480419 | 12.33 |
ENSRNOT00000086306
|
Coq8a
|
coenzyme Q8A |
| chr2_+_243502073 | 12.28 |
ENSRNOT00000015870
|
Adh7
|
alcohol dehydrogenase 7 (class IV), mu or sigma polypeptide |
| chr11_-_81660395 | 11.96 |
ENSRNOT00000048739
|
Fetub
|
fetuin B |
| chr13_-_61591139 | 11.92 |
ENSRNOT00000005324
|
Rgs18
|
regulator of G-protein signaling 18 |
| chr6_-_51257625 | 11.89 |
ENSRNOT00000012004
|
Hbp1
|
HMG-box transcription factor 1 |
| chr13_+_83073866 | 11.89 |
ENSRNOT00000075996
|
Dpt
|
dermatopontin |
| chr7_+_93975451 | 11.86 |
ENSRNOT00000011379
|
Colec10
|
collectin subfamily member 10 |
| chr1_+_178039063 | 11.79 |
ENSRNOT00000046313
|
Arntl
|
aryl hydrocarbon receptor nuclear translocator-like |
| chr20_+_3176107 | 11.73 |
ENSRNOT00000001036
|
RT1-S3
|
RT1 class Ib, locus S3 |
| chr2_-_21437193 | 11.68 |
ENSRNOT00000084002
|
Ckmt2
|
creatine kinase, mitochondrial 2 |
| chr4_-_103258134 | 11.52 |
ENSRNOT00000086827
|
AABR07061052.1
|
|
| chr12_+_25498198 | 11.40 |
ENSRNOT00000076916
|
Ncf1
|
neutrophil cytosolic factor 1 |
| chr15_-_33656089 | 11.40 |
ENSRNOT00000024186
|
Myh7
|
myosin heavy chain 7 |
| chr12_+_10636275 | 11.33 |
ENSRNOT00000001285
|
Cyp3a18
|
cytochrome P450, family 3, subfamily a, polypeptide 18 |
| chr7_+_99142450 | 11.30 |
ENSRNOT00000079036
ENSRNOT00000091923 |
LOC108348266
|
cytochrome P450 2B1 |
| chr2_+_41467064 | 11.17 |
ENSRNOT00000073231
|
AABR07008066.2
|
|
| chrX_-_71169865 | 11.02 |
ENSRNOT00000050415
|
Il2rg
|
interleukin 2 receptor subunit gamma |
| chr13_+_85818427 | 10.94 |
ENSRNOT00000077227
ENSRNOT00000006117 |
Rxrg
|
retinoid X receptor gamma |
| chr10_-_57436368 | 10.82 |
ENSRNOT00000056608
|
Scimp
|
SLP adaptor and CSK interacting membrane protein |
| chr1_-_194769524 | 10.74 |
ENSRNOT00000025988
|
Nupr1
|
nuclear protein 1, transcriptional regulator |
| chr7_+_102586313 | 10.63 |
ENSRNOT00000006188
|
Myc
|
myelocytomatosis oncogene |
| chr4_-_164051812 | 10.57 |
ENSRNOT00000085719
|
AABR07062183.1
|
|
| chr4_+_153921115 | 10.51 |
ENSRNOT00000018821
|
Slc6a12
|
solute carrier family 6 member 12 |
| chr1_+_83163079 | 10.50 |
ENSRNOT00000077725
ENSRNOT00000034845 |
Cyp2b3
|
cytochrome P450, family 2, subfamily b, polypeptide 3 |
| chr4_-_115332052 | 10.47 |
ENSRNOT00000017643
|
Clec4f
|
C-type lectin domain family 4, member F |
| chr5_+_151776004 | 10.45 |
ENSRNOT00000009683
|
Nr0b2
|
nuclear receptor subfamily 0, group B, member 2 |
| chr3_+_13936783 | 10.41 |
ENSRNOT00000025501
|
RGD1564854
|
similar to divalent cation tolerant protein CUTA |
| chr3_-_91217491 | 10.40 |
ENSRNOT00000006115
|
Rag1
|
recombination activating 1 |
| chr13_-_47397890 | 10.35 |
ENSRNOT00000005505
|
C4bpb
|
complement component 4 binding protein, beta |
| chrX_+_122507374 | 10.18 |
ENSRNOT00000032275
ENSRNOT00000080517 |
Dock11
|
dedicator of cytokinesis 11 |
| chr1_+_83103925 | 10.13 |
ENSRNOT00000047540
ENSRNOT00000028196 |
Cyp2b2
|
cytochrome P450, family 2, subfamily b, polypeptide 2 |
| chr14_+_22375955 | 10.09 |
ENSRNOT00000063915
ENSRNOT00000034784 |
Ugt2b37
|
UDP-glucuronosyltransferase 2 family, member 37 |
| chr4_+_14071507 | 10.07 |
ENSRNOT00000066224
ENSRNOT00000075962 |
Cd36
RGD1565355
|
CD36 molecule similar to fatty acid translocase/CD36 |
| chr13_+_48426820 | 10.02 |
ENSRNOT00000048391
|
Ctse
|
cathepsin E |
| chr10_-_90307658 | 10.02 |
ENSRNOT00000092102
|
Slc4a1
|
solute carrier family 4 member 1 |
| chr4_-_44136815 | 9.96 |
ENSRNOT00000086810
|
Tfec
|
transcription factor EC |
| chr1_+_247228061 | 9.89 |
ENSRNOT00000020809
|
Rcl1
|
RNA terminal phosphate cyclase-like 1 |
| chr4_-_67520356 | 9.84 |
ENSRNOT00000014604
|
Braf
|
B-Raf proto-oncogene, serine/threonine kinase |
| chr7_+_99954492 | 9.79 |
ENSRNOT00000005885
|
Trib1
|
tribbles pseudokinase 1 |
| chr4_+_70572942 | 9.78 |
ENSRNOT00000051964
|
AC142181.1
|
|
| chr5_-_60191941 | 9.65 |
ENSRNOT00000033373
|
Pax5
|
paired box 5 |
| chr11_-_81639872 | 9.52 |
ENSRNOT00000047595
ENSRNOT00000090031 ENSRNOT00000081864 |
Hrg
|
histidine-rich glycoprotein |
| chr4_+_154505826 | 9.41 |
ENSRNOT00000044408
|
Mug1
|
murinoglobulin 1 |
| chr1_+_137014272 | 9.41 |
ENSRNOT00000014802
|
Akap13
|
A-kinase anchoring protein 13 |
| chr7_+_121841855 | 9.40 |
ENSRNOT00000024673
|
Grap2
|
GRB2-related adaptor protein 2 |
| chr16_+_50181316 | 9.40 |
ENSRNOT00000077662
|
F11
|
coagulation factor XI |
| chr14_+_22806132 | 9.35 |
ENSRNOT00000002728
|
Ugt2b10
|
UDP glucuronosyltransferase 2 family, polypeptide B10 |
| chr1_+_168945449 | 9.34 |
ENSRNOT00000087661
ENSRNOT00000019913 |
LOC103694855
|
hemoglobin subunit beta-2-like |
| chr3_+_72238981 | 9.32 |
ENSRNOT00000011006
|
Slc43a1
|
solute carrier family 43 member 1 |
| chr4_+_163349125 | 9.30 |
ENSRNOT00000084823
|
Klre1
|
killer cell lectin-like receptor, family E, member 1 |
| chr2_+_195617021 | 9.25 |
ENSRNOT00000067042
ENSRNOT00000036656 |
Rorc
Lingo4
|
RAR-related orphan receptor C leucine rich repeat and Ig domain containing 4 |
| chr1_-_254735548 | 9.10 |
ENSRNOT00000025258
|
Ankrd1
|
ankyrin repeat domain 1 |
| chr4_+_154215250 | 9.07 |
ENSRNOT00000072465
|
Mug2
|
murinoglobulin 2 |
| chr10_+_19366793 | 9.07 |
ENSRNOT00000050610
|
Fam196b
|
family with sequence similarity 196, member B |
| chr20_+_40778927 | 9.07 |
ENSRNOT00000001081
|
Smpdl3a
|
sphingomyelin phosphodiesterase, acid-like 3A |
| chr4_+_162541751 | 9.05 |
ENSRNOT00000010312
|
Klrb1c
|
killer cell lectin-like receptor subfamily B member 1C |
| chr5_-_124403195 | 9.03 |
ENSRNOT00000067850
|
C8a
|
complement C8 alpha chain |
| chr14_+_77067503 | 9.02 |
ENSRNOT00000085275
|
Slc2a9
|
solute carrier family 2 member 9 |
| chr3_+_16413080 | 9.02 |
ENSRNOT00000040386
|
LOC100912707
|
Ig kappa chain V19-17-like |
| chr2_-_182035032 | 9.02 |
ENSRNOT00000009813
|
Fgb
|
fibrinogen beta chain |
| chr15_+_34234755 | 8.98 |
ENSRNOT00000059987
|
Dcaf11
|
DDB1 and CUL4 associated factor 11 |
| chr15_-_29548400 | 8.95 |
ENSRNOT00000078176
|
AABR07017639.2
|
|
| chrX_+_15669191 | 8.94 |
ENSRNOT00000013553
|
Magix
|
MAGI family member, X-linked |
| chr20_+_3155652 | 8.89 |
ENSRNOT00000042882
|
RT1-S2
|
RT1 class Ib, locus S2 |
| chr3_-_160802433 | 8.83 |
ENSRNOT00000076191
|
Slpi
|
secretory leukocyte peptidase inhibitor |
| chr14_+_26662965 | 8.83 |
ENSRNOT00000002621
|
Tecrl
|
trans-2,3-enoyl-CoA reductase-like |
| chr6_+_128073344 | 8.82 |
ENSRNOT00000014073
|
LOC500712
|
Ab1-233 |
| chr1_-_197821936 | 8.79 |
ENSRNOT00000055027
|
Cd19
|
CD19 molecule |
| chr10_-_38774449 | 8.79 |
ENSRNOT00000049820
|
Leap2
|
liver-expressed antimicrobial peptide 2 |
| chr15_+_34552410 | 8.79 |
ENSRNOT00000027802
|
Khnyn
|
KH and NYN domain containing |
| chr1_-_134870255 | 8.78 |
ENSRNOT00000055829
|
Chd2
|
chromodomain helicase DNA binding protein 2 |
| chr4_-_163445302 | 8.78 |
ENSRNOT00000087106
|
Klrc3
|
killer cell lectin-like receptor subfamily C, member 3 |
| chr1_+_83933942 | 8.77 |
ENSRNOT00000068690
|
Cyp2f4
|
cytochrome P450, family 2, subfamily f, polypeptide 4 |
| chr4_+_78320190 | 8.76 |
ENSRNOT00000032742
ENSRNOT00000091359 |
Gimap4
|
GTPase, IMAP family member 4 |
| chr15_-_28104206 | 8.74 |
ENSRNOT00000032536
|
Ang2
|
angiogenin, ribonuclease A family, member 2 |
| chr7_-_2677199 | 8.72 |
ENSRNOT00000043908
|
Apon
|
apolipoprotein N |
| chr13_+_74456487 | 8.66 |
ENSRNOT00000065801
|
Angptl1
|
angiopoietin-like 1 |
| chr2_+_252452269 | 8.66 |
ENSRNOT00000021970
|
Uox
|
urate oxidase |
| chr1_+_81779380 | 8.64 |
ENSRNOT00000065865
ENSRNOT00000080143 ENSRNOT00000089592 ENSRNOT00000080840 |
Arhgef1
|
Rho guanine nucleotide exchange factor 1 |
| chr9_-_61528882 | 8.63 |
ENSRNOT00000015432
|
Ankrd44
|
ankyrin repeat domain 44 |
| chr2_+_96439286 | 8.56 |
ENSRNOT00000016091
|
Il7
|
interleukin 7 |
| chr10_-_15577977 | 8.53 |
ENSRNOT00000052292
|
Hba-a3
|
hemoglobin alpha, adult chain 3 |
| chr13_-_67688477 | 8.47 |
ENSRNOT00000068148
|
Prg4
|
proteoglycan 4 |
| chr6_+_137243185 | 8.43 |
ENSRNOT00000030879
|
Zbtb42
|
zinc finger and BTB domain containing 42 |
| chr15_+_33606124 | 8.41 |
ENSRNOT00000065210
|
AC115371.1
|
|
| chr3_-_7141522 | 8.38 |
ENSRNOT00000014572
|
Cel
|
carboxyl ester lipase |
| chr3_+_5519990 | 8.34 |
ENSRNOT00000070873
ENSRNOT00000007640 |
Adamts13
|
ADAM metallopeptidase with thrombospondin type 1 motif, 13 |
| chr7_+_60099120 | 8.31 |
ENSRNOT00000007338
|
LOC100911101
|
leucine-rich repeat-containing protein 10-like |
| chr2_-_216348194 | 8.29 |
ENSRNOT00000087839
|
LOC103689940
|
pancreatic alpha-amylase-like |
| chr4_+_14109864 | 8.24 |
ENSRNOT00000076349
|
RGD1565355
|
similar to fatty acid translocase/CD36 |
| chr13_-_91981432 | 8.20 |
ENSRNOT00000004637
|
AABR07021804.1
|
|
| chr2_-_45077219 | 8.18 |
ENSRNOT00000014319
|
Gzmk
|
granzyme K |
| chr4_+_169147243 | 8.17 |
ENSRNOT00000011580
|
Emp1
|
epithelial membrane protein 1 |
| chr11_-_87924816 | 8.16 |
ENSRNOT00000031819
|
Serpind1
|
serpin family D member 1 |
| chr7_+_118692851 | 8.12 |
ENSRNOT00000091911
|
LOC100911562
|
apolipoprotein L3-like |
| chr6_+_139486775 | 8.12 |
ENSRNOT00000077771
|
AABR07065699.3
|
|
| chr2_+_198683159 | 8.10 |
ENSRNOT00000028793
|
Txnip
|
thioredoxin interacting protein |
| chr13_-_90074952 | 8.10 |
ENSRNOT00000038006
|
Slamf7
|
SLAM family member 7 |
| chr4_+_149957206 | 8.10 |
ENSRNOT00000083843
|
Hnrnpf
|
heterogeneous nuclear ribonucleoprotein F |
| chr7_+_60087429 | 8.07 |
ENSRNOT00000073117
|
Lrrc10
|
leucine-rich repeat-containing 10 |
| chr7_+_2689501 | 8.05 |
ENSRNOT00000041341
|
Apof
|
apolipoprotein F |
| chr8_+_2659865 | 8.02 |
ENSRNOT00000088553
ENSRNOT00000010243 |
Casp12
|
caspase 12 |
| chr18_-_77317969 | 7.96 |
ENSRNOT00000090369
|
Nfatc1
|
nuclear factor of activated T-cells 1 |
| chr15_+_32811135 | 7.96 |
ENSRNOT00000067689
|
AABR07017902.1
|
|
| chr15_-_52443055 | 7.95 |
ENSRNOT00000087450
|
Xpo7
|
exportin 7 |
| chr10_+_83655460 | 7.89 |
ENSRNOT00000008011
|
Gngt2
|
G protein subunit gamma transducin 2 |
| chr1_-_198045154 | 7.87 |
ENSRNOT00000072875
|
Nupr1l1
|
nuclear protein, transcriptional regulator, 1-like 1 |
| chr17_-_42640221 | 7.86 |
ENSRNOT00000018699
|
Cmah
|
cytidine monophospho-N-acetylneuraminic acid hydroxylase |
| chr11_+_85508300 | 7.84 |
ENSRNOT00000038646
|
AABR07034730.3
|
|
| chr5_+_152533349 | 7.83 |
ENSRNOT00000067524
|
Trim63
|
tripartite motif containing 63 |
| chrX_+_14578264 | 7.83 |
ENSRNOT00000038994
|
Cybb
|
cytochrome b-245 beta chain |
| chr13_-_56958549 | 7.80 |
ENSRNOT00000017293
ENSRNOT00000083912 |
RGD1564614
|
similar to complement factor H-related protein |
| chr14_+_22251499 | 7.74 |
ENSRNOT00000087991
ENSRNOT00000002705 |
Ugt2a1
|
UDP glucuronosyltransferase 2 family, polypeptide A1 |
| chr1_-_73399579 | 7.74 |
ENSRNOT00000077186
|
Lilrb4
|
leukocyte immunoglobulin like receptor B4 |
| chr1_-_73399377 | 7.71 |
ENSRNOT00000038898
|
Lilrb4
|
leukocyte immunoglobulin like receptor B4 |
| chr1_-_258875572 | 7.69 |
ENSRNOT00000093005
|
Cyp2c13
|
cytochrome P450, family 2, subfamily c, polypeptide 13 |
| chr6_-_142903440 | 7.66 |
ENSRNOT00000075707
|
AABR07065823.2
|
|
| chr8_+_119228612 | 7.66 |
ENSRNOT00000078439
ENSRNOT00000043737 |
Lrrc2
|
leucine rich repeat containing 2 |
| chr3_-_101465995 | 7.66 |
ENSRNOT00000080175
|
Bbox1
|
gamma-butyrobetaine hydroxylase 1 |
| chr1_+_201620642 | 7.65 |
ENSRNOT00000093674
|
Dmbt1
|
deleted in malignant brain tumors 1 |
| chr2_+_193724248 | 7.64 |
ENSRNOT00000025249
|
Rptn
|
repetin |
| chr10_+_34277993 | 7.64 |
ENSRNOT00000055872
ENSRNOT00000003343 |
Ifi47
|
interferon gamma inducible protein 47 |
| chr5_-_76129441 | 7.64 |
ENSRNOT00000020335
|
Ptgr1
|
prostaglandin reductase 1 |
| chr15_+_57290849 | 7.63 |
ENSRNOT00000014909
|
Cpb2
|
carboxypeptidase B2 |
| chr6_-_77421286 | 7.63 |
ENSRNOT00000011453
|
Nkx2-1
|
NK2 homeobox 1 |
| chr13_-_80862963 | 7.63 |
ENSRNOT00000004864
|
Fmo3
|
flavin containing monooxygenase 3 |
| chr2_-_250235435 | 7.61 |
ENSRNOT00000088618
|
Lmo4
|
LIM domain only 4 |
| chrX_+_157759624 | 7.59 |
ENSRNOT00000003192
|
LOC686087
|
similar to motile sperm domain containing 1 |
| chr10_+_31880918 | 7.59 |
ENSRNOT00000059448
|
Timd4
|
T-cell immunoglobulin and mucin domain containing 4 |
| chr4_-_163402561 | 7.55 |
ENSRNOT00000091890
|
Klrk1
|
killer cell lectin like receptor K1 |
| chr10_+_56710464 | 7.54 |
ENSRNOT00000065370
ENSRNOT00000064064 |
Asgr2
|
asialoglycoprotein receptor 2 |
| chr10_+_11810926 | 7.52 |
ENSRNOT00000036205
ENSRNOT00000036189 |
Nlrc3
|
NLR family, CARD domain containing 3 |
| chr5_-_64777368 | 7.49 |
ENSRNOT00000009777
|
Baat
|
bile acid CoA:amino acid N-acyltransferase |
| chr13_+_27465930 | 7.47 |
ENSRNOT00000003314
|
Serpinb10
|
serpin family B member 10 |
| chr11_-_74315248 | 7.44 |
ENSRNOT00000002346
|
Hes1
|
hes family bHLH transcription factor 1 |
| chr20_-_48969499 | 7.43 |
ENSRNOT00000036753
|
Aim1
|
absent in melanoma 1 |
| chr14_+_91782354 | 7.41 |
ENSRNOT00000005902
|
Ikzf1
|
IKAROS family zinc finger 1 |
| chr10_-_70788309 | 7.37 |
ENSRNOT00000029184
|
Ccl9
|
chemokine (C-C motif) ligand 9 |
| chr18_-_11858744 | 7.35 |
ENSRNOT00000061417
ENSRNOT00000082891 |
Dsc2
|
desmocollin 2 |
| chr2_+_200397967 | 7.35 |
ENSRNOT00000025821
|
Reg4
|
regenerating family member 4 |
| chr18_-_25344614 | 7.32 |
ENSRNOT00000046369
|
Gypc
|
glycophorin C (Gerbich blood group) |
| chr3_-_80012750 | 7.32 |
ENSRNOT00000018154
|
Nr1h3
|
nuclear receptor subfamily 1, group H, member 3 |
| chr1_-_219312240 | 7.32 |
ENSRNOT00000066691
|
RGD1307603
|
similar to hypothetical protein MGC37914 |
| chr4_+_109497962 | 7.31 |
ENSRNOT00000057869
|
Reg1a
|
regenerating family member 1 alpha |
| chr6_-_78549669 | 7.31 |
ENSRNOT00000009940
|
Foxa1
|
forkhead box A1 |
| chr4_-_163403653 | 7.17 |
ENSRNOT00000088151
|
Klrk1
|
killer cell lectin like receptor K1 |
| chr20_-_49486550 | 7.07 |
ENSRNOT00000048270
ENSRNOT00000076541 |
Prdm1
|
PR/SET domain 1 |
| chr5_-_58198782 | 7.03 |
ENSRNOT00000023951
|
Ccl21
|
C-C motif chemokine ligand 21 |
| chr10_+_108132105 | 7.03 |
ENSRNOT00000072534
|
Cbx2
|
chromobox 2 |
| chr20_-_4390436 | 7.00 |
ENSRNOT00000000497
ENSRNOT00000077655 |
Ppt2
|
palmitoyl-protein thioesterase 2 |
| chr6_-_140880070 | 6.99 |
ENSRNOT00000073779
|
LOC691828
|
uncharacterized LOC691828 |
| chr7_+_120580743 | 6.98 |
ENSRNOT00000017181
|
Maff
|
MAF bZIP transcription factor F |
| chr15_-_23969011 | 6.98 |
ENSRNOT00000014821
|
Gch1
|
GTP cyclohydrolase 1 |
| chr6_+_77608624 | 6.96 |
ENSRNOT00000011802
|
Pax9
|
paired box 9 |
| chr4_-_100252755 | 6.94 |
ENSRNOT00000017301
|
Vamp8
|
vesicle-associated membrane protein 8 |
| chr11_+_60336061 | 6.90 |
ENSRNOT00000084022
|
LOC685767
|
similar to OX-2 membrane glycoprotein precursor (MRC OX-2 antigen) (CD200 antigen) |
| chr1_+_83003841 | 6.88 |
ENSRNOT00000057384
|
Ceacam4
|
carcinoembryonic antigen-related cell adhesion molecule 4 |
| chr8_-_85645718 | 6.87 |
ENSRNOT00000032185
|
Gsta2
|
glutathione S-transferase alpha 2 |
| chr11_+_60253935 | 6.85 |
ENSRNOT00000093526
|
LOC685716
|
similar to OX-2 membrane glycoprotein precursor (MRC OX-2 antigen) (CD200 antigen) |
Network of associatons between targets according to the STRING database.

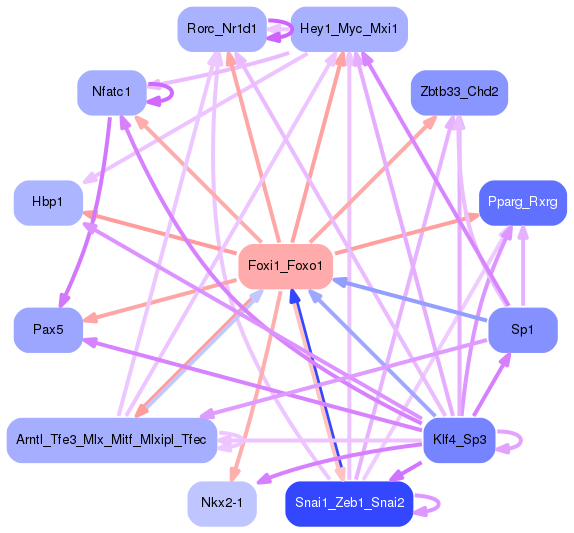
First level regulatory network of Foxi1_Foxo1
Gene Ontology Analysis
Gene overrepresentation in biological process category:
| Log-likelihood per target | Total log-likelihood | Term | Description |
|---|---|---|---|
| 8.4 | 25.1 | GO:0010903 | negative regulation of very-low-density lipoprotein particle remodeling(GO:0010903) diacylglycerol catabolic process(GO:0046340) |
| 8.1 | 48.6 | GO:2000332 | blood microparticle formation(GO:0072564) regulation of blood microparticle formation(GO:2000332) positive regulation of blood microparticle formation(GO:2000334) |
| 8.1 | 24.2 | GO:0045959 | negative regulation of complement activation, classical pathway(GO:0045959) |
| 8.0 | 24.0 | GO:0002223 | stimulatory C-type lectin receptor signaling pathway(GO:0002223) |
| 7.2 | 50.2 | GO:0051919 | positive regulation of fibrinolysis(GO:0051919) |
| 5.7 | 17.0 | GO:0001969 | activation of membrane attack complex(GO:0001905) regulation of activation of membrane attack complex(GO:0001969) |
| 4.9 | 29.3 | GO:0051918 | negative regulation of fibrinolysis(GO:0051918) |
| 4.9 | 14.6 | GO:1902214 | regulation of interleukin-4-mediated signaling pathway(GO:1902214) negative regulation of apoptotic cell clearance(GO:2000426) |
| 4.7 | 18.8 | GO:0010510 | regulation of acetyl-CoA biosynthetic process from pyruvate(GO:0010510) |
| 4.4 | 17.6 | GO:0035995 | detection of muscle stretch(GO:0035995) |
| 4.3 | 17.2 | GO:0045658 | regulation of neutrophil differentiation(GO:0045658) |
| 3.9 | 11.7 | GO:0002489 | antigen processing and presentation of endogenous peptide antigen via MHC class Ib via ER pathway(GO:0002488) antigen processing and presentation of endogenous peptide antigen via MHC class Ib via ER pathway, TAP-dependent(GO:0002489) TRAIL production(GO:0032639) regulation of TRAIL production(GO:0032679) positive regulation of TRAIL production(GO:0032759) |
| 3.8 | 15.3 | GO:0002331 | pre-B cell allelic exclusion(GO:0002331) |
| 3.8 | 11.4 | GO:0070946 | neutrophil mediated killing of gram-positive bacterium(GO:0070946) |
| 3.8 | 11.4 | GO:0031444 | slow-twitch skeletal muscle fiber contraction(GO:0031444) response to 3,3',5-triiodo-L-thyronine(GO:1905242) cellular response to 3,3',5-triiodo-L-thyronine(GO:1905243) |
| 3.7 | 14.7 | GO:0051142 | regulation of NK T cell proliferation(GO:0051140) positive regulation of NK T cell proliferation(GO:0051142) |
| 3.6 | 24.9 | GO:0019441 | tryptophan catabolic process to kynurenine(GO:0019441) |
| 3.5 | 10.6 | GO:0090094 | metanephric cap development(GO:0072185) metanephric cap morphogenesis(GO:0072186) metanephric cap mesenchymal cell proliferation involved in metanephros development(GO:0090094) response to putrescine(GO:1904585) cellular response to putrescine(GO:1904586) |
| 3.4 | 6.8 | GO:0003162 | atrioventricular node development(GO:0003162) |
| 3.3 | 16.3 | GO:0045085 | negative regulation of interleukin-2 biosynthetic process(GO:0045085) |
| 3.2 | 87.7 | GO:0019373 | epoxygenase P450 pathway(GO:0019373) |
| 3.0 | 15.2 | GO:1900169 | regulation of glucocorticoid mediated signaling pathway(GO:1900169) |
| 2.9 | 5.8 | GO:0021698 | cerebellar cortex structural organization(GO:0021698) |
| 2.8 | 19.5 | GO:0045084 | positive regulation of interleukin-12 biosynthetic process(GO:0045084) |
| 2.7 | 29.4 | GO:0042730 | fibrinolysis(GO:0042730) |
| 2.7 | 10.6 | GO:0032687 | negative regulation of interferon-alpha production(GO:0032687) |
| 2.6 | 10.5 | GO:0009992 | cellular water homeostasis(GO:0009992) |
| 2.6 | 13.1 | GO:0030070 | insulin processing(GO:0030070) |
| 2.6 | 10.5 | GO:0051725 | protein de-ADP-ribosylation(GO:0051725) |
| 2.6 | 2.6 | GO:0002835 | negative regulation of response to tumor cell(GO:0002835) negative regulation of immune response to tumor cell(GO:0002838) negative regulation of natural killer cell mediated immune response to tumor cell(GO:0002856) negative regulation of natural killer cell mediated cytotoxicity directed against tumor cell target(GO:0002859) |
| 2.6 | 7.8 | GO:0006116 | NADH oxidation(GO:0006116) |
| 2.6 | 7.8 | GO:1904845 | response to L-glutamine(GO:1904844) cellular response to L-glutamine(GO:1904845) |
| 2.5 | 12.6 | GO:0010037 | response to carbon dioxide(GO:0010037) |
| 2.5 | 7.5 | GO:0035606 | peptidyl-cysteine S-trans-nitrosylation(GO:0035606) |
| 2.5 | 7.4 | GO:0021558 | trochlear nerve development(GO:0021558) auditory receptor cell fate determination(GO:0042668) negative regulation of auditory receptor cell differentiation(GO:0045608) negative regulation of pro-B cell differentiation(GO:2000974) negative regulation of forebrain neuron differentiation(GO:2000978) |
| 2.4 | 9.8 | GO:0016240 | autophagosome docking(GO:0016240) |
| 2.4 | 4.9 | GO:0072363 | regulation of glycolytic process by positive regulation of transcription from RNA polymerase II promoter(GO:0072363) |
| 2.4 | 7.3 | GO:1990868 | response to chemokine(GO:1990868) cellular response to chemokine(GO:1990869) |
| 2.4 | 9.7 | GO:1903576 | response to L-arginine(GO:1903576) |
| 2.4 | 12.2 | GO:0060298 | positive regulation of sarcomere organization(GO:0060298) |
| 2.4 | 14.6 | GO:0006069 | ethanol oxidation(GO:0006069) |
| 2.4 | 16.8 | GO:0090403 | oxidative stress-induced premature senescence(GO:0090403) |
| 2.4 | 4.8 | GO:0034125 | negative regulation of MyD88-dependent toll-like receptor signaling pathway(GO:0034125) |
| 2.3 | 7.0 | GO:0035759 | mesangial cell-matrix adhesion(GO:0035759) |
| 2.3 | 7.0 | GO:0014916 | regulation of lung blood pressure(GO:0014916) |
| 2.3 | 6.8 | GO:0006574 | valine catabolic process(GO:0006574) |
| 2.3 | 15.8 | GO:0032831 | regulation of CD4-positive, CD25-positive, alpha-beta regulatory T cell differentiation(GO:0032829) positive regulation of CD4-positive, CD25-positive, alpha-beta regulatory T cell differentiation(GO:0032831) |
| 2.2 | 6.7 | GO:2000660 | negative regulation of interleukin-1-mediated signaling pathway(GO:2000660) |
| 2.2 | 11.2 | GO:0060741 | prostate gland stromal morphogenesis(GO:0060741) |
| 2.2 | 13.3 | GO:0002315 | marginal zone B cell differentiation(GO:0002315) |
| 2.2 | 4.4 | GO:2000449 | regulation of CD8-positive, alpha-beta T cell extravasation(GO:2000449) |
| 2.1 | 6.3 | GO:1904879 | positive regulation of calcium ion transmembrane transport via high voltage-gated calcium channel(GO:1904879) |
| 2.1 | 10.5 | GO:0034287 | detection of carbohydrate stimulus(GO:0009730) detection of hexose stimulus(GO:0009732) detection of monosaccharide stimulus(GO:0034287) detection of glucose(GO:0051594) |
| 2.1 | 10.5 | GO:0051132 | NK T cell activation(GO:0051132) |
| 2.1 | 6.2 | GO:2000620 | positive regulation of histone H4-K16 acetylation(GO:2000620) |
| 2.0 | 12.2 | GO:0072615 | interleukin-17 secretion(GO:0072615) |
| 2.0 | 20.3 | GO:0002318 | myeloid progenitor cell differentiation(GO:0002318) |
| 2.0 | 6.1 | GO:0035054 | embryonic heart tube anterior/posterior pattern specification(GO:0035054) corticotropin hormone secreting cell differentiation(GO:0060128) |
| 2.0 | 16.2 | GO:0086073 | bundle of His cell-Purkinje myocyte adhesion involved in cell communication(GO:0086073) |
| 2.0 | 28.3 | GO:0015671 | oxygen transport(GO:0015671) |
| 2.0 | 8.0 | GO:0002337 | B-1a B cell differentiation(GO:0002337) |
| 2.0 | 15.8 | GO:0001810 | regulation of type I hypersensitivity(GO:0001810) type I hypersensitivity(GO:0016068) |
| 1.9 | 11.7 | GO:0006207 | 'de novo' pyrimidine nucleobase biosynthetic process(GO:0006207) pyrimidine nucleobase biosynthetic process(GO:0019856) |
| 1.9 | 7.7 | GO:0034240 | negative regulation of macrophage fusion(GO:0034240) |
| 1.9 | 18.9 | GO:0043249 | erythrocyte maturation(GO:0043249) |
| 1.9 | 9.4 | GO:0014878 | response to electrical stimulus involved in regulation of muscle adaptation(GO:0014878) |
| 1.8 | 5.5 | GO:0007597 | blood coagulation, intrinsic pathway(GO:0007597) |
| 1.8 | 5.3 | GO:1903769 | negative regulation of cell proliferation in bone marrow(GO:1903769) negative regulation of immunological synapse formation(GO:2000521) negative regulation of T cell activation via T cell receptor contact with antigen bound to MHC molecule on antigen presenting cell(GO:2001189) |
| 1.8 | 5.3 | GO:0071395 | response to jasmonic acid(GO:0009753) cellular response to jasmonic acid stimulus(GO:0071395) |
| 1.7 | 10.5 | GO:0033227 | dsRNA transport(GO:0033227) |
| 1.7 | 20.9 | GO:0006968 | cellular defense response(GO:0006968) |
| 1.7 | 3.4 | GO:0032489 | regulation of Cdc42 protein signal transduction(GO:0032489) |
| 1.7 | 8.5 | GO:0045409 | negative regulation of interleukin-6 biosynthetic process(GO:0045409) |
| 1.7 | 11.7 | GO:0070269 | pyroptosis(GO:0070269) |
| 1.7 | 3.3 | GO:0043152 | induction of bacterial agglutination(GO:0043152) |
| 1.7 | 3.3 | GO:0034165 | positive regulation of toll-like receptor 9 signaling pathway(GO:0034165) |
| 1.6 | 4.9 | GO:0019677 | NAD catabolic process(GO:0019677) |
| 1.6 | 6.5 | GO:0019853 | L-ascorbic acid biosynthetic process(GO:0019853) |
| 1.6 | 8.2 | GO:2000258 | negative regulation of complement activation(GO:0045916) negative regulation of protein activation cascade(GO:2000258) |
| 1.6 | 25.6 | GO:0032703 | negative regulation of interleukin-2 production(GO:0032703) |
| 1.6 | 3.2 | GO:1990169 | detoxification of copper ion(GO:0010273) stress response to copper ion(GO:1990169) |
| 1.6 | 3.1 | GO:2001187 | positive regulation of CD8-positive, alpha-beta T cell activation(GO:2001187) |
| 1.6 | 3.1 | GO:1903116 | positive regulation of actin filament-based movement(GO:1903116) |
| 1.6 | 4.7 | GO:0006663 | platelet activating factor biosynthetic process(GO:0006663) |
| 1.5 | 9.3 | GO:0010360 | negative regulation of anion channel activity(GO:0010360) |
| 1.5 | 3.1 | GO:0003430 | growth plate cartilage chondrocyte growth(GO:0003430) |
| 1.5 | 4.6 | GO:0015014 | heparan sulfate proteoglycan biosynthetic process, polysaccharide chain biosynthetic process(GO:0015014) |
| 1.5 | 9.2 | GO:0042483 | negative regulation of odontogenesis(GO:0042483) |
| 1.5 | 4.6 | GO:0001574 | ganglioside biosynthetic process(GO:0001574) |
| 1.5 | 4.6 | GO:0032290 | peripheral nervous system myelin formation(GO:0032290) |
| 1.5 | 6.0 | GO:2000973 | regulation of pro-B cell differentiation(GO:2000973) |
| 1.5 | 3.0 | GO:0003250 | cell proliferation involved in heart valve morphogenesis(GO:0003249) regulation of cell proliferation involved in heart valve morphogenesis(GO:0003250) |
| 1.5 | 4.5 | GO:1902263 | apoptotic process involved in embryonic digit morphogenesis(GO:1902263) |
| 1.5 | 8.9 | GO:0001561 | fatty acid alpha-oxidation(GO:0001561) |
| 1.5 | 8.9 | GO:0000480 | endonucleolytic cleavage in 5'-ETS of tricistronic rRNA transcript (SSU-rRNA, 5.8S rRNA, LSU-rRNA)(GO:0000480) |
| 1.5 | 17.7 | GO:0016540 | protein autoprocessing(GO:0016540) |
| 1.5 | 4.4 | GO:0034395 | regulation of transcription from RNA polymerase II promoter in response to iron(GO:0034395) |
| 1.5 | 7.3 | GO:0010887 | negative regulation of cholesterol storage(GO:0010887) negative regulation of pinocytosis(GO:0048550) |
| 1.4 | 5.8 | GO:0032819 | positive regulation of natural killer cell proliferation(GO:0032819) development of secondary male sexual characteristics(GO:0046544) |
| 1.4 | 17.1 | GO:0042178 | xenobiotic catabolic process(GO:0042178) |
| 1.4 | 7.1 | GO:0051136 | regulation of NK T cell differentiation(GO:0051136) |
| 1.4 | 4.2 | GO:0009177 | pyrimidine deoxyribonucleoside monophosphate biosynthetic process(GO:0009177) |
| 1.4 | 4.1 | GO:0009609 | response to symbiotic bacterium(GO:0009609) |
| 1.4 | 4.1 | GO:0034444 | regulation of plasma lipoprotein particle oxidation(GO:0034444) negative regulation of plasma lipoprotein particle oxidation(GO:0034445) |
| 1.4 | 2.7 | GO:0001803 | type III hypersensitivity(GO:0001802) regulation of type III hypersensitivity(GO:0001803) positive regulation of type III hypersensitivity(GO:0001805) |
| 1.4 | 8.2 | GO:2001269 | positive regulation of cysteine-type endopeptidase activity involved in apoptotic signaling pathway(GO:2001269) |
| 1.4 | 4.1 | GO:0061146 | Peyer's patch morphogenesis(GO:0061146) |
| 1.3 | 18.9 | GO:0016127 | cholesterol catabolic process(GO:0006707) sterol catabolic process(GO:0016127) |
| 1.3 | 2.7 | GO:1901492 | positive regulation of lymphangiogenesis(GO:1901492) |
| 1.3 | 13.3 | GO:0045591 | positive regulation of regulatory T cell differentiation(GO:0045591) |
| 1.3 | 3.9 | GO:0048014 | Tie signaling pathway(GO:0048014) |
| 1.3 | 1.3 | GO:0001998 | angiotensin mediated vasoconstriction involved in regulation of systemic arterial blood pressure(GO:0001998) |
| 1.3 | 9.1 | GO:0006685 | sphingomyelin catabolic process(GO:0006685) |
| 1.3 | 5.2 | GO:0046985 | positive regulation of hemoglobin biosynthetic process(GO:0046985) |
| 1.3 | 3.9 | GO:0038163 | thrombopoietin-mediated signaling pathway(GO:0038163) |
| 1.3 | 3.9 | GO:1901844 | regulation of cell communication by electrical coupling involved in cardiac conduction(GO:1901844) calcium ion import into sarcoplasmic reticulum(GO:1990036) |
| 1.3 | 3.8 | GO:0071409 | cellular response to cycloheximide(GO:0071409) |
| 1.3 | 7.7 | GO:0045329 | carnitine biosynthetic process(GO:0045329) |
| 1.3 | 7.6 | GO:0021759 | globus pallidus development(GO:0021759) |
| 1.3 | 10.1 | GO:0070236 | negative regulation of activation-induced cell death of T cells(GO:0070236) |
| 1.2 | 6.2 | GO:2000427 | positive regulation of apoptotic cell clearance(GO:2000427) |
| 1.2 | 6.2 | GO:0032929 | negative regulation of superoxide anion generation(GO:0032929) |
| 1.2 | 4.9 | GO:0090154 | positive regulation of sphingolipid biosynthetic process(GO:0090154) positive regulation of ceramide biosynthetic process(GO:2000304) |
| 1.2 | 4.9 | GO:0044268 | multicellular organismal protein metabolic process(GO:0044268) |
| 1.2 | 7.2 | GO:0098909 | regulation of cardiac muscle cell action potential involved in regulation of contraction(GO:0098909) |
| 1.2 | 3.6 | GO:0038172 | interleukin-33-mediated signaling pathway(GO:0038172) |
| 1.2 | 6.0 | GO:0030916 | otic vesicle formation(GO:0030916) |
| 1.2 | 3.6 | GO:0002729 | positive regulation of natural killer cell cytokine production(GO:0002729) |
| 1.2 | 3.5 | GO:2000422 | regulation of eosinophil chemotaxis(GO:2000422) positive regulation of eosinophil chemotaxis(GO:2000424) |
| 1.2 | 4.7 | GO:0021797 | forebrain anterior/posterior pattern specification(GO:0021797) |
| 1.2 | 5.9 | GO:0001582 | detection of chemical stimulus involved in sensory perception of sweet taste(GO:0001582) |
| 1.2 | 9.2 | GO:0097327 | response to antineoplastic agent(GO:0097327) |
| 1.1 | 11.5 | GO:0006145 | purine nucleobase catabolic process(GO:0006145) |
| 1.1 | 3.4 | GO:2001183 | negative regulation of interleukin-12 secretion(GO:2001183) |
| 1.1 | 3.4 | GO:0045210 | FasL biosynthetic process(GO:0045210) |
| 1.1 | 4.5 | GO:1902966 | regulation of protein localization to early endosome(GO:1902965) positive regulation of protein localization to early endosome(GO:1902966) |
| 1.1 | 6.8 | GO:0006642 | triglyceride mobilization(GO:0006642) |
| 1.1 | 6.7 | GO:1990785 | response to water-immersion restraint stress(GO:1990785) |
| 1.1 | 4.4 | GO:0014028 | notochord formation(GO:0014028) |
| 1.1 | 16.6 | GO:0002523 | leukocyte migration involved in inflammatory response(GO:0002523) |
| 1.1 | 17.3 | GO:0046473 | phosphatidic acid metabolic process(GO:0046473) |
| 1.1 | 4.3 | GO:1903575 | cornified envelope assembly(GO:1903575) |
| 1.1 | 5.3 | GO:0008582 | regulation of synaptic growth at neuromuscular junction(GO:0008582) |
| 1.1 | 3.2 | GO:0000738 | DNA catabolic process, exonucleolytic(GO:0000738) |
| 1.0 | 3.1 | GO:0033364 | mast cell secretory granule organization(GO:0033364) |
| 1.0 | 2.0 | GO:0061181 | regulation of chondrocyte development(GO:0061181) |
| 1.0 | 3.1 | GO:0006121 | mitochondrial electron transport, succinate to ubiquinone(GO:0006121) |
| 1.0 | 3.1 | GO:2000661 | positive regulation of interleukin-1-mediated signaling pathway(GO:2000661) |
| 1.0 | 3.0 | GO:2000705 | regulation of dense core granule biogenesis(GO:2000705) |
| 1.0 | 17.0 | GO:0060218 | hematopoietic stem cell differentiation(GO:0060218) |
| 1.0 | 5.0 | GO:0006032 | chitin metabolic process(GO:0006030) chitin catabolic process(GO:0006032) |
| 1.0 | 13.0 | GO:2000194 | regulation of female gonad development(GO:2000194) |
| 1.0 | 4.0 | GO:0072378 | blood coagulation, fibrin clot formation(GO:0072378) |
| 1.0 | 4.9 | GO:0043091 | regulation of amino acid import(GO:0010958) L-arginine import(GO:0043091) arginine import(GO:0090467) L-arginine transport(GO:1902023) |
| 0.9 | 3.8 | GO:0016554 | mRNA localization resulting in posttranscriptional regulation of gene expression(GO:0010609) cytidine to uridine editing(GO:0016554) |
| 0.9 | 2.8 | GO:1901726 | negative regulation of histone deacetylase activity(GO:1901726) |
| 0.9 | 0.9 | GO:0050713 | negative regulation of interleukin-1 beta secretion(GO:0050713) |
| 0.9 | 3.7 | GO:1904177 | regulation of adipose tissue development(GO:1904177) |
| 0.9 | 5.5 | GO:0061737 | leukotriene signaling pathway(GO:0061737) |
| 0.9 | 2.7 | GO:0070602 | regulation of centromeric sister chromatid cohesion(GO:0070602) |
| 0.9 | 2.7 | GO:0036451 | cap mRNA methylation(GO:0036451) |
| 0.9 | 2.7 | GO:0042125 | protein glycosylation at cell surface(GO:0033575) protein galactosylation at cell surface(GO:0033580) protein galactosylation(GO:0042125) |
| 0.9 | 14.6 | GO:0032060 | bleb assembly(GO:0032060) |
| 0.9 | 4.5 | GO:0030449 | regulation of complement activation(GO:0030449) |
| 0.9 | 5.4 | GO:0010764 | negative regulation of fibroblast migration(GO:0010764) |
| 0.9 | 1.8 | GO:0032789 | saturated monocarboxylic acid metabolic process(GO:0032788) unsaturated monocarboxylic acid metabolic process(GO:0032789) |
| 0.9 | 14.4 | GO:0021527 | spinal cord association neuron differentiation(GO:0021527) |
| 0.9 | 4.5 | GO:0051541 | elastin metabolic process(GO:0051541) |
| 0.9 | 3.6 | GO:0090118 | receptor-mediated endocytosis of low-density lipoprotein particle involved in cholesterol transport(GO:0090118) |
| 0.9 | 7.0 | GO:0098734 | macromolecule depalmitoylation(GO:0098734) |
| 0.9 | 2.6 | GO:0061188 | negative regulation of chromatin silencing at rDNA(GO:0061188) |
| 0.9 | 13.8 | GO:1901663 | ubiquinone biosynthetic process(GO:0006744) quinone biosynthetic process(GO:1901663) |
| 0.9 | 2.6 | GO:0009227 | nucleotide-sugar catabolic process(GO:0009227) |
| 0.9 | 11.2 | GO:0052695 | uronic acid metabolic process(GO:0006063) glucuronate metabolic process(GO:0019585) cellular glucuronidation(GO:0052695) |
| 0.9 | 4.3 | GO:1904732 | regulation of electron carrier activity(GO:1904732) |
| 0.9 | 4.3 | GO:0002457 | T cell antigen processing and presentation(GO:0002457) |
| 0.8 | 5.1 | GO:0016560 | protein import into peroxisome matrix, docking(GO:0016560) |
| 0.8 | 1.7 | GO:0003357 | noradrenergic neuron differentiation(GO:0003357) medulla oblongata development(GO:0021550) |
| 0.8 | 3.4 | GO:0061641 | CENP-A containing nucleosome assembly(GO:0034080) CENP-A containing chromatin organization(GO:0061641) |
| 0.8 | 5.0 | GO:0071314 | cellular response to cocaine(GO:0071314) |
| 0.8 | 7.5 | GO:0019530 | taurine metabolic process(GO:0019530) |
| 0.8 | 6.6 | GO:0014807 | regulation of somitogenesis(GO:0014807) |
| 0.8 | 6.6 | GO:0006975 | DNA damage induced protein phosphorylation(GO:0006975) |
| 0.8 | 2.5 | GO:0060383 | positive regulation of DNA strand elongation(GO:0060383) |
| 0.8 | 4.1 | GO:0060315 | negative regulation of ryanodine-sensitive calcium-release channel activity(GO:0060315) |
| 0.8 | 2.5 | GO:0021569 | rhombomere 3 development(GO:0021569) rhombomere 4 development(GO:0021570) |
| 0.8 | 5.7 | GO:0071169 | establishment of protein localization to chromatin(GO:0071169) |
| 0.8 | 4.0 | GO:0002003 | angiotensin maturation(GO:0002003) |
| 0.8 | 4.0 | GO:0021650 | vestibulocochlear nerve formation(GO:0021650) |
| 0.8 | 4.8 | GO:0050747 | positive regulation of lipoprotein metabolic process(GO:0050747) |
| 0.8 | 3.2 | GO:0034154 | toll-like receptor 7 signaling pathway(GO:0034154) |
| 0.8 | 2.3 | GO:0044726 | protection of DNA demethylation of female pronucleus(GO:0044726) |
| 0.8 | 2.3 | GO:0016267 | O-glycan processing, core 1(GO:0016267) |
| 0.8 | 3.8 | GO:1904970 | brush border assembly(GO:1904970) |
| 0.8 | 3.1 | GO:1902947 | regulation of tau-protein kinase activity(GO:1902947) |
| 0.8 | 3.8 | GO:0031055 | chromatin remodeling at centromere(GO:0031055) pericentric heterochromatin assembly(GO:0031508) |
| 0.8 | 7.6 | GO:0043374 | CD8-positive, alpha-beta T cell differentiation(GO:0043374) |
| 0.8 | 6.1 | GO:0060136 | embryonic process involved in female pregnancy(GO:0060136) |
| 0.8 | 6.1 | GO:1903546 | protein localization to photoreceptor outer segment(GO:1903546) |
| 0.8 | 2.3 | GO:0000715 | nucleotide-excision repair, DNA damage recognition(GO:0000715) |
| 0.7 | 2.2 | GO:0033123 | positive regulation of purine nucleotide catabolic process(GO:0033123) |
| 0.7 | 3.7 | GO:0070318 | positive regulation of G0 to G1 transition(GO:0070318) |
| 0.7 | 4.4 | GO:0050882 | voluntary musculoskeletal movement(GO:0050882) embryonic retina morphogenesis in camera-type eye(GO:0060059) |
| 0.7 | 3.0 | GO:0048252 | lauric acid metabolic process(GO:0048252) |
| 0.7 | 8.1 | GO:0002347 | response to tumor cell(GO:0002347) |
| 0.7 | 14.6 | GO:0001833 | inner cell mass cell proliferation(GO:0001833) |
| 0.7 | 1.4 | GO:1901166 | trunk segmentation(GO:0035290) trunk neural crest cell migration(GO:0036484) ventral trunk neural crest cell migration(GO:0036486) sympathetic neuron projection extension(GO:0097490) sympathetic neuron projection guidance(GO:0097491) neural crest cell migration involved in autonomic nervous system development(GO:1901166) |
| 0.7 | 2.9 | GO:1904823 | purine nucleobase transmembrane transport(GO:1904823) |
| 0.7 | 2.2 | GO:2000318 | positive regulation of T-helper 17 type immune response(GO:2000318) |
| 0.7 | 2.1 | GO:0071921 | establishment of sister chromatid cohesion(GO:0034085) cohesin loading(GO:0071921) regulation of cohesin loading(GO:0071922) |
| 0.7 | 5.0 | GO:0045654 | positive regulation of megakaryocyte differentiation(GO:0045654) |
| 0.7 | 1.4 | GO:0075509 | receptor-mediated endocytosis of virus by host cell(GO:0019065) endocytosis involved in viral entry into host cell(GO:0075509) |
| 0.7 | 2.1 | GO:0098507 | polynucleotide 5' dephosphorylation(GO:0098507) |
| 0.7 | 9.8 | GO:0051573 | negative regulation of histone H3-K9 methylation(GO:0051573) |
| 0.7 | 2.1 | GO:1904569 | regulation of selenocysteine incorporation(GO:1904569) |
| 0.7 | 6.3 | GO:0015747 | urate transport(GO:0015747) |
| 0.7 | 2.1 | GO:0035700 | astrocyte chemotaxis(GO:0035700) regulation of astrocyte chemotaxis(GO:2000458) |
| 0.7 | 2.0 | GO:0097460 | ferrous iron import into cell(GO:0097460) ferrous iron import across plasma membrane(GO:0098707) |
| 0.7 | 2.0 | GO:1904211 | membrane protein proteolysis involved in retrograde protein transport, ER to cytosol(GO:1904211) |
| 0.7 | 5.4 | GO:0002863 | positive regulation of inflammatory response to antigenic stimulus(GO:0002863) |
| 0.7 | 2.7 | GO:0046061 | dATP catabolic process(GO:0046061) |
| 0.7 | 2.6 | GO:0006104 | succinyl-CoA metabolic process(GO:0006104) |
| 0.7 | 2.6 | GO:0060800 | regulation of cell differentiation involved in embryonic placenta development(GO:0060800) |
| 0.7 | 1.3 | GO:0036100 | leukotriene catabolic process(GO:0036100) leukotriene B4 catabolic process(GO:0036101) leukotriene B4 metabolic process(GO:0036102) icosanoid catabolic process(GO:1901523) fatty acid derivative catabolic process(GO:1901569) |
| 0.7 | 1.3 | GO:0097411 | hypoxia-inducible factor-1alpha signaling pathway(GO:0097411) |
| 0.7 | 1.3 | GO:0036166 | positive regulation of transcription from RNA polymerase II promoter involved in myocardial precursor cell differentiation(GO:0003257) phenotypic switching(GO:0036166) regulation of beta-amyloid clearance(GO:1900221) negative regulation of beta-amyloid clearance(GO:1900222) |
| 0.7 | 2.0 | GO:0045356 | interferon-alpha biosynthetic process(GO:0045349) regulation of interferon-alpha biosynthetic process(GO:0045354) positive regulation of interferon-alpha biosynthetic process(GO:0045356) |
| 0.6 | 4.5 | GO:0090166 | Golgi disassembly(GO:0090166) |
| 0.6 | 4.5 | GO:2000371 | regulation of isomerase activity(GO:0010911) positive regulation of isomerase activity(GO:0010912) regulation of DNA topoisomerase (ATP-hydrolyzing) activity(GO:2000371) positive regulation of DNA topoisomerase (ATP-hydrolyzing) activity(GO:2000373) |
| 0.6 | 4.5 | GO:0060330 | regulation of response to interferon-gamma(GO:0060330) |
| 0.6 | 1.9 | GO:0000915 | assembly of actomyosin apparatus involved in cytokinesis(GO:0000912) actomyosin contractile ring assembly(GO:0000915) actomyosin contractile ring organization(GO:0044837) |
| 0.6 | 1.9 | GO:1904721 | negative regulation of mRNA cleavage(GO:0031438) negative regulation of mRNA endonucleolytic cleavage involved in unfolded protein response(GO:1904721) |
| 0.6 | 6.3 | GO:0038095 | Fc-epsilon receptor signaling pathway(GO:0038095) |
| 0.6 | 1.9 | GO:1902412 | regulation of mitotic cytokinesis(GO:1902412) |
| 0.6 | 1.2 | GO:0045919 | positive regulation of cytolysis(GO:0045919) |
| 0.6 | 4.9 | GO:0072189 | ureter development(GO:0072189) |
| 0.6 | 6.1 | GO:0006977 | DNA damage response, signal transduction by p53 class mediator resulting in cell cycle arrest(GO:0006977) |
| 0.6 | 1.8 | GO:0060586 | multicellular organismal iron ion homeostasis(GO:0060586) |
| 0.6 | 2.4 | GO:0006014 | D-ribose metabolic process(GO:0006014) |
| 0.6 | 6.0 | GO:0042866 | pyruvate biosynthetic process(GO:0042866) |
| 0.6 | 6.6 | GO:0061418 | regulation of transcription from RNA polymerase II promoter in response to hypoxia(GO:0061418) |
| 0.6 | 6.5 | GO:0046415 | urate metabolic process(GO:0046415) |
| 0.6 | 11.9 | GO:0032369 | negative regulation of lipid transport(GO:0032369) |
| 0.6 | 18.4 | GO:0072376 | protein activation cascade(GO:0072376) |
| 0.6 | 5.3 | GO:0048739 | cardiac muscle fiber development(GO:0048739) |
| 0.6 | 1.8 | GO:1900425 | negative regulation of defense response to bacterium(GO:1900425) |
| 0.6 | 3.5 | GO:0030951 | establishment or maintenance of microtubule cytoskeleton polarity(GO:0030951) |
| 0.6 | 1.8 | GO:1990737 | regulation of endoplasmic reticulum stress-induced eIF2 alpha phosphorylation(GO:0060734) response to manganese-induced endoplasmic reticulum stress(GO:1990737) |
| 0.6 | 4.1 | GO:0051534 | negative regulation of NFAT protein import into nucleus(GO:0051534) |
| 0.6 | 2.9 | GO:0006545 | glycine biosynthetic process(GO:0006545) |
| 0.6 | 4.6 | GO:0002579 | positive regulation of antigen processing and presentation(GO:0002579) |
| 0.6 | 2.9 | GO:0042535 | positive regulation of tumor necrosis factor biosynthetic process(GO:0042535) |
| 0.6 | 2.3 | GO:0032074 | negative regulation of nuclease activity(GO:0032074) |
| 0.6 | 2.3 | GO:0032707 | negative regulation of interleukin-23 production(GO:0032707) |
| 0.6 | 4.5 | GO:0051694 | pointed-end actin filament capping(GO:0051694) |
| 0.6 | 3.4 | GO:0001992 | regulation of systemic arterial blood pressure by vasopressin(GO:0001992) |
| 0.6 | 2.3 | GO:0044339 | canonical Wnt signaling pathway involved in osteoblast differentiation(GO:0044339) |
| 0.6 | 2.3 | GO:1903225 | negative regulation of endodermal cell differentiation(GO:1903225) |
| 0.6 | 6.2 | GO:0034312 | diol biosynthetic process(GO:0034312) |
| 0.6 | 3.9 | GO:0042699 | follicle-stimulating hormone signaling pathway(GO:0042699) |
| 0.6 | 7.9 | GO:0002360 | T cell lineage commitment(GO:0002360) |
| 0.6 | 1.7 | GO:1901318 | negative regulation of sperm motility(GO:1901318) |
| 0.6 | 5.0 | GO:0006703 | estrogen biosynthetic process(GO:0006703) |
| 0.6 | 2.8 | GO:0070973 | protein localization to endoplasmic reticulum exit site(GO:0070973) |
| 0.6 | 6.1 | GO:0043517 | positive regulation of DNA damage response, signal transduction by p53 class mediator(GO:0043517) |
| 0.5 | 7.1 | GO:1901077 | regulation of relaxation of muscle(GO:1901077) |
| 0.5 | 6.0 | GO:0051988 | regulation of attachment of spindle microtubules to kinetochore(GO:0051988) |
| 0.5 | 5.5 | GO:0035634 | response to stilbenoid(GO:0035634) |
| 0.5 | 5.5 | GO:0006309 | apoptotic DNA fragmentation(GO:0006309) |
| 0.5 | 3.2 | GO:0060244 | negative regulation of cell proliferation involved in contact inhibition(GO:0060244) |
| 0.5 | 0.5 | GO:1901837 | negative regulation of transcription of nuclear large rRNA transcript from RNA polymerase I promoter(GO:1901837) |
| 0.5 | 6.4 | GO:0034501 | protein localization to kinetochore(GO:0034501) |
| 0.5 | 3.2 | GO:1901223 | negative regulation of NIK/NF-kappaB signaling(GO:1901223) |
| 0.5 | 2.6 | GO:0019509 | L-methionine biosynthetic process from methylthioadenosine(GO:0019509) |
| 0.5 | 1.0 | GO:0055005 | ventricular cardiac myofibril assembly(GO:0055005) |
| 0.5 | 4.7 | GO:0043970 | histone H3-K9 acetylation(GO:0043970) |
| 0.5 | 5.2 | GO:1900165 | negative regulation of interleukin-6 secretion(GO:1900165) |
| 0.5 | 11.9 | GO:0006783 | heme biosynthetic process(GO:0006783) |
| 0.5 | 2.6 | GO:0036295 | cellular response to increased oxygen levels(GO:0036295) cellular response to hyperoxia(GO:0071455) |
| 0.5 | 3.1 | GO:0032000 | positive regulation of fatty acid beta-oxidation(GO:0032000) |
| 0.5 | 3.1 | GO:1903715 | regulation of aerobic respiration(GO:1903715) |
| 0.5 | 3.0 | GO:0046602 | regulation of mitotic centrosome separation(GO:0046602) |
| 0.5 | 1.0 | GO:0072592 | oxygen metabolic process(GO:0072592) |
| 0.5 | 3.6 | GO:0051095 | regulation of helicase activity(GO:0051095) positive regulation of helicase activity(GO:0051096) |
| 0.5 | 1.5 | GO:0007221 | positive regulation of transcription of Notch receptor target(GO:0007221) |
| 0.5 | 4.0 | GO:0006021 | inositol biosynthetic process(GO:0006021) |
| 0.5 | 4.5 | GO:0000098 | sulfur amino acid catabolic process(GO:0000098) |
| 0.5 | 13.5 | GO:0035458 | cellular response to interferon-beta(GO:0035458) |
| 0.5 | 13.9 | GO:0071353 | cellular response to interleukin-4(GO:0071353) |
| 0.5 | 5.4 | GO:0051151 | negative regulation of smooth muscle cell differentiation(GO:0051151) |
| 0.5 | 2.0 | GO:2000860 | positive regulation of mineralocorticoid secretion(GO:2000857) positive regulation of aldosterone secretion(GO:2000860) |
| 0.5 | 1.0 | GO:0014842 | regulation of skeletal muscle satellite cell proliferation(GO:0014842) |
| 0.5 | 1.5 | GO:1900060 | negative regulation of ceramide biosynthetic process(GO:1900060) |
| 0.5 | 2.9 | GO:0010961 | cellular magnesium ion homeostasis(GO:0010961) |
| 0.5 | 7.7 | GO:1901522 | positive regulation of transcription from RNA polymerase II promoter involved in cellular response to chemical stimulus(GO:1901522) |
| 0.5 | 6.8 | GO:0061050 | regulation of cell growth involved in cardiac muscle cell development(GO:0061050) |
| 0.5 | 6.3 | GO:0009744 | response to sucrose(GO:0009744) response to disaccharide(GO:0034285) |
| 0.5 | 4.3 | GO:0002430 | complement receptor mediated signaling pathway(GO:0002430) |
| 0.5 | 2.9 | GO:0070562 | regulation of vitamin D receptor signaling pathway(GO:0070562) |
| 0.5 | 1.0 | GO:0014891 | striated muscle atrophy(GO:0014891) |
| 0.5 | 1.4 | GO:0006288 | base-excision repair, DNA ligation(GO:0006288) |
| 0.5 | 0.5 | GO:0020027 | hemoglobin metabolic process(GO:0020027) |
| 0.5 | 2.4 | GO:0090306 | spindle assembly involved in meiosis(GO:0090306) |
| 0.5 | 2.8 | GO:0006499 | N-terminal protein myristoylation(GO:0006499) |
| 0.5 | 1.9 | GO:0035720 | intraciliary anterograde transport(GO:0035720) |
| 0.5 | 13.1 | GO:0001580 | detection of chemical stimulus involved in sensory perception of bitter taste(GO:0001580) |
| 0.5 | 0.9 | GO:0035655 | interleukin-18-mediated signaling pathway(GO:0035655) cellular response to interleukin-18(GO:0071351) |
| 0.5 | 6.5 | GO:0036035 | osteoclast development(GO:0036035) |
| 0.5 | 3.7 | GO:0031547 | brain-derived neurotrophic factor receptor signaling pathway(GO:0031547) |
| 0.5 | 116.8 | GO:0010951 | negative regulation of endopeptidase activity(GO:0010951) |
| 0.5 | 1.8 | GO:0000737 | DNA catabolic process, endonucleolytic(GO:0000737) |
| 0.5 | 2.7 | GO:0042905 | 9-cis-retinoic acid biosynthetic process(GO:0042904) 9-cis-retinoic acid metabolic process(GO:0042905) |
| 0.5 | 4.1 | GO:1901725 | regulation of histone deacetylase activity(GO:1901725) positive regulation of histone deacetylase activity(GO:1901727) |
| 0.5 | 0.9 | GO:0090172 | microtubule cytoskeleton organization involved in homologous chromosome segregation(GO:0090172) |
| 0.4 | 1.8 | GO:0038145 | macrophage colony-stimulating factor signaling pathway(GO:0038145) |
| 0.4 | 3.4 | GO:0021979 | hypothalamus cell differentiation(GO:0021979) |
| 0.4 | 1.3 | GO:0048743 | positive regulation of skeletal muscle fiber development(GO:0048743) |
| 0.4 | 0.4 | GO:0097694 | establishment of RNA localization to telomere(GO:0097694) negative regulation of protein localization to chromosome, telomeric region(GO:1904815) |
| 0.4 | 1.7 | GO:0097680 | double-strand break repair via classical nonhomologous end joining(GO:0097680) |
| 0.4 | 5.0 | GO:0071168 | protein localization to chromatin(GO:0071168) |
| 0.4 | 1.2 | GO:0006713 | glucocorticoid catabolic process(GO:0006713) |
| 0.4 | 1.2 | GO:1901367 | response to L-cysteine(GO:1901367) |
| 0.4 | 1.2 | GO:0021562 | vestibulocochlear nerve development(GO:0021562) |
| 0.4 | 2.0 | GO:0072104 | renal system vasculature morphogenesis(GO:0061438) kidney vasculature morphogenesis(GO:0061439) glomerulus vasculature morphogenesis(GO:0072103) glomerular capillary formation(GO:0072104) |
| 0.4 | 0.8 | GO:0034059 | response to anoxia(GO:0034059) |
| 0.4 | 12.5 | GO:0009225 | nucleotide-sugar metabolic process(GO:0009225) |
| 0.4 | 1.2 | GO:0000105 | histidine biosynthetic process(GO:0000105) |
| 0.4 | 1.2 | GO:0042357 | thiamine diphosphate metabolic process(GO:0042357) |
| 0.4 | 2.0 | GO:0007144 | female meiosis I(GO:0007144) |
| 0.4 | 4.0 | GO:0061088 | sequestering of zinc ion(GO:0032119) regulation of sequestering of zinc ion(GO:0061088) |
| 0.4 | 6.3 | GO:0050860 | negative regulation of T cell receptor signaling pathway(GO:0050860) |
| 0.4 | 2.4 | GO:0030174 | regulation of DNA-dependent DNA replication initiation(GO:0030174) |
| 0.4 | 2.0 | GO:1903251 | multi-ciliated epithelial cell differentiation(GO:1903251) |
| 0.4 | 3.9 | GO:0001887 | selenium compound metabolic process(GO:0001887) |
| 0.4 | 2.7 | GO:0043686 | co-translational protein modification(GO:0043686) |
| 0.4 | 4.2 | GO:1900017 | positive regulation of cytokine production involved in inflammatory response(GO:1900017) |
| 0.4 | 4.6 | GO:0007195 | adenylate cyclase-inhibiting dopamine receptor signaling pathway(GO:0007195) |
| 0.4 | 1.1 | GO:0010730 | negative regulation of hydrogen peroxide biosynthetic process(GO:0010730) positive regulation of cellular respiration(GO:1901857) |
| 0.4 | 1.1 | GO:0022614 | membrane to membrane docking(GO:0022614) |
| 0.4 | 2.3 | GO:0032876 | negative regulation of DNA endoreduplication(GO:0032876) |
| 0.4 | 4.9 | GO:0032275 | luteinizing hormone secretion(GO:0032275) follicle-stimulating hormone secretion(GO:0046884) |
| 0.4 | 3.4 | GO:0033539 | fatty acid beta-oxidation using acyl-CoA dehydrogenase(GO:0033539) |
| 0.4 | 4.1 | GO:1901741 | positive regulation of myoblast fusion(GO:1901741) |
| 0.4 | 1.1 | GO:0002760 | positive regulation of antimicrobial peptide production(GO:0002225) positive regulation of antimicrobial humoral response(GO:0002760) positive regulation of antibacterial peptide production(GO:0002803) |
| 0.4 | 2.9 | GO:1902176 | negative regulation of oxidative stress-induced intrinsic apoptotic signaling pathway(GO:1902176) |
| 0.4 | 1.4 | GO:0006741 | NADP biosynthetic process(GO:0006741) |
| 0.4 | 4.9 | GO:0050434 | positive regulation of viral transcription(GO:0050434) |
| 0.3 | 5.2 | GO:0033147 | negative regulation of intracellular estrogen receptor signaling pathway(GO:0033147) |
| 0.3 | 1.4 | GO:0001579 | medium-chain fatty acid transport(GO:0001579) |
| 0.3 | 3.1 | GO:0018026 | peptidyl-lysine monomethylation(GO:0018026) |
| 0.3 | 4.1 | GO:0006206 | pyrimidine nucleobase metabolic process(GO:0006206) |
| 0.3 | 6.2 | GO:0042481 | regulation of odontogenesis(GO:0042481) |
| 0.3 | 1.4 | GO:0051315 | attachment of mitotic spindle microtubules to kinetochore(GO:0051315) |
| 0.3 | 0.7 | GO:0072695 | negative regulation of DNA recombination at telomere(GO:0048239) regulation of DNA recombination at telomere(GO:0072695) |
| 0.3 | 1.7 | GO:0038094 | Fc-gamma receptor signaling pathway(GO:0038094) |
| 0.3 | 1.0 | GO:0002148 | hypochlorous acid metabolic process(GO:0002148) hypochlorous acid biosynthetic process(GO:0002149) response to gold nanoparticle(GO:1990268) |
| 0.3 | 1.7 | GO:0019520 | aldonic acid metabolic process(GO:0019520) D-gluconate metabolic process(GO:0019521) |
| 0.3 | 2.0 | GO:0060054 | positive regulation of epithelial cell proliferation involved in wound healing(GO:0060054) |
| 0.3 | 1.7 | GO:0043416 | regulation of skeletal muscle tissue regeneration(GO:0043416) |
| 0.3 | 2.3 | GO:0060770 | negative regulation of epithelial cell proliferation involved in prostate gland development(GO:0060770) |
| 0.3 | 1.3 | GO:0032464 | positive regulation of protein homooligomerization(GO:0032464) |
| 0.3 | 1.0 | GO:0030576 | Cajal body organization(GO:0030576) |
| 0.3 | 0.3 | GO:0035359 | negative regulation of peroxisome proliferator activated receptor signaling pathway(GO:0035359) |
| 0.3 | 7.9 | GO:0017144 | drug metabolic process(GO:0017144) |
| 0.3 | 14.9 | GO:0070098 | chemokine-mediated signaling pathway(GO:0070098) |
| 0.3 | 7.3 | GO:0045604 | regulation of epidermal cell differentiation(GO:0045604) |
| 0.3 | 1.3 | GO:0090666 | scaRNA localization to Cajal body(GO:0090666) |
| 0.3 | 0.9 | GO:0001555 | oocyte growth(GO:0001555) |
| 0.3 | 1.3 | GO:0090009 | primitive streak formation(GO:0090009) |
| 0.3 | 0.9 | GO:0007066 | female meiosis sister chromatid cohesion(GO:0007066) |
| 0.3 | 1.2 | GO:2000814 | positive regulation of barbed-end actin filament capping(GO:2000814) |
| 0.3 | 2.8 | GO:0009235 | cobalamin metabolic process(GO:0009235) |
| 0.3 | 2.8 | GO:0003376 | sphingosine-1-phosphate signaling pathway(GO:0003376) |
| 0.3 | 1.5 | GO:0010216 | maintenance of DNA methylation(GO:0010216) |
| 0.3 | 1.2 | GO:1902775 | mitochondrial large ribosomal subunit assembly(GO:1902775) |
| 0.3 | 1.8 | GO:0015760 | hexose phosphate transport(GO:0015712) glucose-6-phosphate transport(GO:0015760) |
| 0.3 | 4.5 | GO:0001731 | formation of translation preinitiation complex(GO:0001731) |
| 0.3 | 1.2 | GO:0006553 | lysine metabolic process(GO:0006553) |
| 0.3 | 3.2 | GO:1900028 | negative regulation of ruffle assembly(GO:1900028) |
| 0.3 | 4.1 | GO:1902857 | positive regulation of nonmotile primary cilium assembly(GO:1902857) |
| 0.3 | 1.5 | GO:0090232 | positive regulation of spindle checkpoint(GO:0090232) positive regulation of mitotic cell cycle spindle assembly checkpoint(GO:0090267) |
| 0.3 | 2.9 | GO:0035814 | negative regulation of renal sodium excretion(GO:0035814) |
| 0.3 | 4.1 | GO:1990845 | adaptive thermogenesis(GO:1990845) |
| 0.3 | 2.9 | GO:0006907 | pinocytosis(GO:0006907) |
| 0.3 | 2.9 | GO:0042036 | negative regulation of cytokine biosynthetic process(GO:0042036) |
| 0.3 | 1.5 | GO:0007096 | regulation of exit from mitosis(GO:0007096) |
| 0.3 | 0.9 | GO:0071461 | cellular response to redox state(GO:0071461) |
| 0.3 | 3.5 | GO:0006337 | nucleosome disassembly(GO:0006337) |
| 0.3 | 6.3 | GO:0032720 | negative regulation of tumor necrosis factor production(GO:0032720) |
| 0.3 | 1.1 | GO:0032688 | negative regulation of interferon-beta production(GO:0032688) |
| 0.3 | 2.3 | GO:0033234 | negative regulation of protein sumoylation(GO:0033234) |
| 0.3 | 7.7 | GO:0050853 | B cell receptor signaling pathway(GO:0050853) |
| 0.3 | 1.4 | GO:0035360 | positive regulation of peroxisome proliferator activated receptor signaling pathway(GO:0035360) |
| 0.3 | 1.4 | GO:2000739 | mesenchymal stem cell differentiation(GO:0072497) regulation of mesenchymal stem cell differentiation(GO:2000739) positive regulation of mesenchymal stem cell differentiation(GO:2000741) |
| 0.3 | 0.8 | GO:0048749 | compound eye development(GO:0048749) |
| 0.3 | 2.2 | GO:0002755 | MyD88-dependent toll-like receptor signaling pathway(GO:0002755) |
| 0.3 | 1.4 | GO:0070102 | interleukin-6-mediated signaling pathway(GO:0070102) |
| 0.3 | 5.0 | GO:0031572 | mitotic G2 DNA damage checkpoint(GO:0007095) G2 DNA damage checkpoint(GO:0031572) |
| 0.3 | 1.9 | GO:0018298 | protein-chromophore linkage(GO:0018298) |
| 0.3 | 0.5 | GO:1904017 | cellular response to Thyroglobulin triiodothyronine(GO:1904017) |
| 0.3 | 0.5 | GO:0046601 | positive regulation of centriole replication(GO:0046601) |
| 0.3 | 1.4 | GO:0071000 | response to magnetism(GO:0071000) |
| 0.3 | 7.8 | GO:0031146 | SCF-dependent proteasomal ubiquitin-dependent protein catabolic process(GO:0031146) |
| 0.3 | 3.8 | GO:0070232 | regulation of T cell apoptotic process(GO:0070232) |
| 0.3 | 2.4 | GO:0051798 | positive regulation of hair follicle development(GO:0051798) |
| 0.3 | 5.6 | GO:0070831 | basement membrane assembly(GO:0070831) |
| 0.3 | 3.2 | GO:0097286 | iron ion import(GO:0097286) |
| 0.3 | 3.2 | GO:0060216 | definitive hemopoiesis(GO:0060216) |
| 0.3 | 1.1 | GO:0043402 | glucocorticoid mediated signaling pathway(GO:0043402) |
| 0.3 | 2.4 | GO:0072347 | response to anesthetic(GO:0072347) |
| 0.3 | 0.8 | GO:1903849 | regulation of aorta morphogenesis(GO:1903847) positive regulation of aorta morphogenesis(GO:1903849) |
| 0.3 | 7.1 | GO:0000028 | ribosomal small subunit assembly(GO:0000028) |
| 0.3 | 3.1 | GO:0071357 | type I interferon signaling pathway(GO:0060337) cellular response to type I interferon(GO:0071357) |
| 0.3 | 3.9 | GO:0032148 | activation of protein kinase B activity(GO:0032148) |
| 0.3 | 5.4 | GO:0016226 | iron-sulfur cluster assembly(GO:0016226) metallo-sulfur cluster assembly(GO:0031163) |
| 0.3 | 3.1 | GO:0060411 | cardiac septum morphogenesis(GO:0060411) |
| 0.3 | 4.3 | GO:0043968 | histone H2A acetylation(GO:0043968) |
| 0.3 | 1.3 | GO:0000447 | endonucleolytic cleavage in ITS1 to separate SSU-rRNA from 5.8S rRNA and LSU-rRNA from tricistronic rRNA transcript (SSU-rRNA, 5.8S rRNA, LSU-rRNA)(GO:0000447) |
| 0.3 | 0.8 | GO:0051204 | protein insertion into mitochondrial membrane(GO:0051204) |
| 0.3 | 1.5 | GO:0035646 | endosome to melanosome transport(GO:0035646) pigment accumulation(GO:0043476) cellular pigment accumulation(GO:0043482) endosome to pigment granule transport(GO:0043485) pigment granule maturation(GO:0048757) |
| 0.3 | 20.2 | GO:0019882 | antigen processing and presentation(GO:0019882) |
| 0.3 | 1.8 | GO:0006384 | transcription initiation from RNA polymerase III promoter(GO:0006384) |
| 0.3 | 3.8 | GO:1901533 | negative regulation of hematopoietic progenitor cell differentiation(GO:1901533) |
| 0.2 | 2.2 | GO:0000722 | telomere maintenance via recombination(GO:0000722) |
| 0.2 | 3.7 | GO:0006691 | leukotriene metabolic process(GO:0006691) |
| 0.2 | 5.0 | GO:0006953 | acute-phase response(GO:0006953) |
| 0.2 | 1.0 | GO:0045039 | protein import into mitochondrial inner membrane(GO:0045039) |
| 0.2 | 3.9 | GO:0048661 | positive regulation of smooth muscle cell proliferation(GO:0048661) |
| 0.2 | 2.2 | GO:0042832 | defense response to protozoan(GO:0042832) |
| 0.2 | 1.0 | GO:1900864 | mitochondrial tRNA modification(GO:0070900) mitochondrial RNA modification(GO:1900864) |
| 0.2 | 1.9 | GO:0035520 | monoubiquitinated protein deubiquitination(GO:0035520) |
| 0.2 | 1.2 | GO:0043031 | negative regulation of macrophage activation(GO:0043031) |
| 0.2 | 4.1 | GO:0032042 | mitochondrial DNA metabolic process(GO:0032042) |
| 0.2 | 2.6 | GO:0070863 | positive regulation of protein exit from endoplasmic reticulum(GO:0070863) |
| 0.2 | 0.7 | GO:0006438 | valyl-tRNA aminoacylation(GO:0006438) |
| 0.2 | 0.7 | GO:0002386 | immune response in mucosal-associated lymphoid tissue(GO:0002386) |
| 0.2 | 4.2 | GO:0006491 | N-glycan processing(GO:0006491) |
| 0.2 | 0.7 | GO:0015680 | intracellular copper ion transport(GO:0015680) |
| 0.2 | 0.7 | GO:1900019 | regulation of protein kinase C activity(GO:1900019) positive regulation of protein kinase C activity(GO:1900020) |
| 0.2 | 10.6 | GO:0006611 | protein export from nucleus(GO:0006611) |
| 0.2 | 2.4 | GO:0034508 | centromere complex assembly(GO:0034508) |
| 0.2 | 3.5 | GO:0032814 | regulation of natural killer cell activation(GO:0032814) |
| 0.2 | 5.2 | GO:0042100 | B cell proliferation(GO:0042100) |
| 0.2 | 1.1 | GO:0038203 | TORC2 signaling(GO:0038203) |
| 0.2 | 1.3 | GO:0046851 | negative regulation of bone resorption(GO:0045779) negative regulation of bone remodeling(GO:0046851) |
| 0.2 | 1.1 | GO:0050706 | regulation of interleukin-1 beta secretion(GO:0050706) |
| 0.2 | 1.3 | GO:2000786 | positive regulation of autophagosome assembly(GO:2000786) |
| 0.2 | 1.2 | GO:0033004 | negative regulation of mast cell activation(GO:0033004) |
| 0.2 | 1.0 | GO:0019348 | dolichol metabolic process(GO:0019348) |
| 0.2 | 0.8 | GO:0034244 | negative regulation of transcription elongation from RNA polymerase II promoter(GO:0034244) |
| 0.2 | 2.7 | GO:0006851 | mitochondrial calcium ion transport(GO:0006851) |
| 0.2 | 1.0 | GO:0070127 | tRNA aminoacylation for mitochondrial protein translation(GO:0070127) |
| 0.2 | 3.0 | GO:0001516 | prostaglandin biosynthetic process(GO:0001516) prostanoid biosynthetic process(GO:0046457) |
| 0.2 | 0.6 | GO:0030091 | protein repair(GO:0030091) |
| 0.2 | 4.4 | GO:0033344 | cholesterol efflux(GO:0033344) |
| 0.2 | 2.2 | GO:0031268 | pseudopodium organization(GO:0031268) |
| 0.2 | 1.2 | GO:1904751 | positive regulation of protein localization to nucleolus(GO:1904751) |
| 0.2 | 2.2 | GO:0035313 | wound healing, spreading of epidermal cells(GO:0035313) |
| 0.2 | 0.6 | GO:0060051 | negative regulation of protein glycosylation(GO:0060051) |
| 0.2 | 2.5 | GO:0051292 | nuclear pore complex assembly(GO:0051292) |
| 0.2 | 3.5 | GO:0006027 | glycosaminoglycan catabolic process(GO:0006027) |
| 0.2 | 2.7 | GO:0033189 | response to vitamin A(GO:0033189) |
| 0.2 | 1.9 | GO:0034063 | stress granule assembly(GO:0034063) |
| 0.2 | 4.5 | GO:0006801 | superoxide metabolic process(GO:0006801) |
| 0.2 | 0.4 | GO:0000958 | mitochondrial mRNA catabolic process(GO:0000958) positive regulation of mitochondrial RNA catabolic process(GO:0000962) |
| 0.2 | 1.1 | GO:0000711 | meiotic DNA repair synthesis(GO:0000711) |
| 0.2 | 0.7 | GO:0048386 | positive regulation of retinoic acid receptor signaling pathway(GO:0048386) |
| 0.2 | 0.5 | GO:0030397 | membrane disassembly(GO:0030397) nuclear envelope disassembly(GO:0051081) |
| 0.2 | 0.9 | GO:0042744 | hydrogen peroxide catabolic process(GO:0042744) |
| 0.2 | 0.9 | GO:0000066 | mitochondrial ornithine transport(GO:0000066) |
| 0.2 | 1.0 | GO:0045647 | negative regulation of erythrocyte differentiation(GO:0045647) |
| 0.2 | 4.7 | GO:0015986 | energy coupled proton transport, down electrochemical gradient(GO:0015985) ATP synthesis coupled proton transport(GO:0015986) |
| 0.2 | 0.5 | GO:0042976 | activation of Janus kinase activity(GO:0042976) |
| 0.2 | 3.1 | GO:2000272 | negative regulation of receptor activity(GO:2000272) |
| 0.2 | 1.3 | GO:0016926 | protein desumoylation(GO:0016926) |
| 0.2 | 1.7 | GO:0071480 | cellular response to gamma radiation(GO:0071480) |
| 0.2 | 1.6 | GO:2000234 | positive regulation of ribosome biogenesis(GO:0090070) positive regulation of rRNA processing(GO:2000234) |
| 0.2 | 2.8 | GO:0070536 | protein K63-linked deubiquitination(GO:0070536) |
| 0.2 | 1.6 | GO:0006122 | mitochondrial electron transport, ubiquinol to cytochrome c(GO:0006122) |
| 0.2 | 0.8 | GO:2000253 | positive regulation of feeding behavior(GO:2000253) |
| 0.2 | 0.9 | GO:0045040 | protein import into mitochondrial outer membrane(GO:0045040) |
| 0.2 | 0.5 | GO:0044806 | G-quadruplex DNA unwinding(GO:0044806) |
| 0.2 | 0.5 | GO:2000586 | positive regulation of platelet-derived growth factor receptor signaling pathway(GO:0010641) regulation of platelet-derived growth factor receptor-beta signaling pathway(GO:2000586) |
| 0.2 | 2.2 | GO:0030150 | protein import into mitochondrial matrix(GO:0030150) |
| 0.2 | 1.2 | GO:0048280 | vesicle fusion with Golgi apparatus(GO:0048280) |
| 0.2 | 2.0 | GO:0050819 | negative regulation of coagulation(GO:0050819) |
| 0.2 | 2.1 | GO:0034723 | DNA replication-dependent nucleosome assembly(GO:0006335) DNA replication-dependent nucleosome organization(GO:0034723) |
| 0.1 | 0.9 | GO:0090367 | regulation of mRNA modification(GO:0090365) negative regulation of mRNA modification(GO:0090367) |
| 0.1 | 1.0 | GO:0033623 | regulation of integrin activation(GO:0033623) |
| 0.1 | 0.6 | GO:0097210 | response to gonadotropin-releasing hormone(GO:0097210) cellular response to gonadotropin-releasing hormone(GO:0097211) |
| 0.1 | 4.4 | GO:0050873 | brown fat cell differentiation(GO:0050873) |
| 0.1 | 2.9 | GO:0000027 | ribosomal large subunit assembly(GO:0000027) |
| 0.1 | 0.3 | GO:1902544 | regulation of DNA N-glycosylase activity(GO:1902544) |
| 0.1 | 3.9 | GO:0097421 | liver regeneration(GO:0097421) |
| 0.1 | 5.5 | GO:0006635 | fatty acid beta-oxidation(GO:0006635) |
| 0.1 | 1.5 | GO:0032836 | glomerular basement membrane development(GO:0032836) |
| 0.1 | 1.1 | GO:0070935 | 3'-UTR-mediated mRNA stabilization(GO:0070935) |
| 0.1 | 0.8 | GO:0035743 | CD4-positive, alpha-beta T cell cytokine production(GO:0035743) T-helper 2 cell cytokine production(GO:0035745) |
| 0.1 | 0.5 | GO:0052314 | isoquinoline alkaloid metabolic process(GO:0033076) phytoalexin metabolic process(GO:0052314) |
| 0.1 | 2.6 | GO:0009303 | rRNA transcription(GO:0009303) |
| 0.1 | 1.3 | GO:0060213 | regulation of nuclear-transcribed mRNA poly(A) tail shortening(GO:0060211) positive regulation of nuclear-transcribed mRNA poly(A) tail shortening(GO:0060213) |
| 0.1 | 0.6 | GO:0045602 | negative regulation of endothelial cell differentiation(GO:0045602) |
| 0.1 | 0.6 | GO:0043619 | regulation of transcription from RNA polymerase II promoter in response to oxidative stress(GO:0043619) |
| 0.1 | 1.4 | GO:0006388 | tRNA splicing, via endonucleolytic cleavage and ligation(GO:0006388) |
| 0.1 | 4.6 | GO:0002687 | positive regulation of leukocyte migration(GO:0002687) |
| 0.1 | 1.3 | GO:0001778 | plasma membrane repair(GO:0001778) |
| 0.1 | 2.6 | GO:0035025 | positive regulation of Rho protein signal transduction(GO:0035025) |
| 0.1 | 1.7 | GO:0032793 | positive regulation of CREB transcription factor activity(GO:0032793) |
| 0.1 | 0.8 | GO:0010172 | embryonic body morphogenesis(GO:0010172) |
| 0.1 | 1.5 | GO:0048268 | clathrin coat assembly(GO:0048268) |
| 0.1 | 1.6 | GO:0071425 | hematopoietic stem cell proliferation(GO:0071425) |
| 0.1 | 1.3 | GO:0006625 | protein targeting to peroxisome(GO:0006625) peroxisomal transport(GO:0043574) protein localization to peroxisome(GO:0072662) establishment of protein localization to peroxisome(GO:0072663) |
| 0.1 | 1.4 | GO:0045898 | regulation of RNA polymerase II transcriptional preinitiation complex assembly(GO:0045898) |
| 0.1 | 3.7 | GO:0031047 | gene silencing by RNA(GO:0031047) |
| 0.1 | 2.8 | GO:0030866 | cortical actin cytoskeleton organization(GO:0030866) |
| 0.1 | 3.8 | GO:0000387 | spliceosomal snRNP assembly(GO:0000387) |
| 0.1 | 5.4 | GO:0055088 | lipid homeostasis(GO:0055088) |
| 0.1 | 4.9 | GO:0032543 | mitochondrial translation(GO:0032543) |
| 0.1 | 1.2 | GO:0070932 | histone H3 deacetylation(GO:0070932) |
| 0.1 | 2.9 | GO:0010389 | regulation of G2/M transition of mitotic cell cycle(GO:0010389) |
| 0.1 | 0.9 | GO:1902231 | positive regulation of intrinsic apoptotic signaling pathway in response to DNA damage(GO:1902231) |
| 0.1 | 4.9 | GO:0006289 | nucleotide-excision repair(GO:0006289) |
| 0.1 | 0.4 | GO:0048742 | regulation of skeletal muscle fiber development(GO:0048742) |
| 0.1 | 0.9 | GO:0045722 | positive regulation of gluconeogenesis(GO:0045722) |
| 0.1 | 8.2 | GO:0043433 | negative regulation of sequence-specific DNA binding transcription factor activity(GO:0043433) |
| 0.1 | 2.4 | GO:0000462 | maturation of SSU-rRNA from tricistronic rRNA transcript (SSU-rRNA, 5.8S rRNA, LSU-rRNA)(GO:0000462) |
| 0.1 | 131.9 | GO:0050911 | detection of chemical stimulus involved in sensory perception of smell(GO:0050911) |
| 0.1 | 0.3 | GO:0045852 | pH elevation(GO:0045852) intracellular pH elevation(GO:0051454) |
| 0.1 | 1.0 | GO:0043537 | negative regulation of blood vessel endothelial cell migration(GO:0043537) |
| 0.1 | 0.5 | GO:0034755 | iron ion transmembrane transport(GO:0034755) |
| 0.1 | 1.0 | GO:0060412 | ventricular septum morphogenesis(GO:0060412) |
| 0.1 | 1.0 | GO:0046784 | viral mRNA export from host cell nucleus(GO:0046784) |
| 0.1 | 2.5 | GO:0006879 | cellular iron ion homeostasis(GO:0006879) |
| 0.1 | 2.7 | GO:0007026 | negative regulation of microtubule depolymerization(GO:0007026) |
| 0.1 | 10.6 | GO:0090501 | RNA phosphodiester bond hydrolysis(GO:0090501) |
| 0.1 | 1.9 | GO:0042990 | regulation of transcription factor import into nucleus(GO:0042990) |
| 0.1 | 2.6 | GO:0050852 | T cell receptor signaling pathway(GO:0050852) |
| 0.1 | 1.4 | GO:0046597 | negative regulation of viral entry into host cell(GO:0046597) |
| 0.1 | 0.8 | GO:0043568 | positive regulation of insulin-like growth factor receptor signaling pathway(GO:0043568) |
| 0.1 | 1.4 | GO:0072673 | lamellipodium morphogenesis(GO:0072673) |
| 0.1 | 1.3 | GO:0006383 | transcription from RNA polymerase III promoter(GO:0006383) |
| 0.1 | 1.2 | GO:1903557 | positive regulation of tumor necrosis factor production(GO:0032760) positive regulation of tumor necrosis factor superfamily cytokine production(GO:1903557) |
| 0.1 | 0.4 | GO:0019464 | glycine catabolic process(GO:0006546) glycine decarboxylation via glycine cleavage system(GO:0019464) |
| 0.1 | 1.4 | GO:0006613 | cotranslational protein targeting to membrane(GO:0006613) |
| 0.1 | 1.3 | GO:0043277 | apoptotic cell clearance(GO:0043277) |
| 0.1 | 9.3 | GO:0043484 | regulation of RNA splicing(GO:0043484) |
| 0.1 | 0.3 | GO:0008050 | female courtship behavior(GO:0008050) |
| 0.1 | 0.9 | GO:0043486 | histone exchange(GO:0043486) |
| 0.1 | 1.3 | GO:0009395 | phospholipid catabolic process(GO:0009395) |
| 0.1 | 0.6 | GO:0097068 | response to thyroxine(GO:0097068) |
| 0.1 | 0.2 | GO:0090209 | negative regulation of triglyceride metabolic process(GO:0090209) |
| 0.1 | 2.2 | GO:0030101 | natural killer cell activation(GO:0030101) |
| 0.1 | 0.1 | GO:0010818 | T cell chemotaxis(GO:0010818) |
| 0.1 | 0.7 | GO:0051044 | positive regulation of membrane protein ectodomain proteolysis(GO:0051044) |
| 0.1 | 1.6 | GO:0031297 | replication fork processing(GO:0031297) |
| 0.1 | 2.4 | GO:0045670 | regulation of osteoclast differentiation(GO:0045670) |
| 0.1 | 1.5 | GO:0010569 | regulation of double-strand break repair via homologous recombination(GO:0010569) |
| 0.1 | 1.5 | GO:0048747 | muscle fiber development(GO:0048747) |
| 0.1 | 3.3 | GO:0006414 | translational elongation(GO:0006414) |
| 0.1 | 0.8 | GO:0033617 | mitochondrial respiratory chain complex IV assembly(GO:0033617) mitochondrial respiratory chain complex IV biogenesis(GO:0097034) |
| 0.1 | 1.1 | GO:0050728 | negative regulation of inflammatory response(GO:0050728) |
| 0.1 | 0.7 | GO:0036344 | platelet formation(GO:0030220) platelet morphogenesis(GO:0036344) |
| 0.1 | 0.9 | GO:0006359 | regulation of transcription from RNA polymerase III promoter(GO:0006359) |
| 0.1 | 3.4 | GO:0070206 | protein trimerization(GO:0070206) |
| 0.1 | 0.4 | GO:1900015 | regulation of cytokine production involved in inflammatory response(GO:1900015) |
| 0.1 | 2.3 | GO:0032418 | lysosome localization(GO:0032418) |
| 0.1 | 1.1 | GO:0045760 | positive regulation of action potential(GO:0045760) |
| 0.1 | 2.5 | GO:1904893 | negative regulation of JAK-STAT cascade(GO:0046426) negative regulation of STAT cascade(GO:1904893) |
| 0.1 | 2.6 | GO:0070374 | positive regulation of ERK1 and ERK2 cascade(GO:0070374) |
| 0.1 | 1.0 | GO:0048873 | homeostasis of number of cells within a tissue(GO:0048873) |
| 0.1 | 0.5 | GO:0097094 | craniofacial suture morphogenesis(GO:0097094) |
| 0.1 | 0.1 | GO:0044146 | negative regulation of growth of symbiont in host(GO:0044130) negative regulation of growth of symbiont involved in interaction with host(GO:0044146) |
| 0.1 | 0.7 | GO:0050962 | detection of light stimulus involved in visual perception(GO:0050908) detection of light stimulus involved in sensory perception(GO:0050962) |
| 0.1 | 1.7 | GO:0010658 | striated muscle cell apoptotic process(GO:0010658) cardiac muscle cell apoptotic process(GO:0010659) |
| 0.1 | 1.4 | GO:0046889 | positive regulation of lipid biosynthetic process(GO:0046889) |
| 0.1 | 0.1 | GO:0072014 | proximal tubule development(GO:0072014) |
| 0.1 | 0.3 | GO:0046490 | isopentenyl diphosphate biosynthetic process(GO:0009240) isopentenyl diphosphate metabolic process(GO:0046490) |
| 0.1 | 0.2 | GO:0071233 | cellular response to leucine(GO:0071233) |
| 0.1 | 1.0 | GO:0031581 | hemidesmosome assembly(GO:0031581) |
| 0.1 | 1.5 | GO:0001938 | positive regulation of endothelial cell proliferation(GO:0001938) |
| 0.1 | 2.2 | GO:0003009 | skeletal muscle contraction(GO:0003009) |
| 0.1 | 21.3 | GO:0006955 | immune response(GO:0006955) |
| 0.1 | 0.6 | GO:0001759 | organ induction(GO:0001759) |
| 0.1 | 1.1 | GO:0030033 | microvillus assembly(GO:0030033) |
| 0.1 | 1.3 | GO:0000184 | nuclear-transcribed mRNA catabolic process, nonsense-mediated decay(GO:0000184) |
| 0.1 | 0.7 | GO:0006474 | N-terminal protein amino acid acetylation(GO:0006474) |
| 0.1 | 0.5 | GO:0060628 | regulation of ER to Golgi vesicle-mediated transport(GO:0060628) |
| 0.1 | 2.9 | GO:0006909 | phagocytosis(GO:0006909) |
| 0.1 | 1.3 | GO:0055006 | cardiac cell development(GO:0055006) cardiac muscle cell development(GO:0055013) |
| 0.1 | 1.3 | GO:0006739 | NADP metabolic process(GO:0006739) |
| 0.1 | 0.4 | GO:0070389 | chaperone mediated protein folding requiring cofactor(GO:0051085) chaperone cofactor-dependent protein refolding(GO:0070389) |
| 0.0 | 0.1 | GO:0034721 | histone H3-K4 demethylation, trimethyl-H3-K4-specific(GO:0034721) |
| 0.0 | 1.4 | GO:0040014 | regulation of multicellular organism growth(GO:0040014) |
| 0.0 | 1.8 | GO:1902475 | L-alpha-amino acid transmembrane transport(GO:1902475) |
| 0.0 | 1.1 | GO:0045214 | sarcomere organization(GO:0045214) |
| 0.0 | 0.5 | GO:0016973 | poly(A)+ mRNA export from nucleus(GO:0016973) |
| 0.0 | 0.6 | GO:0070986 | left/right axis specification(GO:0070986) |
| 0.0 | 0.3 | GO:0006610 | ribosomal protein import into nucleus(GO:0006610) |
| 0.0 | 0.8 | GO:0001954 | positive regulation of cell-matrix adhesion(GO:0001954) |
| 0.0 | 0.5 | GO:0006303 | double-strand break repair via nonhomologous end joining(GO:0006303) |
| 0.0 | 0.2 | GO:0015808 | L-alanine transport(GO:0015808) |
| 0.0 | 0.1 | GO:0009071 | serine family amino acid catabolic process(GO:0009071) |
| 0.0 | 0.1 | GO:0090481 | pyrimidine nucleotide-sugar transmembrane transport(GO:0090481) |
| 0.0 | 0.5 | GO:0031069 | hair follicle morphogenesis(GO:0031069) |
| 0.0 | 0.1 | GO:0006268 | DNA unwinding involved in DNA replication(GO:0006268) |
| 0.0 | 1.7 | GO:0035383 | acyl-CoA metabolic process(GO:0006637) thioester metabolic process(GO:0035383) |
| 0.0 | 0.4 | GO:0006607 | NLS-bearing protein import into nucleus(GO:0006607) |
| 0.0 | 1.3 | GO:0022904 | respiratory electron transport chain(GO:0022904) |
| 0.0 | 0.2 | GO:0032755 | positive regulation of interleukin-6 production(GO:0032755) |
| 0.0 | 0.6 | GO:0097352 | autophagosome maturation(GO:0097352) |
| 0.0 | 0.1 | GO:0033031 | positive regulation of neutrophil apoptotic process(GO:0033031) positive regulation of myeloid cell apoptotic process(GO:0033034) |
| 0.0 | 0.5 | GO:0000470 | maturation of LSU-rRNA(GO:0000470) |
| 0.0 | 0.1 | GO:0000460 | maturation of 5.8S rRNA(GO:0000460) |
| 0.0 | 0.7 | GO:0009250 | glycogen biosynthetic process(GO:0005978) glucan biosynthetic process(GO:0009250) |
| 0.0 | 0.9 | GO:0000079 | regulation of cyclin-dependent protein serine/threonine kinase activity(GO:0000079) |
| 0.0 | 0.1 | GO:0050667 | homocysteine metabolic process(GO:0050667) |
| 0.0 | 0.1 | GO:0007256 | activation of JNKK activity(GO:0007256) |
| 0.0 | 0.1 | GO:1900363 | regulation of mRNA polyadenylation(GO:1900363) |
| 0.0 | 0.1 | GO:0048012 | hepatocyte growth factor receptor signaling pathway(GO:0048012) |
| 0.0 | 0.2 | GO:0042130 | negative regulation of T cell proliferation(GO:0042130) |
| 0.0 | 0.1 | GO:0034643 | establishment of mitochondrion localization, microtubule-mediated(GO:0034643) mitochondrion transport along microtubule(GO:0047497) |
| 0.0 | 0.1 | GO:0008295 | spermidine biosynthetic process(GO:0008295) |
| 0.0 | 0.1 | GO:0031424 | keratinization(GO:0031424) |
| 0.0 | 0.1 | GO:0007289 | spermatid nucleus differentiation(GO:0007289) |
Gene overrepresentation in cellular component category:
| Log-likelihood per target | Total log-likelihood | Term | Description |
|---|---|---|---|
| 4.3 | 26.0 | GO:0005579 | membrane attack complex(GO:0005579) |
| 4.2 | 16.9 | GO:0044218 | other organism cell membrane(GO:0044218) other organism membrane(GO:0044279) |
| 3.9 | 11.7 | GO:0032398 | MHC class Ib protein complex(GO:0032398) |
| 3.3 | 16.3 | GO:0072557 | IPAF inflammasome complex(GO:0072557) |
| 3.2 | 29.2 | GO:0034366 | spherical high-density lipoprotein particle(GO:0034366) |
| 2.6 | 13.1 | GO:0043159 | acrosomal matrix(GO:0043159) |
| 2.6 | 28.3 | GO:0005833 | hemoglobin complex(GO:0005833) |
| 2.5 | 24.8 | GO:0043020 | NADPH oxidase complex(GO:0043020) |
| 2.3 | 6.9 | GO:0035577 | azurophil granule membrane(GO:0035577) |
| 2.2 | 6.6 | GO:0031680 | G-protein beta/gamma-subunit complex(GO:0031680) |
| 2.2 | 8.8 | GO:0071664 | catenin-TCF7L2 complex(GO:0071664) |
| 2.0 | 8.1 | GO:0061474 | phagolysosome membrane(GO:0061474) |
| 2.0 | 10.0 | GO:0005927 | muscle tendon junction(GO:0005927) |
| 2.0 | 7.9 | GO:0097149 | centralspindlin complex(GO:0097149) |
| 2.0 | 7.8 | GO:0036398 | TCR signalosome(GO:0036398) |
| 1.9 | 7.7 | GO:0020005 | symbiont-containing vacuole membrane(GO:0020005) |
| 1.8 | 5.3 | GO:0097629 | extrinsic component of omegasome membrane(GO:0097629) |
| 1.7 | 5.0 | GO:0097124 | cyclin A2-CDK2 complex(GO:0097124) |
| 1.6 | 32.3 | GO:0034364 | high-density lipoprotein particle(GO:0034364) |
| 1.6 | 6.2 | GO:0031436 | BRCA1-BARD1 complex(GO:0031436) |
| 1.5 | 5.8 | GO:0044307 | dendritic branch(GO:0044307) |
| 1.4 | 4.3 | GO:0071148 | TEAD-1-YAP complex(GO:0071148) TEAD-2-YAP complex(GO:0071149) |
| 1.4 | 5.6 | GO:0005607 | laminin-2 complex(GO:0005607) |
| 1.3 | 6.4 | GO:0030868 | smooth endoplasmic reticulum membrane(GO:0030868) smooth endoplasmic reticulum part(GO:0097425) |
| 1.2 | 4.9 | GO:0032777 | Piccolo NuA4 histone acetyltransferase complex(GO:0032777) |
| 1.2 | 6.1 | GO:0035976 | AP1 complex(GO:0035976) |
| 1.2 | 15.3 | GO:0031254 | uropod(GO:0001931) cell trailing edge(GO:0031254) |
| 1.2 | 5.9 | GO:1903767 | sweet taste receptor complex(GO:1903767) taste receptor complex(GO:1903768) |
| 1.2 | 3.5 | GO:0031298 | replication fork protection complex(GO:0031298) |
| 1.2 | 34.8 | GO:0042588 | zymogen granule(GO:0042588) |
| 1.1 | 3.3 | GO:0035101 | FACT complex(GO:0035101) |
| 1.1 | 4.4 | GO:0046696 | lipopolysaccharide receptor complex(GO:0046696) |
| 1.1 | 8.6 | GO:0005577 | fibrinogen complex(GO:0005577) |
| 1.0 | 3.1 | GO:0005749 | mitochondrial respiratory chain complex II, succinate dehydrogenase complex (ubiquinone)(GO:0005749) succinate dehydrogenase complex (ubiquinone)(GO:0045257) fumarate reductase complex(GO:0045283) |
| 1.0 | 3.0 | GO:0097125 | cyclin B1-CDK1 complex(GO:0097125) |
| 1.0 | 5.9 | GO:0030478 | actin cap(GO:0030478) |
| 1.0 | 3.8 | GO:0019815 | B cell receptor complex(GO:0019815) |
| 0.9 | 3.4 | GO:0072559 | NLRP3 inflammasome complex(GO:0072559) |
| 0.8 | 9.8 | GO:0005859 | muscle myosin complex(GO:0005859) |
| 0.8 | 3.2 | GO:0030121 | AP-1 adaptor complex(GO:0030121) |
| 0.8 | 6.2 | GO:0000235 | astral microtubule(GO:0000235) aster(GO:0005818) |
| 0.8 | 3.9 | GO:0035867 | alphav-beta3 integrin-IGF-1-IGF1R complex(GO:0035867) |
| 0.8 | 2.3 | GO:0000110 | nucleotide-excision repair factor 1 complex(GO:0000110) |
| 0.7 | 4.4 | GO:0097342 | ripoptosome(GO:0097342) |
| 0.7 | 2.9 | GO:0001405 | presequence translocase-associated import motor(GO:0001405) |
| 0.7 | 73.0 | GO:0072562 | blood microparticle(GO:0072562) |
| 0.7 | 2.8 | GO:0020016 | ciliary pocket(GO:0020016) ciliary pocket membrane(GO:0020018) |
| 0.7 | 2.0 | GO:0005899 | insulin receptor complex(GO:0005899) |
| 0.7 | 2.0 | GO:0005712 | chiasma(GO:0005712) |
| 0.7 | 2.6 | GO:0043564 | Ku70:Ku80 complex(GO:0043564) |
| 0.6 | 4.5 | GO:0097136 | Bcl-2 family protein complex(GO:0097136) |
| 0.6 | 15.2 | GO:0042629 | mast cell granule(GO:0042629) |
| 0.6 | 189.7 | GO:0009897 | external side of plasma membrane(GO:0009897) |
| 0.6 | 17.0 | GO:0046930 | pore complex(GO:0046930) |
| 0.6 | 7.1 | GO:0044215 | other organism(GO:0044215) other organism cell(GO:0044216) other organism part(GO:0044217) |
| 0.6 | 1.8 | GO:1990682 | CSF1-CSF1R complex(GO:1990682) |
| 0.6 | 10.4 | GO:0005782 | peroxisomal matrix(GO:0005782) microbody lumen(GO:0031907) |
| 0.6 | 4.5 | GO:0016282 | eukaryotic 43S preinitiation complex(GO:0016282) eukaryotic 48S preinitiation complex(GO:0033290) |
| 0.6 | 23.5 | GO:0000791 | euchromatin(GO:0000791) |
| 0.6 | 2.2 | GO:1990630 | IRE1-RACK1-PP2A complex(GO:1990630) |
| 0.5 | 15.3 | GO:0080008 | Cul4-RING E3 ubiquitin ligase complex(GO:0080008) |
| 0.5 | 3.1 | GO:0030681 | nucleolar ribonuclease P complex(GO:0005655) ribonuclease P complex(GO:0030677) multimeric ribonuclease P complex(GO:0030681) |
| 0.5 | 3.1 | GO:0005608 | laminin-3 complex(GO:0005608) |
| 0.5 | 1.5 | GO:0098835 | presynaptic endocytic zone(GO:0098833) presynaptic endocytic zone membrane(GO:0098835) |
| 0.5 | 7.1 | GO:0031618 | nuclear pericentric heterochromatin(GO:0031618) |
| 0.5 | 2.5 | GO:0098536 | deuterosome(GO:0098536) |
| 0.5 | 3.0 | GO:0097209 | epidermal lamellar body(GO:0097209) |
| 0.5 | 3.0 | GO:0032444 | activin responsive factor complex(GO:0032444) |
| 0.5 | 3.9 | GO:0019907 | cyclin-dependent protein kinase activating kinase holoenzyme complex(GO:0019907) |
| 0.5 | 1.4 | GO:0070421 | DNA ligase III-XRCC1 complex(GO:0070421) |
| 0.5 | 11.5 | GO:0001533 | cornified envelope(GO:0001533) |
| 0.4 | 6.3 | GO:0031616 | spindle pole centrosome(GO:0031616) |
| 0.4 | 3.1 | GO:0035068 | micro-ribonucleoprotein complex(GO:0035068) |
| 0.4 | 15.9 | GO:0005720 | nuclear heterochromatin(GO:0005720) |
| 0.4 | 8.0 | GO:0005614 | interstitial matrix(GO:0005614) |
| 0.4 | 1.3 | GO:0070557 | PCNA-p21 complex(GO:0070557) |
| 0.4 | 4.8 | GO:0097542 | ciliary tip(GO:0097542) |
| 0.4 | 2.2 | GO:0030015 | CCR4-NOT core complex(GO:0030015) |
| 0.4 | 8.7 | GO:0005605 | basal lamina(GO:0005605) |
| 0.4 | 6.1 | GO:0016580 | Sin3 complex(GO:0016580) |
| 0.4 | 20.1 | GO:0042645 | nucleoid(GO:0009295) mitochondrial nucleoid(GO:0042645) |
| 0.4 | 2.0 | GO:0098799 | outer mitochondrial membrane protein complex(GO:0098799) |
| 0.4 | 2.4 | GO:0036449 | microtubule minus-end(GO:0036449) |
| 0.4 | 1.2 | GO:0000438 | core TFIIH complex portion of holo TFIIH complex(GO:0000438) |
| 0.4 | 3.5 | GO:0071204 | histone pre-mRNA 3'end processing complex(GO:0071204) |
| 0.4 | 5.0 | GO:0005721 | pericentric heterochromatin(GO:0005721) |
| 0.4 | 6.8 | GO:0030057 | desmosome(GO:0030057) |
| 0.4 | 7.2 | GO:0045120 | pronucleus(GO:0045120) |
| 0.4 | 25.9 | GO:0045095 | keratin filament(GO:0045095) |
| 0.4 | 2.2 | GO:0000796 | condensin complex(GO:0000796) |
| 0.4 | 1.5 | GO:0035339 | SPOTS complex(GO:0035339) |
| 0.4 | 1.8 | GO:0005672 | transcription factor TFIIA complex(GO:0005672) |
| 0.4 | 6.2 | GO:0008250 | oligosaccharyltransferase complex(GO:0008250) |
| 0.4 | 4.7 | GO:0000276 | mitochondrial proton-transporting ATP synthase complex, coupling factor F(o)(GO:0000276) |
| 0.4 | 5.7 | GO:0045180 | basal cortex(GO:0045180) |
| 0.4 | 1.4 | GO:0002947 | tumor necrosis factor receptor superfamily complex(GO:0002947) |
| 0.4 | 2.5 | GO:0000127 | transcription factor TFIIIC complex(GO:0000127) |
| 0.3 | 3.1 | GO:0031209 | SCAR complex(GO:0031209) |
| 0.3 | 3.8 | GO:0072546 | ER membrane protein complex(GO:0072546) |
| 0.3 | 6.2 | GO:0045277 | respiratory chain complex IV(GO:0045277) |
| 0.3 | 1.3 | GO:0097197 | tetraspanin-enriched microdomain(GO:0097197) |
| 0.3 | 2.6 | GO:0005664 | origin recognition complex(GO:0000808) nuclear origin of replication recognition complex(GO:0005664) |
| 0.3 | 21.4 | GO:0005581 | collagen trimer(GO:0005581) |
| 0.3 | 3.2 | GO:0032009 | early phagosome(GO:0032009) |
| 0.3 | 3.5 | GO:0071564 | npBAF complex(GO:0071564) |
| 0.3 | 1.6 | GO:0005683 | U7 snRNP(GO:0005683) |
| 0.3 | 2.8 | GO:0070971 | endoplasmic reticulum exit site(GO:0070971) |
| 0.3 | 2.1 | GO:0097504 | Gemini of coiled bodies(GO:0097504) |
| 0.3 | 0.9 | GO:0005967 | mitochondrial pyruvate dehydrogenase complex(GO:0005967) |
| 0.3 | 2.9 | GO:0070187 | telosome(GO:0070187) |
| 0.3 | 4.9 | GO:0031235 | intrinsic component of the cytoplasmic side of the plasma membrane(GO:0031235) |
| 0.3 | 27.8 | GO:0016605 | PML body(GO:0016605) |
| 0.3 | 4.0 | GO:0008278 | cohesin complex(GO:0008278) |
| 0.3 | 1.7 | GO:0097422 | tubular endosome(GO:0097422) |
| 0.3 | 1.1 | GO:0097196 | Shu complex(GO:0097196) |
| 0.3 | 16.7 | GO:0005746 | mitochondrial respiratory chain(GO:0005746) |
| 0.3 | 2.6 | GO:0030062 | mitochondrial tricarboxylic acid cycle enzyme complex(GO:0030062) |
| 0.3 | 6.6 | GO:0005640 | nuclear outer membrane(GO:0005640) |
| 0.3 | 1.5 | GO:0005663 | DNA replication factor C complex(GO:0005663) |
| 0.3 | 2.0 | GO:0044322 | endoplasmic reticulum quality control compartment(GO:0044322) |
| 0.2 | 1.0 | GO:0097452 | GAIT complex(GO:0097452) |
| 0.2 | 1.5 | GO:0005850 | eukaryotic translation initiation factor 2 complex(GO:0005850) |
| 0.2 | 1.2 | GO:0005642 | annulate lamellae(GO:0005642) |
| 0.2 | 20.4 | GO:0044815 | nucleosome(GO:0000786) DNA packaging complex(GO:0044815) |
| 0.2 | 4.5 | GO:0005665 | DNA-directed RNA polymerase II, core complex(GO:0005665) |
| 0.2 | 4.0 | GO:0005682 | U5 snRNP(GO:0005682) |
| 0.2 | 6.1 | GO:0031307 | integral component of mitochondrial outer membrane(GO:0031307) |
| 0.2 | 1.9 | GO:0097431 | mitotic spindle pole(GO:0097431) |
| 0.2 | 1.4 | GO:0070531 | BRCA1-A complex(GO:0070531) |
| 0.2 | 0.9 | GO:0048476 | Holliday junction resolvase complex(GO:0048476) |
| 0.2 | 1.9 | GO:0005964 | phosphorylase kinase complex(GO:0005964) |
| 0.2 | 3.9 | GO:0090665 | dystrophin-associated glycoprotein complex(GO:0016010) glycoprotein complex(GO:0090665) |
| 0.2 | 2.3 | GO:0031143 | pseudopodium(GO:0031143) |
| 0.2 | 2.4 | GO:0033202 | Ino80 complex(GO:0031011) DNA helicase complex(GO:0033202) |
| 0.2 | 3.3 | GO:0030061 | mitochondrial crista(GO:0030061) |
| 0.2 | 15.5 | GO:0022627 | cytosolic small ribosomal subunit(GO:0022627) |
| 0.2 | 11.0 | GO:0005758 | mitochondrial intermembrane space(GO:0005758) |
| 0.2 | 1.0 | GO:0042719 | mitochondrial intermembrane space protein transporter complex(GO:0042719) |
| 0.2 | 12.3 | GO:0005778 | peroxisomal membrane(GO:0005778) microbody membrane(GO:0031903) |
| 0.2 | 18.2 | GO:0022625 | cytosolic large ribosomal subunit(GO:0022625) |
| 0.2 | 2.9 | GO:0032045 | guanyl-nucleotide exchange factor complex(GO:0032045) |
| 0.2 | 229.8 | GO:0005615 | extracellular space(GO:0005615) |
| 0.2 | 1.9 | GO:0005662 | DNA replication factor A complex(GO:0005662) |
| 0.2 | 11.4 | GO:0005604 | basement membrane(GO:0005604) |
| 0.2 | 10.6 | GO:0005643 | nuclear pore(GO:0005643) |
| 0.2 | 1.7 | GO:0071821 | FANCM-MHF complex(GO:0071821) |
| 0.2 | 0.9 | GO:0042405 | nuclear inclusion body(GO:0042405) |
| 0.2 | 1.5 | GO:0072669 | tRNA-splicing ligase complex(GO:0072669) |
| 0.2 | 1.9 | GO:0005852 | eukaryotic translation initiation factor 3 complex(GO:0005852) |
| 0.2 | 0.7 | GO:0031417 | NatC complex(GO:0031417) |
| 0.2 | 0.5 | GO:0061689 | tricellular tight junction(GO:0061689) |
| 0.2 | 2.3 | GO:0060091 | kinocilium(GO:0060091) |
| 0.2 | 2.2 | GO:0005639 | integral component of nuclear inner membrane(GO:0005639) intrinsic component of nuclear inner membrane(GO:0031229) nuclear membrane part(GO:0044453) |
| 0.2 | 1.5 | GO:0005686 | U2 snRNP(GO:0005686) |
| 0.2 | 0.7 | GO:0000783 | telomere cap complex(GO:0000782) nuclear telomere cap complex(GO:0000783) |
| 0.2 | 1.8 | GO:0046581 | intercellular canaliculus(GO:0046581) |
| 0.2 | 13.6 | GO:0016363 | nuclear matrix(GO:0016363) |
| 0.2 | 13.6 | GO:0090575 | RNA polymerase II transcription factor complex(GO:0090575) |
| 0.2 | 20.1 | GO:0001650 | fibrillar center(GO:0001650) |
| 0.2 | 0.9 | GO:0030289 | protein phosphatase 4 complex(GO:0030289) |
| 0.2 | 1.1 | GO:0001673 | male germ cell nucleus(GO:0001673) |
| 0.1 | 1.6 | GO:0043240 | Fanconi anaemia nuclear complex(GO:0043240) |
| 0.1 | 4.9 | GO:0031519 | PcG protein complex(GO:0031519) |
| 0.1 | 5.1 | GO:0009925 | basal plasma membrane(GO:0009925) |
| 0.1 | 0.9 | GO:0070449 | elongin complex(GO:0070449) |
| 0.1 | 1.0 | GO:0030312 | external encapsulating structure(GO:0030312) |
| 0.1 | 6.6 | GO:0032993 | protein-DNA complex(GO:0032993) |
| 0.1 | 0.8 | GO:0036195 | muscle cell projection(GO:0036194) muscle cell projection membrane(GO:0036195) |
| 0.1 | 2.7 | GO:0005671 | Ada2/Gcn5/Ada3 transcription activator complex(GO:0005671) |
| 0.1 | 1.3 | GO:0002199 | zona pellucida receptor complex(GO:0002199) |
| 0.1 | 1.4 | GO:0000801 | central element(GO:0000801) |
| 0.1 | 0.3 | GO:0045254 | pyruvate dehydrogenase complex(GO:0045254) |
| 0.1 | 1.1 | GO:0042555 | MCM complex(GO:0042555) |
| 0.1 | 3.4 | GO:0005763 | organellar small ribosomal subunit(GO:0000314) mitochondrial small ribosomal subunit(GO:0005763) |
| 0.1 | 0.4 | GO:1990851 | Wnt-Frizzled-LRP5/6 complex(GO:1990851) |
| 0.1 | 11.5 | GO:0000776 | kinetochore(GO:0000776) |
| 0.1 | 23.4 | GO:0005759 | mitochondrial matrix(GO:0005759) |
| 0.1 | 7.1 | GO:0005840 | ribosome(GO:0005840) |
| 0.1 | 78.8 | GO:0005789 | endoplasmic reticulum membrane(GO:0005789) |
| 0.1 | 5.8 | GO:0034707 | chloride channel complex(GO:0034707) |
| 0.1 | 0.7 | GO:0042622 | photoreceptor outer segment membrane(GO:0042622) |
| 0.1 | 5.3 | GO:0017053 | transcriptional repressor complex(GO:0017053) |
| 0.1 | 23.3 | GO:0005667 | transcription factor complex(GO:0005667) |
| 0.1 | 2.7 | GO:0031305 | intrinsic component of mitochondrial inner membrane(GO:0031304) integral component of mitochondrial inner membrane(GO:0031305) |
| 0.1 | 1.0 | GO:0000445 | THO complex(GO:0000347) THO complex part of transcription export complex(GO:0000445) |
| 0.1 | 4.0 | GO:0030667 | secretory granule membrane(GO:0030667) |
| 0.1 | 1.3 | GO:0035145 | exon-exon junction complex(GO:0035145) |
| 0.1 | 0.9 | GO:0035267 | NuA4 histone acetyltransferase complex(GO:0035267) H4/H2A histone acetyltransferase complex(GO:0043189) H4 histone acetyltransferase complex(GO:1902562) |
| 0.1 | 2.2 | GO:0000159 | protein phosphatase type 2A complex(GO:0000159) |
| 0.1 | 1.8 | GO:0001772 | immunological synapse(GO:0001772) |
| 0.1 | 3.4 | GO:0001917 | photoreceptor inner segment(GO:0001917) |
| 0.1 | 22.2 | GO:0005924 | cell-substrate adherens junction(GO:0005924) focal adhesion(GO:0005925) |
| 0.1 | 3.7 | GO:0000781 | chromosome, telomeric region(GO:0000781) |
| 0.1 | 0.7 | GO:0005685 | U1 snRNP(GO:0005685) |
| 0.1 | 1.0 | GO:0005753 | mitochondrial proton-transporting ATP synthase complex(GO:0005753) |
| 0.1 | 3.3 | GO:0005788 | endoplasmic reticulum lumen(GO:0005788) |
| 0.1 | 17.6 | GO:0016607 | nuclear speck(GO:0016607) |
| 0.1 | 0.9 | GO:0005689 | U12-type spliceosomal complex(GO:0005689) |
| 0.1 | 0.6 | GO:0034045 | pre-autophagosomal structure membrane(GO:0034045) |
| 0.1 | 0.5 | GO:0051233 | spindle midzone(GO:0051233) |
| 0.1 | 0.4 | GO:0071203 | WASH complex(GO:0071203) |
| 0.1 | 0.2 | GO:0097513 | myosin II filament(GO:0097513) |
| 0.0 | 0.8 | GO:0000152 | nuclear ubiquitin ligase complex(GO:0000152) |
| 0.0 | 0.3 | GO:0031932 | TORC2 complex(GO:0031932) |
| 0.0 | 0.7 | GO:0005922 | connexon complex(GO:0005922) |
| 0.0 | 1.0 | GO:0030173 | integral component of Golgi membrane(GO:0030173) |
| 0.0 | 30.9 | GO:0005739 | mitochondrion(GO:0005739) |
| 0.0 | 0.2 | GO:0031083 | BLOC-1 complex(GO:0031083) |
| 0.0 | 1.4 | GO:0019005 | SCF ubiquitin ligase complex(GO:0019005) |
| 0.0 | 0.6 | GO:0005793 | endoplasmic reticulum-Golgi intermediate compartment(GO:0005793) |
| 0.0 | 0.5 | GO:0030687 | preribosome, large subunit precursor(GO:0030687) |
| 0.0 | 0.3 | GO:0034399 | nuclear periphery(GO:0034399) |
| 0.0 | 0.5 | GO:0031672 | A band(GO:0031672) |
| 0.0 | 0.3 | GO:0005892 | acetylcholine-gated channel complex(GO:0005892) |
| 0.0 | 0.4 | GO:0045335 | phagocytic vesicle(GO:0045335) |
| 0.0 | 0.0 | GO:0016593 | Cdc73/Paf1 complex(GO:0016593) |
| 0.0 | 0.2 | GO:0019013 | viral nucleocapsid(GO:0019013) |
| 0.0 | 6.7 | GO:0005730 | nucleolus(GO:0005730) |
Gene overrepresentation in molecular function category:
| Log-likelihood per target | Total log-likelihood | Term | Description |
|---|---|---|---|
| 9.7 | 48.6 | GO:0070892 | lipoteichoic acid receptor activity(GO:0070892) |
| 8.4 | 25.1 | GO:0070653 | high-density lipoprotein particle receptor binding(GO:0070653) |
| 8.3 | 24.9 | GO:0004833 | tryptophan 2,3-dioxygenase activity(GO:0004833) |
| 6.8 | 34.0 | GO:0043120 | tumor necrosis factor binding(GO:0043120) |
| 4.9 | 14.6 | GO:0004556 | alpha-amylase activity(GO:0004556) |
| 4.7 | 18.8 | GO:0004740 | pyruvate dehydrogenase (acetyl-transferring) kinase activity(GO:0004740) |
| 4.2 | 12.6 | GO:0060230 | lipoprotein lipase activator activity(GO:0060230) |
| 4.1 | 16.4 | GO:0031433 | telethonin binding(GO:0031433) |
| 3.8 | 23.1 | GO:0035662 | Toll-like receptor 4 binding(GO:0035662) |
| 3.6 | 14.3 | GO:0005136 | interleukin-4 receptor binding(GO:0005136) |
| 3.2 | 12.9 | GO:0016716 | oxidoreductase activity, acting on paired donors, with incorporation or reduction of molecular oxygen, another compound as one donor, and incorporation of one atom of oxygen(GO:0016716) |
| 3.2 | 12.9 | GO:0008597 | calcium-dependent protein serine/threonine phosphatase regulator activity(GO:0008597) |
| 3.2 | 12.7 | GO:0004771 | sterol esterase activity(GO:0004771) |
| 3.0 | 90.7 | GO:0008392 | arachidonic acid epoxygenase activity(GO:0008392) |
| 2.7 | 19.1 | GO:1901612 | cardiolipin binding(GO:1901612) |
| 2.7 | 16.3 | GO:0042289 | MHC class II protein binding(GO:0042289) |
| 2.5 | 7.6 | GO:0047522 | 15-oxoprostaglandin 13-oxidase activity(GO:0047522) |
| 2.5 | 12.7 | GO:0051373 | FATZ binding(GO:0051373) |
| 2.5 | 12.3 | GO:0004031 | aldehyde oxidase activity(GO:0004031) oxidoreductase activity, acting on the aldehyde or oxo group of donors, oxygen as acceptor(GO:0016623) |
| 2.4 | 7.3 | GO:0032810 | sterol response element binding(GO:0032810) |
| 2.4 | 16.6 | GO:0019863 | IgE binding(GO:0019863) |
| 2.4 | 9.4 | GO:0004691 | cAMP-dependent protein kinase activity(GO:0004691) |
| 2.2 | 6.7 | GO:0008142 | oxysterol binding(GO:0008142) |
| 2.2 | 19.4 | GO:0016175 | superoxide-generating NADPH oxidase activity(GO:0016175) |
| 2.1 | 15.0 | GO:0035375 | zymogen binding(GO:0035375) |
| 2.1 | 6.3 | GO:0001605 | adrenomedullin receptor activity(GO:0001605) |
| 2.1 | 10.5 | GO:0005534 | galactose binding(GO:0005534) |
| 2.0 | 10.1 | GO:0051032 | nucleic acid transmembrane transporter activity(GO:0051032) RNA transmembrane transporter activity(GO:0051033) |
| 2.0 | 8.0 | GO:0001225 | RNA polymerase II transcription coactivator binding(GO:0001225) |
| 1.9 | 36.4 | GO:0001848 | complement binding(GO:0001848) |
| 1.9 | 28.3 | GO:0005344 | oxygen transporter activity(GO:0005344) |
| 1.9 | 5.6 | GO:0047787 | delta4-3-oxosteroid 5beta-reductase activity(GO:0047787) |
| 1.8 | 11.0 | GO:0019976 | interleukin-2 binding(GO:0019976) |
| 1.8 | 5.4 | GO:0008732 | threonine aldolase activity(GO:0004793) L-allo-threonine aldolase activity(GO:0008732) |
| 1.8 | 17.8 | GO:0008429 | phosphatidylethanolamine binding(GO:0008429) |
| 1.8 | 7.1 | GO:0070915 | lysophosphatidic acid receptor activity(GO:0070915) |
| 1.8 | 5.3 | GO:0047023 | androsterone dehydrogenase activity(GO:0047023) |
| 1.8 | 10.6 | GO:0004886 | 9-cis retinoic acid receptor activity(GO:0004886) |
| 1.8 | 10.5 | GO:0005332 | gamma-aminobutyric acid:sodium symporter activity(GO:0005332) |
| 1.7 | 11.7 | GO:0030881 | beta-2-microglobulin binding(GO:0030881) |
| 1.7 | 6.7 | GO:0004165 | dodecenoyl-CoA delta-isomerase activity(GO:0004165) |
| 1.6 | 6.3 | GO:0086056 | voltage-gated calcium channel activity involved in AV node cell action potential(GO:0086056) |
| 1.5 | 12.4 | GO:0004908 | interleukin-1 receptor activity(GO:0004908) |
| 1.5 | 15.3 | GO:0015143 | urate transmembrane transporter activity(GO:0015143) salt transmembrane transporter activity(GO:1901702) |
| 1.5 | 6.1 | GO:0019002 | GMP binding(GO:0019002) |
| 1.5 | 4.5 | GO:0004478 | methionine adenosyltransferase activity(GO:0004478) |
| 1.5 | 6.0 | GO:0004743 | pyruvate kinase activity(GO:0004743) |
| 1.5 | 46.0 | GO:0015020 | glucuronosyltransferase activity(GO:0015020) |
| 1.5 | 5.9 | GO:0004719 | protein-L-isoaspartate (D-aspartate) O-methyltransferase activity(GO:0004719) |
| 1.5 | 8.8 | GO:0004366 | glycerol-3-phosphate O-acyltransferase activity(GO:0004366) |
| 1.5 | 4.4 | GO:0004704 | NF-kappaB-inducing kinase activity(GO:0004704) |
| 1.4 | 18.4 | GO:1990405 | protein antigen binding(GO:1990405) |
| 1.4 | 4.1 | GO:0017077 | oxidative phosphorylation uncoupler activity(GO:0017077) |
| 1.3 | 5.3 | GO:0003842 | 1-pyrroline-5-carboxylate dehydrogenase activity(GO:0003842) |
| 1.3 | 9.1 | GO:0004767 | sphingomyelin phosphodiesterase activity(GO:0004767) |
| 1.3 | 3.8 | GO:0050656 | 3'-phosphoadenosine 5'-phosphosulfate binding(GO:0050656) |
| 1.3 | 11.4 | GO:0047498 | calcium-dependent phospholipase A2 activity(GO:0047498) |
| 1.3 | 10.1 | GO:0005049 | nuclear export signal receptor activity(GO:0005049) |
| 1.3 | 3.8 | GO:0004809 | tRNA (guanine-N2-)-methyltransferase activity(GO:0004809) |
| 1.2 | 6.2 | GO:0004301 | epoxide hydrolase activity(GO:0004301) |
| 1.2 | 8.7 | GO:0016661 | oxidoreductase activity, acting on other nitrogenous compounds as donors(GO:0016661) |
| 1.2 | 22.1 | GO:0019865 | immunoglobulin binding(GO:0019865) |
| 1.2 | 6.1 | GO:0019211 | phosphatase activator activity(GO:0019211) |
| 1.2 | 27.2 | GO:0042288 | MHC class I protein binding(GO:0042288) |
| 1.2 | 8.2 | GO:0019238 | cyclohydrolase activity(GO:0019238) |
| 1.2 | 15.2 | GO:0097200 | cysteine-type endopeptidase activity involved in execution phase of apoptosis(GO:0097200) |
| 1.2 | 3.5 | GO:0016508 | long-chain-enoyl-CoA hydratase activity(GO:0016508) long-chain-3-hydroxyacyl-CoA dehydrogenase activity(GO:0016509) |
| 1.1 | 4.6 | GO:0008427 | calcium-dependent protein kinase inhibitor activity(GO:0008427) |
| 1.1 | 13.4 | GO:0031432 | titin binding(GO:0031432) |
| 1.1 | 6.7 | GO:0008349 | MAP kinase kinase kinase kinase activity(GO:0008349) |
| 1.1 | 3.3 | GO:0004566 | beta-glucuronidase activity(GO:0004566) |
| 1.1 | 13.1 | GO:0008191 | metalloendopeptidase inhibitor activity(GO:0008191) |
| 1.1 | 4.4 | GO:0003987 | acetate-CoA ligase activity(GO:0003987) |
| 1.1 | 13.0 | GO:0017162 | aryl hydrocarbon receptor binding(GO:0017162) |
| 1.1 | 6.4 | GO:0008970 | phosphatidylcholine 1-acylhydrolase activity(GO:0008970) |
| 1.1 | 6.3 | GO:0045545 | syndecan binding(GO:0045545) |
| 1.1 | 5.3 | GO:0031493 | nucleosomal histone binding(GO:0031493) |
| 1.0 | 30.4 | GO:0016712 | oxidoreductase activity, acting on paired donors, with incorporation or reduction of molecular oxygen, reduced flavin or flavoprotein as one donor, and incorporation of one atom of oxygen(GO:0016712) |
| 1.0 | 4.1 | GO:0004645 | phosphorylase activity(GO:0004645) |
| 1.0 | 3.1 | GO:0015322 | proton-dependent oligopeptide secondary active transmembrane transporter activity(GO:0005427) secondary active oligopeptide transmembrane transporter activity(GO:0015322) |
| 1.0 | 3.1 | GO:0019959 | interleukin-8 receptor activity(GO:0004918) interleukin-8 binding(GO:0019959) |
| 1.0 | 3.1 | GO:0008177 | succinate dehydrogenase (ubiquinone) activity(GO:0008177) |
| 1.0 | 5.1 | GO:0005052 | peroxisome matrix targeting signal-1 binding(GO:0005052) |
| 1.0 | 6.1 | GO:0004616 | phosphogluconate dehydrogenase (decarboxylating) activity(GO:0004616) |
| 1.0 | 20.2 | GO:0031434 | mitogen-activated protein kinase kinase binding(GO:0031434) |
| 1.0 | 7.0 | GO:0008474 | palmitoyl-(protein) hydrolase activity(GO:0008474) palmitoyl hydrolase activity(GO:0098599) |
| 1.0 | 2.9 | GO:0015254 | glycerol channel activity(GO:0015254) |
| 1.0 | 5.7 | GO:0047696 | beta-adrenergic receptor kinase activity(GO:0047696) |
| 0.9 | 4.7 | GO:0030280 | structural constituent of epidermis(GO:0030280) |
| 0.9 | 2.8 | GO:0004159 | dihydrouracil dehydrogenase (NAD+) activity(GO:0004159) dihydropyrimidine dehydrogenase (NADP+) activity(GO:0017113) |
| 0.9 | 2.7 | GO:0004483 | mRNA (nucleoside-2'-O-)-methyltransferase activity(GO:0004483) |
| 0.9 | 2.6 | GO:0004774 | succinate-CoA ligase activity(GO:0004774) succinate-CoA ligase (ADP-forming) activity(GO:0004775) |
| 0.9 | 7.9 | GO:0003924 | GTPase activity(GO:0003924) |
| 0.9 | 6.1 | GO:0016899 | oxidoreductase activity, acting on the CH-OH group of donors, oxygen as acceptor(GO:0016899) |
| 0.9 | 19.8 | GO:0001871 | pattern binding(GO:0001871) polysaccharide binding(GO:0030247) |
| 0.9 | 4.3 | GO:0046790 | virion binding(GO:0046790) |
| 0.8 | 5.0 | GO:0008865 | glucokinase activity(GO:0004340) hexokinase activity(GO:0004396) fructokinase activity(GO:0008865) mannokinase activity(GO:0019158) |
| 0.8 | 5.0 | GO:0004568 | chitinase activity(GO:0004568) |
| 0.8 | 11.7 | GO:0030898 | actin-dependent ATPase activity(GO:0030898) |
| 0.8 | 9.9 | GO:0070008 | serine-type exopeptidase activity(GO:0070008) |
| 0.8 | 17.0 | GO:0015288 | porin activity(GO:0015288) |
| 0.8 | 3.2 | GO:0047619 | acylcarnitine hydrolase activity(GO:0047619) |
| 0.8 | 8.9 | GO:0001161 | intronic transcription regulatory region sequence-specific DNA binding(GO:0001161) |
| 0.8 | 9.6 | GO:0004499 | N,N-dimethylaniline monooxygenase activity(GO:0004499) |
| 0.8 | 4.0 | GO:0097493 | structural molecule activity conferring elasticity(GO:0097493) |
| 0.8 | 3.2 | GO:0055100 | adiponectin binding(GO:0055100) |
| 0.8 | 3.1 | GO:0070883 | ribonuclease III activity(GO:0004525) double-stranded RNA-specific ribonuclease activity(GO:0032296) pre-miRNA binding(GO:0070883) |
| 0.8 | 4.7 | GO:0008140 | cAMP response element binding protein binding(GO:0008140) |
| 0.8 | 30.4 | GO:0005164 | tumor necrosis factor receptor binding(GO:0005164) |
| 0.8 | 6.2 | GO:0003956 | NAD(P)+-protein-arginine ADP-ribosyltransferase activity(GO:0003956) |
| 0.8 | 2.3 | GO:0016263 | glycoprotein-N-acetylgalactosamine 3-beta-galactosyltransferase activity(GO:0016263) |
| 0.8 | 2.3 | GO:0005503 | all-trans retinal binding(GO:0005503) benzaldehyde dehydrogenase activity(GO:0019115) S-(hydroxymethyl)glutathione dehydrogenase activity(GO:0051903) |
| 0.8 | 3.1 | GO:0016416 | carnitine O-palmitoyltransferase activity(GO:0004095) O-palmitoyltransferase activity(GO:0016416) |
| 0.7 | 12.7 | GO:0005537 | mannose binding(GO:0005537) |
| 0.7 | 9.0 | GO:0016884 | carbon-nitrogen ligase activity, with glutamine as amido-N-donor(GO:0016884) |
| 0.7 | 3.0 | GO:0016433 | rRNA (adenine) methyltransferase activity(GO:0016433) |
| 0.7 | 83.2 | GO:0004867 | serine-type endopeptidase inhibitor activity(GO:0004867) |
| 0.7 | 3.0 | GO:0038181 | bile acid receptor activity(GO:0038181) |
| 0.7 | 17.6 | GO:0042975 | peroxisome proliferator activated receptor binding(GO:0042975) |
| 0.7 | 2.9 | GO:0019237 | centromeric DNA binding(GO:0019237) |
| 0.7 | 7.9 | GO:0004571 | mannosyl-oligosaccharide 1,2-alpha-mannosidase activity(GO:0004571) |
| 0.7 | 5.0 | GO:0047035 | testosterone dehydrogenase (NAD+) activity(GO:0047035) |
| 0.7 | 6.4 | GO:0070061 | fructose binding(GO:0070061) |
| 0.7 | 3.6 | GO:0005134 | interleukin-2 receptor binding(GO:0005134) |
| 0.7 | 2.1 | GO:0050145 | nucleoside phosphate kinase activity(GO:0050145) |
| 0.7 | 5.0 | GO:0035033 | histone deacetylase regulator activity(GO:0035033) |
| 0.7 | 2.1 | GO:0004651 | polynucleotide 5'-phosphatase activity(GO:0004651) |
| 0.7 | 12.7 | GO:0043295 | glutathione binding(GO:0043295) |
| 0.7 | 2.1 | GO:0051734 | ATP-dependent polydeoxyribonucleotide 5'-hydroxyl-kinase activity(GO:0046404) polydeoxyribonucleotide kinase activity(GO:0051733) ATP-dependent polynucleotide kinase activity(GO:0051734) |
| 0.7 | 3.4 | GO:0034186 | apolipoprotein A-I binding(GO:0034186) |
| 0.7 | 2.7 | GO:0047276 | N-acetyllactosaminide 3-alpha-galactosyltransferase activity(GO:0047276) |
| 0.7 | 2.0 | GO:0048408 | epidermal growth factor binding(GO:0048408) |
| 0.7 | 10.8 | GO:0051371 | muscle alpha-actinin binding(GO:0051371) |
| 0.7 | 4.7 | GO:0030620 | U2 snRNA binding(GO:0030620) |
| 0.7 | 2.0 | GO:0051425 | PTB domain binding(GO:0051425) |
| 0.7 | 14.0 | GO:0001530 | lipopolysaccharide binding(GO:0001530) |
| 0.7 | 2.0 | GO:0003960 | NADPH:quinone reductase activity(GO:0003960) |
| 0.7 | 1.3 | GO:0052871 | leukotriene-B4 20-monooxygenase activity(GO:0050051) tocopherol omega-hydroxylase activity(GO:0052870) alpha-tocopherol omega-hydroxylase activity(GO:0052871) |
| 0.6 | 2.6 | GO:1990189 | peptide-serine-N-acetyltransferase activity(GO:1990189) |
| 0.6 | 7.0 | GO:0005381 | iron ion transmembrane transporter activity(GO:0005381) |
| 0.6 | 2.5 | GO:1990955 | G-rich single-stranded DNA binding(GO:1990955) |
| 0.6 | 4.9 | GO:0051525 | NFAT protein binding(GO:0051525) |
| 0.6 | 13.0 | GO:0043325 | phosphatidylinositol-3,4-bisphosphate binding(GO:0043325) |
| 0.6 | 4.7 | GO:0043199 | sulfate binding(GO:0043199) |
| 0.6 | 7.5 | GO:0036312 | phosphatidylinositol 3-kinase regulatory subunit binding(GO:0036312) |
| 0.6 | 4.0 | GO:0052832 | inositol monophosphate 1-phosphatase activity(GO:0008934) inositol monophosphate 3-phosphatase activity(GO:0052832) |
| 0.6 | 4.6 | GO:0071253 | connexin binding(GO:0071253) |
| 0.6 | 0.6 | GO:0033041 | sweet taste receptor activity(GO:0033041) |
| 0.6 | 3.9 | GO:0004716 | receptor signaling protein tyrosine kinase activity(GO:0004716) |
| 0.6 | 1.7 | GO:0005502 | 11-cis retinal binding(GO:0005502) |
| 0.6 | 7.7 | GO:0001206 | transcriptional repressor activity, RNA polymerase II distal enhancer sequence-specific binding(GO:0001206) |
| 0.5 | 8.2 | GO:0016889 | endodeoxyribonuclease activity, producing 3'-phosphomonoesters(GO:0016889) |
| 0.5 | 25.6 | GO:0070888 | E-box binding(GO:0070888) |
| 0.5 | 4.4 | GO:0003996 | acyl-CoA ligase activity(GO:0003996) CoA-ligase activity(GO:0016405) |
| 0.5 | 4.3 | GO:0004875 | complement receptor activity(GO:0004875) |
| 0.5 | 2.2 | GO:0001224 | RNA polymerase II transcription cofactor binding(GO:0001224) RNA polymerase II transcription corepressor binding(GO:0001226) |
| 0.5 | 3.8 | GO:0061513 | hexose phosphate transmembrane transporter activity(GO:0015119) organophosphate:inorganic phosphate antiporter activity(GO:0015315) hexose-phosphate:inorganic phosphate antiporter activity(GO:0015526) glucose 6-phosphate:inorganic phosphate antiporter activity(GO:0061513) |
| 0.5 | 4.8 | GO:0043515 | kinetochore binding(GO:0043515) |
| 0.5 | 2.1 | GO:0042287 | MHC protein binding(GO:0042287) |
| 0.5 | 2.7 | GO:0001007 | transcription factor activity, RNA polymerase III transcription factor binding(GO:0001007) |
| 0.5 | 5.8 | GO:0016290 | palmitoyl-CoA hydrolase activity(GO:0016290) |
| 0.5 | 3.2 | GO:0035325 | Toll-like receptor binding(GO:0035325) |
| 0.5 | 3.1 | GO:0042954 | lipoprotein transporter activity(GO:0042954) |
| 0.5 | 4.6 | GO:0001591 | dopamine neurotransmitter receptor activity, coupled via Gi/Go(GO:0001591) |
| 0.5 | 3.1 | GO:0003708 | retinoic acid receptor activity(GO:0003708) |
| 0.5 | 7.6 | GO:0008574 | ATP-dependent microtubule motor activity, plus-end-directed(GO:0008574) |
| 0.5 | 10.5 | GO:0015106 | bicarbonate transmembrane transporter activity(GO:0015106) |
| 0.5 | 6.3 | GO:0045294 | alpha-catenin binding(GO:0045294) |
| 0.5 | 2.9 | GO:0034647 | histone demethylase activity (H3-trimethyl-K4 specific)(GO:0034647) |
| 0.5 | 4.8 | GO:0038036 | sphingosine-1-phosphate receptor activity(GO:0038036) |
| 0.5 | 2.9 | GO:0034056 | estrogen response element binding(GO:0034056) |
| 0.5 | 2.9 | GO:0047961 | glycine N-acyltransferase activity(GO:0047961) |
| 0.5 | 1.9 | GO:0060698 | endoribonuclease inhibitor activity(GO:0060698) |
| 0.5 | 1.9 | GO:0030021 | extracellular matrix structural constituent conferring compression resistance(GO:0030021) structural constituent of tooth enamel(GO:0030345) |
| 0.5 | 14.4 | GO:0048020 | CCR chemokine receptor binding(GO:0048020) |
| 0.5 | 2.8 | GO:0051575 | 5'-deoxyribose-5-phosphate lyase activity(GO:0051575) |
| 0.5 | 1.4 | GO:0016414 | carnitine O-octanoyltransferase activity(GO:0008458) O-octanoyltransferase activity(GO:0016414) |
| 0.5 | 3.2 | GO:0016634 | oxidoreductase activity, acting on the CH-CH group of donors, oxygen as acceptor(GO:0016634) |
| 0.5 | 6.4 | GO:0033038 | bitter taste receptor activity(GO:0033038) |
| 0.5 | 5.5 | GO:0001205 | transcriptional activator activity, RNA polymerase II distal enhancer sequence-specific binding(GO:0001205) |
| 0.4 | 6.7 | GO:0016493 | C-C chemokine receptor activity(GO:0016493) |
| 0.4 | 2.7 | GO:0032554 | purine deoxyribonucleotide binding(GO:0032554) |
| 0.4 | 1.3 | GO:0019912 | cyclin-dependent protein kinase activating kinase activity(GO:0019912) |
| 0.4 | 14.1 | GO:1990841 | promoter-specific chromatin binding(GO:1990841) |
| 0.4 | 12.3 | GO:0043531 | ADP binding(GO:0043531) |
| 0.4 | 3.5 | GO:0004602 | glutathione peroxidase activity(GO:0004602) |
| 0.4 | 2.2 | GO:0071987 | WD40-repeat domain binding(GO:0071987) |
| 0.4 | 10.0 | GO:0004190 | aspartic-type endopeptidase activity(GO:0004190) |
| 0.4 | 11.7 | GO:0004181 | metallocarboxypeptidase activity(GO:0004181) |
| 0.4 | 3.5 | GO:0003720 | telomerase activity(GO:0003720) RNA-directed DNA polymerase activity(GO:0003964) |
| 0.4 | 11.5 | GO:0004364 | glutathione transferase activity(GO:0004364) |
| 0.4 | 1.2 | GO:0003845 | 11-beta-hydroxysteroid dehydrogenase [NAD(P)] activity(GO:0003845) |
| 0.4 | 2.5 | GO:1990239 | steroid hormone binding(GO:1990239) |
| 0.4 | 3.7 | GO:0051022 | Rho GDP-dissociation inhibitor binding(GO:0051022) |
| 0.4 | 5.7 | GO:0004745 | retinol dehydrogenase activity(GO:0004745) |
| 0.4 | 1.2 | GO:0042134 | rRNA primary transcript binding(GO:0042134) |
| 0.4 | 96.9 | GO:0030246 | carbohydrate binding(GO:0030246) |
| 0.4 | 3.1 | GO:0030957 | Tat protein binding(GO:0030957) |
| 0.4 | 7.0 | GO:0005523 | tropomyosin binding(GO:0005523) |
| 0.4 | 2.7 | GO:0030274 | LIM domain binding(GO:0030274) |
| 0.4 | 1.6 | GO:0051377 | mannose-ethanolamine phosphotransferase activity(GO:0051377) |
| 0.4 | 2.7 | GO:0005432 | calcium:sodium antiporter activity(GO:0005432) |
| 0.4 | 4.9 | GO:0016813 | hydrolase activity, acting on carbon-nitrogen (but not peptide) bonds, in linear amidines(GO:0016813) |
| 0.4 | 4.1 | GO:0043023 | ribosomal large subunit binding(GO:0043023) |
| 0.4 | 1.5 | GO:0045159 | myosin II binding(GO:0045159) |
| 0.4 | 2.6 | GO:0009881 | photoreceptor activity(GO:0009881) |
| 0.4 | 11.0 | GO:0016676 | cytochrome-c oxidase activity(GO:0004129) heme-copper terminal oxidase activity(GO:0015002) oxidoreductase activity, acting on a heme group of donors, oxygen as acceptor(GO:0016676) |
| 0.4 | 2.9 | GO:0098748 | clathrin adaptor activity(GO:0035615) endocytic adaptor activity(GO:0098748) |
| 0.4 | 1.5 | GO:0003989 | acetyl-CoA carboxylase activity(GO:0003989) |
| 0.4 | 5.1 | GO:0004806 | triglyceride lipase activity(GO:0004806) |
| 0.4 | 2.9 | GO:0030292 | protein tyrosine kinase inhibitor activity(GO:0030292) |
| 0.4 | 6.5 | GO:0004623 | phospholipase A2 activity(GO:0004623) |
| 0.4 | 1.4 | GO:0044547 | DNA topoisomerase binding(GO:0044547) |
| 0.4 | 2.9 | GO:0016176 | superoxide-generating NADPH oxidase activator activity(GO:0016176) |
| 0.4 | 74.7 | GO:0004252 | serine-type endopeptidase activity(GO:0004252) |
| 0.4 | 2.8 | GO:1990247 | N6-methyladenosine-containing RNA binding(GO:1990247) |
| 0.4 | 4.9 | GO:0008395 | steroid hydroxylase activity(GO:0008395) |
| 0.3 | 2.1 | GO:0035368 | selenocysteine insertion sequence binding(GO:0035368) |
| 0.3 | 7.9 | GO:0051879 | Hsp90 protein binding(GO:0051879) |
| 0.3 | 2.7 | GO:0008430 | selenium binding(GO:0008430) |
| 0.3 | 2.0 | GO:0047134 | protein-disulfide reductase activity(GO:0047134) |
| 0.3 | 3.4 | GO:0004438 | phosphatidylinositol-3-phosphatase activity(GO:0004438) |
| 0.3 | 1.0 | GO:0019958 | C-X-C chemokine binding(GO:0019958) |
| 0.3 | 1.0 | GO:0016900 | oxidoreductase activity, acting on the CH-OH group of donors, disulfide as acceptor(GO:0016900) vitamin-K-epoxide reductase (warfarin-sensitive) activity(GO:0047057) |
| 0.3 | 2.3 | GO:1990446 | U1 snRNP binding(GO:1990446) |
| 0.3 | 3.9 | GO:0043422 | protein kinase B binding(GO:0043422) |
| 0.3 | 2.2 | GO:0035381 | extracellular ATP-gated cation channel activity(GO:0004931) ATP-gated ion channel activity(GO:0035381) |
| 0.3 | 5.4 | GO:0043274 | phospholipase binding(GO:0043274) |
| 0.3 | 0.3 | GO:0016300 | tRNA (uracil) methyltransferase activity(GO:0016300) |
| 0.3 | 3.1 | GO:0004526 | ribonuclease P activity(GO:0004526) |
| 0.3 | 2.5 | GO:0030368 | interleukin-17 receptor activity(GO:0030368) |
| 0.3 | 3.4 | GO:0005000 | vasopressin receptor activity(GO:0005000) |
| 0.3 | 13.0 | GO:0019213 | deacetylase activity(GO:0019213) |
| 0.3 | 11.9 | GO:0016627 | oxidoreductase activity, acting on the CH-CH group of donors(GO:0016627) |
| 0.3 | 2.1 | GO:0046974 | histone methyltransferase activity (H3-K9 specific)(GO:0046974) |
| 0.3 | 8.4 | GO:0017025 | TBP-class protein binding(GO:0017025) |
| 0.3 | 1.2 | GO:0003839 | gamma-glutamylcyclotransferase activity(GO:0003839) |
| 0.3 | 1.8 | GO:0008467 | [heparan sulfate]-glucosamine 3-sulfotransferase 1 activity(GO:0008467) |
| 0.3 | 1.5 | GO:0071532 | ankyrin repeat binding(GO:0071532) |
| 0.3 | 2.9 | GO:0000774 | adenyl-nucleotide exchange factor activity(GO:0000774) |
| 0.3 | 21.5 | GO:0001158 | enhancer sequence-specific DNA binding(GO:0001158) |
| 0.3 | 15.7 | GO:0005507 | copper ion binding(GO:0005507) |
| 0.3 | 0.8 | GO:0008263 | pyrimidine-specific mismatch base pair DNA N-glycosylase activity(GO:0008263) |
| 0.3 | 3.9 | GO:0005159 | insulin-like growth factor receptor binding(GO:0005159) |
| 0.3 | 1.4 | GO:1990932 | 5.8S rRNA binding(GO:1990932) |
| 0.3 | 1.9 | GO:0019956 | chemokine binding(GO:0019956) |
| 0.3 | 8.0 | GO:0097472 | cyclin-dependent protein kinase activity(GO:0097472) |
| 0.3 | 5.8 | GO:0035259 | glucocorticoid receptor binding(GO:0035259) |
| 0.3 | 1.3 | GO:0008061 | chitin binding(GO:0008061) |
| 0.3 | 2.4 | GO:0001730 | 2'-5'-oligoadenylate synthetase activity(GO:0001730) |
| 0.3 | 2.9 | GO:0010857 | calcium-dependent protein serine/threonine kinase activity(GO:0009931) calcium-dependent protein kinase activity(GO:0010857) |
| 0.3 | 2.0 | GO:0005169 | neurotrophin TRKB receptor binding(GO:0005169) |
| 0.3 | 1.3 | GO:0070137 | ubiquitin-like protein-specific endopeptidase activity(GO:0070137) SUMO-specific endopeptidase activity(GO:0070139) |
| 0.3 | 3.1 | GO:0031005 | filamin binding(GO:0031005) |
| 0.3 | 1.3 | GO:0016679 | ubiquinol-cytochrome-c reductase activity(GO:0008121) oxidoreductase activity, acting on diphenols and related substances as donors(GO:0016679) oxidoreductase activity, acting on diphenols and related substances as donors, cytochrome as acceptor(GO:0016681) |
| 0.3 | 3.5 | GO:0044548 | S100 protein binding(GO:0044548) |
| 0.2 | 1.0 | GO:0043891 | glyceraldehyde-3-phosphate dehydrogenase (NAD+) (phosphorylating) activity(GO:0004365) glyceraldehyde-3-phosphate dehydrogenase (NAD(P)+) (phosphorylating) activity(GO:0043891) |
| 0.2 | 1.2 | GO:0070051 | fibrinogen binding(GO:0070051) |
| 0.2 | 13.5 | GO:0003684 | damaged DNA binding(GO:0003684) |
| 0.2 | 2.2 | GO:0030306 | ADP-ribosylation factor binding(GO:0030306) |
| 0.2 | 1.0 | GO:0004452 | isopentenyl-diphosphate delta-isomerase activity(GO:0004452) |
| 0.2 | 16.3 | GO:0001046 | core promoter sequence-specific DNA binding(GO:0001046) |
| 0.2 | 1.4 | GO:0003909 | DNA ligase activity(GO:0003909) DNA ligase (ATP) activity(GO:0003910) |
| 0.2 | 2.4 | GO:0070513 | death domain binding(GO:0070513) |
| 0.2 | 7.4 | GO:0051539 | 4 iron, 4 sulfur cluster binding(GO:0051539) |
| 0.2 | 4.5 | GO:0003950 | NAD+ ADP-ribosyltransferase activity(GO:0003950) |
| 0.2 | 0.7 | GO:0004832 | valine-tRNA ligase activity(GO:0004832) |
| 0.2 | 10.2 | GO:0005484 | SNAP receptor activity(GO:0005484) |
| 0.2 | 1.9 | GO:0004689 | phosphorylase kinase activity(GO:0004689) |
| 0.2 | 3.9 | GO:0003887 | DNA-directed DNA polymerase activity(GO:0003887) DNA polymerase activity(GO:0034061) |
| 0.2 | 3.9 | GO:0015026 | coreceptor activity(GO:0015026) |
| 0.2 | 2.5 | GO:0070182 | DNA polymerase binding(GO:0070182) |
| 0.2 | 1.1 | GO:0008131 | primary amine oxidase activity(GO:0008131) |
| 0.2 | 0.9 | GO:0016428 | tRNA (cytosine-5-)-methyltransferase activity(GO:0016428) |
| 0.2 | 1.1 | GO:0031849 | olfactory receptor binding(GO:0031849) |
| 0.2 | 18.0 | GO:0004519 | endonuclease activity(GO:0004519) |
| 0.2 | 1.3 | GO:0048038 | quinone binding(GO:0048038) |
| 0.2 | 2.1 | GO:0071837 | HMG box domain binding(GO:0071837) |
| 0.2 | 1.2 | GO:0035650 | AP-1 adaptor complex binding(GO:0035650) |
| 0.2 | 14.8 | GO:0042826 | histone deacetylase binding(GO:0042826) |
| 0.2 | 1.0 | GO:0048019 | receptor antagonist activity(GO:0048019) |
| 0.2 | 2.7 | GO:0032454 | histone demethylase activity (H3-K9 specific)(GO:0032454) |
| 0.2 | 50.7 | GO:0003735 | structural constituent of ribosome(GO:0003735) |
| 0.2 | 2.7 | GO:0004579 | oligosaccharyl transferase activity(GO:0004576) dolichyl-diphosphooligosaccharide-protein glycotransferase activity(GO:0004579) |
| 0.2 | 15.4 | GO:0004866 | endopeptidase inhibitor activity(GO:0004866) |
| 0.2 | 0.6 | GO:0016520 | growth hormone-releasing hormone receptor activity(GO:0016520) |
| 0.2 | 3.4 | GO:0005031 | tumor necrosis factor-activated receptor activity(GO:0005031) death receptor activity(GO:0005035) |
| 0.2 | 3.8 | GO:0009055 | electron carrier activity(GO:0009055) |
| 0.2 | 1.8 | GO:0047617 | acyl-CoA hydrolase activity(GO:0047617) |
| 0.2 | 0.9 | GO:0005111 | type 2 fibroblast growth factor receptor binding(GO:0005111) |
| 0.2 | 3.6 | GO:0005520 | insulin-like growth factor binding(GO:0005520) |
| 0.2 | 0.5 | GO:0045340 | mercury ion binding(GO:0045340) |
| 0.2 | 2.0 | GO:0035035 | histone acetyltransferase binding(GO:0035035) |
| 0.2 | 1.1 | GO:0043423 | 3-phosphoinositide-dependent protein kinase binding(GO:0043423) |
| 0.2 | 0.5 | GO:0036468 | aromatic-L-amino-acid decarboxylase activity(GO:0004058) L-dopa decarboxylase activity(GO:0036468) |
| 0.2 | 1.4 | GO:0031748 | D1 dopamine receptor binding(GO:0031748) |
| 0.2 | 2.4 | GO:0051537 | 2 iron, 2 sulfur cluster binding(GO:0051537) |
| 0.2 | 1.4 | GO:0008172 | S-methyltransferase activity(GO:0008172) |
| 0.2 | 0.5 | GO:0004711 | ribosomal protein S6 kinase activity(GO:0004711) |
| 0.2 | 1.2 | GO:0016778 | diphosphotransferase activity(GO:0016778) |
| 0.2 | 3.7 | GO:0016706 | oxidoreductase activity, acting on paired donors, with incorporation or reduction of molecular oxygen, 2-oxoglutarate as one donor, and incorporation of one atom each of oxygen into both donors(GO:0016706) |
| 0.2 | 2.5 | GO:0016790 | fatty-acyl-CoA binding(GO:0000062) thiolester hydrolase activity(GO:0016790) |
| 0.2 | 37.5 | GO:0001077 | transcriptional activator activity, RNA polymerase II core promoter proximal region sequence-specific binding(GO:0001077) |
| 0.2 | 3.3 | GO:0003951 | NAD+ kinase activity(GO:0003951) |
| 0.2 | 3.1 | GO:0001106 | RNA polymerase II transcription corepressor activity(GO:0001106) |
| 0.2 | 1.5 | GO:0003689 | DNA clamp loader activity(GO:0003689) protein-DNA loading ATPase activity(GO:0033170) |
| 0.2 | 0.9 | GO:0030296 | protein tyrosine kinase activator activity(GO:0030296) |
| 0.2 | 0.6 | GO:0033743 | peptide-methionine (R)-S-oxide reductase activity(GO:0033743) |
| 0.2 | 0.8 | GO:0070577 | lysine-acetylated histone binding(GO:0070577) |
| 0.1 | 3.1 | GO:0003746 | translation elongation factor activity(GO:0003746) |
| 0.1 | 2.9 | GO:0019843 | rRNA binding(GO:0019843) |
| 0.1 | 0.6 | GO:0004563 | beta-N-acetylhexosaminidase activity(GO:0004563) |
| 0.1 | 2.3 | GO:0008568 | microtubule-severing ATPase activity(GO:0008568) |
| 0.1 | 0.7 | GO:0043047 | single-stranded telomeric DNA binding(GO:0043047) sequence-specific single stranded DNA binding(GO:0098847) |
| 0.1 | 2.3 | GO:0030275 | LRR domain binding(GO:0030275) |
| 0.1 | 10.3 | GO:0042393 | histone binding(GO:0042393) |
| 0.1 | 7.8 | GO:0051087 | chaperone binding(GO:0051087) |
| 0.1 | 1.6 | GO:0005223 | intracellular cGMP activated cation channel activity(GO:0005223) |
| 0.1 | 8.3 | GO:0020037 | heme binding(GO:0020037) |
| 0.1 | 5.1 | GO:0030374 | ligand-dependent nuclear receptor transcription coactivator activity(GO:0030374) |
| 0.1 | 1.5 | GO:0016805 | dipeptidase activity(GO:0016805) |
| 0.1 | 3.0 | GO:0070840 | dynein complex binding(GO:0070840) |
| 0.1 | 2.6 | GO:0004435 | phosphatidylinositol phospholipase C activity(GO:0004435) |
| 0.1 | 5.3 | GO:0016831 | carboxy-lyase activity(GO:0016831) |
| 0.1 | 52.3 | GO:0005549 | odorant binding(GO:0005549) |
| 0.1 | 4.8 | GO:0031593 | polyubiquitin binding(GO:0031593) |
| 0.1 | 1.4 | GO:0045499 | chemorepellent activity(GO:0045499) |
| 0.1 | 2.2 | GO:0050431 | transforming growth factor beta binding(GO:0050431) |
| 0.1 | 0.6 | GO:0015035 | protein disulfide oxidoreductase activity(GO:0015035) |
| 0.1 | 0.3 | GO:0070052 | collagen V binding(GO:0070052) |
| 0.1 | 3.4 | GO:0031490 | chromatin DNA binding(GO:0031490) |
| 0.1 | 6.8 | GO:0003725 | double-stranded RNA binding(GO:0003725) |
| 0.1 | 1.1 | GO:0003810 | protein-glutamine gamma-glutamyltransferase activity(GO:0003810) |
| 0.1 | 2.0 | GO:0046933 | proton-transporting ATP synthase activity, rotational mechanism(GO:0046933) |
| 0.1 | 3.3 | GO:0042605 | peptide antigen binding(GO:0042605) |
| 0.1 | 2.6 | GO:0016209 | antioxidant activity(GO:0016209) |
| 0.1 | 9.4 | GO:0003714 | transcription corepressor activity(GO:0003714) |
| 0.1 | 0.9 | GO:0000064 | L-ornithine transmembrane transporter activity(GO:0000064) |
| 0.1 | 2.1 | GO:0004709 | MAP kinase kinase kinase activity(GO:0004709) |
| 0.1 | 1.3 | GO:0042162 | telomeric DNA binding(GO:0042162) |
| 0.1 | 2.4 | GO:0051213 | dioxygenase activity(GO:0051213) |
| 0.1 | 27.4 | GO:0003682 | chromatin binding(GO:0003682) |
| 0.1 | 0.3 | GO:0015184 | L-cystine transmembrane transporter activity(GO:0015184) |
| 0.1 | 0.4 | GO:1990380 | Lys48-specific deubiquitinase activity(GO:1990380) |
| 0.1 | 1.0 | GO:0046966 | thyroid hormone receptor binding(GO:0046966) |
| 0.1 | 3.8 | GO:0030145 | manganese ion binding(GO:0030145) |
| 0.1 | 2.0 | GO:0003954 | NADH dehydrogenase activity(GO:0003954) |
| 0.1 | 1.8 | GO:0005522 | profilin binding(GO:0005522) |
| 0.1 | 1.5 | GO:0051010 | microtubule plus-end binding(GO:0051010) |
| 0.1 | 0.5 | GO:0070742 | C2H2 zinc finger domain binding(GO:0070742) |
| 0.1 | 0.8 | GO:0017166 | vinculin binding(GO:0017166) |
| 0.1 | 81.3 | GO:0004984 | olfactory receptor activity(GO:0004984) |
| 0.1 | 0.7 | GO:0050321 | tau-protein kinase activity(GO:0050321) |
| 0.1 | 1.4 | GO:0016504 | peptidase activator activity(GO:0016504) |
| 0.1 | 2.4 | GO:0042805 | actinin binding(GO:0042805) |
| 0.1 | 1.2 | GO:0030550 | acetylcholine receptor inhibitor activity(GO:0030550) |
| 0.1 | 2.2 | GO:0004890 | GABA-A receptor activity(GO:0004890) |
| 0.1 | 1.5 | GO:0008235 | metalloexopeptidase activity(GO:0008235) |
| 0.1 | 0.3 | GO:0086089 | voltage-gated potassium channel activity involved in atrial cardiac muscle cell action potential repolarization(GO:0086089) |
| 0.1 | 0.9 | GO:0032183 | SUMO binding(GO:0032183) |
| 0.1 | 0.7 | GO:0046527 | glucosyltransferase activity(GO:0046527) |
| 0.1 | 1.9 | GO:0031489 | myosin V binding(GO:0031489) |
| 0.1 | 1.3 | GO:0016864 | protein disulfide isomerase activity(GO:0003756) intramolecular oxidoreductase activity, transposing S-S bonds(GO:0016864) |
| 0.1 | 0.5 | GO:0005148 | prolactin receptor binding(GO:0005148) |
| 0.1 | 0.9 | GO:0048027 | mRNA 5'-UTR binding(GO:0048027) |
| 0.1 | 0.5 | GO:0048185 | activin binding(GO:0048185) |
| 0.1 | 0.7 | GO:0004596 | peptide alpha-N-acetyltransferase activity(GO:0004596) |
| 0.1 | 0.1 | GO:0004999 | vasoactive intestinal polypeptide receptor activity(GO:0004999) |
| 0.1 | 1.9 | GO:0008307 | structural constituent of muscle(GO:0008307) |
| 0.1 | 3.1 | GO:0003697 | single-stranded DNA binding(GO:0003697) |
| 0.1 | 0.9 | GO:0005542 | folic acid binding(GO:0005542) |
| 0.1 | 2.9 | GO:0003743 | translation initiation factor activity(GO:0003743) |
| 0.1 | 23.0 | GO:0032561 | guanyl ribonucleotide binding(GO:0032561) |
| 0.1 | 0.9 | GO:0004535 | poly(A)-specific ribonuclease activity(GO:0004535) |
| 0.1 | 2.4 | GO:0005160 | transforming growth factor beta receptor binding(GO:0005160) |
| 0.1 | 0.2 | GO:0004814 | arginine-tRNA ligase activity(GO:0004814) |
| 0.1 | 2.0 | GO:0017022 | myosin binding(GO:0017022) |
| 0.1 | 2.6 | GO:0004715 | non-membrane spanning protein tyrosine kinase activity(GO:0004715) |
| 0.1 | 0.2 | GO:0004677 | DNA-dependent protein kinase activity(GO:0004677) |
| 0.1 | 0.5 | GO:0016783 | sulfurtransferase activity(GO:0016783) |
| 0.1 | 0.1 | GO:0008413 | 8-oxo-7,8-dihydroguanosine triphosphate pyrophosphatase activity(GO:0008413) 8-oxo-7,8-dihydrodeoxyguanosine triphosphate pyrophosphatase activity(GO:0035539) |
| 0.1 | 0.1 | GO:0034190 | apolipoprotein receptor binding(GO:0034190) |
| 0.1 | 2.6 | GO:0004843 | thiol-dependent ubiquitin-specific protease activity(GO:0004843) |
| 0.1 | 2.2 | GO:0017112 | Rab guanyl-nucleotide exchange factor activity(GO:0017112) |
| 0.0 | 1.2 | GO:0042169 | SH2 domain binding(GO:0042169) |
| 0.0 | 0.6 | GO:0015187 | glycine transmembrane transporter activity(GO:0015187) |
| 0.0 | 0.2 | GO:0070728 | leucine binding(GO:0070728) |
| 0.0 | 1.9 | GO:0004896 | cytokine receptor activity(GO:0004896) |
| 0.0 | 0.5 | GO:0005487 | nucleocytoplasmic transporter activity(GO:0005487) |
| 0.0 | 1.2 | GO:0051287 | NAD binding(GO:0051287) |
| 0.0 | 0.2 | GO:0005001 | transmembrane receptor protein tyrosine phosphatase activity(GO:0005001) transmembrane receptor protein phosphatase activity(GO:0019198) |
| 0.0 | 1.9 | GO:0005518 | collagen binding(GO:0005518) |
| 0.0 | 0.3 | GO:0034604 | pyruvate dehydrogenase activity(GO:0004738) pyruvate dehydrogenase [NAD(P)+] activity(GO:0034603) pyruvate dehydrogenase (NAD+) activity(GO:0034604) |
| 0.0 | 0.2 | GO:0045295 | gamma-catenin binding(GO:0045295) |
| 0.0 | 0.1 | GO:0015165 | pyrimidine nucleotide-sugar transmembrane transporter activity(GO:0015165) |
| 0.0 | 0.7 | GO:0003823 | antigen binding(GO:0003823) |
| 0.0 | 0.5 | GO:0008139 | nuclear localization sequence binding(GO:0008139) |
| 0.0 | 0.1 | GO:0019788 | NEDD8 transferase activity(GO:0019788) |
| 0.0 | 0.0 | GO:0000033 | alpha-1,3-mannosyltransferase activity(GO:0000033) |
| 0.0 | 0.6 | GO:0050660 | flavin adenine dinucleotide binding(GO:0050660) |
| 0.0 | 0.3 | GO:0005313 | L-glutamate transmembrane transporter activity(GO:0005313) |
| 0.0 | 0.1 | GO:0046906 | tetrapyrrole binding(GO:0046906) |
| 0.0 | 0.1 | GO:0005041 | low-density lipoprotein receptor activity(GO:0005041) |
| 0.0 | 0.3 | GO:0022848 | acetylcholine-gated cation channel activity(GO:0022848) |
Gene overrepresentation in curated gene sets: canonical pathways category:
| Log-likelihood per target | Total log-likelihood | Term | Description |
|---|---|---|---|
| 2.5 | 34.4 | ST INTERFERON GAMMA PATHWAY | Interferon gamma pathway. |
| 1.7 | 23.2 | PID TCR JNK PATHWAY | JNK signaling in the CD4+ TCR pathway |
| 1.1 | 26.8 | PID TOLL ENDOGENOUS PATHWAY | Endogenous TLR signaling |
| 1.1 | 5.5 | ST PHOSPHOINOSITIDE 3 KINASE PATHWAY | PI3K Pathway |
| 1.1 | 48.3 | PID IL2 STAT5 PATHWAY | IL2 signaling events mediated by STAT5 |
| 1.0 | 31.9 | PID TCR CALCIUM PATHWAY | Calcium signaling in the CD4+ TCR pathway |
| 1.0 | 4.9 | PID S1P S1P4 PATHWAY | S1P4 pathway |
| 0.8 | 32.6 | PID RXR VDR PATHWAY | RXR and RAR heterodimerization with other nuclear receptor |
| 0.8 | 23.5 | PID INTEGRIN2 PATHWAY | Beta2 integrin cell surface interactions |
| 0.8 | 4.9 | PID IL5 PATHWAY | IL5-mediated signaling events |
| 0.8 | 12.9 | PID ERB GENOMIC PATHWAY | Validated nuclear estrogen receptor beta network |
| 0.8 | 39.2 | PID HNF3A PATHWAY | FOXA1 transcription factor network |
| 0.8 | 8.4 | SA PROGRAMMED CELL DEATH | Programmed cell death, or apoptosis, eliminates damaged or unneeded cells. |
| 0.7 | 8.9 | PID TCR RAS PATHWAY | Ras signaling in the CD4+ TCR pathway |
| 0.7 | 7.4 | PID ERBB4 PATHWAY | ErbB4 signaling events |
| 0.6 | 25.0 | PID UPA UPAR PATHWAY | Urokinase-type plasminogen activator (uPA) and uPAR-mediated signaling |
| 0.6 | 6.2 | PID IL6 7 PATHWAY | IL6-mediated signaling events |
| 0.6 | 4.9 | PID ECADHERIN KERATINOCYTE PATHWAY | E-cadherin signaling in keratinocytes |
| 0.6 | 10.6 | PID CIRCADIAN PATHWAY | Circadian rhythm pathway |
| 0.6 | 28.1 | PID TAP63 PATHWAY | Validated transcriptional targets of TAp63 isoforms |
| 0.6 | 20.8 | PID THROMBIN PAR1 PATHWAY | PAR1-mediated thrombin signaling events |
| 0.6 | 25.4 | PID SHP2 PATHWAY | SHP2 signaling |
| 0.6 | 45.2 | PID CMYB PATHWAY | C-MYB transcription factor network |
| 0.6 | 10.3 | PID IL27 PATHWAY | IL27-mediated signaling events |
| 0.6 | 19.4 | SIG BCR SIGNALING PATHWAY | Members of the BCR signaling pathway |
| 0.6 | 28.3 | PID HNF3B PATHWAY | FOXA2 and FOXA3 transcription factor networks |
| 0.6 | 6.2 | PID S1P META PATHWAY | Sphingosine 1-phosphate (S1P) pathway |
| 0.6 | 27.3 | NABA BASEMENT MEMBRANES | Genes encoding structural components of basement membranes |
| 0.6 | 5.0 | SA G1 AND S PHASES | Cdk2, 4, and 6 bind cyclin D in G1, while cdk2/cyclin E promotes the G1/S transition. |
| 0.5 | 12.0 | PID NFAT TFPATHWAY | Calcineurin-regulated NFAT-dependent transcription in lymphocytes |
| 0.5 | 1.5 | PID FAS PATHWAY | FAS (CD95) signaling pathway |
| 0.5 | 11.4 | PID CD40 PATHWAY | CD40/CD40L signaling |
| 0.5 | 13.1 | PID CONE PATHWAY | Visual signal transduction: Cones |
| 0.4 | 27.9 | PID SMAD2 3NUCLEAR PATHWAY | Regulation of nuclear SMAD2/3 signaling |
| 0.4 | 4.4 | PID P38 ALPHA BETA PATHWAY | Regulation of p38-alpha and p38-beta |
| 0.4 | 11.9 | PID FCER1 PATHWAY | Fc-epsilon receptor I signaling in mast cells |
| 0.4 | 3.0 | SA G2 AND M PHASES | Cdc25 activates the cdc2/cyclin B complex to induce the G2/M transition. |
| 0.4 | 4.4 | PID EPHA2 FWD PATHWAY | EPHA2 forward signaling |
| 0.4 | 7.2 | PID IL1 PATHWAY | IL1-mediated signaling events |
| 0.4 | 2.9 | PID IL2 1PATHWAY | IL2-mediated signaling events |
| 0.4 | 15.2 | PID RAC1 PATHWAY | RAC1 signaling pathway |
| 0.3 | 2.8 | PID PDGFRA PATHWAY | PDGFR-alpha signaling pathway |
| 0.3 | 3.4 | PID ANGIOPOIETIN RECEPTOR PATHWAY | Angiopoietin receptor Tie2-mediated signaling |
| 0.3 | 3.1 | PID IL8 CXCR1 PATHWAY | IL8- and CXCR1-mediated signaling events |
| 0.3 | 5.4 | PID TRAIL PATHWAY | TRAIL signaling pathway |
| 0.3 | 3.6 | PID PRL SIGNALING EVENTS PATHWAY | Signaling events mediated by PRL |
| 0.3 | 4.3 | PID SYNDECAN 2 PATHWAY | Syndecan-2-mediated signaling events |
| 0.3 | 3.4 | PID CD8 TCR DOWNSTREAM PATHWAY | Downstream signaling in naïve CD8+ T cells |
| 0.3 | 7.6 | PID TCR PATHWAY | TCR signaling in naïve CD4+ T cells |
| 0.3 | 1.5 | PID ERBB1 RECEPTOR PROXIMAL PATHWAY | EGF receptor (ErbB1) signaling pathway |
| 0.3 | 3.8 | PID BCR 5PATHWAY | BCR signaling pathway |
| 0.3 | 10.1 | PID CXCR4 PATHWAY | CXCR4-mediated signaling events |
| 0.3 | 6.9 | PID PTP1B PATHWAY | Signaling events mediated by PTP1B |
| 0.3 | 2.9 | PID HIV NEF PATHWAY | HIV-1 Nef: Negative effector of Fas and TNF-alpha |
| 0.3 | 62.0 | NABA ECM REGULATORS | Genes encoding enzymes and their regulators involved in the remodeling of the extracellular matrix |
| 0.3 | 72.0 | NABA SECRETED FACTORS | Genes encoding secreted soluble factors |
| 0.2 | 18.5 | PID MYC ACTIV PATHWAY | Validated targets of C-MYC transcriptional activation |
| 0.2 | 8.4 | PID ERA GENOMIC PATHWAY | Validated nuclear estrogen receptor alpha network |
| 0.2 | 39.2 | NABA ECM GLYCOPROTEINS | Genes encoding structural ECM glycoproteins |
| 0.2 | 5.0 | PID DELTA NP63 PATHWAY | Validated transcriptional targets of deltaNp63 isoforms |
| 0.2 | 8.4 | PID E2F PATHWAY | E2F transcription factor network |
| 0.2 | 4.8 | SIG CHEMOTAXIS | Genes related to chemotaxis |
| 0.2 | 4.6 | PID BARD1 PATHWAY | BARD1 signaling events |
| 0.2 | 1.7 | PID RHODOPSIN PATHWAY | Visual signal transduction: Rods |
| 0.2 | 7.8 | PID PLK1 PATHWAY | PLK1 signaling events |
| 0.2 | 4.5 | PID AR TF PATHWAY | Regulation of Androgen receptor activity |
| 0.2 | 4.5 | PID RHOA PATHWAY | RhoA signaling pathway |
| 0.2 | 2.1 | SIG REGULATION OF THE ACTIN CYTOSKELETON BY RHO GTPASES | Genes related to regulation of the actin cytoskeleton |
| 0.2 | 2.6 | PID INSULIN GLUCOSE PATHWAY | Insulin-mediated glucose transport |
| 0.1 | 3.9 | PID FOXO PATHWAY | FoxO family signaling |
| 0.1 | 6.4 | PID NOTCH PATHWAY | Notch signaling pathway |
| 0.1 | 2.0 | ST WNT CA2 CYCLIC GMP PATHWAY | Wnt/Ca2+/cyclic GMP signaling. |
| 0.1 | 4.1 | PID TELOMERASE PATHWAY | Regulation of Telomerase |
| 0.1 | 1.8 | PID RB 1PATHWAY | Regulation of retinoblastoma protein |
| 0.1 | 4.0 | PID FANCONI PATHWAY | Fanconi anemia pathway |
| 0.1 | 19.8 | NABA ECM AFFILIATED | Genes encoding proteins affiliated structurally or functionally to extracellular matrix proteins |
| 0.1 | 1.1 | ST ADRENERGIC | Adrenergic Pathway |
| 0.1 | 5.0 | NABA PROTEOGLYCANS | Genes encoding proteoglycans |
| 0.1 | 2.1 | PID ATM PATHWAY | ATM pathway |
| 0.1 | 1.3 | ST T CELL SIGNAL TRANSDUCTION | T Cell Signal Transduction |
| 0.1 | 0.3 | PID IL3 PATHWAY | IL3-mediated signaling events |
| 0.1 | 6.3 | PID P53 DOWNSTREAM PATHWAY | Direct p53 effectors |
| 0.1 | 2.9 | PID ILK PATHWAY | Integrin-linked kinase signaling |
| 0.1 | 1.2 | PID SMAD2 3PATHWAY | Regulation of cytoplasmic and nuclear SMAD2/3 signaling |
| 0.1 | 3.2 | PID AR PATHWAY | Coregulation of Androgen receptor activity |
| 0.1 | 0.8 | PID P38 GAMMA DELTA PATHWAY | Signaling mediated by p38-gamma and p38-delta |
| 0.1 | 3.4 | PID MYC REPRESS PATHWAY | Validated targets of C-MYC transcriptional repression |
| 0.1 | 0.9 | PID MAPK TRK PATHWAY | Trk receptor signaling mediated by the MAPK pathway |
| 0.1 | 2.3 | PID LKB1 PATHWAY | LKB1 signaling events |
| 0.1 | 0.8 | PID ERBB2 ERBB3 PATHWAY | ErbB2/ErbB3 signaling events |
| 0.1 | 0.2 | ST G ALPHA S PATHWAY | G alpha s Pathway |
| 0.1 | 0.4 | PID BETA CATENIN DEG PATHWAY | Degradation of beta catenin |
| 0.1 | 0.6 | PID HIF1A PATHWAY | Hypoxic and oxygen homeostasis regulation of HIF-1-alpha |
| 0.0 | 0.8 | PID P53 REGULATION PATHWAY | p53 pathway |
| 0.0 | 0.8 | PID ECADHERIN NASCENT AJ PATHWAY | E-cadherin signaling in the nascent adherens junction |
| 0.0 | 0.5 | ST WNT BETA CATENIN PATHWAY | Wnt/beta-catenin Pathway |
| 0.0 | 0.5 | ST FAS SIGNALING PATHWAY | Fas Signaling Pathway |
| 0.0 | 0.5 | PID REG GR PATHWAY | Glucocorticoid receptor regulatory network |
| 0.0 | 0.3 | PID VEGFR1 2 PATHWAY | Signaling events mediated by VEGFR1 and VEGFR2 |
| 0.0 | 0.5 | WNT SIGNALING | Genes related to Wnt-mediated signal transduction |
Gene overrepresentation in curated gene sets: REACTOME pathways category:
| Log-likelihood per target | Total log-likelihood | Term | Description |
|---|---|---|---|
| 2.8 | 24.9 | REACTOME TRYPTOPHAN CATABOLISM | Genes involved in Tryptophan catabolism |
| 2.0 | 34.3 | REACTOME ACYL CHAIN REMODELLING OF PI | Genes involved in Acyl chain remodelling of PI |
| 1.9 | 28.4 | REACTOME IL 7 SIGNALING | Genes involved in Interleukin-7 signaling |
| 1.9 | 26.3 | REACTOME REGULATION OF COMPLEMENT CASCADE | Genes involved in Regulation of Complement cascade |
| 1.8 | 23.8 | REACTOME COMMON PATHWAY | Genes involved in Common Pathway |
| 1.7 | 13.3 | REACTOME ETHANOL OXIDATION | Genes involved in Ethanol oxidation |
| 1.7 | 28.2 | REACTOME CHYLOMICRON MEDIATED LIPID TRANSPORT | Genes involved in Chylomicron-mediated lipid transport |
| 1.6 | 33.9 | REACTOME INTRINSIC PATHWAY | Genes involved in Intrinsic Pathway |
| 1.5 | 32.2 | REACTOME COMPLEMENT CASCADE | Genes involved in Complement cascade |
| 1.3 | 25.4 | REACTOME GLUCURONIDATION | Genes involved in Glucuronidation |
| 1.3 | 19.0 | REACTOME REGULATION OF PYRUVATE DEHYDROGENASE PDH COMPLEX | Genes involved in Regulation of pyruvate dehydrogenase (PDH) complex |
| 1.2 | 18.0 | REACTOME SYNTHESIS OF BILE ACIDS AND BILE SALTS VIA 7ALPHA HYDROXYCHOLESTEROL | Genes involved in Synthesis of bile acids and bile salts via 7alpha-hydroxycholesterol |
| 1.0 | 3.1 | REACTOME RORA ACTIVATES CIRCADIAN EXPRESSION | Genes involved in RORA Activates Circadian Expression |
| 1.0 | 11.5 | REACTOME THE NLRP3 INFLAMMASOME | Genes involved in The NLRP3 inflammasome |
| 0.9 | 20.5 | REACTOME GENERATION OF SECOND MESSENGER MOLECULES | Genes involved in Generation of second messenger molecules |
| 0.9 | 78.4 | REACTOME RESPONSE TO ELEVATED PLATELET CYTOSOLIC CA2 | Genes involved in Response to elevated platelet cytosolic Ca2+ |
| 0.9 | 45.0 | REACTOME IMMUNOREGULATORY INTERACTIONS BETWEEN A LYMPHOID AND A NON LYMPHOID CELL | Genes involved in Immunoregulatory interactions between a Lymphoid and a non-Lymphoid cell |
| 0.9 | 9.6 | REACTOME APOPTOSIS INDUCED DNA FRAGMENTATION | Genes involved in Apoptosis induced DNA fragmentation |
| 0.9 | 15.4 | REACTOME TIE2 SIGNALING | Genes involved in Tie2 Signaling |
| 0.8 | 8.4 | REACTOME GLYCOPROTEIN HORMONES | Genes involved in Glycoprotein hormones |
| 0.8 | 21.1 | REACTOME SMAD2 SMAD3 SMAD4 HETEROTRIMER REGULATES TRANSCRIPTION | Genes involved in SMAD2/SMAD3:SMAD4 heterotrimer regulates transcription |
| 0.8 | 7.0 | REACTOME TETRAHYDROBIOPTERIN BH4 SYNTHESIS RECYCLING SALVAGE AND REGULATION | Genes involved in Tetrahydrobiopterin (BH4) synthesis, recycling, salvage and regulation |
| 0.8 | 9.8 | REACTOME SPRY REGULATION OF FGF SIGNALING | Genes involved in Spry regulation of FGF signaling |
| 0.7 | 2.8 | REACTOME CYCLIN E ASSOCIATED EVENTS DURING G1 S TRANSITION | Genes involved in Cyclin E associated events during G1/S transition |
| 0.7 | 5.7 | REACTOME ALPHA LINOLENIC ACID ALA METABOLISM | Genes involved in alpha-linolenic acid (ALA) metabolism |
| 0.7 | 7.7 | REACTOME IL 6 SIGNALING | Genes involved in Interleukin-6 signaling |
| 0.7 | 0.7 | REACTOME REGULATION OF INSULIN SECRETION BY ACETYLCHOLINE | Genes involved in Regulation of Insulin Secretion by Acetylcholine |
| 0.6 | 7.8 | REACTOME HYALURONAN UPTAKE AND DEGRADATION | Genes involved in Hyaluronan uptake and degradation |
| 0.6 | 9.2 | REACTOME CYCLIN A B1 ASSOCIATED EVENTS DURING G2 M TRANSITION | Genes involved in Cyclin A/B1 associated events during G2/M transition |
| 0.6 | 14.9 | REACTOME REGULATION OF GENE EXPRESSION IN BETA CELLS | Genes involved in Regulation of gene expression in beta cells |
| 0.6 | 5.0 | REACTOME RECEPTOR LIGAND BINDING INITIATES THE SECOND PROTEOLYTIC CLEAVAGE OF NOTCH RECEPTOR | Genes involved in Receptor-ligand binding initiates the second proteolytic cleavage of Notch receptor |
| 0.6 | 6.7 | REACTOME ANTIGEN PROCESSING CROSS PRESENTATION | Genes involved in Antigen processing-Cross presentation |
| 0.6 | 20.9 | REACTOME AMYLOIDS | Genes involved in Amyloids |
| 0.5 | 15.3 | REACTOME G PROTEIN BETA GAMMA SIGNALLING | Genes involved in G-protein beta:gamma signalling |
| 0.5 | 6.5 | REACTOME REGULATION OF BETA CELL DEVELOPMENT | Genes involved in Regulation of beta-cell development |
| 0.5 | 7.0 | REACTOME PYRIMIDINE CATABOLISM | Genes involved in Pyrimidine catabolism |
| 0.5 | 5.3 | REACTOME ADVANCED GLYCOSYLATION ENDPRODUCT RECEPTOR SIGNALING | Genes involved in Advanced glycosylation endproduct receptor signaling |
| 0.5 | 6.4 | REACTOME RIP MEDIATED NFKB ACTIVATION VIA DAI | Genes involved in RIP-mediated NFkB activation via DAI |
| 0.5 | 20.0 | REACTOME MEIOTIC SYNAPSIS | Genes involved in Meiotic Synapsis |
| 0.5 | 12.5 | REACTOME DEPOSITION OF NEW CENPA CONTAINING NUCLEOSOMES AT THE CENTROMERE | Genes involved in Deposition of New CENPA-containing Nucleosomes at the Centromere |
| 0.5 | 11.4 | REACTOME SYNTHESIS OF PA | Genes involved in Synthesis of PA |
| 0.5 | 4.4 | REACTOME NOD1 2 SIGNALING PATHWAY | Genes involved in NOD1/2 Signaling Pathway |
| 0.5 | 0.5 | REACTOME TRANSPORT OF MATURE MRNA DERIVED FROM AN INTRONLESS TRANSCRIPT | Genes involved in Transport of Mature mRNA Derived from an Intronless Transcript |
| 0.5 | 5.1 | REACTOME CREB PHOSPHORYLATION THROUGH THE ACTIVATION OF CAMKII | Genes involved in CREB phosphorylation through the activation of CaMKII |
| 0.5 | 9.3 | REACTOME ANTIGEN ACTIVATES B CELL RECEPTOR LEADING TO GENERATION OF SECOND MESSENGERS | Genes involved in Antigen Activates B Cell Receptor Leading to Generation of Second Messengers |
| 0.5 | 1.4 | REACTOME IKK COMPLEX RECRUITMENT MEDIATED BY RIP1 | Genes involved in IKK complex recruitment mediated by RIP1 |
| 0.4 | 2.4 | REACTOME CD28 DEPENDENT VAV1 PATHWAY | Genes involved in CD28 dependent Vav1 pathway |
| 0.4 | 4.3 | REACTOME YAP1 AND WWTR1 TAZ STIMULATED GENE EXPRESSION | Genes involved in YAP1- and WWTR1 (TAZ)-stimulated gene expression |
| 0.4 | 15.5 | REACTOME BMAL1 CLOCK NPAS2 ACTIVATES CIRCADIAN EXPRESSION | Genes involved in BMAL1:CLOCK/NPAS2 Activates Circadian Expression |
| 0.4 | 5.4 | REACTOME EXTRINSIC PATHWAY FOR APOPTOSIS | Genes involved in Extrinsic Pathway for Apoptosis |
| 0.4 | 17.6 | REACTOME INTERFERON GAMMA SIGNALING | Genes involved in Interferon gamma signaling |
| 0.4 | 7.9 | REACTOME REGULATORY RNA PATHWAYS | Genes involved in Regulatory RNA pathways |
| 0.4 | 2.5 | REACTOME INFLAMMASOMES | Genes involved in Inflammasomes |
| 0.4 | 3.9 | REACTOME DOWNSTREAM TCR SIGNALING | Genes involved in Downstream TCR signaling |
| 0.3 | 3.4 | REACTOME LIPOPROTEIN METABOLISM | Genes involved in Lipoprotein metabolism |
| 0.3 | 4.5 | REACTOME CTNNB1 PHOSPHORYLATION CASCADE | Genes involved in Beta-catenin phosphorylation cascade |
| 0.3 | 3.8 | REACTOME REMOVAL OF THE FLAP INTERMEDIATE FROM THE C STRAND | Genes involved in Removal of the Flap Intermediate from the C-strand |
| 0.3 | 5.7 | REACTOME CITRIC ACID CYCLE TCA CYCLE | Genes involved in Citric acid cycle (TCA cycle) |
| 0.3 | 20.0 | REACTOME NUCLEAR RECEPTOR TRANSCRIPTION PATHWAY | Genes involved in Nuclear Receptor transcription pathway |
| 0.3 | 2.6 | REACTOME E2F ENABLED INHIBITION OF PRE REPLICATION COMPLEX FORMATION | Genes involved in E2F-enabled inhibition of pre-replication complex formation |
| 0.3 | 6.1 | REACTOME ACTIVATION OF BH3 ONLY PROTEINS | Genes involved in Activation of BH3-only proteins |
| 0.3 | 2.8 | REACTOME INTEGRATION OF PROVIRUS | Genes involved in Integration of provirus |
| 0.3 | 5.2 | REACTOME BRANCHED CHAIN AMINO ACID CATABOLISM | Genes involved in Branched-chain amino acid catabolism |
| 0.3 | 1.5 | REACTOME NOTCH HLH TRANSCRIPTION PATHWAY | Genes involved in Notch-HLH transcription pathway |
| 0.3 | 4.9 | REACTOME IL RECEPTOR SHC SIGNALING | Genes involved in Interleukin receptor SHC signaling |
| 0.3 | 5.1 | REACTOME CD28 DEPENDENT PI3K AKT SIGNALING | Genes involved in CD28 dependent PI3K/Akt signaling |
| 0.3 | 4.8 | REACTOME PIP3 ACTIVATES AKT SIGNALING | Genes involved in PIP3 activates AKT signaling |
| 0.3 | 18.0 | REACTOME RESPIRATORY ELECTRON TRANSPORT | Genes involved in Respiratory electron transport |
| 0.3 | 14.1 | REACTOME CHEMOKINE RECEPTORS BIND CHEMOKINES | Genes involved in Chemokine receptors bind chemokines |
| 0.3 | 3.2 | REACTOME TRAFFICKING AND PROCESSING OF ENDOSOMAL TLR | Genes involved in Trafficking and processing of endosomal TLR |
| 0.3 | 2.9 | REACTOME P38MAPK EVENTS | Genes involved in p38MAPK events |
| 0.3 | 11.4 | REACTOME PHASE1 FUNCTIONALIZATION OF COMPOUNDS | Genes involved in Phase 1 - Functionalization of compounds |
| 0.3 | 25.7 | REACTOME PEPTIDE CHAIN ELONGATION | Genes involved in Peptide chain elongation |
| 0.3 | 1.3 | REACTOME NFKB IS ACTIVATED AND SIGNALS SURVIVAL | Genes involved in NF-kB is activated and signals survival |
| 0.3 | 3.6 | REACTOME MITOCHONDRIAL FATTY ACID BETA OXIDATION | Genes involved in Mitochondrial Fatty Acid Beta-Oxidation |
| 0.3 | 3.3 | REACTOME PEROXISOMAL LIPID METABOLISM | Genes involved in Peroxisomal lipid metabolism |
| 0.2 | 1.0 | REACTOME GAMMA CARBOXYLATION TRANSPORT AND AMINO TERMINAL CLEAVAGE OF PROTEINS | Genes involved in Gamma-carboxylation, transport, and amino-terminal cleavage of proteins |
| 0.2 | 7.9 | REACTOME ASSOCIATION OF TRIC CCT WITH TARGET PROTEINS DURING BIOSYNTHESIS | Genes involved in Association of TriC/CCT with target proteins during biosynthesis |
| 0.2 | 9.2 | REACTOME STRIATED MUSCLE CONTRACTION | Genes involved in Striated Muscle Contraction |
| 0.2 | 1.9 | REACTOME OPSINS | Genes involved in Opsins |
| 0.2 | 2.9 | REACTOME PASSIVE TRANSPORT BY AQUAPORINS | Genes involved in Passive Transport by Aquaporins |
| 0.2 | 3.6 | REACTOME MUSCLE CONTRACTION | Genes involved in Muscle contraction |
| 0.2 | 2.3 | REACTOME INHIBITION OF INSULIN SECRETION BY ADRENALINE NORADRENALINE | Genes involved in Inhibition of Insulin Secretion by Adrenaline/Noradrenaline |
| 0.2 | 2.8 | REACTOME SIGNALING BY FGFR1 FUSION MUTANTS | Genes involved in Signaling by FGFR1 fusion mutants |
| 0.2 | 1.3 | REACTOME SIGNALING BY THE B CELL RECEPTOR BCR | Genes involved in Signaling by the B Cell Receptor (BCR) |
| 0.2 | 2.0 | REACTOME SIGNAL ATTENUATION | Genes involved in Signal attenuation |
| 0.2 | 2.8 | REACTOME PYRIMIDINE METABOLISM | Genes involved in Pyrimidine metabolism |
| 0.2 | 4.9 | REACTOME SYNTHESIS OF PC | Genes involved in Synthesis of PC |
| 0.2 | 0.6 | REACTOME ACYL CHAIN REMODELLING OF PG | Genes involved in Acyl chain remodelling of PG |
| 0.2 | 3.3 | REACTOME METABOLISM OF PORPHYRINS | Genes involved in Metabolism of porphyrins |
| 0.2 | 6.0 | REACTOME RNA POL III TRANSCRIPTION | Genes involved in RNA Polymerase III Transcription |
| 0.2 | 2.5 | REACTOME CELL EXTRACELLULAR MATRIX INTERACTIONS | Genes involved in Cell-extracellular matrix interactions |
| 0.2 | 2.8 | REACTOME FORMATION OF INCISION COMPLEX IN GG NER | Genes involved in Formation of incision complex in GG-NER |
| 0.2 | 5.0 | REACTOME INTERFERON ALPHA BETA SIGNALING | Genes involved in Interferon alpha/beta signaling |
| 0.2 | 0.8 | REACTOME MTORC1 MEDIATED SIGNALLING | Genes involved in mTORC1-mediated signalling |
| 0.2 | 2.0 | REACTOME GLUCOSE TRANSPORT | Genes involved in Glucose transport |
| 0.1 | 3.6 | REACTOME DEADENYLATION OF MRNA | Genes involved in Deadenylation of mRNA |
| 0.1 | 1.0 | REACTOME ANDROGEN BIOSYNTHESIS | Genes involved in Androgen biosynthesis |
| 0.1 | 1.6 | REACTOME SLBP DEPENDENT PROCESSING OF REPLICATION DEPENDENT HISTONE PRE MRNAS | Genes involved in SLBP Dependent Processing of Replication-Dependent Histone Pre-mRNAs |
| 0.1 | 4.2 | REACTOME GLUTATHIONE CONJUGATION | Genes involved in Glutathione conjugation |
| 0.1 | 2.4 | REACTOME LIPID DIGESTION MOBILIZATION AND TRANSPORT | Genes involved in Lipid digestion, mobilization, and transport |
| 0.1 | 3.2 | REACTOME SULFUR AMINO ACID METABOLISM | Genes involved in Sulfur amino acid metabolism |
| 0.1 | 1.4 | REACTOME P2Y RECEPTORS | Genes involved in P2Y receptors |
| 0.1 | 0.7 | REACTOME INFLUENZA VIRAL RNA TRANSCRIPTION AND REPLICATION | Genes involved in Influenza Viral RNA Transcription and Replication |
| 0.1 | 2.9 | REACTOME REGULATION OF INSULIN SECRETION BY GLUCAGON LIKE PEPTIDE1 | Genes involved in Regulation of Insulin Secretion by Glucagon-like Peptide-1 |
| 0.1 | 1.2 | REACTOME STEROID HORMONES | Genes involved in Steroid hormones |
| 0.1 | 7.0 | REACTOME PPARA ACTIVATES GENE EXPRESSION | Genes involved in PPARA Activates Gene Expression |
| 0.1 | 1.9 | REACTOME GLYCOGEN BREAKDOWN GLYCOGENOLYSIS | Genes involved in Glycogen breakdown (glycogenolysis) |
| 0.1 | 3.1 | REACTOME METAL ION SLC TRANSPORTERS | Genes involved in Metal ion SLC transporters |
| 0.1 | 1.2 | REACTOME PURINE RIBONUCLEOSIDE MONOPHOSPHATE BIOSYNTHESIS | Genes involved in Purine ribonucleoside monophosphate biosynthesis |
| 0.1 | 1.9 | REACTOME FANCONI ANEMIA PATHWAY | Genes involved in Fanconi Anemia pathway |
| 0.1 | 2.9 | REACTOME LIGAND GATED ION CHANNEL TRANSPORT | Genes involved in Ligand-gated ion channel transport |
| 0.1 | 2.5 | REACTOME MEIOTIC RECOMBINATION | Genes involved in Meiotic Recombination |
| 0.1 | 4.2 | REACTOME METABOLISM OF NON CODING RNA | Genes involved in Metabolism of non-coding RNA |
| 0.1 | 1.7 | REACTOME PROTEOLYTIC CLEAVAGE OF SNARE COMPLEX PROTEINS | Genes involved in Proteolytic cleavage of SNARE complex proteins |
| 0.1 | 9.7 | REACTOME MRNA SPLICING | Genes involved in mRNA Splicing |
| 0.1 | 0.6 | REACTOME HORMONE LIGAND BINDING RECEPTORS | Genes involved in Hormone ligand-binding receptors |
| 0.1 | 2.0 | REACTOME MITOCHONDRIAL TRNA AMINOACYLATION | Genes involved in Mitochondrial tRNA aminoacylation |
| 0.1 | 4.4 | REACTOME SIGNALING BY ILS | Genes involved in Signaling by Interleukins |
| 0.1 | 1.2 | REACTOME VITAMIN B5 PANTOTHENATE METABOLISM | Genes involved in Vitamin B5 (pantothenate) metabolism |
| 0.1 | 1.3 | REACTOME NONSENSE MEDIATED DECAY ENHANCED BY THE EXON JUNCTION COMPLEX | Genes involved in Nonsense Mediated Decay Enhanced by the Exon Junction Complex |
| 0.1 | 1.0 | REACTOME DOWNREGULATION OF SMAD2 3 SMAD4 TRANSCRIPTIONAL ACTIVITY | Genes involved in Downregulation of SMAD2/3:SMAD4 transcriptional activity |
| 0.1 | 5.2 | REACTOME MITOTIC PROMETAPHASE | Genes involved in Mitotic Prometaphase |
| 0.1 | 1.4 | REACTOME G1 PHASE | Genes involved in G1 Phase |
| 0.1 | 1.4 | REACTOME FORMATION OF THE TERNARY COMPLEX AND SUBSEQUENTLY THE 43S COMPLEX | Genes involved in Formation of the ternary complex, and subsequently, the 43S complex |
| 0.1 | 1.4 | REACTOME SIGNALING BY HIPPO | Genes involved in Signaling by Hippo |
| 0.1 | 3.3 | REACTOME METABOLISM OF VITAMINS AND COFACTORS | Genes involved in Metabolism of vitamins and cofactors |
| 0.1 | 1.4 | REACTOME SYNTHESIS OF GLYCOSYLPHOSPHATIDYLINOSITOL GPI | Genes involved in Synthesis of glycosylphosphatidylinositol (GPI) |
| 0.1 | 3.4 | REACTOME ION CHANNEL TRANSPORT | Genes involved in Ion channel transport |
| 0.1 | 0.5 | REACTOME FORMATION OF TUBULIN FOLDING INTERMEDIATES BY CCT TRIC | Genes involved in Formation of tubulin folding intermediates by CCT/TriC |
| 0.1 | 0.7 | REACTOME DOUBLE STRAND BREAK REPAIR | Genes involved in Double-Strand Break Repair |
| 0.1 | 2.8 | REACTOME MITOCHONDRIAL PROTEIN IMPORT | Genes involved in Mitochondrial Protein Import |
| 0.1 | 1.6 | REACTOME SYNTHESIS OF PIPS AT THE PLASMA MEMBRANE | Genes involved in Synthesis of PIPs at the plasma membrane |
| 0.1 | 0.6 | REACTOME DARPP 32 EVENTS | Genes involved in DARPP-32 events |
| 0.1 | 1.1 | REACTOME INTERFERON SIGNALING | Genes involved in Interferon Signaling |
| 0.1 | 1.3 | REACTOME SRP DEPENDENT COTRANSLATIONAL PROTEIN TARGETING TO MEMBRANE | Genes involved in SRP-dependent cotranslational protein targeting to membrane |
| 0.0 | 1.1 | REACTOME ACTIVATION OF ATR IN RESPONSE TO REPLICATION STRESS | Genes involved in Activation of ATR in response to replication stress |
| 0.0 | 0.4 | REACTOME ACTIVATION OF CHAPERONES BY ATF6 ALPHA | Genes involved in Activation of Chaperones by ATF6-alpha |
| 0.0 | 1.0 | REACTOME NEGATIVE REGULATORS OF RIG I MDA5 SIGNALING | Genes involved in Negative regulators of RIG-I/MDA5 signaling |
| 0.0 | 0.6 | REACTOME FORMATION OF ATP BY CHEMIOSMOTIC COUPLING | Genes involved in Formation of ATP by chemiosmotic coupling |
| 0.0 | 0.6 | REACTOME REGULATION OF HYPOXIA INDUCIBLE FACTOR HIF BY OXYGEN | Genes involved in Regulation of Hypoxia-inducible Factor (HIF) by Oxygen |
| 0.0 | 1.1 | REACTOME HS GAG BIOSYNTHESIS | Genes involved in HS-GAG biosynthesis |
| 0.0 | 0.3 | REACTOME ACYL CHAIN REMODELLING OF PE | Genes involved in Acyl chain remodelling of PE |
| 0.0 | 3.3 | REACTOME METABOLISM OF AMINO ACIDS AND DERIVATIVES | Genes involved in Metabolism of amino acids and derivatives |
| 0.0 | 0.3 | REACTOME SIGNALING BY FGFR3 MUTANTS | Genes involved in Signaling by FGFR3 mutants |
| 0.0 | 0.3 | REACTOME ACETYLCHOLINE BINDING AND DOWNSTREAM EVENTS | Genes involved in Acetylcholine Binding And Downstream Events |
| 0.0 | 0.2 | REACTOME SEMA4D INDUCED CELL MIGRATION AND GROWTH CONE COLLAPSE | Genes involved in Sema4D induced cell migration and growth-cone collapse |
| 0.0 | 0.3 | REACTOME CHONDROITIN SULFATE BIOSYNTHESIS | Genes involved in Chondroitin sulfate biosynthesis |
| 0.0 | 0.8 | REACTOME AMINO ACID AND OLIGOPEPTIDE SLC TRANSPORTERS | Genes involved in Amino acid and oligopeptide SLC transporters |
| 0.0 | 0.8 | REACTOME G ALPHA1213 SIGNALLING EVENTS | Genes involved in G alpha (12/13) signalling events |
| 0.0 | 0.0 | REACTOME P53 DEPENDENT G1 DNA DAMAGE RESPONSE | Genes involved in p53-Dependent G1 DNA Damage Response |