Project
GSE53960: rat RNA-Seq transcriptomic Bodymap
Navigation
Downloads
Results for Foxa3
Z-value: 1.09
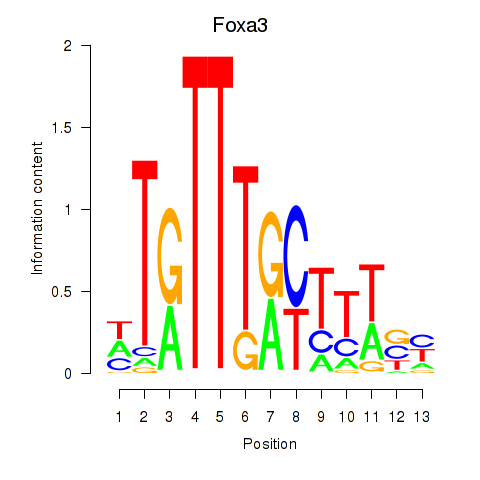
Motif logo
Transcription factors associated with Foxa3
| Gene Symbol | Gene ID | Gene Info |
|---|---|---|
|
Foxa3
|
ENSRNOG00000014256 | forkhead box A3 |
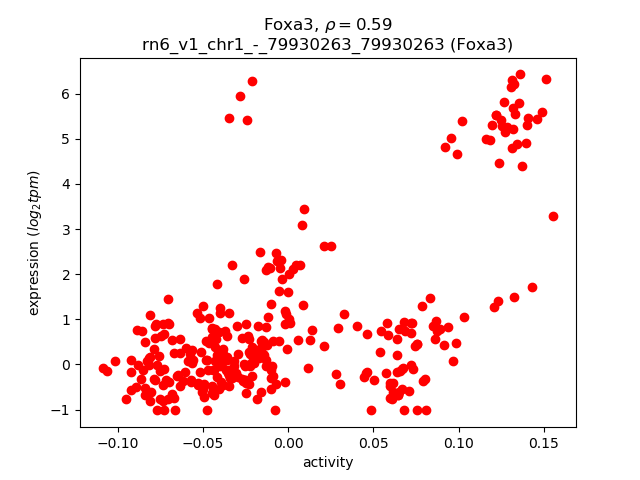
Activity-expression correlation:
| Gene | Promoter | Pearson corr. coef. | P-value | Plot |
|---|---|---|---|---|
| Foxa3 | rn6_v1_chr1_-_79930263_79930263 | 0.59 | 6.5e-32 | Click! |
Activity profile of Foxa3 motif
Sorted Z-values of Foxa3 motif
| Promoter | Log-likelihood | Transcript | Gene | Gene Info |
|---|---|---|---|---|
| chr8_+_50525091 | 104.84 |
ENSRNOT00000074357
|
Apoa1
|
apolipoprotein A1 |
| chr5_+_124300477 | 84.70 |
ENSRNOT00000010100
|
C8b
|
complement C8 beta chain |
| chr18_-_24929091 | 63.77 |
ENSRNOT00000019596
|
Proc
|
protein C |
| chr13_-_47377703 | 62.63 |
ENSRNOT00000005461
|
C4bpa
|
complement component 4 binding protein, alpha |
| chr1_-_225283326 | 53.04 |
ENSRNOT00000027342
|
Scgb1a1
|
secretoglobin family 1A member 1 |
| chr11_-_81717521 | 51.83 |
ENSRNOT00000058422
|
Ahsg
|
alpha-2-HS-glycoprotein |
| chr11_-_87924816 | 48.36 |
ENSRNOT00000031819
|
Serpind1
|
serpin family D member 1 |
| chr6_+_33176778 | 46.75 |
ENSRNOT00000046811
ENSRNOT00000007371 |
Apob
|
apolipoprotein B |
| chr2_-_182035032 | 45.34 |
ENSRNOT00000009813
|
Fgb
|
fibrinogen beta chain |
| chr14_+_20266891 | 41.98 |
ENSRNOT00000004174
|
Gc
|
group specific component |
| chr5_-_19368431 | 39.81 |
ENSRNOT00000012819
|
Cyp7a1
|
cytochrome P450, family 7, subfamily a, polypeptide 1 |
| chr7_+_93975451 | 38.90 |
ENSRNOT00000011379
|
Colec10
|
collectin subfamily member 10 |
| chr3_-_127500709 | 38.33 |
ENSRNOT00000006330
|
Hao1
|
hydroxyacid oxidase 1 |
| chr1_+_264741911 | 37.91 |
ENSRNOT00000019956
|
Sema4g
|
semaphorin 4G |
| chr3_+_149624712 | 35.51 |
ENSRNOT00000018581
|
Bpifa1
|
BPI fold containing family A, member 1 |
| chr6_-_104631355 | 34.66 |
ENSRNOT00000007825
|
Slc10a1
|
solute carrier family 10 member 1 |
| chr7_-_143523457 | 33.19 |
ENSRNOT00000012943
ENSRNOT00000082264 |
Krt4
|
keratin 4 |
| chr1_+_48273611 | 31.13 |
ENSRNOT00000022254
ENSRNOT00000022068 |
Slc22a1
|
solute carrier family 22 member 1 |
| chr18_+_59748444 | 28.12 |
ENSRNOT00000024752
|
St8sia3
|
ST8 alpha-N-acetyl-neuraminide alpha-2,8-sialyltransferase 3 |
| chr10_-_27179900 | 27.39 |
ENSRNOT00000082445
|
Gabrg2
|
gamma-aminobutyric acid type A receptor gamma 2 subunit |
| chr2_-_250923744 | 22.95 |
ENSRNOT00000084996
|
Clca1
|
chloride channel accessory 1 |
| chr2_+_121165137 | 22.06 |
ENSRNOT00000016236
|
Sox2
|
SRY box 2 |
| chr16_-_18766174 | 21.46 |
ENSRNOT00000084813
|
Sftpd
|
surfactant protein D |
| chr12_-_1195591 | 20.29 |
ENSRNOT00000001446
|
Stard13
|
StAR-related lipid transfer domain containing 13 |
| chr10_+_14240219 | 20.17 |
ENSRNOT00000020233
|
Igfals
|
insulin-like growth factor binding protein, acid labile subunit |
| chr4_+_10295122 | 19.95 |
ENSRNOT00000017374
|
Ccdc146
|
coiled-coil domain containing 146 |
| chr8_-_107952530 | 19.72 |
ENSRNOT00000052043
|
Cldn18
|
claudin 18 |
| chr7_-_138483612 | 19.26 |
ENSRNOT00000085620
|
Slc38a4
|
solute carrier family 38, member 4 |
| chr10_-_46404642 | 18.69 |
ENSRNOT00000083698
|
Pemt
|
phosphatidylethanolamine N-methyltransferase |
| chr2_+_188543137 | 17.84 |
ENSRNOT00000027850
|
Muc1
|
mucin 1, cell surface associated |
| chr10_+_86399827 | 16.41 |
ENSRNOT00000009299
|
Grb7
|
growth factor receptor bound protein 7 |
| chrX_+_35599258 | 16.00 |
ENSRNOT00000072627
ENSRNOT00000005061 |
Cdkl5
|
cyclin-dependent kinase-like 5 |
| chr14_+_39964588 | 15.54 |
ENSRNOT00000003240
|
Gabrg1
|
gamma-aminobutyric acid type A receptor gamma 1 subunit |
| chr10_-_27179254 | 15.33 |
ENSRNOT00000004619
|
Gabrg2
|
gamma-aminobutyric acid type A receptor gamma 2 subunit |
| chr2_+_227080924 | 14.94 |
ENSRNOT00000029871
|
Fabp2
|
fatty acid binding protein 2 |
| chr2_+_208750356 | 14.91 |
ENSRNOT00000041562
|
Chia
|
chitinase, acidic |
| chr8_-_115981910 | 14.76 |
ENSRNOT00000019867
|
Dock3
|
dedicator of cyto-kinesis 3 |
| chr5_+_165415136 | 14.48 |
ENSRNOT00000016317
ENSRNOT00000079407 |
Masp2
|
mannan-binding lectin serine peptidase 2 |
| chr7_+_26522314 | 13.64 |
ENSRNOT00000011572
|
Slc41a2
|
solute carrier family 41 member 2 |
| chr11_-_782954 | 12.95 |
ENSRNOT00000040065
|
Epha3
|
Eph receptor A3 |
| chr3_+_129018592 | 12.65 |
ENSRNOT00000007274
|
Lamp5
|
lysosomal-associated membrane protein family, member 5 |
| chr2_+_208749996 | 12.61 |
ENSRNOT00000086321
|
Chia
|
chitinase, acidic |
| chr1_+_157646173 | 12.11 |
ENSRNOT00000013851
|
Rab30
|
RAB30, member RAS oncogene family |
| chr3_-_71845232 | 11.83 |
ENSRNOT00000078645
|
Calcrl
|
calcitonin receptor like receptor |
| chr5_+_120568242 | 11.82 |
ENSRNOT00000050597
|
Lepr
|
leptin receptor |
| chr2_-_216348194 | 11.73 |
ENSRNOT00000087839
|
LOC103689940
|
pancreatic alpha-amylase-like |
| chr11_+_74984613 | 11.69 |
ENSRNOT00000035049
|
Atp13a5
|
ATPase 13A5 |
| chr9_+_118849302 | 11.60 |
ENSRNOT00000087592
|
Dlgap1
|
DLG associated protein 1 |
| chr10_-_88060561 | 11.48 |
ENSRNOT00000019133
|
Krt19
|
keratin 19 |
| chr5_+_162808646 | 11.29 |
ENSRNOT00000021155
|
Dhrs3
|
dehydrogenase/reductase 3 |
| chr12_-_30083824 | 11.20 |
ENSRNOT00000084968
|
Tpst1
|
tyrosylprotein sulfotransferase 1 |
| chr6_-_78549669 | 10.90 |
ENSRNOT00000009940
|
Foxa1
|
forkhead box A1 |
| chr2_-_111065413 | 10.71 |
ENSRNOT00000041111
|
Nlgn1
|
neuroligin 1 |
| chr1_+_107262659 | 10.63 |
ENSRNOT00000022499
|
Gas2
|
growth arrest-specific 2 |
| chr3_+_131351587 | 10.50 |
ENSRNOT00000010835
|
Btbd3
|
BTB domain containing 3 |
| chr8_-_102149912 | 10.44 |
ENSRNOT00000011263
|
RGD1309079
|
similar to Ab2-095 |
| chr2_-_147819335 | 10.12 |
ENSRNOT00000057909
|
Ankub1
|
ankyrin repeat and ubiquitin domain containing 1 |
| chr20_-_38985036 | 8.32 |
ENSRNOT00000001066
|
Serinc1
|
serine incorporator 1 |
| chr6_-_108167185 | 8.11 |
ENSRNOT00000015545
|
Aldh6a1
|
aldehyde dehydrogenase 6 family, member A1 |
| chr2_+_69415057 | 7.84 |
ENSRNOT00000013152
|
Cdh10
|
cadherin 10 |
| chr8_+_91099491 | 7.49 |
ENSRNOT00000084852
|
Sh3bgrl2
|
SH3 domain binding glutamate-rich protein like 2 |
| chr1_+_234252757 | 7.33 |
ENSRNOT00000091814
|
Rorb
|
RAR-related orphan receptor B |
| chrX_+_113510621 | 7.31 |
ENSRNOT00000025912
|
Nxt2
|
nuclear transport factor 2-like export factor 2 |
| chr3_-_158328881 | 7.26 |
ENSRNOT00000044466
|
Ptprt
|
protein tyrosine phosphatase, receptor type, T |
| chr2_-_258997138 | 7.26 |
ENSRNOT00000045020
ENSRNOT00000042256 |
Adgrl2
|
adhesion G protein-coupled receptor L2 |
| chr3_-_162059524 | 7.15 |
ENSRNOT00000033873
|
Zfp334
|
zinc finger protein 334 |
| chr14_+_44413636 | 7.13 |
ENSRNOT00000003552
|
Smim14
|
small integral membrane protein 14 |
| chr4_+_62221011 | 6.93 |
ENSRNOT00000041264
|
Cald1
|
caldesmon 1 |
| chr8_+_58431407 | 6.79 |
ENSRNOT00000011974
|
Sln
|
sarcolipin |
| chr1_-_78521999 | 6.73 |
ENSRNOT00000021223
|
Arhgap35
|
Rho GTPase activating protein 35 |
| chr3_-_160038078 | 6.59 |
ENSRNOT00000013445
|
Serinc3
|
serine incorporator 3 |
| chr9_+_27034022 | 6.52 |
ENSRNOT00000029696
|
Paqr8
|
progestin and adipoQ receptor family member 8 |
| chr12_-_36398206 | 6.45 |
ENSRNOT00000090944
ENSRNOT00000058492 |
Tmem132b
|
transmembrane protein 132B |
| chr1_+_168945449 | 6.43 |
ENSRNOT00000087661
ENSRNOT00000019913 |
LOC103694855
|
hemoglobin subunit beta-2-like |
| chr10_-_103687425 | 6.41 |
ENSRNOT00000039284
|
Cd300lf
|
Cd300 molecule-like family member F |
| chr9_-_81467760 | 5.97 |
ENSRNOT00000090868
|
Cxcr1
|
C-X-C motif chemokine receptor 1 |
| chr3_+_122836446 | 5.69 |
ENSRNOT00000028816
|
Ebf4
|
early B-cell factor 4 |
| chr4_+_62220736 | 5.64 |
ENSRNOT00000086377
|
Cald1
|
caldesmon 1 |
| chr14_+_8080275 | 5.28 |
ENSRNOT00000065965
ENSRNOT00000092542 |
Mapk10
|
mitogen activated protein kinase 10 |
| chr2_+_144861455 | 5.14 |
ENSRNOT00000093284
ENSRNOT00000019748 ENSRNOT00000072110 |
Dclk1
|
doublecortin-like kinase 1 |
| chr17_-_21484456 | 4.91 |
ENSRNOT00000038180
|
Sycp2l
|
synaptonemal complex protein 2-like |
| chr1_+_72545596 | 4.67 |
ENSRNOT00000022698
|
Shisa7
|
shisa family member 7 |
| chr14_+_1937041 | 4.67 |
ENSRNOT00000000040
|
Tmed11
|
transmembrane emp24 protein transport domain containing 11 |
| chr4_+_181103774 | 4.66 |
ENSRNOT00000084207
ENSRNOT00000055473 ENSRNOT00000077619 |
Arntl2
|
aryl hydrocarbon receptor nuclear translocator-like 2 |
| chr5_+_58359498 | 4.54 |
ENSRNOT00000000141
|
Phf24
|
PHD finger protein 24 |
| chr7_+_23403891 | 4.34 |
ENSRNOT00000037918
|
Syn3
|
synapsin III |
| chr3_+_44806106 | 4.26 |
ENSRNOT00000035158
|
Upp2
|
uridine phosphorylase 2 |
| chr13_-_91872954 | 4.24 |
ENSRNOT00000004613
ENSRNOT00000079263 |
Cadm3
|
cell adhesion molecule 3 |
| chr18_+_3887419 | 4.01 |
ENSRNOT00000093089
|
Lama3
|
laminin subunit alpha 3 |
| chr3_+_148635775 | 3.99 |
ENSRNOT00000067261
|
Tm9sf4
|
transmembrane 9 superfamily member 4 |
| chr6_-_67084234 | 3.90 |
ENSRNOT00000050372
|
Nova1
|
NOVA alternative splicing regulator 1 |
| chr2_+_44289393 | 3.51 |
ENSRNOT00000018877
|
Il6st
|
interleukin 6 signal transducer |
| chr5_+_49311030 | 3.44 |
ENSRNOT00000010850
|
Cnr1
|
cannabinoid receptor 1 |
| chr8_+_99568958 | 3.42 |
ENSRNOT00000073400
|
Plscr5
|
phospholipid scramblase family, member 5 |
| chr9_+_111649631 | 3.35 |
ENSRNOT00000056430
|
Fer
|
FER tyrosine kinase |
| chr11_-_69223158 | 3.34 |
ENSRNOT00000067060
|
Mylk
|
myosin light chain kinase |
| chr17_-_30661690 | 3.34 |
ENSRNOT00000048146
|
RGD1307537
|
similar to RIKEN cDNA 4933417A18 |
| chr20_-_9876008 | 3.10 |
ENSRNOT00000001537
|
Tff2
|
trefoil factor 2 |
| chr8_+_48718329 | 3.05 |
ENSRNOT00000089763
|
Slc37a4
|
solute carrier family 37 member 4 |
| chr10_-_98469799 | 2.94 |
ENSRNOT00000087502
ENSRNOT00000088646 |
Abca9
|
ATP binding cassette subfamily A member 9 |
| chr9_+_82345719 | 2.89 |
ENSRNOT00000057330
ENSRNOT00000078260 |
Fam134a
|
family with sequence similarity 134, member A |
| chr14_-_21128505 | 2.88 |
ENSRNOT00000004776
|
Rufy3
|
RUN and FYVE domain containing 3 |
| chr10_-_56276764 | 2.84 |
ENSRNOT00000049048
|
Eif4a1
|
eukaryotic translation initiation factor 4A1 |
| chr15_+_34216833 | 2.76 |
ENSRNOT00000025260
|
Pck2
|
phosphoenolpyruvate carboxykinase 2 (mitochondrial) |
| chr19_-_11669578 | 2.66 |
ENSRNOT00000026373
|
Gnao1
|
G protein subunit alpha o1 |
| chr6_+_135313008 | 2.59 |
ENSRNOT00000030864
|
Tecpr2
|
tectonin beta-propeller repeat containing 2 |
| chrX_+_26439197 | 2.47 |
ENSRNOT00000078843
ENSRNOT00000052176 ENSRNOT00000087268 |
Amelx
|
amelogenin, X-linked |
| chr10_+_90230711 | 2.45 |
ENSRNOT00000055185
|
Tmub2
|
transmembrane and ubiquitin-like domain containing 2 |
| chr2_-_256154584 | 2.43 |
ENSRNOT00000072487
|
AABR07013776.1
|
|
| chr11_-_53731779 | 2.24 |
ENSRNOT00000002684
|
Ift57
|
intraflagellar transport 57 |
| chr15_-_95514259 | 2.17 |
ENSRNOT00000038433
|
Slitrk6
|
SLIT and NTRK-like family, member 6 |
| chrX_-_139916883 | 2.16 |
ENSRNOT00000090442
|
Gpc3
|
glypican 3 |
| chr1_+_70480941 | 2.15 |
ENSRNOT00000072404
|
Olr6
|
olfactory receptor 6 |
| chr9_+_8054466 | 2.02 |
ENSRNOT00000081513
|
Adgre4
|
adhesion G protein-coupled receptor E4 |
| chr13_+_78979321 | 1.93 |
ENSRNOT00000003857
|
Ankrd45
|
ankyrin repeat domain 45 |
| chrX_-_79743117 | 1.92 |
ENSRNOT00000044808
|
LOC103690878
|
syntaxin-3-like |
| chr15_-_25505691 | 1.85 |
ENSRNOT00000074488
|
LOC100911492
|
homeobox protein OTX2-like |
| chr4_-_84131030 | 1.77 |
ENSRNOT00000012196
|
Cpvl
|
carboxypeptidase, vitellogenic-like |
| chr9_+_20951260 | 1.75 |
ENSRNOT00000016906
|
Adgrf4
|
adhesion G protein-coupled receptor F4 |
| chr11_-_15858281 | 1.55 |
ENSRNOT00000090586
|
AABR07033287.1
|
|
| chr14_-_21127868 | 1.55 |
ENSRNOT00000020608
ENSRNOT00000092172 |
Rufy3
|
RUN and FYVE domain containing 3 |
| chr18_+_16146447 | 1.42 |
ENSRNOT00000022117
|
Galnt1
|
polypeptide N-acetylgalactosaminyltransferase 1 |
| chr2_+_241909832 | 1.28 |
ENSRNOT00000047975
|
Ppp3ca
|
protein phosphatase 3 catalytic subunit alpha |
| chr5_-_14367898 | 1.28 |
ENSRNOT00000065402
|
Atp6v1h
|
ATPase H+ transporting V1 subunit H |
| chr2_-_244370983 | 1.14 |
ENSRNOT00000021458
|
Rap1gds1
|
Rap1 GTPase-GDP dissociation stimulator 1 |
| chr3_-_76368909 | 0.94 |
ENSRNOT00000043599
|
Olr614
|
olfactory receptor 614 |
| chr3_-_78112770 | 0.92 |
ENSRNOT00000008396
|
Olr694
|
olfactory receptor 694 |
| chr16_-_81980027 | 0.89 |
ENSRNOT00000043170
|
Mcf2l
|
MCF.2 cell line derived transforming sequence-like |
| chr2_-_27364906 | 0.84 |
ENSRNOT00000078639
|
Polk
|
DNA polymerase kappa |
| chr1_+_214562897 | 0.83 |
ENSRNOT00000085125
|
Ap2a2
|
adaptor-related protein complex 2, alpha 2 subunit |
| chr1_-_189182306 | 0.77 |
ENSRNOT00000021249
|
Gp2
|
glycoprotein 2 |
| chr3_-_78663607 | 0.77 |
ENSRNOT00000073134
|
Olr718
|
olfactory receptor 718 |
| chr8_+_41350182 | 0.71 |
ENSRNOT00000072823
|
LOC100911758
|
olfactory receptor 143-like |
| chr13_+_71305548 | 0.60 |
ENSRNOT00000074864
|
LOC684709
|
similar to putative membrane protein Re9 |
| chr2_+_166856784 | 0.60 |
ENSRNOT00000035765
|
Otol1
|
otolin 1 |
| chr7_+_71157664 | 0.55 |
ENSRNOT00000005919
|
Sdr9c7
|
short chain dehydrogenase/reductase family 9C, member 7 |
| chr1_+_172728264 | 0.52 |
ENSRNOT00000075297
|
Olr267
|
olfactory receptor 267 |
| chr15_-_28806752 | 0.47 |
ENSRNOT00000047436
|
Olr1640
|
olfactory receptor 1640 |
| chr17_-_39575720 | 0.44 |
ENSRNOT00000022923
|
Prl8a2
|
prolactin family 8, subfamily a, member 2 |
| chr11_-_28527890 | 0.43 |
ENSRNOT00000002138
|
Cldn8
|
claudin 8 |
| chr20_-_27308069 | 0.35 |
ENSRNOT00000056047
|
Slc25a16
|
solute carrier family 25 member 16 |
| chr1_-_266862842 | 0.23 |
ENSRNOT00000027496
|
LOC103693430
|
up-regulated during skeletal muscle growth protein 5 |
| chr17_-_78910671 | 0.15 |
ENSRNOT00000064609
|
Acbd7
|
acyl-CoA binding domain containing 7 |
| chr3_-_78555530 | 0.14 |
ENSRNOT00000089672
|
Olr711
|
olfactory receptor 711 |
| chr3_-_102432479 | 0.14 |
ENSRNOT00000047270
|
Olr747
|
olfactory receptor 747 |
| chr16_-_3765917 | 0.08 |
ENSRNOT00000088284
|
Duxbl1
|
double homeobox B-like 1 |
| chrX_-_136737730 | 0.06 |
ENSRNOT00000040754
|
Olr1765
|
olfactory receptor 1765 |
| chr7_+_132857628 | 0.02 |
ENSRNOT00000005438
|
Lrrk2
|
leucine-rich repeat kinase 2 |
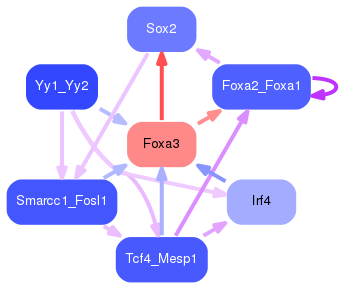
Network of associatons between targets according to the STRING database.

First level regulatory network of Foxa3
Gene Ontology Analysis
Gene overrepresentation in biological process category:
| Log-likelihood per target | Total log-likelihood | Term | Description |
|---|---|---|---|
| 34.9 | 104.8 | GO:0010903 | negative regulation of very-low-density lipoprotein particle remodeling(GO:0010903) |
| 20.9 | 62.6 | GO:0045959 | negative regulation of complement activation, classical pathway(GO:0045959) |
| 13.3 | 53.0 | GO:0032696 | negative regulation of interleukin-13 production(GO:0032696) |
| 11.4 | 57.0 | GO:0050828 | regulation of liquid surface tension(GO:0050828) |
| 10.6 | 63.8 | GO:1903142 | positive regulation of endothelial cell development(GO:1901552) positive regulation of establishment of endothelial barrier(GO:1903142) |
| 9.6 | 38.3 | GO:0009441 | glycolate metabolic process(GO:0009441) |
| 9.4 | 28.1 | GO:1990743 | protein sialylation(GO:1990743) |
| 9.1 | 45.3 | GO:0043152 | induction of bacterial agglutination(GO:0043152) |
| 8.5 | 84.7 | GO:0006957 | complement activation, alternative pathway(GO:0006957) |
| 8.4 | 50.3 | GO:0006642 | triglyceride mobilization(GO:0006642) |
| 6.8 | 20.3 | GO:0097498 | endothelial tube lumen extension(GO:0097498) |
| 6.6 | 19.7 | GO:2001205 | negative regulation of osteoclast development(GO:2001205) |
| 5.5 | 22.1 | GO:0030910 | olfactory placode formation(GO:0030910) olfactory placode development(GO:0071698) olfactory placode morphogenesis(GO:0071699) |
| 5.5 | 27.5 | GO:0006032 | chitin metabolic process(GO:0006030) chitin catabolic process(GO:0006032) |
| 4.3 | 12.9 | GO:0097156 | fasciculation of motor neuron axon(GO:0097156) |
| 3.7 | 11.2 | GO:0006478 | peptidyl-tyrosine sulfation(GO:0006478) |
| 3.6 | 10.9 | GO:0061144 | alveolar secondary septum development(GO:0061144) |
| 3.3 | 39.8 | GO:0070857 | regulation of bile acid biosynthetic process(GO:0070857) |
| 3.1 | 18.7 | GO:0050747 | positive regulation of lipoprotein metabolic process(GO:0050747) |
| 3.1 | 31.1 | GO:0015697 | quaternary ammonium group transport(GO:0015697) |
| 3.1 | 42.7 | GO:0071420 | cellular response to histamine(GO:0071420) |
| 3.0 | 11.8 | GO:1904059 | negative regulation of eating behavior(GO:1903999) regulation of locomotor rhythm(GO:1904059) |
| 2.8 | 8.3 | GO:1904219 | regulation of CDP-diacylglycerol-serine O-phosphatidyltransferase activity(GO:1904217) positive regulation of CDP-diacylglycerol-serine O-phosphatidyltransferase activity(GO:1904219) positive regulation of serine C-palmitoyltransferase activity(GO:1904222) |
| 2.7 | 8.1 | GO:0006574 | valine catabolic process(GO:0006574) |
| 2.7 | 10.7 | GO:0099543 | retrograde trans-synaptic signaling by soluble gas(GO:0098923) trans-synaptic signaling by soluble gas(GO:0099543) trans-synaptic signaling by trans-synaptic complex(GO:0099545) |
| 2.6 | 42.0 | GO:0042359 | vitamin D metabolic process(GO:0042359) |
| 2.2 | 17.8 | GO:0033629 | negative regulation of cell adhesion mediated by integrin(GO:0033629) positive regulation of histone H4 acetylation(GO:0090240) |
| 2.2 | 6.6 | GO:0009597 | detection of virus(GO:0009597) |
| 2.2 | 51.8 | GO:0046852 | positive regulation of bone resorption(GO:0045780) positive regulation of bone remodeling(GO:0046852) |
| 2.1 | 6.4 | GO:1902214 | regulation of interleukin-4-mediated signaling pathway(GO:1902214) negative regulation of apoptotic cell clearance(GO:2000426) |
| 2.0 | 6.0 | GO:0098759 | response to interleukin-8(GO:0098758) cellular response to interleukin-8(GO:0098759) |
| 1.4 | 11.6 | GO:0070842 | aggresome assembly(GO:0070842) |
| 1.3 | 34.7 | GO:0015721 | bile acid and bile salt transport(GO:0015721) |
| 1.3 | 16.4 | GO:0034063 | stress granule assembly(GO:0034063) |
| 1.3 | 11.3 | GO:0048387 | negative regulation of retinoic acid receptor signaling pathway(GO:0048387) |
| 1.1 | 3.4 | GO:0099553 | trans-synaptic signalling, modulating synaptic transmission(GO:0099550) trans-synaptic signaling by lipid, modulating synaptic transmission(GO:0099552) trans-synaptic signaling by endocannabinoid, modulating synaptic transmission(GO:0099553) |
| 1.1 | 6.7 | GO:0030950 | establishment or maintenance of actin cytoskeleton polarity(GO:0030950) |
| 1.1 | 3.3 | GO:0060414 | aorta smooth muscle tissue morphogenesis(GO:0060414) |
| 1.0 | 14.5 | GO:0001867 | complement activation, lectin pathway(GO:0001867) |
| 1.0 | 6.8 | GO:1901894 | regulation of calcium-transporting ATPase activity(GO:1901894) |
| 0.9 | 2.8 | GO:0006116 | NADH oxidation(GO:0006116) |
| 0.8 | 11.8 | GO:0009744 | response to sucrose(GO:0009744) response to disaccharide(GO:0034285) |
| 0.8 | 3.3 | GO:0038109 | Kit signaling pathway(GO:0038109) diapedesis(GO:0050904) |
| 0.7 | 4.3 | GO:0044206 | pyrimidine ribonucleotide salvage(GO:0010138) pyrimidine nucleotide salvage(GO:0032262) UMP salvage(GO:0044206) |
| 0.6 | 7.3 | GO:0046549 | amacrine cell differentiation(GO:0035881) retinal rod cell development(GO:0046548) retinal cone cell development(GO:0046549) |
| 0.6 | 20.1 | GO:0007214 | gamma-aminobutyric acid signaling pathway(GO:0007214) |
| 0.5 | 2.2 | GO:0072138 | mesenchymal cell proliferation involved in ureteric bud development(GO:0072138) |
| 0.5 | 3.1 | GO:0060455 | negative regulation of gastric acid secretion(GO:0060455) |
| 0.5 | 3.0 | GO:0035166 | post-embryonic hemopoiesis(GO:0035166) |
| 0.5 | 5.3 | GO:0007258 | JUN phosphorylation(GO:0007258) |
| 0.4 | 2.2 | GO:0060005 | vestibular reflex(GO:0060005) |
| 0.4 | 6.4 | GO:0015671 | oxygen transport(GO:0015671) |
| 0.4 | 14.9 | GO:0050892 | intestinal absorption(GO:0050892) |
| 0.4 | 4.0 | GO:0070863 | positive regulation of protein exit from endoplasmic reticulum(GO:0070863) |
| 0.3 | 1.3 | GO:0010615 | positive regulation of cardiac muscle adaptation(GO:0010615) positive regulation of cardiac muscle hypertrophy in response to stress(GO:1903244) regulation of connective tissue replacement(GO:1905203) |
| 0.3 | 20.4 | GO:0045773 | positive regulation of axon extension(GO:0045773) |
| 0.3 | 10.0 | GO:0060706 | cell differentiation involved in embryonic placenta development(GO:0060706) |
| 0.3 | 1.4 | GO:0018242 | protein O-linked glycosylation via serine(GO:0018242) protein O-linked glycosylation via threonine(GO:0018243) |
| 0.2 | 4.7 | GO:0048172 | regulation of short-term neuronal synaptic plasticity(GO:0048172) |
| 0.2 | 19.3 | GO:0003333 | amino acid transmembrane transport(GO:0003333) |
| 0.2 | 4.0 | GO:0031581 | hemidesmosome assembly(GO:0031581) |
| 0.2 | 38.6 | GO:0007596 | blood coagulation(GO:0007596) |
| 0.2 | 0.8 | GO:0002386 | immune response in mucosal-associated lymphoid tissue(GO:0002386) |
| 0.2 | 4.7 | GO:0042753 | positive regulation of circadian rhythm(GO:0042753) |
| 0.2 | 10.4 | GO:0060038 | cardiac muscle cell proliferation(GO:0060038) |
| 0.1 | 12.6 | GO:0032092 | positive regulation of protein binding(GO:0032092) |
| 0.1 | 5.1 | GO:0021952 | central nervous system projection neuron axonogenesis(GO:0021952) |
| 0.1 | 1.1 | GO:0032471 | negative regulation of endoplasmic reticulum calcium ion concentration(GO:0032471) |
| 0.1 | 22.9 | GO:0071456 | cellular response to hypoxia(GO:0071456) |
| 0.1 | 2.5 | GO:0070166 | enamel mineralization(GO:0070166) |
| 0.1 | 0.8 | GO:0006297 | nucleotide-excision repair, DNA gap filling(GO:0006297) |
| 0.1 | 1.9 | GO:0099500 | synaptic vesicle fusion to presynaptic active zone membrane(GO:0031629) vesicle fusion to plasma membrane(GO:0099500) |
| 0.1 | 7.3 | GO:0051965 | positive regulation of synapse assembly(GO:0051965) |
| 0.1 | 12.1 | GO:0007030 | Golgi organization(GO:0007030) |
| 0.1 | 2.2 | GO:0060972 | left/right pattern formation(GO:0060972) |
| 0.1 | 0.3 | GO:0043137 | DNA replication, removal of RNA primer(GO:0043137) |
| 0.1 | 10.5 | GO:0048813 | dendrite morphogenesis(GO:0048813) |
| 0.1 | 8.9 | GO:0050680 | negative regulation of epithelial cell proliferation(GO:0050680) |
| 0.1 | 7.3 | GO:0035335 | peptidyl-tyrosine dephosphorylation(GO:0035335) |
| 0.1 | 1.3 | GO:0007035 | vacuolar acidification(GO:0007035) |
| 0.1 | 2.8 | GO:0010501 | RNA secondary structure unwinding(GO:0010501) |
| 0.1 | 2.7 | GO:0014072 | response to isoquinoline alkaloid(GO:0014072) response to morphine(GO:0043278) |
| 0.1 | 20.2 | GO:0007568 | aging(GO:0007568) |
| 0.0 | 0.9 | GO:0035025 | positive regulation of Rho protein signal transduction(GO:0035025) |
| 0.0 | 5.4 | GO:0043401 | steroid hormone mediated signaling pathway(GO:0043401) |
| 0.0 | 4.3 | GO:0099643 | neurotransmitter secretion(GO:0007269) signal release from synapse(GO:0099643) |
| 0.0 | 8.0 | GO:0007264 | small GTPase mediated signal transduction(GO:0007264) |
| 0.0 | 0.1 | GO:0070317 | negative regulation of G0 to G1 transition(GO:0070317) |
Gene overrepresentation in cellular component category:
| Log-likelihood per target | Total log-likelihood | Term | Description |
|---|---|---|---|
| 21.0 | 104.8 | GO:0034365 | discoidal high-density lipoprotein particle(GO:0034365) |
| 15.6 | 46.7 | GO:0034363 | intermediate-density lipoprotein particle(GO:0034363) |
| 12.5 | 62.6 | GO:0043159 | acrosomal matrix(GO:0043159) |
| 12.1 | 84.7 | GO:0005579 | membrane attack complex(GO:0005579) |
| 5.7 | 45.3 | GO:0005577 | fibrinogen complex(GO:0005577) |
| 3.4 | 20.2 | GO:0042567 | insulin-like growth factor ternary complex(GO:0042567) |
| 2.1 | 12.6 | GO:0030478 | actin cap(GO:0030478) |
| 1.6 | 11.5 | GO:1990357 | terminal web(GO:1990357) |
| 1.6 | 16.0 | GO:0044294 | dendritic growth cone(GO:0044294) |
| 1.6 | 12.7 | GO:0032584 | growth cone membrane(GO:0032584) |
| 1.5 | 14.9 | GO:0045179 | apical cortex(GO:0045179) |
| 1.4 | 33.0 | GO:1902711 | GABA-A receptor complex(GO:1902711) |
| 1.2 | 3.5 | GO:0005896 | interleukin-6 receptor complex(GO:0005896) ciliary neurotrophic factor receptor complex(GO:0070110) |
| 1.1 | 20.0 | GO:0042589 | zymogen granule membrane(GO:0042589) |
| 0.9 | 6.4 | GO:0005833 | hemoglobin complex(GO:0005833) |
| 0.9 | 4.3 | GO:0045098 | type III intermediate filament(GO:0045098) |
| 0.8 | 93.8 | GO:0072562 | blood microparticle(GO:0072562) |
| 0.8 | 61.0 | GO:0005581 | collagen trimer(GO:0005581) |
| 0.7 | 4.0 | GO:0005608 | laminin-3 complex(GO:0005608) |
| 0.7 | 10.4 | GO:0030126 | COPI vesicle coat(GO:0030126) |
| 0.6 | 10.7 | GO:0017146 | NMDA selective glutamate receptor complex(GO:0017146) filopodium tip(GO:0032433) |
| 0.6 | 28.1 | GO:0030173 | integral component of Golgi membrane(GO:0030173) |
| 0.5 | 15.5 | GO:0034707 | chloride channel complex(GO:0034707) |
| 0.5 | 53.0 | GO:0005791 | rough endoplasmic reticulum(GO:0005791) |
| 0.5 | 45.1 | GO:0005902 | microvillus(GO:0005902) |
| 0.3 | 16.4 | GO:0010494 | cytoplasmic stress granule(GO:0010494) |
| 0.3 | 2.2 | GO:0044292 | dendrite terminus(GO:0044292) |
| 0.3 | 4.4 | GO:0071437 | invadopodium(GO:0071437) |
| 0.3 | 1.3 | GO:0000221 | vacuolar proton-transporting V-type ATPase, V1 domain(GO:0000221) |
| 0.2 | 12.1 | GO:0005801 | cis-Golgi network(GO:0005801) |
| 0.2 | 18.7 | GO:0031526 | brush border membrane(GO:0031526) |
| 0.2 | 6.0 | GO:0042629 | mast cell granule(GO:0042629) |
| 0.2 | 4.9 | GO:0000800 | lateral element(GO:0000800) |
| 0.2 | 1.3 | GO:0005955 | calcineurin complex(GO:0005955) |
| 0.2 | 6.8 | GO:0033017 | sarcoplasmic reticulum membrane(GO:0033017) |
| 0.2 | 31.3 | GO:0042579 | peroxisome(GO:0005777) microbody(GO:0042579) |
| 0.2 | 44.3 | GO:0016323 | basolateral plasma membrane(GO:0016323) |
| 0.2 | 19.7 | GO:0005923 | bicellular tight junction(GO:0005923) |
| 0.2 | 4.7 | GO:0032281 | AMPA glutamate receptor complex(GO:0032281) |
| 0.1 | 10.5 | GO:0019005 | SCF ubiquitin ligase complex(GO:0019005) |
| 0.1 | 22.1 | GO:0044798 | nuclear transcription factor complex(GO:0044798) |
| 0.1 | 13.8 | GO:0005814 | centriole(GO:0005814) |
| 0.1 | 26.3 | GO:0014069 | postsynaptic density(GO:0014069) |
| 0.1 | 0.3 | GO:0005760 | gamma DNA polymerase complex(GO:0005760) |
| 0.1 | 8.0 | GO:0045095 | keratin filament(GO:0045095) |
| 0.1 | 126.1 | GO:0005783 | endoplasmic reticulum(GO:0005783) |
| 0.1 | 3.4 | GO:0042734 | presynaptic membrane(GO:0042734) |
| 0.1 | 0.8 | GO:0030122 | AP-2 adaptor complex(GO:0030122) |
| 0.1 | 3.3 | GO:0097610 | cleavage furrow(GO:0032154) cell surface furrow(GO:0097610) |
| 0.1 | 1.9 | GO:0031201 | SNARE complex(GO:0031201) |
| 0.1 | 2.7 | GO:0005834 | heterotrimeric G-protein complex(GO:0005834) |
| 0.1 | 10.3 | GO:0016324 | apical plasma membrane(GO:0016324) |
| 0.1 | 2.2 | GO:0046658 | anchored component of plasma membrane(GO:0046658) |
| 0.1 | 4.2 | GO:0031234 | extrinsic component of cytoplasmic side of plasma membrane(GO:0031234) |
| 0.0 | 3.3 | GO:0036064 | ciliary basal body(GO:0036064) |
| 0.0 | 2.5 | GO:0030139 | endocytic vesicle(GO:0030139) |
| 0.0 | 6.9 | GO:0005769 | early endosome(GO:0005769) |
| 0.0 | 7.6 | GO:0031965 | nuclear membrane(GO:0031965) |
| 0.0 | 1.4 | GO:0032580 | Golgi cisterna membrane(GO:0032580) |
| 0.0 | 5.3 | GO:0000139 | Golgi membrane(GO:0000139) |
| 0.0 | 1.8 | GO:0030426 | growth cone(GO:0030426) |
| 0.0 | 13.7 | GO:0005887 | integral component of plasma membrane(GO:0005887) |
Gene overrepresentation in molecular function category:
| Log-likelihood per target | Total log-likelihood | Term | Description |
|---|---|---|---|
| 34.9 | 104.8 | GO:0070653 | high-density lipoprotein particle receptor binding(GO:0070653) |
| 21.3 | 63.8 | GO:0070012 | oligopeptidase activity(GO:0070012) |
| 13.0 | 51.8 | GO:0030294 | receptor signaling protein tyrosine kinase inhibitor activity(GO:0030294) |
| 10.6 | 53.0 | GO:0019834 | phospholipase A2 inhibitor activity(GO:0019834) |
| 10.4 | 31.1 | GO:0005277 | acetylcholine transmembrane transporter activity(GO:0005277) acetate ester transmembrane transporter activity(GO:1901375) |
| 9.6 | 38.3 | GO:0003973 | (S)-2-hydroxy-acid oxidase activity(GO:0003973) |
| 9.4 | 28.1 | GO:0003828 | alpha-N-acetylneuraminate alpha-2,8-sialyltransferase activity(GO:0003828) |
| 7.8 | 46.7 | GO:0035473 | lipase binding(GO:0035473) |
| 5.8 | 34.7 | GO:0008508 | bile acid:sodium symporter activity(GO:0008508) |
| 5.0 | 29.9 | GO:0005499 | vitamin D binding(GO:0005499) |
| 4.6 | 27.5 | GO:0004568 | chitinase activity(GO:0004568) |
| 4.1 | 77.1 | GO:0001848 | complement binding(GO:0001848) |
| 3.9 | 11.8 | GO:0001605 | adrenomedullin receptor activity(GO:0001605) |
| 3.9 | 11.7 | GO:0004556 | alpha-amylase activity(GO:0004556) |
| 3.7 | 11.2 | GO:0008476 | protein-tyrosine sulfotransferase activity(GO:0008476) |
| 3.1 | 42.7 | GO:0005237 | inhibitory extracellular ligand-gated ion channel activity(GO:0005237) |
| 2.5 | 14.9 | GO:0005324 | long-chain fatty acid transporter activity(GO:0005324) |
| 2.0 | 6.0 | GO:0004918 | interleukin-8 receptor activity(GO:0004918) |
| 1.9 | 38.9 | GO:0005537 | mannose binding(GO:0005537) |
| 1.9 | 18.7 | GO:0008429 | phosphatidylethanolamine binding(GO:0008429) |
| 1.6 | 6.4 | GO:0005136 | interleukin-4 receptor binding(GO:0005136) |
| 1.5 | 7.3 | GO:0008502 | melatonin receptor activity(GO:0008502) |
| 1.4 | 39.8 | GO:0008395 | steroid hydroxylase activity(GO:0008395) |
| 1.3 | 12.9 | GO:0005004 | GPI-linked ephrin receptor activity(GO:0005004) |
| 1.2 | 14.9 | GO:0022889 | L-serine transmembrane transporter activity(GO:0015194) serine transmembrane transporter activity(GO:0022889) |
| 1.2 | 3.5 | GO:0004924 | oncostatin-M receptor activity(GO:0004924) |
| 1.1 | 22.9 | GO:0005229 | intracellular calcium activated chloride channel activity(GO:0005229) |
| 1.0 | 16.7 | GO:0035198 | miRNA binding(GO:0035198) |
| 0.9 | 15.5 | GO:0050811 | GABA receptor binding(GO:0050811) |
| 0.9 | 11.6 | GO:0098879 | structural constituent of postsynaptic specialization(GO:0098879) structural constituent of postsynaptic density(GO:0098919) |
| 0.9 | 3.4 | GO:0004949 | cannabinoid receptor activity(GO:0004949) |
| 0.9 | 21.5 | GO:0001530 | lipopolysaccharide binding(GO:0001530) |
| 0.8 | 11.8 | GO:0016500 | protein-hormone receptor activity(GO:0016500) |
| 0.8 | 3.3 | GO:0004687 | myosin light chain kinase activity(GO:0004687) |
| 0.8 | 10.7 | GO:0042043 | neurexin family protein binding(GO:0042043) |
| 0.7 | 20.2 | GO:0005520 | insulin-like growth factor binding(GO:0005520) |
| 0.7 | 10.6 | GO:0045295 | gamma-catenin binding(GO:0045295) |
| 0.6 | 2.5 | GO:0030021 | extracellular matrix structural constituent conferring compression resistance(GO:0030021) structural constituent of tooth enamel(GO:0030345) |
| 0.6 | 16.0 | GO:0004693 | cyclin-dependent protein serine/threonine kinase activity(GO:0004693) |
| 0.5 | 11.8 | GO:0004745 | retinol dehydrogenase activity(GO:0004745) |
| 0.5 | 11.7 | GO:0005388 | calcium-transporting ATPase activity(GO:0005388) |
| 0.5 | 5.3 | GO:0016909 | JUN kinase activity(GO:0004705) SAP kinase activity(GO:0016909) |
| 0.5 | 45.3 | GO:0051087 | chaperone binding(GO:0051087) |
| 0.5 | 9.4 | GO:0032794 | GTPase activating protein binding(GO:0032794) |
| 0.4 | 1.8 | GO:0004185 | serine-type carboxypeptidase activity(GO:0004185) |
| 0.4 | 3.0 | GO:0015315 | hexose phosphate transmembrane transporter activity(GO:0015119) organophosphate:inorganic phosphate antiporter activity(GO:0015315) hexose-phosphate:inorganic phosphate antiporter activity(GO:0015526) glucose 6-phosphate:inorganic phosphate antiporter activity(GO:0061513) |
| 0.4 | 6.4 | GO:0005344 | oxygen transporter activity(GO:0005344) |
| 0.4 | 48.4 | GO:0004867 | serine-type endopeptidase inhibitor activity(GO:0004867) |
| 0.3 | 1.3 | GO:0033192 | calcium-dependent protein serine/threonine phosphatase activity(GO:0004723) calmodulin-dependent protein phosphatase activity(GO:0033192) |
| 0.3 | 8.3 | GO:0000062 | fatty-acyl-CoA binding(GO:0000062) |
| 0.2 | 11.5 | GO:0008307 | structural constituent of muscle(GO:0008307) |
| 0.2 | 17.8 | GO:0002039 | p53 binding(GO:0002039) |
| 0.2 | 19.3 | GO:0015171 | amino acid transmembrane transporter activity(GO:0015171) |
| 0.1 | 10.3 | GO:0017022 | myosin binding(GO:0017022) |
| 0.1 | 1.4 | GO:0004653 | polypeptide N-acetylgalactosaminyltransferase activity(GO:0004653) |
| 0.1 | 1.9 | GO:0043395 | heparan sulfate proteoglycan binding(GO:0043395) |
| 0.1 | 4.7 | GO:0070888 | E-box binding(GO:0070888) |
| 0.1 | 0.3 | GO:0016890 | site-specific endodeoxyribonuclease activity, specific for altered base(GO:0016890) |
| 0.1 | 6.5 | GO:0005496 | steroid binding(GO:0005496) |
| 0.1 | 13.6 | GO:0072509 | divalent inorganic cation transmembrane transporter activity(GO:0072509) |
| 0.1 | 4.3 | GO:0016763 | transferase activity, transferring pentosyl groups(GO:0016763) |
| 0.1 | 37.0 | GO:0008289 | lipid binding(GO:0008289) |
| 0.1 | 15.6 | GO:0005085 | guanyl-nucleotide exchange factor activity(GO:0005085) |
| 0.1 | 2.8 | GO:0016831 | carboxy-lyase activity(GO:0016831) |
| 0.1 | 1.3 | GO:0046961 | proton-transporting ATPase activity, rotational mechanism(GO:0046961) |
| 0.0 | 2.8 | GO:0003743 | translation initiation factor activity(GO:0003743) |
| 0.0 | 10.5 | GO:0031625 | ubiquitin protein ligase binding(GO:0031625) |
| 0.0 | 42.4 | GO:0032403 | protein complex binding(GO:0032403) |
| 0.0 | 2.9 | GO:0042626 | ATPase activity, coupled to transmembrane movement of substances(GO:0042626) |
| 0.0 | 7.3 | GO:0003924 | GTPase activity(GO:0003924) |
| 0.0 | 0.8 | GO:0003887 | DNA-directed DNA polymerase activity(GO:0003887) |
| 0.0 | 16.3 | GO:0005198 | structural molecule activity(GO:0005198) |
| 0.0 | 3.9 | GO:0003729 | mRNA binding(GO:0003729) poly(A) RNA binding(GO:0044822) |
| 0.0 | 0.8 | GO:0003823 | antigen binding(GO:0003823) |
Gene overrepresentation in curated gene sets: canonical pathways category:
| Log-likelihood per target | Total log-likelihood | Term | Description |
|---|---|---|---|
| 3.2 | 99.4 | PID INTEGRIN2 PATHWAY | Beta2 integrin cell surface interactions |
| 2.4 | 130.7 | PID HNF3A PATHWAY | FOXA1 transcription factor network |
| 2.1 | 104.8 | PID HNF3B PATHWAY | FOXA2 and FOXA3 transcription factor networks |
| 1.7 | 67.9 | PID CD40 PATHWAY | CD40/CD40L signaling |
| 0.8 | 44.0 | PID BMP PATHWAY | BMP receptor signaling |
| 0.6 | 90.7 | NABA ECM AFFILIATED | Genes encoding proteins affiliated structurally or functionally to extracellular matrix proteins |
| 0.4 | 6.7 | PID EPHA2 FWD PATHWAY | EPHA2 forward signaling |
| 0.4 | 12.9 | PID EPHA FWDPATHWAY | EPHA forward signaling |
| 0.4 | 15.2 | PID PTP1B PATHWAY | Signaling events mediated by PTP1B |
| 0.3 | 16.4 | PID RET PATHWAY | Signaling events regulated by Ret tyrosine kinase |
| 0.3 | 6.0 | PID IL8 CXCR1 PATHWAY | IL8- and CXCR1-mediated signaling events |
| 0.3 | 11.5 | PID P38 ALPHA BETA DOWNSTREAM PATHWAY | Signaling mediated by p38-alpha and p38-beta |
| 0.3 | 2.7 | PID S1P S1P4 PATHWAY | S1P4 pathway |
| 0.2 | 11.3 | PID TAP63 PATHWAY | Validated transcriptional targets of TAp63 isoforms |
| 0.2 | 10.6 | PID CASPASE PATHWAY | Caspase cascade in apoptosis |
| 0.2 | 4.0 | PID SYNDECAN 2 PATHWAY | Syndecan-2-mediated signaling events |
| 0.2 | 3.5 | PID IL27 PATHWAY | IL27-mediated signaling events |
| 0.1 | 3.4 | PID NCADHERIN PATHWAY | N-cadherin signaling events |
| 0.1 | 27.7 | NABA ECM REGULATORS | Genes encoding enzymes and their regulators involved in the remodeling of the extracellular matrix |
| 0.1 | 3.3 | SIG REGULATION OF THE ACTIN CYTOSKELETON BY RHO GTPASES | Genes related to regulation of the actin cytoskeleton |
| 0.1 | 2.8 | PID REG GR PATHWAY | Glucocorticoid receptor regulatory network |
| 0.1 | 1.3 | PID IL12 STAT4 PATHWAY | IL12 signaling mediated by STAT4 |
| 0.1 | 2.8 | PID MTOR 4PATHWAY | mTOR signaling pathway |
| 0.0 | 1.1 | PID RAC1 REG PATHWAY | Regulation of RAC1 activity |
| 0.0 | 0.9 | PID CDC42 REG PATHWAY | Regulation of CDC42 activity |
Gene overrepresentation in curated gene sets: REACTOME pathways category:
| Log-likelihood per target | Total log-likelihood | Term | Description |
|---|---|---|---|
| 8.9 | 151.6 | REACTOME CHYLOMICRON MEDIATED LIPID TRANSPORT | Genes involved in Chylomicron-mediated lipid transport |
| 6.8 | 109.1 | REACTOME COMMON PATHWAY | Genes involved in Common Pathway |
| 4.8 | 62.6 | REACTOME REGULATION OF COMPLEMENT CASCADE | Genes involved in Regulation of Complement cascade |
| 4.7 | 99.2 | REACTOME COMPLEMENT CASCADE | Genes involved in Complement cascade |
| 3.5 | 31.1 | REACTOME ABACAVIR TRANSPORT AND METABOLISM | Genes involved in Abacavir transport and metabolism |
| 3.3 | 39.8 | REACTOME SYNTHESIS OF BILE ACIDS AND BILE SALTS VIA 7ALPHA HYDROXYCHOLESTEROL | Genes involved in Synthesis of bile acids and bile salts via 7alpha-hydroxycholesterol |
| 2.9 | 34.7 | REACTOME RECYCLING OF BILE ACIDS AND SALTS | Genes involved in Recycling of bile acids and salts |
| 2.5 | 42.7 | REACTOME GABA A RECEPTOR ACTIVATION | Genes involved in GABA A receptor activation |
| 1.3 | 22.2 | REACTOME N GLYCAN ANTENNAE ELONGATION | Genes involved in N-Glycan antennae elongation |
| 1.3 | 42.0 | REACTOME STEROID HORMONES | Genes involved in Steroid hormones |
| 1.0 | 20.2 | REACTOME REGULATION OF INSULIN LIKE GROWTH FACTOR IGF ACTIVITY BY INSULIN LIKE GROWTH FACTOR BINDING PROTEINS IGFBPS | Genes involved in Regulation of Insulin-like Growth Factor (IGF) Activity by Insulin-like Growth Factor Binding Proteins (IGFBPs) |
| 0.8 | 16.4 | REACTOME TIE2 SIGNALING | Genes involved in Tie2 Signaling |
| 0.7 | 18.7 | REACTOME SYNTHESIS OF PC | Genes involved in Synthesis of PC |
| 0.6 | 20.2 | REACTOME TIGHT JUNCTION INTERACTIONS | Genes involved in Tight junction interactions |
| 0.6 | 15.9 | REACTOME SMOOTH MUSCLE CONTRACTION | Genes involved in Smooth Muscle Contraction |
| 0.5 | 19.3 | REACTOME AMINO ACID TRANSPORT ACROSS THE PLASMA MEMBRANE | Genes involved in Amino acid transport across the plasma membrane |
| 0.5 | 13.6 | REACTOME METAL ION SLC TRANSPORTERS | Genes involved in Metal ion SLC transporters |
| 0.5 | 8.1 | REACTOME BRANCHED CHAIN AMINO ACID CATABOLISM | Genes involved in Branched-chain amino acid catabolism |
| 0.4 | 10.6 | REACTOME CASPASE MEDIATED CLEAVAGE OF CYTOSKELETAL PROTEINS | Genes involved in Caspase-mediated cleavage of cytoskeletal proteins |
| 0.3 | 5.3 | REACTOME ACTIVATION OF THE AP1 FAMILY OF TRANSCRIPTION FACTORS | Genes involved in Activation of the AP-1 family of transcription factors |
| 0.3 | 4.3 | REACTOME PYRIMIDINE CATABOLISM | Genes involved in Pyrimidine catabolism |
| 0.3 | 2.7 | REACTOME G PROTEIN ACTIVATION | Genes involved in G-protein activation |
| 0.3 | 4.3 | REACTOME DOPAMINE NEUROTRANSMITTER RELEASE CYCLE | Genes involved in Dopamine Neurotransmitter Release Cycle |
| 0.3 | 7.8 | REACTOME ADHERENS JUNCTIONS INTERACTIONS | Genes involved in Adherens junctions interactions |
| 0.3 | 3.5 | REACTOME IL 6 SIGNALING | Genes involved in Interleukin-6 signaling |
| 0.2 | 38.3 | REACTOME METABOLISM OF AMINO ACIDS AND DERIVATIVES | Genes involved in Metabolism of amino acids and derivatives |
| 0.2 | 6.7 | REACTOME SEMA4D IN SEMAPHORIN SIGNALING | Genes involved in Sema4D in semaphorin signaling |
| 0.2 | 2.9 | REACTOME ABCA TRANSPORTERS IN LIPID HOMEOSTASIS | Genes involved in ABCA transporters in lipid homeostasis |
| 0.2 | 20.3 | REACTOME SIGNALING BY RHO GTPASES | Genes involved in Signaling by Rho GTPases |
| 0.1 | 4.0 | REACTOME CELL JUNCTION ORGANIZATION | Genes involved in Cell junction organization |
| 0.1 | 2.8 | REACTOME DEADENYLATION OF MRNA | Genes involved in Deadenylation of mRNA |
| 0.1 | 11.8 | REACTOME CLASS B 2 SECRETIN FAMILY RECEPTORS | Genes involved in Class B/2 (Secretin family receptors) |
| 0.1 | 1.9 | REACTOME HS GAG DEGRADATION | Genes involved in HS-GAG degradation |
| 0.1 | 2.1 | REACTOME NEF MEDIATES DOWN MODULATION OF CELL SURFACE RECEPTORS BY RECRUITING THEM TO CLATHRIN ADAPTERS | Genes involved in Nef-mediates down modulation of cell surface receptors by recruiting them to clathrin adapters |
| 0.1 | 7.3 | REACTOME NUCLEAR RECEPTOR TRANSCRIPTION PATHWAY | Genes involved in Nuclear Receptor transcription pathway |
| 0.1 | 2.8 | REACTOME GLUCONEOGENESIS | Genes involved in Gluconeogenesis |
| 0.1 | 3.0 | REACTOME GLUCOSE TRANSPORT | Genes involved in Glucose transport |
| 0.0 | 1.3 | REACTOME DARPP 32 EVENTS | Genes involved in DARPP-32 events |
| 0.0 | 3.3 | REACTOME SIGNALING BY SCF KIT | Genes involved in Signaling by SCF-KIT |
| 0.0 | 1.4 | REACTOME O LINKED GLYCOSYLATION OF MUCINS | Genes involved in O-linked glycosylation of mucins |
| 0.0 | 0.3 | REACTOME VITAMIN B5 PANTOTHENATE METABOLISM | Genes involved in Vitamin B5 (pantothenate) metabolism |
| 0.0 | 0.7 | REACTOME BMAL1 CLOCK NPAS2 ACTIVATES CIRCADIAN EXPRESSION | Genes involved in BMAL1:CLOCK/NPAS2 Activates Circadian Expression |