Project
GSE53960: rat RNA-Seq transcriptomic Bodymap
Navigation
Downloads
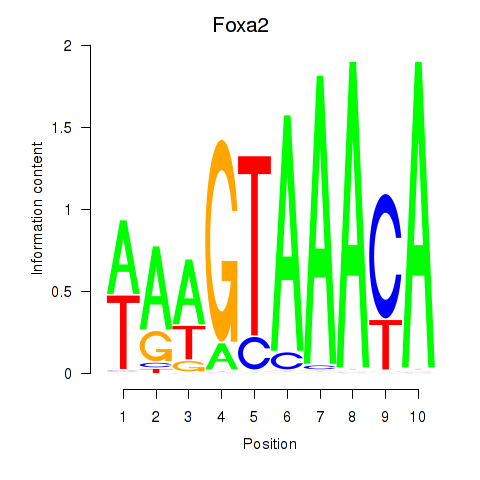
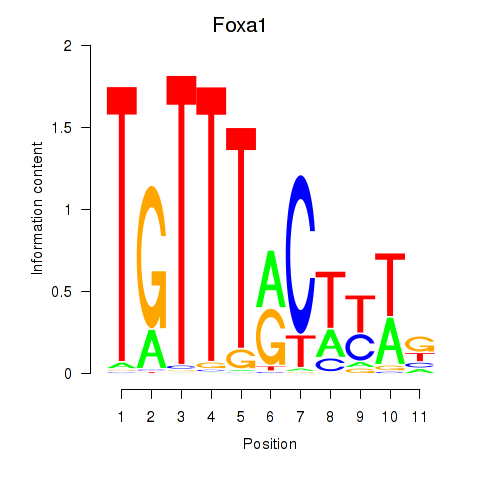
Results for Foxa2_Foxa1
Z-value: 2.04
Motif logo
Transcription factors associated with Foxa2_Foxa1
| Gene Symbol | Gene ID | Gene Info |
|---|---|---|
|
Foxa2
|
ENSRNOG00000013133 | forkhead box A2 |
|
Foxa1
|
ENSRNOG00000009284 | forkhead box A1 |
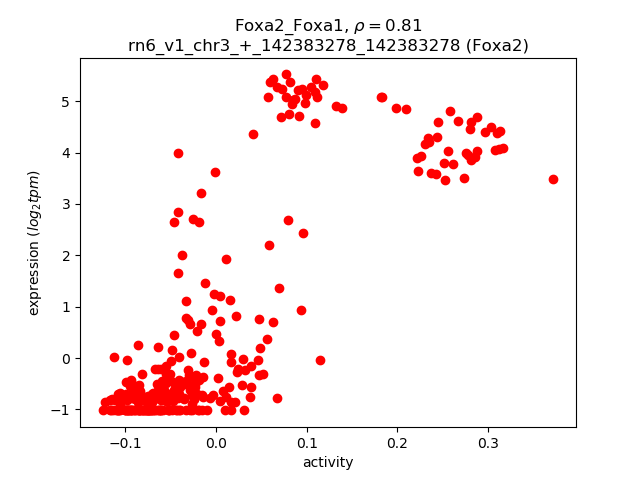
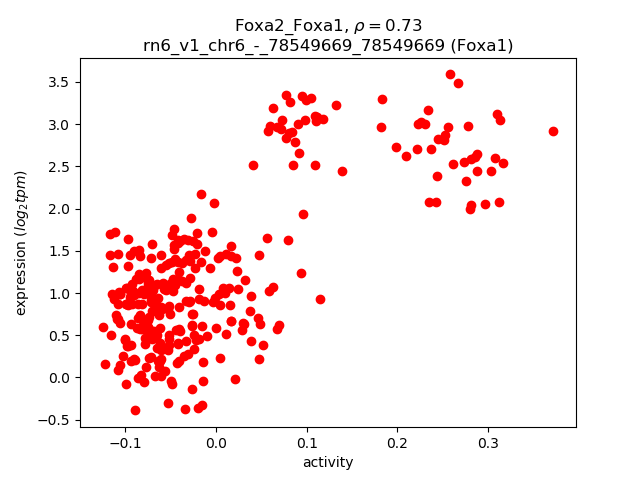
Activity-expression correlation:
| Gene | Promoter | Pearson corr. coef. | P-value | Plot |
|---|---|---|---|---|
| Foxa2 | rn6_v1_chr3_+_142383278_142383278 | 0.81 | 2.8e-77 | Click! |
| Foxa1 | rn6_v1_chr6_-_78549669_78549669 | 0.73 | 5.6e-54 | Click! |
Activity profile of Foxa2_Foxa1 motif
Sorted Z-values of Foxa2_Foxa1 motif
| Promoter | Log-likelihood | Transcript | Gene | Gene Info |
|---|---|---|---|---|
| chr5_+_124300477 | 300.99 |
ENSRNOT00000010100
|
C8b
|
complement C8 beta chain |
| chr7_-_138483612 | 234.88 |
ENSRNOT00000085620
|
Slc38a4
|
solute carrier family 38, member 4 |
| chr11_-_81717521 | 198.30 |
ENSRNOT00000058422
|
Ahsg
|
alpha-2-HS-glycoprotein |
| chr6_-_127534247 | 167.27 |
ENSRNOT00000012500
|
Serpina6
|
serpin family A member 6 |
| chr14_+_20266891 | 160.56 |
ENSRNOT00000004174
|
Gc
|
group specific component |
| chr1_-_48563776 | 155.42 |
ENSRNOT00000023368
|
Plg
|
plasminogen |
| chr6_+_33176778 | 155.39 |
ENSRNOT00000046811
ENSRNOT00000007371 |
Apob
|
apolipoprotein B |
| chr11_-_87924816 | 155.13 |
ENSRNOT00000031819
|
Serpind1
|
serpin family D member 1 |
| chr7_+_2689501 | 143.60 |
ENSRNOT00000041341
|
Apof
|
apolipoprotein F |
| chr5_-_19368431 | 142.02 |
ENSRNOT00000012819
|
Cyp7a1
|
cytochrome P450, family 7, subfamily a, polypeptide 1 |
| chr2_-_216348194 | 137.23 |
ENSRNOT00000087839
|
LOC103689940
|
pancreatic alpha-amylase-like |
| chr3_-_127500709 | 128.68 |
ENSRNOT00000006330
|
Hao1
|
hydroxyacid oxidase 1 |
| chr6_-_104631355 | 117.04 |
ENSRNOT00000007825
|
Slc10a1
|
solute carrier family 10 member 1 |
| chr7_+_93975451 | 114.56 |
ENSRNOT00000011379
|
Colec10
|
collectin subfamily member 10 |
| chr10_+_14240219 | 105.14 |
ENSRNOT00000020233
|
Igfals
|
insulin-like growth factor binding protein, acid labile subunit |
| chr8_+_50559126 | 94.87 |
ENSRNOT00000024918
|
Apoa5
|
apolipoprotein A5 |
| chr2_-_216382244 | 93.98 |
ENSRNOT00000086695
ENSRNOT00000087259 |
LOC103689940
|
pancreatic alpha-amylase-like |
| chr16_+_50152008 | 93.02 |
ENSRNOT00000019237
|
Klkb1
|
kallikrein B1 |
| chr1_-_225283326 | 92.09 |
ENSRNOT00000027342
|
Scgb1a1
|
secretoglobin family 1A member 1 |
| chr2_+_104744461 | 90.04 |
ENSRNOT00000016083
ENSRNOT00000082627 |
Cp
|
ceruloplasmin |
| chr8_+_50525091 | 84.88 |
ENSRNOT00000074357
|
Apoa1
|
apolipoprotein A1 |
| chr1_-_198486157 | 83.71 |
ENSRNOT00000022758
|
Zg16
|
zymogen granule protein 16 |
| chr2_-_182035032 | 82.19 |
ENSRNOT00000009813
|
Fgb
|
fibrinogen beta chain |
| chr5_+_152290084 | 78.84 |
ENSRNOT00000089849
|
Aim1l
|
absent in melanoma 1-like |
| chr7_-_143523457 | 77.50 |
ENSRNOT00000012943
ENSRNOT00000082264 |
Krt4
|
keratin 4 |
| chr9_+_74124016 | 72.32 |
ENSRNOT00000019023
|
Cps1
|
carbamoyl-phosphate synthase 1 |
| chr3_-_55587946 | 71.99 |
ENSRNOT00000075107
|
Abcb11
|
ATP binding cassette subfamily B member 11 |
| chr3_+_5519990 | 71.78 |
ENSRNOT00000070873
ENSRNOT00000007640 |
Adamts13
|
ADAM metallopeptidase with thrombospondin type 1 motif, 13 |
| chr11_+_61605937 | 67.06 |
ENSRNOT00000093455
ENSRNOT00000093242 |
Gramd1c
|
GRAM domain containing 1C |
| chr20_-_9876008 | 65.89 |
ENSRNOT00000001537
|
Tff2
|
trefoil factor 2 |
| chr16_+_50181316 | 65.83 |
ENSRNOT00000077662
|
F11
|
coagulation factor XI |
| chr8_-_107952530 | 63.34 |
ENSRNOT00000052043
|
Cldn18
|
claudin 18 |
| chr16_-_7026540 | 53.08 |
ENSRNOT00000051751
|
Itih1
|
inter-alpha trypsin inhibitor, heavy chain 1 |
| chr1_-_170431073 | 53.07 |
ENSRNOT00000024710
|
Hpx
|
hemopexin |
| chr10_-_103687425 | 47.57 |
ENSRNOT00000039284
|
Cd300lf
|
Cd300 molecule-like family member F |
| chr1_-_189182306 | 47.42 |
ENSRNOT00000021249
|
Gp2
|
glycoprotein 2 |
| chr3_+_149624712 | 46.22 |
ENSRNOT00000018581
|
Bpifa1
|
BPI fold containing family A, member 1 |
| chr4_+_57855416 | 46.12 |
ENSRNOT00000029608
|
Cpa2
|
carboxypeptidase A2 |
| chr1_+_148240504 | 45.13 |
ENSRNOT00000085373
|
LOC100361547
|
Cytochrome P450, family 2, subfamily c, polypeptide 7-like |
| chr7_+_41475163 | 44.18 |
ENSRNOT00000037844
|
Dusp6
|
dual specificity phosphatase 6 |
| chr18_-_24929091 | 44.12 |
ENSRNOT00000019596
|
Proc
|
protein C |
| chr4_+_62220736 | 43.91 |
ENSRNOT00000086377
|
Cald1
|
caldesmon 1 |
| chr6_-_77421286 | 43.55 |
ENSRNOT00000011453
|
Nkx2-1
|
NK2 homeobox 1 |
| chr8_-_49109981 | 43.40 |
ENSRNOT00000019933
|
Ttc36
|
tetratricopeptide repeat domain 36 |
| chr4_+_62221011 | 42.71 |
ENSRNOT00000041264
|
Cald1
|
caldesmon 1 |
| chr4_-_15505362 | 40.44 |
ENSRNOT00000009763
|
Hgf
|
hepatocyte growth factor |
| chr20_-_31598118 | 39.14 |
ENSRNOT00000046537
|
Col13a1
|
collagen type XIII alpha 1 chain |
| chr10_-_46404642 | 36.14 |
ENSRNOT00000083698
|
Pemt
|
phosphatidylethanolamine N-methyltransferase |
| chr1_+_166428761 | 35.96 |
ENSRNOT00000085555
|
Stard10
|
StAR-related lipid transfer domain containing 10 |
| chr10_+_56710464 | 35.70 |
ENSRNOT00000065370
ENSRNOT00000064064 |
Asgr2
|
asialoglycoprotein receptor 2 |
| chr13_+_83073866 | 31.25 |
ENSRNOT00000075996
|
Dpt
|
dermatopontin |
| chr7_+_28414350 | 30.82 |
ENSRNOT00000085680
|
Igf1
|
insulin-like growth factor 1 |
| chr1_+_48273611 | 30.36 |
ENSRNOT00000022254
ENSRNOT00000022068 |
Slc22a1
|
solute carrier family 22 member 1 |
| chr12_+_47407811 | 29.97 |
ENSRNOT00000001565
|
Hnf1a
|
HNF1 homeobox A |
| chr16_+_18716019 | 29.42 |
ENSRNOT00000047870
|
Sftpa1
|
surfactant protein A1 |
| chr10_-_88060561 | 28.31 |
ENSRNOT00000019133
|
Krt19
|
keratin 19 |
| chr6_-_78549669 | 26.95 |
ENSRNOT00000009940
|
Foxa1
|
forkhead box A1 |
| chr13_-_53870428 | 26.11 |
ENSRNOT00000000812
|
Nr5a2
|
nuclear receptor subfamily 5, group A, member 2 |
| chr11_+_65022100 | 26.06 |
ENSRNOT00000003934
|
Nr1i2
|
nuclear receptor subfamily 1, group I, member 2 |
| chr7_-_28040510 | 24.62 |
ENSRNOT00000005674
|
Ascl1
|
achaete-scute family bHLH transcription factor 1 |
| chr1_+_264741911 | 24.16 |
ENSRNOT00000019956
|
Sema4g
|
semaphorin 4G |
| chr5_+_165415136 | 23.76 |
ENSRNOT00000016317
ENSRNOT00000079407 |
Masp2
|
mannan-binding lectin serine peptidase 2 |
| chr2_+_53109684 | 22.97 |
ENSRNOT00000086590
|
Selenop
|
selenoprotein P |
| chr4_-_119188251 | 21.31 |
ENSRNOT00000057350
|
Gkn3
|
gastrokine 3 |
| chr3_-_48451650 | 21.21 |
ENSRNOT00000007356
|
Gcg
|
glucagon |
| chr1_-_131460473 | 20.72 |
ENSRNOT00000084336
|
Nr2f2
|
nuclear receptor subfamily 2, group F, member 2 |
| chr5_+_162808646 | 19.88 |
ENSRNOT00000021155
|
Dhrs3
|
dehydrogenase/reductase 3 |
| chr10_+_86399827 | 19.71 |
ENSRNOT00000009299
|
Grb7
|
growth factor receptor bound protein 7 |
| chr2_-_250923744 | 18.90 |
ENSRNOT00000084996
|
Clca1
|
chloride channel accessory 1 |
| chr3_+_140024043 | 17.91 |
ENSRNOT00000086409
|
Rin2
|
Ras and Rab interactor 2 |
| chr14_+_18983853 | 17.30 |
ENSRNOT00000003836
|
Rassf6
|
Ras association domain family member 6 |
| chr20_-_31597830 | 17.15 |
ENSRNOT00000085877
|
Col13a1
|
collagen type XIII alpha 1 chain |
| chr5_-_88629491 | 16.52 |
ENSRNOT00000058906
|
Tle1
|
transducin like enhancer of split 1 |
| chr2_+_208749996 | 16.35 |
ENSRNOT00000086321
|
Chia
|
chitinase, acidic |
| chr18_+_68408890 | 16.05 |
ENSRNOT00000039702
|
Ccdc68
|
coiled-coil domain containing 68 |
| chr2_+_24546536 | 15.54 |
ENSRNOT00000014036
|
Otp
|
orthopedia homeobox |
| chr2_-_100249811 | 15.42 |
ENSRNOT00000086760
|
Hnf4g
|
hepatocyte nuclear factor 4, gamma |
| chr8_+_82878941 | 15.13 |
ENSRNOT00000014846
|
Bmp5
|
bone morphogenetic protein 5 |
| chr8_+_57886168 | 14.55 |
ENSRNOT00000039336
|
Exph5
|
exophilin 5 |
| chrX_-_111102464 | 14.24 |
ENSRNOT00000084176
|
Ripply1
|
ripply transcriptional repressor 1 |
| chr6_-_77508585 | 14.03 |
ENSRNOT00000011562
|
Nkx2-8
|
NK2 homeobox 8 |
| chr2_+_208750356 | 13.97 |
ENSRNOT00000041562
|
Chia
|
chitinase, acidic |
| chr4_+_62380914 | 13.95 |
ENSRNOT00000029845
|
Tmem140
|
transmembrane protein 140 |
| chr6_-_51257625 | 13.79 |
ENSRNOT00000012004
|
Hbp1
|
HMG-box transcription factor 1 |
| chr15_+_55126953 | 12.93 |
ENSRNOT00000021430
|
Lpar6
|
lysophosphatidic acid receptor 6 |
| chr2_-_234296145 | 12.88 |
ENSRNOT00000014155
|
Elovl6
|
ELOVL fatty acid elongase 6 |
| chr2_-_158133861 | 12.77 |
ENSRNOT00000090700
|
Veph1
|
ventricular zone expressed PH domain-containing 1 |
| chr1_+_107262659 | 12.25 |
ENSRNOT00000022499
|
Gas2
|
growth arrest-specific 2 |
| chrX_+_40460047 | 12.03 |
ENSRNOT00000010970
|
Phex
|
phosphate regulating endopeptidase homolog, X-linked |
| chr6_+_137243185 | 11.41 |
ENSRNOT00000030879
|
Zbtb42
|
zinc finger and BTB domain containing 42 |
| chr4_-_82127051 | 11.25 |
ENSRNOT00000083658
ENSRNOT00000007807 |
Hoxa1
|
homeo box A1 |
| chr16_-_23156962 | 11.18 |
ENSRNOT00000018543
|
Sh2d4a
|
SH2 domain containing 4A |
| chr9_-_81467760 | 11.12 |
ENSRNOT00000090868
|
Cxcr1
|
C-X-C motif chemokine receptor 1 |
| chr8_+_40009691 | 10.85 |
ENSRNOT00000042679
|
Vsig2
|
V-set and immunoglobulin domain containing 2 |
| chr10_+_56411028 | 10.68 |
ENSRNOT00000085772
|
AABR07029862.1
|
|
| chr14_+_44413636 | 10.33 |
ENSRNOT00000003552
|
Smim14
|
small integral membrane protein 14 |
| chr13_-_51201331 | 10.20 |
ENSRNOT00000005272
ENSRNOT00000078990 |
Tmem183a
|
transmembrane protein 183A |
| chr1_+_72810545 | 10.01 |
ENSRNOT00000092117
|
Ptprh
|
protein tyrosine phosphatase, receptor type, H |
| chr2_-_258997138 | 9.94 |
ENSRNOT00000045020
ENSRNOT00000042256 |
Adgrl2
|
adhesion G protein-coupled receptor L2 |
| chr2_-_54823917 | 9.86 |
ENSRNOT00000039057
ENSRNOT00000079333 |
Card6
|
caspase recruitment domain family, member 6 |
| chr2_+_44289393 | 9.46 |
ENSRNOT00000018877
|
Il6st
|
interleukin 6 signal transducer |
| chr4_+_14001761 | 9.10 |
ENSRNOT00000076519
|
Cd36
|
CD36 molecule |
| chr3_+_44806106 | 9.10 |
ENSRNOT00000035158
|
Upp2
|
uridine phosphorylase 2 |
| chr5_-_115387377 | 9.02 |
ENSRNOT00000036030
ENSRNOT00000077492 |
RGD1560146
|
similar to hypothetical protein MGC34837 |
| chr1_+_214778496 | 9.00 |
ENSRNOT00000028967
|
Muc5b
|
mucin 5B, oligomeric mucus/gel-forming |
| chr2_-_204254699 | 8.84 |
ENSRNOT00000021487
|
Mab21l3
|
mab-21 like 3 |
| chr9_-_20195566 | 8.76 |
ENSRNOT00000015223
|
Adgrf5
|
adhesion G protein-coupled receptor F5 |
| chr2_-_193136520 | 8.54 |
ENSRNOT00000042142
|
Kprp
|
keratinocyte proline-rich protein |
| chrX_+_26439197 | 8.48 |
ENSRNOT00000078843
ENSRNOT00000052176 ENSRNOT00000087268 |
Amelx
|
amelogenin, X-linked |
| chr11_-_67756799 | 8.28 |
ENSRNOT00000030975
|
Parp9
|
poly (ADP-ribose) polymerase family, member 9 |
| chr17_-_1093873 | 7.92 |
ENSRNOT00000086130
|
Ptch1
|
patched 1 |
| chr1_+_256955652 | 7.70 |
ENSRNOT00000020411
|
Lgi1
|
leucine-rich, glioma inactivated 1 |
| chr15_+_33074441 | 7.65 |
ENSRNOT00000075610
|
Mmp14
|
matrix metallopeptidase 14 |
| chr12_-_30083824 | 7.60 |
ENSRNOT00000084968
|
Tpst1
|
tyrosylprotein sulfotransferase 1 |
| chr7_+_13938302 | 7.30 |
ENSRNOT00000009643
|
Casp14
|
caspase 14 |
| chr20_-_27757149 | 7.19 |
ENSRNOT00000088287
|
Dse
|
dermatan sulfate epimerase |
| chr10_+_82292110 | 7.10 |
ENSRNOT00000004435
|
Chad
|
chondroadherin |
| chr10_+_108340240 | 6.88 |
ENSRNOT00000077535
|
Ccdc40
|
coiled-coil domain containing 40 |
| chr17_+_42133076 | 6.82 |
ENSRNOT00000031384
|
Aldh5a1
|
aldehyde dehydrogenase 5 family, member A1 |
| chr4_+_163293724 | 6.72 |
ENSRNOT00000077356
|
Gabarapl1
|
GABA type A receptor associated protein like 1 |
| chr10_-_95212111 | 6.70 |
ENSRNOT00000020795
|
Kpna2
|
karyopherin subunit alpha 2 |
| chr2_+_121165137 | 6.41 |
ENSRNOT00000016236
|
Sox2
|
SRY box 2 |
| chr10_+_70884531 | 6.12 |
ENSRNOT00000015199
|
Ccl4
|
C-C motif chemokine ligand 4 |
| chr5_+_173237642 | 6.11 |
ENSRNOT00000068770
|
Ankrd65
|
ankyrin repeat domain 65 |
| chrX_-_79743117 | 5.99 |
ENSRNOT00000044808
|
LOC103690878
|
syntaxin-3-like |
| chr12_+_22665112 | 5.63 |
ENSRNOT00000001918
|
Ap1s1
|
adaptor-related protein complex 1, sigma 1 subunit |
| chr2_-_192671059 | 5.54 |
ENSRNOT00000012174
|
Sprr1a
|
small proline-rich protein 1A |
| chr2_+_234375315 | 5.48 |
ENSRNOT00000071270
|
LOC102549542
|
elongation of very long chain fatty acids protein 6-like |
| chr2_+_110306363 | 5.45 |
ENSRNOT00000040463
|
LOC499584
|
LRRGT00202 |
| chrX_+_35599258 | 5.33 |
ENSRNOT00000072627
ENSRNOT00000005061 |
Cdkl5
|
cyclin-dependent kinase-like 5 |
| chr2_-_236480502 | 5.33 |
ENSRNOT00000015020
|
Sgms2
|
sphingomyelin synthase 2 |
| chr11_-_782954 | 5.28 |
ENSRNOT00000040065
|
Epha3
|
Eph receptor A3 |
| chr8_-_115981910 | 5.04 |
ENSRNOT00000019867
|
Dock3
|
dedicator of cyto-kinesis 3 |
| chr9_-_78607307 | 4.86 |
ENSRNOT00000057672
|
Abca12
|
ATP binding cassette subfamily A member 12 |
| chr17_-_84830185 | 4.69 |
ENSRNOT00000040697
|
Skida1
|
SKI/DACH domain containing 1 |
| chr19_+_53055745 | 4.67 |
ENSRNOT00000074430
|
Foxl1
|
forkhead box L1 |
| chr9_+_77834091 | 4.62 |
ENSRNOT00000033459
|
Vwc2l
|
von Willebrand factor C domain-containing protein 2-like |
| chr2_-_198706428 | 4.58 |
ENSRNOT00000085006
|
Polr3gl
|
RNA polymerase III subunit G like |
| chr5_+_116420690 | 4.49 |
ENSRNOT00000087089
|
Nfia
|
nuclear factor I/A |
| chr13_-_48927483 | 4.44 |
ENSRNOT00000010976
|
Cdk18
|
cyclin-dependent kinase 18 |
| chr4_-_168297373 | 4.43 |
ENSRNOT00000066575
|
Lrp6
|
LDL receptor related protein 6 |
| chr1_+_215460226 | 4.43 |
ENSRNOT00000027270
|
LOC685544
|
hypothetical protein LOC685544 |
| chr8_-_102149912 | 4.23 |
ENSRNOT00000011263
|
RGD1309079
|
similar to Ab2-095 |
| chr7_+_91833297 | 4.22 |
ENSRNOT00000079792
|
Slc30a8
|
solute carrier family 30 member 8 |
| chr7_+_99954492 | 4.20 |
ENSRNOT00000005885
|
Trib1
|
tribbles pseudokinase 1 |
| chr20_-_27308069 | 4.17 |
ENSRNOT00000056047
|
Slc25a16
|
solute carrier family 25 member 16 |
| chr8_+_81863619 | 4.09 |
ENSRNOT00000080608
|
Fam214a
|
family with sequence similarity 214, member A |
| chr4_-_148362278 | 3.92 |
ENSRNOT00000051510
|
LOC680441
|
similar to 60S ribosomal protein L23a |
| chr4_+_66670618 | 3.82 |
ENSRNOT00000010796
|
Tbxas1
|
thromboxane A synthase 1 |
| chr4_-_28437676 | 3.62 |
ENSRNOT00000012995
|
Hepacam2
|
HEPACAM family member 2 |
| chr1_+_244615821 | 3.58 |
ENSRNOT00000080124
|
Smarca2
|
SWI/SNF related, matrix associated, actin dependent regulator of chromatin, subfamily a, member 2 |
| chr20_+_49319307 | 3.32 |
ENSRNOT00000057078
|
Atg5
|
autophagy related 5 |
| chr17_-_13393243 | 2.97 |
ENSRNOT00000018252
|
Gadd45g
|
growth arrest and DNA-damage-inducible, gamma |
| chr15_-_95514259 | 2.81 |
ENSRNOT00000038433
|
Slitrk6
|
SLIT and NTRK-like family, member 6 |
| chr2_-_78283473 | 2.67 |
ENSRNOT00000087246
|
AABR07008911.1
|
|
| chr5_+_50381244 | 2.67 |
ENSRNOT00000012385
|
Cga
|
glycoprotein hormones, alpha polypeptide |
| chr17_-_55346279 | 2.58 |
ENSRNOT00000025037
|
Svil
|
supervillin |
| chr3_-_160038078 | 2.57 |
ENSRNOT00000013445
|
Serinc3
|
serine incorporator 3 |
| chr1_-_24191908 | 2.53 |
ENSRNOT00000061157
|
Sgk1
|
serum/glucocorticoid regulated kinase 1 |
| chr3_-_141411170 | 2.49 |
ENSRNOT00000017364
|
Nkx2-2
|
NK2 homeobox 2 |
| chr3_-_60795951 | 2.47 |
ENSRNOT00000002174
|
Atf2
|
activating transcription factor 2 |
| chr4_+_119171245 | 2.45 |
ENSRNOT00000067651
|
Gkn2
|
gastrokine 2 |
| chr1_+_168519499 | 2.40 |
ENSRNOT00000045286
|
Olr98
|
olfactory receptor 98 |
| chrX_-_15504165 | 2.38 |
ENSRNOT00000006233
|
Otud5
|
OTU deubiquitinase 5 |
| chr6_+_129438158 | 2.33 |
ENSRNOT00000005953
|
Bdkrb1
|
bradykinin receptor B1 |
| chr3_-_64543100 | 2.23 |
ENSRNOT00000025803
|
Zfp385b
|
zinc finger protein 385B |
| chr1_+_201620642 | 2.19 |
ENSRNOT00000093674
|
Dmbt1
|
deleted in malignant brain tumors 1 |
| chr15_+_24942218 | 2.19 |
ENSRNOT00000016629
|
Peli2
|
pellino E3 ubiquitin protein ligase family member 2 |
| chr8_-_61595032 | 2.10 |
ENSRNOT00000023428
|
Snx33
|
sorting nexin 33 |
| chr2_-_183128932 | 2.10 |
ENSRNOT00000031179
|
Mnd1
|
meiotic nuclear divisions 1 |
| chr1_-_90149991 | 1.92 |
ENSRNOT00000076987
|
RGD1308428
|
similar to RIKEN cDNA 4931406P16 |
| chr9_-_55256340 | 1.90 |
ENSRNOT00000028907
|
Sdpr
|
serum deprivation response |
| chr14_+_42714315 | 1.88 |
ENSRNOT00000084095
ENSRNOT00000091449 |
Phox2b
|
paired-like homeobox 2b |
| chr6_-_26497328 | 1.86 |
ENSRNOT00000074938
|
Nrbp1
|
nuclear receptor binding protein 1 |
| chr10_+_87846947 | 1.81 |
ENSRNOT00000077436
|
Krtap9-5
|
keratin associated protein 9-5 |
| chrX_-_63203643 | 1.79 |
ENSRNOT00000065194
ENSRNOT00000076974 |
Zfx
|
zinc finger protein X-linked |
| chr17_-_42818258 | 1.76 |
ENSRNOT00000088978
|
Prl3c1
|
Prolactin family 3, subfamily c, member 1 |
| chr9_+_45605552 | 1.59 |
ENSRNOT00000059587
|
NMS
|
neuromedin S |
| chr4_+_179481263 | 1.57 |
ENSRNOT00000021284
|
Etfrf1
|
electron transfer flavoprotein regulatory factor 1 |
| chr5_-_12172009 | 1.49 |
ENSRNOT00000061903
|
Pcmtd1
|
protein-L-isoaspartate (D-aspartate) O-methyltransferase domain containing 1 |
| chr16_-_75415555 | 1.45 |
ENSRNOT00000029297
|
Defa7
|
defensin alpha 7 |
| chr10_+_58860940 | 1.39 |
ENSRNOT00000056551
ENSRNOT00000074523 |
XAF1
|
XIAP associated factor-1 |
| chr10_-_84789832 | 1.27 |
ENSRNOT00000071719
|
Cdk5rap3
|
CDK5 regulatory subunit associated protein 3 |
| chr16_-_75107931 | 1.15 |
ENSRNOT00000058066
|
Defb15
|
defensin beta 15 |
| chr11_+_74984613 | 1.15 |
ENSRNOT00000035049
|
Atp13a5
|
ATPase 13A5 |
| chr9_+_111220858 | 1.12 |
ENSRNOT00000076669
|
Ppip5k2
|
diphosphoinositol pentakisphosphate kinase 2 |
| chr8_-_58120045 | 1.07 |
ENSRNOT00000086812
|
Atm
|
ATM serine/threonine kinase |
| chr3_-_176781040 | 0.96 |
ENSRNOT00000044026
|
Gmeb2
|
glucocorticoid modulatory element binding protein 2 |
| chr20_+_33527932 | 0.95 |
ENSRNOT00000066492
|
Nepn
|
nephrocan |
| chr1_-_40972826 | 0.93 |
ENSRNOT00000060757
|
Rmnd1
|
required for meiotic nuclear division 1 homolog |
| chr9_-_15274917 | 0.84 |
ENSRNOT00000019650
|
Pgc
|
progastricsin |
| chr10_+_57040267 | 0.82 |
ENSRNOT00000026207
|
Arrb2
|
arrestin, beta 2 |
| chr4_+_72589565 | 0.77 |
ENSRNOT00000079349
|
Olr437
|
olfactory receptor 437 |
| chrX_+_26440584 | 0.74 |
ENSRNOT00000087293
ENSRNOT00000005328 |
Amelx
|
amelogenin, X-linked |
| chr5_+_113725717 | 0.69 |
ENSRNOT00000032248
|
Tek
|
TEK receptor tyrosine kinase |
| chr5_-_7874909 | 0.64 |
ENSRNOT00000064774
|
Prex2
|
phosphatidylinositol-3,4,5-trisphosphate-dependent Rac exchange factor 2 |
| chr10_-_87351030 | 0.61 |
ENSRNOT00000034889
ENSRNOT00000091152 |
Krt20
|
keratin 20 |
| chr8_-_37026142 | 0.61 |
ENSRNOT00000060446
|
LOC100361828
|
rCG22807-like |
| chr1_-_151106802 | 0.60 |
ENSRNOT00000021971
|
Tyr
|
tyrosinase |
| chr8_+_85951191 | 0.59 |
ENSRNOT00000037665
|
Cd109
|
CD109 molecule |
Network of associatons between targets according to the STRING database.

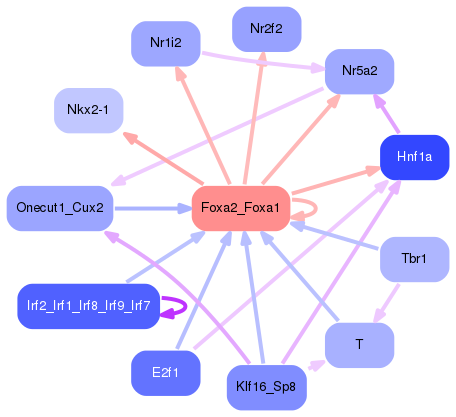
First level regulatory network of Foxa2_Foxa1
Gene Ontology Analysis
Gene overrepresentation in biological process category:
| Log-likelihood per target | Total log-likelihood | Term | Description |
|---|---|---|---|
| 51.8 | 155.4 | GO:0052047 | interaction with other organism via secreted substance involved in symbiotic interaction(GO:0052047) |
| 44.9 | 179.7 | GO:0010901 | regulation of very-low-density lipoprotein particle remodeling(GO:0010901) |
| 32.2 | 128.7 | GO:0009441 | glycolate metabolic process(GO:0009441) |
| 31.8 | 158.8 | GO:0051919 | positive regulation of fibrinolysis(GO:0051919) |
| 27.5 | 164.8 | GO:0006642 | triglyceride mobilization(GO:0006642) |
| 27.4 | 301.0 | GO:0006957 | complement activation, alternative pathway(GO:0006957) |
| 21.1 | 63.3 | GO:2001205 | negative regulation of osteoclast development(GO:2001205) |
| 20.4 | 81.5 | GO:0032696 | negative regulation of interleukin-13 production(GO:0032696) |
| 16.4 | 82.2 | GO:0043152 | induction of bacterial agglutination(GO:0043152) |
| 15.9 | 47.6 | GO:2000426 | regulation of interleukin-4-mediated signaling pathway(GO:1902214) negative regulation of apoptotic cell clearance(GO:2000426) |
| 14.7 | 44.2 | GO:0042663 | regulation of endodermal cell fate specification(GO:0042663) |
| 14.5 | 72.3 | GO:0071400 | cellular response to oleic acid(GO:0071400) |
| 13.3 | 53.1 | GO:0060332 | positive regulation of response to interferon-gamma(GO:0060332) positive regulation of interferon-gamma-mediated signaling pathway(GO:0060335) |
| 11.9 | 47.4 | GO:0002386 | immune response in mucosal-associated lymphoid tissue(GO:0002386) |
| 11.8 | 142.0 | GO:0070857 | regulation of bile acid biosynthetic process(GO:0070857) |
| 11.6 | 57.8 | GO:0060741 | prostate gland stromal morphogenesis(GO:0060741) |
| 11.3 | 90.0 | GO:0015679 | plasma membrane copper ion transport(GO:0015679) |
| 10.9 | 98.1 | GO:0046618 | drug export(GO:0046618) |
| 10.4 | 20.7 | GO:0060849 | lymphatic endothelial cell fate commitment(GO:0060838) regulation of transcription involved in lymphatic endothelial cell fate commitment(GO:0060849) |
| 10.1 | 40.4 | GO:1902947 | regulation of tau-protein kinase activity(GO:1902947) |
| 9.4 | 65.9 | GO:0060455 | negative regulation of gastric acid secretion(GO:0060455) |
| 9.2 | 46.2 | GO:0050828 | regulation of liquid surface tension(GO:0050828) |
| 9.0 | 27.1 | GO:0021530 | spinal cord oligodendrocyte cell differentiation(GO:0021529) spinal cord oligodendrocyte cell fate specification(GO:0021530) |
| 8.9 | 160.6 | GO:0042359 | vitamin D metabolic process(GO:0042359) |
| 8.6 | 198.3 | GO:0030502 | negative regulation of bone mineralization(GO:0030502) |
| 7.6 | 15.1 | GO:0021502 | neural fold elevation formation(GO:0021502) |
| 7.5 | 30.0 | GO:0035565 | regulation of pronephros size(GO:0035565) |
| 7.4 | 44.1 | GO:1901552 | positive regulation of endothelial cell development(GO:1901552) positive regulation of establishment of endothelial barrier(GO:1903142) |
| 7.3 | 43.5 | GO:0021759 | globus pallidus development(GO:0021759) |
| 7.0 | 167.3 | GO:0008211 | glucocorticoid metabolic process(GO:0008211) |
| 6.5 | 26.1 | GO:0061113 | pancreas morphogenesis(GO:0061113) |
| 6.4 | 153.0 | GO:0015721 | bile acid and bile salt transport(GO:0015721) |
| 6.1 | 30.3 | GO:0006030 | chitin metabolic process(GO:0006030) chitin catabolic process(GO:0006032) |
| 6.0 | 36.1 | GO:0050747 | positive regulation of lipoprotein metabolic process(GO:0050747) |
| 6.0 | 12.0 | GO:1904383 | response to sodium phosphate(GO:1904383) |
| 5.9 | 29.4 | GO:0008228 | opsonization(GO:0008228) |
| 5.3 | 21.2 | GO:1903576 | response to L-arginine(GO:1903576) |
| 3.8 | 11.3 | GO:0021569 | rhombomere 3 development(GO:0021569) rhombomere 4 development(GO:0021570) |
| 3.7 | 11.1 | GO:0098758 | response to interleukin-8(GO:0098758) cellular response to interleukin-8(GO:0098759) |
| 3.6 | 156.4 | GO:0033344 | cholesterol efflux(GO:0033344) |
| 3.0 | 30.4 | GO:0015697 | quaternary ammonium group transport(GO:0015697) |
| 2.8 | 234.9 | GO:0003333 | amino acid transmembrane transport(GO:0003333) |
| 2.8 | 71.8 | GO:0035864 | response to potassium ion(GO:0035864) |
| 2.6 | 18.4 | GO:0034625 | fatty acid elongation, monounsaturated fatty acid(GO:0034625) |
| 2.5 | 7.6 | GO:0006478 | peptidyl-tyrosine sulfation(GO:0006478) |
| 2.5 | 19.9 | GO:0048387 | negative regulation of retinoic acid receptor signaling pathway(GO:0048387) |
| 2.4 | 7.3 | GO:0070268 | cornification(GO:0070268) |
| 2.4 | 7.2 | GO:0030208 | dermatan sulfate biosynthetic process(GO:0030208) |
| 2.3 | 6.8 | GO:0006083 | acetate metabolic process(GO:0006083) |
| 1.9 | 15.5 | GO:0021979 | hypothalamus cell differentiation(GO:0021979) |
| 1.8 | 53.1 | GO:0030212 | hyaluronan metabolic process(GO:0030212) |
| 1.8 | 5.3 | GO:0097156 | fasciculation of motor neuron axon(GO:0097156) |
| 1.7 | 23.8 | GO:0001867 | complement activation, lectin pathway(GO:0001867) |
| 1.7 | 45.1 | GO:0019373 | epoxygenase P450 pathway(GO:0019373) |
| 1.6 | 6.4 | GO:0071698 | olfactory placode formation(GO:0030910) olfactory placode development(GO:0071698) olfactory placode morphogenesis(GO:0071699) |
| 1.6 | 4.7 | GO:0061146 | Peyer's patch morphogenesis(GO:0061146) |
| 1.5 | 19.7 | GO:0034063 | stress granule assembly(GO:0034063) |
| 1.5 | 9.1 | GO:0044206 | pyrimidine ribonucleotide salvage(GO:0010138) pyrimidine nucleotide salvage(GO:0032262) UMP salvage(GO:0044206) |
| 1.5 | 4.4 | GO:0061348 | negative regulation of Wnt signaling pathway involved in heart development(GO:0003308) Wnt signaling pathway involved in forebrain neuroblast division(GO:0021874) external genitalia morphogenesis(GO:0035261) canonical Wnt signaling pathway involved in positive regulation of cardiac outflow tract cell proliferation(GO:0061324) planar cell polarity pathway involved in outflow tract morphogenesis(GO:0061347) planar cell polarity pathway involved in ventricular septum morphogenesis(GO:0061348) planar cell polarity pathway involved in cardiac right atrium morphogenesis(GO:0061349) planar cell polarity pathway involved in cardiac muscle tissue morphogenesis(GO:0061350) planar cell polarity pathway involved in pericardium morphogenesis(GO:0061354) regulation of cardiac chamber morphogenesis(GO:1901219) negative regulation of cardiac chamber morphogenesis(GO:1901220) regulation of cardiac ventricle development(GO:1904412) |
| 1.5 | 14.5 | GO:0071985 | multivesicular body sorting pathway(GO:0071985) |
| 1.4 | 23.0 | GO:0001887 | selenium compound metabolic process(GO:0001887) |
| 1.4 | 51.5 | GO:0036075 | endochondral ossification(GO:0001958) replacement ossification(GO:0036075) |
| 1.3 | 6.5 | GO:2000334 | blood microparticle formation(GO:0072564) regulation of blood microparticle formation(GO:2000332) positive regulation of blood microparticle formation(GO:2000334) |
| 1.3 | 8.8 | GO:0043031 | negative regulation of macrophage activation(GO:0043031) |
| 1.2 | 6.1 | GO:2000503 | positive regulation of natural killer cell chemotaxis(GO:2000503) |
| 1.1 | 4.2 | GO:0045658 | regulation of neutrophil differentiation(GO:0045658) |
| 1.0 | 4.2 | GO:0043137 | DNA replication, removal of RNA primer(GO:0043137) |
| 1.0 | 8.3 | GO:0060330 | regulation of response to interferon-gamma(GO:0060330) |
| 1.0 | 14.1 | GO:0032525 | somite rostral/caudal axis specification(GO:0032525) |
| 1.0 | 86.6 | GO:0032092 | positive regulation of protein binding(GO:0032092) |
| 1.0 | 6.9 | GO:0035469 | determination of pancreatic left/right asymmetry(GO:0035469) |
| 1.0 | 28.3 | GO:0060706 | cell differentiation involved in embryonic placenta development(GO:0060706) |
| 1.0 | 16.5 | GO:2000811 | negative regulation of anoikis(GO:2000811) |
| 1.0 | 6.7 | GO:0046015 | regulation of transcription by glucose(GO:0046015) |
| 0.9 | 1.9 | GO:0021550 | medulla oblongata development(GO:0021550) |
| 0.9 | 3.6 | GO:0035887 | aortic smooth muscle cell differentiation(GO:0035887) |
| 0.9 | 5.3 | GO:0006686 | sphingomyelin biosynthetic process(GO:0006686) |
| 0.9 | 13.8 | GO:0032369 | negative regulation of lipid transport(GO:0032369) |
| 0.8 | 3.3 | GO:2000619 | negative regulation of histone H4-K16 acetylation(GO:2000619) |
| 0.8 | 2.5 | GO:0032915 | positive regulation of transforming growth factor beta2 production(GO:0032915) |
| 0.8 | 2.4 | GO:1905077 | regulation of interleukin-17 secretion(GO:1905076) negative regulation of interleukin-17 secretion(GO:1905077) |
| 0.8 | 7.1 | GO:0060346 | bone trabecula formation(GO:0060346) |
| 0.8 | 3.8 | GO:0030644 | cellular chloride ion homeostasis(GO:0030644) |
| 0.7 | 31.2 | GO:0030199 | collagen fibril organization(GO:0030199) |
| 0.6 | 2.6 | GO:0009597 | detection of virus(GO:0009597) |
| 0.6 | 4.5 | GO:0072189 | ureter development(GO:0072189) |
| 0.6 | 2.8 | GO:0060005 | vestibular reflex(GO:0060005) |
| 0.6 | 75.9 | GO:0050680 | negative regulation of epithelial cell proliferation(GO:0050680) |
| 0.5 | 139.3 | GO:0010951 | negative regulation of endopeptidase activity(GO:0010951) |
| 0.5 | 9.2 | GO:0070166 | enamel mineralization(GO:0070166) |
| 0.4 | 35.7 | GO:0055088 | lipid homeostasis(GO:0055088) |
| 0.4 | 4.2 | GO:0061088 | sequestering of zinc ion(GO:0032119) regulation of sequestering of zinc ion(GO:0061088) |
| 0.4 | 5.5 | GO:0031424 | keratinization(GO:0031424) |
| 0.4 | 2.5 | GO:0043402 | glucocorticoid mediated signaling pathway(GO:0043402) |
| 0.4 | 1.1 | GO:1904868 | pre-B cell allelic exclusion(GO:0002331) signal transduction involved in G2 DNA damage checkpoint(GO:0072425) signal transduction involved in mitotic G2 DNA damage checkpoint(GO:0072434) telomerase catalytic core complex assembly(GO:1904868) regulation of telomerase catalytic core complex assembly(GO:1904882) positive regulation of telomerase catalytic core complex assembly(GO:1904884) |
| 0.3 | 6.0 | GO:0099500 | synaptic vesicle fusion to presynaptic active zone membrane(GO:0031629) vesicle fusion to plasma membrane(GO:0099500) |
| 0.2 | 2.2 | GO:0008063 | Toll signaling pathway(GO:0008063) |
| 0.2 | 2.1 | GO:0036089 | cleavage furrow formation(GO:0036089) macropinocytosis(GO:0044351) |
| 0.2 | 1.3 | GO:0071569 | protein ufmylation(GO:0071569) |
| 0.2 | 2.7 | GO:0046884 | follicle-stimulating hormone secretion(GO:0046884) |
| 0.2 | 147.3 | GO:0005975 | carbohydrate metabolic process(GO:0005975) |
| 0.2 | 3.0 | GO:1900745 | positive regulation of p38MAPK cascade(GO:1900745) |
| 0.2 | 74.7 | GO:0007568 | aging(GO:0007568) |
| 0.2 | 0.8 | GO:0002225 | positive regulation of antimicrobial peptide production(GO:0002225) antimicrobial peptide production(GO:0002775) antibacterial peptide production(GO:0002778) regulation of antimicrobial peptide production(GO:0002784) regulation of antibacterial peptide production(GO:0002786) positive regulation of antibacterial peptide production(GO:0002803) |
| 0.2 | 1.8 | GO:0060746 | parental behavior(GO:0060746) |
| 0.1 | 9.9 | GO:0051965 | positive regulation of synapse assembly(GO:0051965) |
| 0.1 | 4.2 | GO:0060038 | cardiac muscle cell proliferation(GO:0060038) |
| 0.1 | 4.6 | GO:0006383 | transcription from RNA polymerase III promoter(GO:0006383) |
| 0.1 | 5.3 | GO:0060999 | positive regulation of dendritic spine development(GO:0060999) |
| 0.1 | 1.9 | GO:0001833 | inner cell mass cell proliferation(GO:0001833) |
| 0.1 | 0.9 | GO:0070131 | positive regulation of mitochondrial translation(GO:0070131) |
| 0.1 | 2.3 | GO:0045776 | negative regulation of blood pressure(GO:0045776) |
| 0.1 | 5.2 | GO:0071456 | cellular response to hypoxia(GO:0071456) |
| 0.0 | 1.0 | GO:0051482 | positive regulation of cytosolic calcium ion concentration involved in phospholipase C-activating G-protein coupled signaling pathway(GO:0051482) |
| 0.0 | 0.6 | GO:0045109 | intermediate filament organization(GO:0045109) |
| 0.0 | 2.2 | GO:0072332 | intrinsic apoptotic signaling pathway by p53 class mediator(GO:0072332) |
| 0.0 | 1.6 | GO:0022904 | respiratory electron transport chain(GO:0022904) |
| 0.0 | 0.6 | GO:0033280 | response to vitamin D(GO:0033280) |
| 0.0 | 1.0 | GO:0030512 | negative regulation of transforming growth factor beta receptor signaling pathway(GO:0030512) |
| 0.0 | 4.0 | GO:0042742 | defense response to bacterium(GO:0042742) |
| 0.0 | 1.6 | GO:0007218 | neuropeptide signaling pathway(GO:0007218) |
| 0.0 | 2.5 | GO:0030522 | intracellular receptor signaling pathway(GO:0030522) |
Gene overrepresentation in cellular component category:
| Log-likelihood per target | Total log-likelihood | Term | Description |
|---|---|---|---|
| 84.9 | 84.9 | GO:0034365 | discoidal high-density lipoprotein particle(GO:0034365) |
| 51.7 | 155.2 | GO:0044279 | other organism cell membrane(GO:0044218) other organism membrane(GO:0044279) |
| 43.0 | 301.0 | GO:0005579 | membrane attack complex(GO:0005579) |
| 32.8 | 393.9 | GO:0034362 | low-density lipoprotein particle(GO:0034362) |
| 22.7 | 136.0 | GO:0042567 | insulin-like growth factor ternary complex(GO:0042567) |
| 14.4 | 86.6 | GO:0030478 | actin cap(GO:0030478) |
| 12.0 | 83.7 | GO:0060205 | cytoplasmic membrane-bounded vesicle lumen(GO:0060205) |
| 10.3 | 82.2 | GO:0005577 | fibrinogen complex(GO:0005577) |
| 8.1 | 105.0 | GO:0046581 | intercellular canaliculus(GO:0046581) |
| 4.7 | 543.8 | GO:0072562 | blood microparticle(GO:0072562) |
| 4.0 | 28.3 | GO:1990357 | terminal web(GO:1990357) |
| 3.2 | 9.5 | GO:0005896 | interleukin-6 receptor complex(GO:0005896) ciliary neurotrophic factor receptor complex(GO:0070110) |
| 2.7 | 200.3 | GO:0005581 | collagen trimer(GO:0005581) |
| 1.8 | 9.1 | GO:0045098 | type III intermediate filament(GO:0045098) |
| 1.8 | 5.3 | GO:0045203 | intrinsic component of cell outer membrane(GO:0031230) integral component of cell outer membrane(GO:0045203) |
| 1.4 | 72.6 | GO:0042645 | nucleoid(GO:0009295) mitochondrial nucleoid(GO:0042645) |
| 1.3 | 13.3 | GO:0044294 | dendritic growth cone(GO:0044294) |
| 1.2 | 21.1 | GO:0042589 | zymogen granule membrane(GO:0042589) |
| 1.2 | 30.0 | GO:0045120 | pronucleus(GO:0045120) |
| 1.1 | 4.4 | GO:1990851 | Wnt-Frizzled-LRP5/6 complex(GO:1990851) |
| 0.9 | 68.8 | GO:0045095 | keratin filament(GO:0045095) |
| 0.8 | 3.3 | GO:0034274 | Atg12-Atg5-Atg16 complex(GO:0034274) |
| 0.8 | 4.9 | GO:0097209 | epidermal lamellar body(GO:0097209) |
| 0.8 | 89.5 | GO:0005791 | rough endoplasmic reticulum(GO:0005791) |
| 0.8 | 7.6 | GO:0044352 | pinosome(GO:0044352) macropinosome(GO:0044354) |
| 0.6 | 11.1 | GO:0042629 | mast cell granule(GO:0042629) |
| 0.6 | 762.2 | GO:0005615 | extracellular space(GO:0005615) |
| 0.5 | 26.7 | GO:0005902 | microvillus(GO:0005902) |
| 0.5 | 87.7 | GO:0005777 | peroxisome(GO:0005777) microbody(GO:0042579) |
| 0.5 | 41.4 | GO:0031225 | anchored component of membrane(GO:0031225) |
| 0.4 | 19.7 | GO:0010494 | cytoplasmic stress granule(GO:0010494) |
| 0.4 | 28.6 | GO:0031526 | brush border membrane(GO:0031526) |
| 0.3 | 3.6 | GO:0071564 | npBAF complex(GO:0071564) |
| 0.3 | 26.4 | GO:0045111 | intermediate filament cytoskeleton(GO:0045111) |
| 0.3 | 4.6 | GO:0005666 | DNA-directed RNA polymerase III complex(GO:0005666) |
| 0.3 | 5.5 | GO:0001533 | cornified envelope(GO:0001533) |
| 0.2 | 51.7 | GO:0016323 | basolateral plasma membrane(GO:0016323) |
| 0.2 | 9.2 | GO:0005604 | basement membrane(GO:0005604) |
| 0.2 | 28.1 | GO:0090575 | RNA polymerase II transcription factor complex(GO:0090575) |
| 0.2 | 6.4 | GO:0044798 | nuclear transcription factor complex(GO:0044798) |
| 0.2 | 142.6 | GO:0005789 | endoplasmic reticulum membrane(GO:0005789) |
| 0.2 | 6.0 | GO:0031201 | SNARE complex(GO:0031201) |
| 0.1 | 2.6 | GO:0043034 | costamere(GO:0043034) |
| 0.1 | 6.7 | GO:0005643 | nuclear pore(GO:0005643) |
| 0.1 | 10.4 | GO:0005923 | bicellular tight junction(GO:0005923) |
| 0.1 | 6.7 | GO:0005776 | autophagosome(GO:0005776) |
| 0.1 | 16.9 | GO:0005667 | transcription factor complex(GO:0005667) |
| 0.1 | 5.6 | GO:0048475 | membrane coat(GO:0030117) coated membrane(GO:0048475) |
| 0.1 | 1.9 | GO:0035861 | site of double-strand break(GO:0035861) |
| 0.0 | 4.2 | GO:0030658 | transport vesicle membrane(GO:0030658) |
| 0.0 | 1.9 | GO:0005901 | caveola(GO:0005901) |
| 0.0 | 1.1 | GO:1990391 | DNA repair complex(GO:1990391) |
| 0.0 | 20.7 | GO:0005887 | integral component of plasma membrane(GO:0005887) |
Gene overrepresentation in molecular function category:
| Log-likelihood per target | Total log-likelihood | Term | Description |
|---|---|---|---|
| 77.1 | 231.2 | GO:0004556 | alpha-amylase activity(GO:0004556) |
| 49.6 | 198.3 | GO:0030294 | receptor signaling protein tyrosine kinase inhibitor activity(GO:0030294) |
| 41.7 | 250.3 | GO:0035473 | lipase binding(GO:0035473) |
| 32.2 | 128.7 | GO:0003973 | (S)-2-hydroxy-acid oxidase activity(GO:0003973) |
| 28.3 | 84.9 | GO:0070653 | high-density lipoprotein particle receptor binding(GO:0070653) |
| 22.0 | 132.1 | GO:0005499 | vitamin D binding(GO:0005499) |
| 19.5 | 117.0 | GO:0008508 | bile acid:sodium symporter activity(GO:0008508) |
| 18.4 | 92.1 | GO:0019834 | phospholipase A2 inhibitor activity(GO:0019834) |
| 15.0 | 90.0 | GO:0016724 | ferroxidase activity(GO:0004322) oxidoreductase activity, oxidizing metal ions, oxygen as acceptor(GO:0016724) |
| 14.7 | 44.1 | GO:0070012 | oligopeptidase activity(GO:0070012) |
| 12.0 | 155.4 | GO:1990405 | protein antigen binding(GO:1990405) |
| 11.9 | 47.6 | GO:0005136 | interleukin-4 receptor binding(GO:0005136) |
| 10.1 | 30.4 | GO:1901375 | acetylcholine transmembrane transporter activity(GO:0005277) acetate ester transmembrane transporter activity(GO:1901375) |
| 7.2 | 72.0 | GO:0015125 | bile acid transmembrane transporter activity(GO:0015125) |
| 6.0 | 72.3 | GO:0016884 | carbon-nitrogen ligase activity, with glutamine as amido-N-donor(GO:0016884) |
| 5.9 | 53.1 | GO:0015232 | heme transporter activity(GO:0015232) |
| 5.7 | 114.6 | GO:0005537 | mannose binding(GO:0005537) |
| 5.4 | 64.6 | GO:0070008 | serine-type exopeptidase activity(GO:0070008) |
| 5.1 | 142.0 | GO:0008395 | steroid hydroxylase activity(GO:0008395) |
| 5.1 | 30.3 | GO:0004568 | chitinase activity(GO:0004568) |
| 4.6 | 64.4 | GO:0045236 | CXCR chemokine receptor binding(GO:0045236) |
| 3.8 | 105.1 | GO:0005520 | insulin-like growth factor binding(GO:0005520) |
| 3.7 | 11.1 | GO:0004918 | interleukin-8 receptor activity(GO:0004918) |
| 3.6 | 43.5 | GO:0001161 | intronic transcription regulatory region sequence-specific DNA binding(GO:0001161) |
| 3.6 | 36.1 | GO:0008429 | phosphatidylethanolamine binding(GO:0008429) |
| 3.2 | 375.5 | GO:0004867 | serine-type endopeptidase inhibitor activity(GO:0004867) |
| 3.2 | 9.5 | GO:0004924 | oncostatin-M receptor activity(GO:0004924) |
| 2.9 | 23.0 | GO:0008430 | selenium binding(GO:0008430) |
| 2.8 | 44.2 | GO:0017017 | MAP kinase tyrosine/serine/threonine phosphatase activity(GO:0017017) |
| 2.6 | 7.9 | GO:0005119 | smoothened binding(GO:0005119) |
| 2.5 | 7.6 | GO:0008476 | protein-tyrosine sulfotransferase activity(GO:0008476) |
| 2.4 | 23.8 | GO:0001846 | opsonin binding(GO:0001846) |
| 2.3 | 9.2 | GO:0070915 | lysophosphatidic acid receptor activity(GO:0070915) |
| 2.3 | 9.2 | GO:0030021 | extracellular matrix structural constituent conferring compression resistance(GO:0030021) structural constituent of tooth enamel(GO:0030345) |
| 2.1 | 237.5 | GO:0015171 | amino acid transmembrane transporter activity(GO:0015171) |
| 2.0 | 45.1 | GO:0008392 | arachidonic acid epoxygenase activity(GO:0008392) |
| 1.8 | 18.4 | GO:0102336 | fatty acid elongase activity(GO:0009922) 3-oxo-arachidoyl-CoA synthase activity(GO:0102336) 3-oxo-cerotoyl-CoA synthase activity(GO:0102337) 3-oxo-lignoceronyl-CoA synthase activity(GO:0102338) |
| 1.7 | 46.1 | GO:0004181 | metallocarboxypeptidase activity(GO:0004181) |
| 1.5 | 6.1 | GO:0031726 | CCR1 chemokine receptor binding(GO:0031726) |
| 1.5 | 15.1 | GO:0070700 | BMP receptor binding(GO:0070700) |
| 1.5 | 40.3 | GO:0042056 | chemoattractant activity(GO:0042056) |
| 1.5 | 30.8 | GO:0005159 | insulin-like growth factor receptor binding(GO:0005159) |
| 1.4 | 20.7 | GO:0001972 | retinoic acid binding(GO:0001972) |
| 1.3 | 6.5 | GO:0070892 | lipoteichoic acid receptor activity(GO:0070892) |
| 1.2 | 92.6 | GO:0017022 | myosin binding(GO:0017022) |
| 1.1 | 10.0 | GO:0005001 | transmembrane receptor protein tyrosine phosphatase activity(GO:0005001) transmembrane receptor protein phosphatase activity(GO:0019198) |
| 1.1 | 4.4 | GO:0071936 | coreceptor activity involved in Wnt signaling pathway(GO:0071936) |
| 1.1 | 5.3 | GO:0033188 | sphingomyelin synthase activity(GO:0033188) ceramide cholinephosphotransferase activity(GO:0047493) |
| 1.0 | 4.2 | GO:0016890 | site-specific endodeoxyribonuclease activity, specific for altered base(GO:0016890) |
| 1.0 | 4.9 | GO:0034191 | apolipoprotein A-I receptor binding(GO:0034191) |
| 1.0 | 62.9 | GO:0004879 | RNA polymerase II transcription factor activity, ligand-activated sequence-specific DNA binding(GO:0004879) transcription factor activity, direct ligand regulated sequence-specific DNA binding(GO:0098531) |
| 0.9 | 19.9 | GO:0004745 | retinol dehydrogenase activity(GO:0004745) |
| 0.9 | 18.9 | GO:0005229 | intracellular calcium activated chloride channel activity(GO:0005229) |
| 0.9 | 78.0 | GO:0051087 | chaperone binding(GO:0051087) |
| 0.8 | 6.7 | GO:0030957 | Tat protein binding(GO:0030957) |
| 0.8 | 3.3 | GO:0019776 | Atg8 ligase activity(GO:0019776) |
| 0.7 | 28.3 | GO:0008307 | structural constituent of muscle(GO:0008307) |
| 0.6 | 77.2 | GO:0004222 | metalloendopeptidase activity(GO:0004222) |
| 0.6 | 30.0 | GO:0001221 | transcription cofactor binding(GO:0001221) |
| 0.6 | 47.4 | GO:0003823 | antigen binding(GO:0003823) |
| 0.6 | 7.3 | GO:0097153 | cysteine-type endopeptidase activity involved in apoptotic process(GO:0097153) cysteine-type endopeptidase activity involved in execution phase of apoptosis(GO:0097200) |
| 0.5 | 16.5 | GO:0001106 | RNA polymerase II transcription corepressor activity(GO:0001106) |
| 0.5 | 5.3 | GO:0005004 | GPI-linked ephrin receptor activity(GO:0005004) |
| 0.5 | 24.6 | GO:0070888 | E-box binding(GO:0070888) |
| 0.5 | 143.4 | GO:0030246 | carbohydrate binding(GO:0030246) |
| 0.4 | 52.7 | GO:0008201 | heparin binding(GO:0008201) |
| 0.4 | 2.5 | GO:0043423 | 3-phosphoinositide-dependent protein kinase binding(GO:0043423) |
| 0.4 | 0.8 | GO:0031762 | follicle-stimulating hormone receptor binding(GO:0031762) |
| 0.4 | 2.4 | GO:0061578 | Lys63-specific deubiquitinase activity(GO:0061578) |
| 0.4 | 74.9 | GO:0004252 | serine-type endopeptidase activity(GO:0004252) |
| 0.4 | 1.5 | GO:0004719 | protein-L-isoaspartate (D-aspartate) O-methyltransferase activity(GO:0004719) |
| 0.4 | 8.3 | GO:0003950 | NAD+ ADP-ribosyltransferase activity(GO:0003950) |
| 0.3 | 9.8 | GO:0004693 | cyclin-dependent protein serine/threonine kinase activity(GO:0004693) |
| 0.3 | 2.2 | GO:0035375 | zymogen binding(GO:0035375) |
| 0.3 | 1.1 | GO:0000829 | inositol heptakisphosphate kinase activity(GO:0000829) |
| 0.3 | 2.5 | GO:0008140 | cAMP response element binding protein binding(GO:0008140) |
| 0.3 | 1.1 | GO:0004677 | DNA-dependent protein kinase activity(GO:0004677) |
| 0.2 | 9.1 | GO:0016763 | transferase activity, transferring pentosyl groups(GO:0016763) |
| 0.2 | 4.2 | GO:0055106 | ligase regulator activity(GO:0055103) ubiquitin-protein transferase regulator activity(GO:0055106) |
| 0.2 | 6.7 | GO:0008139 | nuclear localization sequence binding(GO:0008139) |
| 0.2 | 6.8 | GO:0016620 | oxidoreductase activity, acting on the aldehyde or oxo group of donors, NAD or NADP as acceptor(GO:0016620) |
| 0.1 | 0.4 | GO:0004809 | tRNA (guanine-N2-)-methyltransferase activity(GO:0004809) |
| 0.1 | 1.3 | GO:0097371 | MDM2/MDM4 family protein binding(GO:0097371) |
| 0.1 | 0.7 | GO:0004716 | receptor signaling protein tyrosine kinase activity(GO:0004716) |
| 0.1 | 0.4 | GO:0050309 | glucose-6-phosphatase activity(GO:0004346) sugar-terminal-phosphatase activity(GO:0050309) |
| 0.1 | 7.1 | GO:0004860 | protein kinase inhibitor activity(GO:0004860) |
| 0.1 | 3.8 | GO:0016860 | intramolecular oxidoreductase activity(GO:0016860) |
| 0.1 | 53.1 | GO:0005198 | structural molecule activity(GO:0005198) |
| 0.1 | 2.5 | GO:0001205 | transcriptional activator activity, RNA polymerase II distal enhancer sequence-specific binding(GO:0001205) |
| 0.1 | 1.1 | GO:0005388 | calcium-transporting ATPase activity(GO:0005388) |
| 0.0 | 0.6 | GO:0050431 | transforming growth factor beta binding(GO:0050431) |
| 0.0 | 7.0 | GO:0005179 | hormone activity(GO:0005179) |
| 0.0 | 50.3 | GO:0032403 | protein complex binding(GO:0032403) |
| 0.0 | 1.9 | GO:0005080 | protein kinase C binding(GO:0005080) |
| 0.0 | 0.6 | GO:0030676 | Rac guanyl-nucleotide exchange factor activity(GO:0030676) |
| 0.0 | 0.8 | GO:0070001 | aspartic-type endopeptidase activity(GO:0004190) aspartic-type peptidase activity(GO:0070001) |
| 0.0 | 2.0 | GO:0002039 | p53 binding(GO:0002039) |
| 0.0 | 1.7 | GO:0008565 | protein transporter activity(GO:0008565) |
Gene overrepresentation in curated gene sets: canonical pathways category:
| Log-likelihood per target | Total log-likelihood | Term | Description |
|---|---|---|---|
| 6.4 | 350.3 | PID HNF3A PATHWAY | FOXA1 transcription factor network |
| 5.7 | 275.1 | PID UPA UPAR PATHWAY | Urokinase-type plasminogen activator (uPA) and uPAR-mediated signaling |
| 3.4 | 181.1 | PID BMP PATHWAY | BMP receptor signaling |
| 3.2 | 158.4 | PID HNF3B PATHWAY | FOXA2 and FOXA3 transcription factor networks |
| 1.9 | 437.3 | NABA ECM REGULATORS | Genes encoding enzymes and their regulators involved in the remodeling of the extracellular matrix |
| 1.5 | 90.0 | PID HIF1 TFPATHWAY | HIF-1-alpha transcription factor network |
| 1.3 | 56.3 | PID SYNDECAN 1 PATHWAY | Syndecan-1-mediated signaling events |
| 1.3 | 191.0 | NABA ECM AFFILIATED | Genes encoding proteins affiliated structurally or functionally to extracellular matrix proteins |
| 1.2 | 44.2 | ST ERK1 ERK2 MAPK PATHWAY | ERK1/ERK2 MAPK Pathway |
| 1.1 | 30.8 | PID IGF1 PATHWAY | IGF1 pathway |
| 0.9 | 19.7 | PID RET PATHWAY | Signaling events regulated by Ret tyrosine kinase |
| 0.9 | 36.7 | PID P38 ALPHA BETA DOWNSTREAM PATHWAY | Signaling mediated by p38-alpha and p38-beta |
| 0.9 | 18.1 | PID INTEGRIN2 PATHWAY | Beta2 integrin cell surface interactions |
| 0.7 | 6.7 | PID SMAD2 3PATHWAY | Regulation of cytoplasmic and nuclear SMAD2/3 signaling |
| 0.5 | 20.9 | PID PS1 PATHWAY | Presenilin action in Notch and Wnt signaling |
| 0.5 | 106.6 | NABA ECM GLYCOPROTEINS | Genes encoding structural ECM glycoproteins |
| 0.5 | 8.7 | PID HEDGEHOG 2PATHWAY | Signaling events mediated by the Hedgehog family |
| 0.4 | 11.1 | PID IL8 CXCR1 PATHWAY | IL8- and CXCR1-mediated signaling events |
| 0.3 | 9.5 | PID IL27 PATHWAY | IL27-mediated signaling events |
| 0.3 | 15.1 | PID MET PATHWAY | Signaling events mediated by Hepatocyte Growth Factor Receptor (c-Met) |
| 0.2 | 12.2 | PID CASPASE PATHWAY | Caspase cascade in apoptosis |
| 0.2 | 5.3 | PID EPHA FWDPATHWAY | EPHA forward signaling |
| 0.1 | 6.6 | PID TAP63 PATHWAY | Validated transcriptional targets of TAp63 isoforms |
| 0.1 | 2.5 | PID INSULIN PATHWAY | Insulin Pathway |
| 0.1 | 2.5 | PID HES HEY PATHWAY | Notch-mediated HES/HEY network |
| 0.1 | 2.6 | PID AR PATHWAY | Coregulation of Androgen receptor activity |
| 0.1 | 1.1 | PID NFKAPPAB CANONICAL PATHWAY | Canonical NF-kappaB pathway |
| 0.0 | 0.7 | PID ANGIOPOIETIN RECEPTOR PATHWAY | Angiopoietin receptor Tie2-mediated signaling |
| 0.0 | 0.6 | PID RAC1 REG PATHWAY | Regulation of RAC1 activity |
Gene overrepresentation in curated gene sets: REACTOME pathways category:
| Log-likelihood per target | Total log-likelihood | Term | Description |
|---|---|---|---|
| 19.7 | 335.1 | REACTOME CHYLOMICRON MEDIATED LIPID TRANSPORT | Genes involved in Chylomicron-mediated lipid transport |
| 15.8 | 189.0 | REACTOME RECYCLING OF BILE ACIDS AND SALTS | Genes involved in Recycling of bile acids and salts |
| 12.4 | 260.6 | REACTOME REGULATION OF INSULIN LIKE GROWTH FACTOR IGF ACTIVITY BY INSULIN LIKE GROWTH FACTOR BINDING PROTEINS IGFBPS | Genes involved in Regulation of Insulin-like Growth Factor (IGF) Activity by Insulin-like Growth Factor Binding Proteins (IGFBPs) |
| 11.8 | 142.0 | REACTOME SYNTHESIS OF BILE ACIDS AND BILE SALTS VIA 7ALPHA HYDROXYCHOLESTEROL | Genes involved in Synthesis of bile acids and bile salts via 7alpha-hydroxycholesterol |
| 9.3 | 324.8 | REACTOME COMPLEMENT CASCADE | Genes involved in Complement cascade |
| 9.0 | 126.3 | REACTOME COMMON PATHWAY | Genes involved in Common Pathway |
| 8.4 | 158.8 | REACTOME INTRINSIC PATHWAY | Genes involved in Intrinsic Pathway |
| 6.0 | 234.9 | REACTOME AMINO ACID TRANSPORT ACROSS THE PLASMA MEMBRANE | Genes involved in Amino acid transport across the plasma membrane |
| 4.9 | 163.2 | REACTOME STEROID HORMONES | Genes involved in Steroid hormones |
| 3.4 | 30.4 | REACTOME ABACAVIR TRANSPORT AND METABOLISM | Genes involved in Abacavir transport and metabolism |
| 3.2 | 44.2 | REACTOME ERKS ARE INACTIVATED | Genes involved in ERKs are inactivated |
| 2.8 | 74.8 | REACTOME SMOOTH MUSCLE CONTRACTION | Genes involved in Smooth Muscle Contraction |
| 2.7 | 40.4 | REACTOME IL 7 SIGNALING | Genes involved in Interleukin-7 signaling |
| 2.6 | 74.5 | REACTOME METAL ION SLC TRANSPORTERS | Genes involved in Metal ion SLC transporters |
| 1.9 | 63.3 | REACTOME TIGHT JUNCTION INTERACTIONS | Genes involved in Tight junction interactions |
| 1.9 | 74.0 | REACTOME REGULATION OF BETA CELL DEVELOPMENT | Genes involved in Regulation of beta-cell development |
| 1.5 | 21.2 | REACTOME SYNTHESIS SECRETION AND DEACYLATION OF GHRELIN | Genes involved in Synthesis, Secretion, and Deacylation of Ghrelin |
| 1.1 | 28.6 | REACTOME SYNTHESIS OF PC | Genes involved in Synthesis of PC |
| 1.1 | 20.4 | REACTOME TIE2 SIGNALING | Genes involved in Tie2 Signaling |
| 1.0 | 201.0 | REACTOME METABOLISM OF AMINO ACIDS AND DERIVATIVES | Genes involved in Metabolism of amino acids and derivatives |
| 0.9 | 51.1 | REACTOME COLLAGEN FORMATION | Genes involved in Collagen formation |
| 0.8 | 9.5 | REACTOME IL 6 SIGNALING | Genes involved in Interleukin-6 signaling |
| 0.8 | 9.2 | REACTOME P2Y RECEPTORS | Genes involved in P2Y receptors |
| 0.8 | 9.1 | REACTOME PYRIMIDINE CATABOLISM | Genes involved in Pyrimidine catabolism |
| 0.7 | 12.9 | REACTOME SYNTHESIS OF VERY LONG CHAIN FATTY ACYL COAS | Genes involved in Synthesis of very long-chain fatty acyl-CoAs |
| 0.7 | 5.6 | REACTOME NEF MEDIATED DOWNREGULATION OF MHC CLASS I COMPLEX CELL SURFACE EXPRESSION | Genes involved in Nef mediated downregulation of MHC class I complex cell surface expression |
| 0.6 | 9.0 | REACTOME TERMINATION OF O GLYCAN BIOSYNTHESIS | Genes involved in Termination of O-glycan biosynthesis |
| 0.4 | 16.5 | REACTOME NOTCH1 INTRACELLULAR DOMAIN REGULATES TRANSCRIPTION | Genes involved in NOTCH1 Intracellular Domain Regulates Transcription |
| 0.4 | 12.2 | REACTOME CASPASE MEDIATED CLEAVAGE OF CYTOSKELETAL PROTEINS | Genes involved in Caspase-mediated cleavage of cytoskeletal proteins |
| 0.3 | 23.3 | REACTOME NUCLEAR RECEPTOR TRANSCRIPTION PATHWAY | Genes involved in Nuclear Receptor transcription pathway |
| 0.3 | 4.2 | REACTOME VITAMIN B5 PANTOTHENATE METABOLISM | Genes involved in Vitamin B5 (pantothenate) metabolism |
| 0.3 | 6.8 | REACTOME GABA SYNTHESIS RELEASE REUPTAKE AND DEGRADATION | Genes involved in GABA synthesis, release, reuptake and degradation |
| 0.3 | 4.9 | REACTOME ABCA TRANSPORTERS IN LIPID HOMEOSTASIS | Genes involved in ABCA transporters in lipid homeostasis |
| 0.2 | 6.5 | REACTOME ANTIGEN PROCESSING CROSS PRESENTATION | Genes involved in Antigen processing-Cross presentation |
| 0.2 | 4.6 | REACTOME RNA POL III CHAIN ELONGATION | Genes involved in RNA Polymerase III Chain Elongation |
| 0.2 | 2.2 | REACTOME IRAK1 RECRUITS IKK COMPLEX | Genes involved in IRAK1 recruits IKK complex |
| 0.2 | 1.1 | REACTOME P53 INDEPENDENT G1 S DNA DAMAGE CHECKPOINT | Genes involved in p53-Independent G1/S DNA damage checkpoint |
| 0.2 | 4.7 | REACTOME DEGRADATION OF THE EXTRACELLULAR MATRIX | Genes involved in Degradation of the extracellular matrix |
| 0.2 | 3.8 | REACTOME CYTOCHROME P450 ARRANGED BY SUBSTRATE TYPE | Genes involved in Cytochrome P450 - arranged by substrate type |
| 0.2 | 5.7 | REACTOME NEGATIVE REGULATORS OF RIG I MDA5 SIGNALING | Genes involved in Negative regulators of RIG-I/MDA5 signaling |
| 0.1 | 5.3 | REACTOME SPHINGOLIPID DE NOVO BIOSYNTHESIS | Genes involved in Sphingolipid de novo biosynthesis |
| 0.1 | 7.2 | REACTOME CHONDROITIN SULFATE DERMATAN SULFATE METABOLISM | Genes involved in Chondroitin sulfate/dermatan sulfate metabolism |
| 0.1 | 6.0 | REACTOME CHEMOKINE RECEPTORS BIND CHEMOKINES | Genes involved in Chemokine receptors bind chemokines |
| 0.1 | 6.7 | REACTOME ANTIVIRAL MECHANISM BY IFN STIMULATED GENES | Genes involved in Antiviral mechanism by IFN-stimulated genes |
| 0.1 | 7.9 | REACTOME CLASS B 2 SECRETIN FAMILY RECEPTORS | Genes involved in Class B/2 (Secretin family receptors) |
| 0.1 | 5.5 | REACTOME TRANSCRIPTIONAL REGULATION OF WHITE ADIPOCYTE DIFFERENTIATION | Genes involved in Transcriptional Regulation of White Adipocyte Differentiation |
| 0.1 | 0.8 | REACTOME THROMBIN SIGNALLING THROUGH PROTEINASE ACTIVATED RECEPTORS PARS | Genes involved in Thrombin signalling through proteinase activated receptors (PARs) |
| 0.0 | 2.1 | REACTOME MEIOTIC RECOMBINATION | Genes involved in Meiotic Recombination |
| 0.0 | 1.4 | REACTOME INTERFERON ALPHA BETA SIGNALING | Genes involved in Interferon alpha/beta signaling |
| 0.0 | 0.4 | REACTOME GLUCOSE TRANSPORT | Genes involved in Glucose transport |