Project
GSE53960: rat RNA-Seq transcriptomic Bodymap
Navigation
Downloads
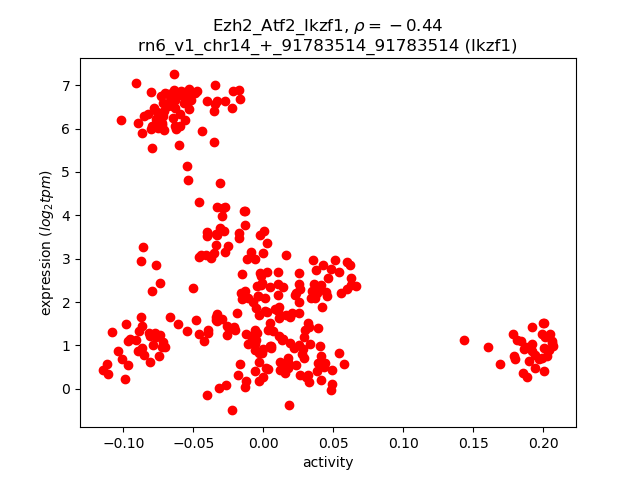
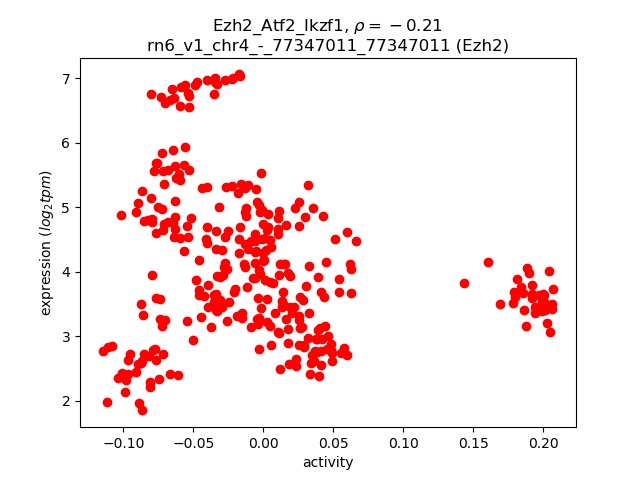
Results for Ezh2_Atf2_Ikzf1
Z-value: 1.77
Motif logo
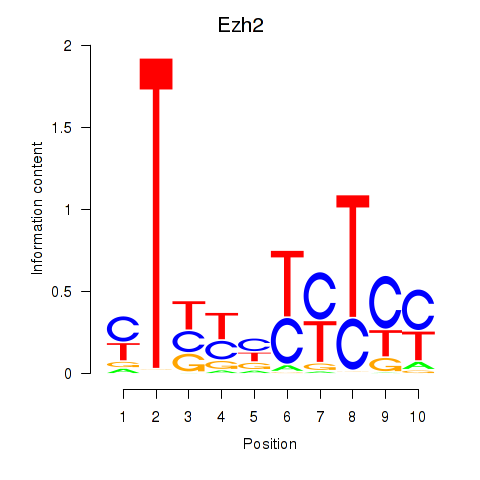
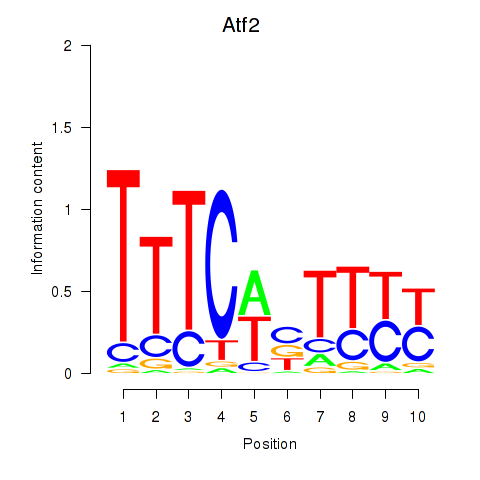
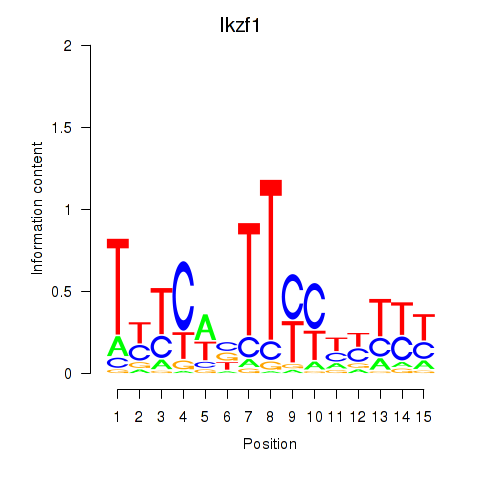
Transcription factors associated with Ezh2_Atf2_Ikzf1
| Gene Symbol | Gene ID | Gene Info |
|---|---|---|
|
Ezh2
|
ENSRNOG00000006048 | enhancer of zeste 2 polycomb repressive complex 2 subunit |
|
Atf2
|
ENSRNOG00000001597 | activating transcription factor 2 |
|
Ikzf1
|
ENSRNOG00000004444 | IKAROS family zinc finger 1 |
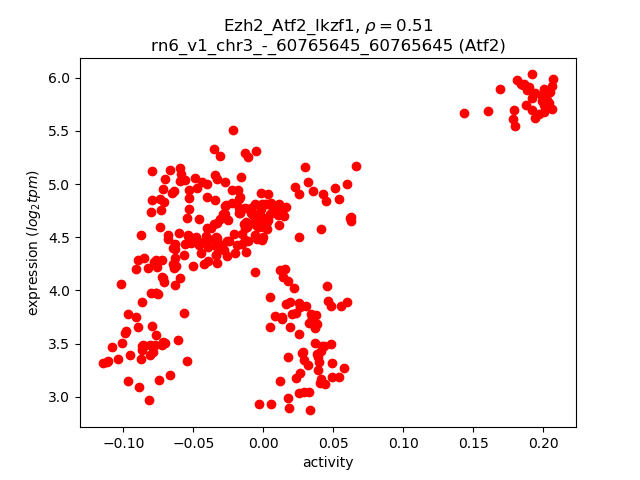
Activity-expression correlation:
| Gene | Promoter | Pearson corr. coef. | P-value | Plot |
|---|---|---|---|---|
| Atf2 | rn6_v1_chr3_-_60765645_60765645 | 0.51 | 3.7e-22 | Click! |
| Ikzf1 | rn6_v1_chr14_+_91783514_91783514 | -0.44 | 1.7e-16 | Click! |
| Ezh2 | rn6_v1_chr4_-_77347011_77347011 | -0.21 | 1.3e-04 | Click! |
Activity profile of Ezh2_Atf2_Ikzf1 motif
Sorted Z-values of Ezh2_Atf2_Ikzf1 motif
| Promoter | Log-likelihood | Transcript | Gene | Gene Info |
|---|---|---|---|---|
| chr15_-_110046687 | 98.23 |
ENSRNOT00000057404
ENSRNOT00000006624 ENSRNOT00000089695 |
Nalcn
|
sodium leak channel, non-selective |
| chr7_+_123510804 | 88.84 |
ENSRNOT00000010491
|
Sept3
|
septin 3 |
| chr15_+_33600102 | 85.70 |
ENSRNOT00000022664
|
Cmtm5
|
CKLF-like MARVEL transmembrane domain containing 5 |
| chr17_-_10766253 | 74.98 |
ENSRNOT00000000117
|
Cplx2
|
complexin 2 |
| chr4_+_175729726 | 70.82 |
ENSRNOT00000013230
|
Slco1c1
|
solute carrier organic anion transporter family, member 1c1 |
| chr3_-_44086006 | 69.53 |
ENSRNOT00000034449
ENSRNOT00000082604 |
Ermn
|
ermin |
| chr3_+_113318563 | 69.08 |
ENSRNOT00000089230
|
Ckmt1
|
creatine kinase, mitochondrial 1 |
| chr7_-_136853154 | 67.72 |
ENSRNOT00000087376
|
Nell2
|
neural EGFL like 2 |
| chr7_-_136853957 | 66.84 |
ENSRNOT00000008985
|
Nell2
|
neural EGFL like 2 |
| chr11_-_35098883 | 66.39 |
ENSRNOT00000079955
|
Kcnj6
|
potassium voltage-gated channel subfamily J member 6 |
| chr3_+_129599353 | 66.03 |
ENSRNOT00000008734
|
Snap25
|
synaptosomal-associated protein 25 |
| chr11_+_58624198 | 64.74 |
ENSRNOT00000002091
|
Gap43
|
growth associated protein 43 |
| chr1_+_234252757 | 63.96 |
ENSRNOT00000091814
|
Rorb
|
RAR-related orphan receptor B |
| chr10_+_42614713 | 62.85 |
ENSRNOT00000081136
ENSRNOT00000073148 |
Gria1
|
glutamate ionotropic receptor AMPA type subunit 1 |
| chrX_+_107496072 | 58.66 |
ENSRNOT00000003283
|
Plp1
|
proteolipid protein 1 |
| chr13_-_72367980 | 55.26 |
ENSRNOT00000003928
|
Cacna1e
|
calcium voltage-gated channel subunit alpha1 E |
| chr1_+_25174456 | 54.63 |
ENSRNOT00000092830
|
Clvs2
|
clavesin 2 |
| chr4_-_16669368 | 54.10 |
ENSRNOT00000007608
|
Pclo
|
piccolo (presynaptic cytomatrix protein) |
| chr4_+_22859622 | 53.76 |
ENSRNOT00000073501
ENSRNOT00000068410 |
Adam22
|
ADAM metallopeptidase domain 22 |
| chr10_+_42618487 | 52.81 |
ENSRNOT00000071615
|
Gria1
|
glutamate ionotropic receptor AMPA type subunit 1 |
| chr4_-_169999873 | 52.53 |
ENSRNOT00000011697
|
Grin2b
|
glutamate ionotropic receptor NMDA type subunit 2B |
| chr15_-_77736892 | 52.05 |
ENSRNOT00000057924
|
Pcdh9
|
protocadherin 9 |
| chr16_-_21089508 | 50.15 |
ENSRNOT00000072565
|
Hapln4
|
hyaluronan and proteoglycan link protein 4 |
| chr4_-_51844331 | 48.83 |
ENSRNOT00000003593
|
Gpr37
|
G protein-coupled receptor 37 |
| chr4_-_11497531 | 48.69 |
ENSRNOT00000078799
|
Magi2
|
membrane associated guanylate kinase, WW and PDZ domain containing 2 |
| chr3_+_51687809 | 48.03 |
ENSRNOT00000087242
|
Scn2a
|
sodium voltage-gated channel alpha subunit 2 |
| chr6_-_147172022 | 46.66 |
ENSRNOT00000080675
|
Itgb8
|
integrin subunit beta 8 |
| chr2_-_179704629 | 45.68 |
ENSRNOT00000083361
ENSRNOT00000077941 |
Gria2
|
glutamate ionotropic receptor AMPA type subunit 2 |
| chr9_+_60039297 | 44.53 |
ENSRNOT00000016262
|
Slc39a10
|
solute carrier family 39 member 10 |
| chr4_-_16654811 | 42.89 |
ENSRNOT00000008637
|
Pclo
|
piccolo (presynaptic cytomatrix protein) |
| chr17_-_58292624 | 42.76 |
ENSRNOT00000047512
|
Adarb2
|
adenosine deaminase, RNA-specific, B2 |
| chr7_-_44121130 | 42.31 |
ENSRNOT00000005706
|
Nts
|
neurotensin |
| chr2_-_187401786 | 41.97 |
ENSRNOT00000025624
|
Hapln2
|
hyaluronan and proteoglycan link protein 2 |
| chr9_+_82571269 | 40.95 |
ENSRNOT00000026941
|
Speg
|
SPEG complex locus |
| chr14_+_8080565 | 40.42 |
ENSRNOT00000092395
|
Mapk10
|
mitogen activated protein kinase 10 |
| chr9_+_82596355 | 39.43 |
ENSRNOT00000065076
|
Speg
|
SPEG complex locus |
| chr14_+_8080275 | 39.35 |
ENSRNOT00000065965
ENSRNOT00000092542 |
Mapk10
|
mitogen activated protein kinase 10 |
| chr12_-_10307265 | 39.20 |
ENSRNOT00000092627
|
Wasf3
|
WAS protein family, member 3 |
| chr7_-_125407806 | 38.57 |
ENSRNOT00000084666
|
RGD1566029
|
similar to mKIAA1644 protein |
| chr10_+_65586993 | 37.06 |
ENSRNOT00000086036
|
Aldoc
|
aldolase, fructose-bisphosphate C |
| chr2_+_69415057 | 36.93 |
ENSRNOT00000013152
|
Cdh10
|
cadherin 10 |
| chr18_-_18079560 | 36.73 |
ENSRNOT00000072093
|
AABR07031533.1
|
|
| chr3_+_113257688 | 35.45 |
ENSRNOT00000019320
|
Map1a
|
microtubule-associated protein 1A |
| chr18_-_67224566 | 35.09 |
ENSRNOT00000064947
|
Dcc
|
DCC netrin 1 receptor |
| chr7_-_50278842 | 34.24 |
ENSRNOT00000088950
|
Syt1
|
synaptotagmin 1 |
| chr3_+_35175313 | 34.15 |
ENSRNOT00000081744
|
Kif5c
|
kinesin family member 5C |
| chr3_-_64554953 | 33.95 |
ENSRNOT00000067452
|
LOC102553814
|
serine/arginine repetitive matrix protein 1-like |
| chr2_-_35104963 | 33.93 |
ENSRNOT00000018058
|
Rgs7bp
|
regulator of G-protein signaling 7-binding protein |
| chr6_-_114488880 | 33.88 |
ENSRNOT00000087560
|
AC118957.1
|
|
| chr18_+_30562178 | 33.79 |
ENSRNOT00000040998
|
LOC108348771
|
protocadherin beta-16-like |
| chrX_-_116792864 | 33.63 |
ENSRNOT00000090918
|
Amot
|
angiomotin |
| chrX_-_29648359 | 33.39 |
ENSRNOT00000086721
ENSRNOT00000006777 |
Gpm6b
|
glycoprotein m6b |
| chrX_-_116792707 | 32.67 |
ENSRNOT00000049482
|
Amot
|
angiomotin |
| chr11_+_36851038 | 32.44 |
ENSRNOT00000002221
ENSRNOT00000061047 |
Pcp4
|
Purkinje cell protein 4 |
| chrX_+_107323215 | 32.40 |
ENSRNOT00000071874
|
Tceal3
|
transcription elongation factor A like 3 |
| chrX_-_152642531 | 32.35 |
ENSRNOT00000085037
|
Gabra3
|
gamma-aminobutyric acid type A receptor alpha3 subunit |
| chr11_+_45888221 | 31.86 |
ENSRNOT00000071932
ENSRNOT00000066008 ENSRNOT00000060802 |
Lnp1
|
leukemia NUP98 fusion partner 1 |
| chr3_-_52664209 | 31.84 |
ENSRNOT00000065126
ENSRNOT00000079020 |
Scn9a
|
sodium voltage-gated channel alpha subunit 9 |
| chr1_-_5165859 | 31.75 |
ENSRNOT00000044325
ENSRNOT00000019319 |
Grm1
|
glutamate metabotropic receptor 1 |
| chr6_+_64789940 | 31.49 |
ENSRNOT00000085979
ENSRNOT00000059739 ENSRNOT00000051908 ENSRNOT00000082793 ENSRNOT00000078583 ENSRNOT00000091677 ENSRNOT00000093241 |
Nrcam
|
neuronal cell adhesion molecule |
| chr10_-_15928169 | 31.08 |
ENSRNOT00000028069
|
Nsg2
|
neuron specific gene family member 2 |
| chrX_-_142248369 | 31.04 |
ENSRNOT00000091330
|
Fgf13
|
fibroblast growth factor 13 |
| chr9_-_71852113 | 30.85 |
ENSRNOT00000083263
ENSRNOT00000072983 |
AABR07067896.1
|
|
| chr14_+_109533792 | 29.90 |
ENSRNOT00000067690
|
LOC108348154
|
ankyrin repeat domain-containing protein 29-like |
| chr1_-_225035687 | 29.75 |
ENSRNOT00000026539
|
Gng3
|
G protein subunit gamma 3 |
| chr10_-_56211891 | 29.66 |
ENSRNOT00000015076
|
Atp1b2
|
ATPase Na+/K+ transporting subunit beta 2 |
| chr13_-_88061108 | 29.07 |
ENSRNOT00000003774
|
Rgs4
|
regulator of G-protein signaling 4 |
| chr9_+_73433252 | 29.07 |
ENSRNOT00000092540
|
Map2
|
microtubule-associated protein 2 |
| chr5_-_79570073 | 28.40 |
ENSRNOT00000011845
|
Tnfsf15
|
tumor necrosis factor superfamily member 15 |
| chr7_-_50638798 | 28.39 |
ENSRNOT00000048880
|
Syt1
|
synaptotagmin 1 |
| chr9_+_73418607 | 28.34 |
ENSRNOT00000092547
|
Map2
|
microtubule-associated protein 2 |
| chr12_+_21767606 | 28.29 |
ENSRNOT00000059602
|
LOC103691013
|
neuronal tyrosine-phosphorylated phosphoinositide-3-kinase adapter 1-like |
| chr10_-_27179254 | 28.21 |
ENSRNOT00000004619
|
Gabrg2
|
gamma-aminobutyric acid type A receptor gamma 2 subunit |
| chr3_-_168018410 | 28.09 |
ENSRNOT00000087579
|
Bcas1
|
breast carcinoma amplified sequence 1 |
| chr1_+_101517714 | 27.87 |
ENSRNOT00000028423
|
Plekha4
|
pleckstrin homology domain containing A4 |
| chr3_-_113312127 | 26.26 |
ENSRNOT00000065285
|
Mfap1a
|
microfibrillar-associated protein 1A |
| chr14_-_39112600 | 25.97 |
ENSRNOT00000003170
|
Gabrb1
|
gamma-aminobutyric acid type A receptor beta 1 subunit |
| chr15_-_44860604 | 25.85 |
ENSRNOT00000018637
|
Nefm
|
neurofilament medium |
| chr13_+_57131395 | 25.77 |
ENSRNOT00000017884
|
Kcnt2
|
potassium sodium-activated channel subfamily T member 2 |
| chr3_-_176666282 | 25.60 |
ENSRNOT00000016947
|
Eef1a2
|
eukaryotic translation elongation factor 1 alpha 2 |
| chr7_+_6644643 | 25.07 |
ENSRNOT00000051670
|
Olr962
|
olfactory receptor 962 |
| chr17_-_72046381 | 24.94 |
ENSRNOT00000073919
|
AABR07028488.1
|
|
| chr3_-_168033457 | 24.36 |
ENSRNOT00000055111
|
Bcas1
|
breast carcinoma amplified sequence 1 |
| chr5_-_147303346 | 24.33 |
ENSRNOT00000009153
|
Hpca
|
hippocalcin |
| chr9_-_32019205 | 24.32 |
ENSRNOT00000016194
|
Adgrb3
|
adhesion G protein-coupled receptor B3 |
| chr9_+_118849302 | 24.20 |
ENSRNOT00000087592
|
Dlgap1
|
DLG associated protein 1 |
| chr17_+_60059949 | 24.03 |
ENSRNOT00000025458
|
Mpp7
|
membrane palmitoylated protein 7 |
| chrX_+_20351486 | 23.58 |
ENSRNOT00000093675
ENSRNOT00000047444 |
Wnk3
|
WNK lysine deficient protein kinase 3 |
| chr20_+_40769586 | 23.18 |
ENSRNOT00000001079
|
Fabp7
|
fatty acid binding protein 7 |
| chr2_-_95472115 | 23.06 |
ENSRNOT00000015720
|
Stmn2
|
stathmin 2 |
| chr17_+_81922329 | 22.69 |
ENSRNOT00000031542
|
Cacnb2
|
calcium voltage-gated channel auxiliary subunit beta 2 |
| chr10_-_82492918 | 22.62 |
ENSRNOT00000066895
|
LOC100364194
|
transmembrane protein 92-like |
| chr1_+_16478127 | 22.26 |
ENSRNOT00000019076
|
Ahi1
|
Abelson helper integration site 1 |
| chr3_+_51883559 | 22.22 |
ENSRNOT00000007197
|
Csrnp3
|
cysteine and serine rich nuclear protein 3 |
| chr18_-_5314511 | 22.08 |
ENSRNOT00000022637
ENSRNOT00000079682 |
Zfp521
|
zinc finger protein 521 |
| chr13_-_72063347 | 21.86 |
ENSRNOT00000090544
ENSRNOT00000003869 |
Cacna1e
|
calcium voltage-gated channel subunit alpha1 E |
| chr2_+_201289357 | 21.55 |
ENSRNOT00000067358
|
Tbx15
|
T-box 15 |
| chr16_-_10296341 | 21.33 |
ENSRNOT00000083990
|
Zfp488
|
zinc finger protein 488 |
| chr1_-_43638161 | 21.31 |
ENSRNOT00000024460
|
Ipcef1
|
interaction protein for cytohesin exchange factors 1 |
| chr4_+_108301129 | 21.26 |
ENSRNOT00000007993
|
LRRTM1
|
leucine rich repeat transmembrane neuronal 1 |
| chr15_-_76789298 | 21.21 |
ENSRNOT00000077853
|
AABR07018857.1
|
|
| chr13_+_46169963 | 20.85 |
ENSRNOT00000005212
|
Thsd7b
|
thrombospondin type 1 domain containing 7B |
| chr19_+_6046665 | 20.84 |
ENSRNOT00000084126
|
Cdh8
|
cadherin 8 |
| chr11_+_69484293 | 20.44 |
ENSRNOT00000049292
|
Kalrn
|
kalirin, RhoGEF kinase |
| chr6_+_101603319 | 20.31 |
ENSRNOT00000030470
|
Gphn
|
gephyrin |
| chr9_-_63641400 | 20.25 |
ENSRNOT00000087684
|
Satb2
|
SATB homeobox 2 |
| chr11_-_59110562 | 20.18 |
ENSRNOT00000047907
ENSRNOT00000042024 |
Lsamp
|
limbic system-associated membrane protein |
| chrX_+_136460215 | 20.09 |
ENSRNOT00000093538
|
Arhgap36
|
Rho GTPase activating protein 36 |
| chr4_-_150829741 | 20.01 |
ENSRNOT00000051846
ENSRNOT00000052017 |
Cacna1c
|
calcium voltage-gated channel subunit alpha1 C |
| chr18_+_30527705 | 20.00 |
ENSRNOT00000027168
|
Pcdhb14
|
protocadherin beta 14 |
| chr20_-_31956649 | 19.94 |
ENSRNOT00000072429
|
Hk1
|
hexokinase 1 |
| chr10_-_97582188 | 19.64 |
ENSRNOT00000005076
|
Rgs9
|
regulator of G-protein signaling 9 |
| chr8_-_98738446 | 19.61 |
ENSRNOT00000019860
|
Zic1
|
Zic family member 1 |
| chr5_-_130085838 | 19.60 |
ENSRNOT00000035252
|
Elavl4
|
ELAV like RNA binding protein 4 |
| chr3_-_176816114 | 19.60 |
ENSRNOT00000079262
ENSRNOT00000018697 |
Stmn3
|
stathmin 3 |
| chr4_+_138441332 | 19.37 |
ENSRNOT00000090847
|
Cntn4
|
contactin 4 |
| chr18_+_30474947 | 19.11 |
ENSRNOT00000027188
|
Pcdhb9
|
protocadherin beta 9 |
| chrX_+_62363953 | 19.07 |
ENSRNOT00000083362
|
Arx
|
aristaless related homeobox |
| chr2_+_247248407 | 18.89 |
ENSRNOT00000082287
|
Unc5c
|
unc-5 netrin receptor C |
| chr1_+_187149453 | 18.85 |
ENSRNOT00000082738
|
Xylt1
|
xylosyltransferase 1 |
| chr18_-_38088457 | 18.75 |
ENSRNOT00000077814
|
Jakmip2
|
janus kinase and microtubule interacting protein 2 |
| chr2_-_57935334 | 18.46 |
ENSRNOT00000022319
ENSRNOT00000085599 ENSRNOT00000077790 ENSRNOT00000035821 |
Slc1a3
|
solute carrier family 1 member 3 |
| chr7_-_129970550 | 18.40 |
ENSRNOT00000055879
|
Mlc1
|
megalencephalic leukoencephalopathy with subcortical cysts 1 |
| chr16_-_20097287 | 18.39 |
ENSRNOT00000025162
|
Unc13a
|
unc-13 homolog A |
| chr15_-_43542939 | 18.19 |
ENSRNOT00000012996
|
Dpysl2
|
dihydropyrimidinase-like 2 |
| chr14_-_3288017 | 18.15 |
ENSRNOT00000080452
|
LOC689986
|
hypothetical protein LOC689986 |
| chr2_+_18392142 | 18.14 |
ENSRNOT00000043196
|
Hapln1
|
hyaluronan and proteoglycan link protein 1 |
| chr1_+_128924966 | 18.03 |
ENSRNOT00000019267
|
Igf1r
|
insulin-like growth factor 1 receptor |
| chrX_+_6791136 | 17.86 |
ENSRNOT00000003984
|
LOC100909913
|
norrin-like |
| chr8_-_96985558 | 17.83 |
ENSRNOT00000018553
|
LOC501033
|
similar to UPF0258 protein KIAA1024 |
| chr5_-_168734296 | 17.76 |
ENSRNOT00000066120
|
Camta1
|
calmodulin binding transcription activator 1 |
| chr1_+_42169501 | 17.35 |
ENSRNOT00000025477
ENSRNOT00000092791 |
Vip
|
vasoactive intestinal peptide |
| chr2_+_36246628 | 17.30 |
ENSRNOT00000013618
|
Htr1a
|
5-hydroxytryptamine receptor 1A |
| chr15_-_88036354 | 17.23 |
ENSRNOT00000014747
|
Ednrb
|
endothelin receptor type B |
| chr1_-_13915594 | 17.20 |
ENSRNOT00000015927
|
Arfgef3
|
ARFGEF family member 3 |
| chr15_-_26175645 | 17.03 |
ENSRNOT00000020175
|
Slc35f4
|
solute carrier family 35, member F4 |
| chr16_-_6245644 | 16.92 |
ENSRNOT00000040759
|
Cacna1d
|
calcium voltage-gated channel subunit alpha1 D |
| chr7_+_130431213 | 16.91 |
ENSRNOT00000055792
|
Mapk8ip2
|
mitogen-activated protein kinase 8 interacting protein 2 |
| chr3_-_122206671 | 16.84 |
ENSRNOT00000037576
|
Pdyn
|
prodynorphin |
| chr8_+_45797315 | 16.80 |
ENSRNOT00000059997
|
AABR07070046.1
|
|
| chr1_-_89559960 | 16.70 |
ENSRNOT00000092133
|
Scn1b
|
sodium voltage-gated channel beta subunit 1 |
| chr16_-_36161089 | 16.40 |
ENSRNOT00000017888
|
Scrg1
|
stimulator of chondrogenesis 1 |
| chr3_-_159775643 | 16.11 |
ENSRNOT00000010939
|
Jph2
|
junctophilin 2 |
| chr5_-_158439078 | 16.03 |
ENSRNOT00000025517
|
Klhdc7a
|
kelch domain containing 7A |
| chr4_-_155275161 | 15.88 |
ENSRNOT00000032690
|
Rimklb
|
ribosomal modification protein rimK-like family member B |
| chr6_+_58467254 | 15.80 |
ENSRNOT00000065396
|
Etv1
|
ets variant 1 |
| chr4_-_11610518 | 15.72 |
ENSRNOT00000066643
|
Magi2
|
membrane associated guanylate kinase, WW and PDZ domain containing 2 |
| chrX_+_159165169 | 15.65 |
ENSRNOT00000087274
|
Fhl1
|
four and a half LIM domains 1 |
| chr18_+_52215682 | 15.64 |
ENSRNOT00000037901
|
Megf10
|
multiple EGF-like domains 10 |
| chr20_+_20105047 | 15.58 |
ENSRNOT00000082181
|
Ank3
|
ankyrin 3 |
| chr2_+_102685513 | 15.53 |
ENSRNOT00000033940
|
Bhlhe22
|
basic helix-loop-helix family, member e22 |
| chr20_+_5050327 | 15.41 |
ENSRNOT00000083353
|
Ddah2
|
dimethylarginine dimethylaminohydrolase 2 |
| chr3_+_139695028 | 15.24 |
ENSRNOT00000089098
|
Slc24a3
|
solute carrier family 24 member 3 |
| chr14_+_36047144 | 15.23 |
ENSRNOT00000003088
|
Lnx1
|
ligand of numb-protein X 1 |
| chr9_+_16862248 | 15.20 |
ENSRNOT00000080104
ENSRNOT00000024824 |
Ttbk1
|
tau tubulin kinase 1 |
| chr18_+_29966245 | 15.13 |
ENSRNOT00000074028
|
Pcdha4
|
protocadherin alpha 4 |
| chr7_+_139698148 | 14.88 |
ENSRNOT00000078579
|
Pfkm
|
phosphofructokinase, muscle |
| chrX_-_152641679 | 14.87 |
ENSRNOT00000080277
|
Gabra3
|
gamma-aminobutyric acid type A receptor alpha3 subunit |
| chr2_+_229196616 | 14.84 |
ENSRNOT00000012773
|
Ndst4
|
N-deacetylase and N-sulfotransferase 4 |
| chr9_-_30844199 | 14.80 |
ENSRNOT00000017169
|
Col19a1
|
collagen type XIX alpha 1 chain |
| chr10_+_54156649 | 14.77 |
ENSRNOT00000074718
|
Gas7
|
growth arrest specific 7 |
| chr15_+_33121273 | 14.65 |
ENSRNOT00000016020
|
Rem2
|
RRAD and GEM like GTPase 2 |
| chr14_-_13058172 | 14.50 |
ENSRNOT00000002746
ENSRNOT00000071706 |
Prdm8
|
PR/SET domain 8 |
| chr3_-_64543100 | 14.49 |
ENSRNOT00000025803
|
Zfp385b
|
zinc finger protein 385B |
| chr4_-_155563249 | 14.40 |
ENSRNOT00000011298
|
Slc2a3
|
solute carrier family 2 member 3 |
| chr8_-_62987182 | 14.36 |
ENSRNOT00000070885
|
Islr2
|
immunoglobulin superfamily containing leucine-rich repeat 2 |
| chr5_+_154077944 | 14.36 |
ENSRNOT00000031512
|
Il22ra1
|
interleukin 22 receptor subunit alpha 1 |
| chrX_-_104932508 | 14.32 |
ENSRNOT00000075325
|
Nox1
|
NADPH oxidase 1 |
| chr1_+_211423022 | 14.28 |
ENSRNOT00000029587
|
Dpysl4
|
dihydropyrimidinase-like 4 |
| chr15_-_62200837 | 14.27 |
ENSRNOT00000017599
|
Pcdh8
|
protocadherin 8 |
| chr15_+_33600337 | 14.26 |
ENSRNOT00000075965
|
Cmtm5
|
CKLF-like MARVEL transmembrane domain containing 5 |
| chr10_+_77537340 | 14.26 |
ENSRNOT00000003297
|
Tmem100
|
transmembrane protein 100 |
| chr18_+_30592794 | 14.23 |
ENSRNOT00000027133
|
Pcdhb22
|
protocadherin beta 22 |
| chr6_-_88917070 | 14.17 |
ENSRNOT00000000767
|
Mdga2
|
MAM domain containing glycosylphosphatidylinositol anchor 2 |
| chr2_+_262914327 | 14.14 |
ENSRNOT00000029312
|
Negr1
|
neuronal growth regulator 1 |
| chrX_-_82743753 | 14.09 |
ENSRNOT00000003512
|
Rps6ka6
|
ribosomal protein S6 kinase A6 |
| chr8_-_53899669 | 14.06 |
ENSRNOT00000082257
|
Ncam1
|
neural cell adhesion molecule 1 |
| chr15_+_58016238 | 14.03 |
ENSRNOT00000075786
|
Kctd4
|
potassium channel tetramerization domain containing 4 |
| chr3_+_113319456 | 13.87 |
ENSRNOT00000051354
|
Ckmt1
|
creatine kinase, mitochondrial 1 |
| chrX_+_62363757 | 13.87 |
ENSRNOT00000091240
|
Arx
|
aristaless related homeobox |
| chr14_+_114152472 | 13.78 |
ENSRNOT00000042965
|
Rtn4
|
reticulon 4 |
| chr17_-_52477575 | 13.78 |
ENSRNOT00000081290
|
Gli3
|
GLI family zinc finger 3 |
| chr8_+_7128656 | 13.66 |
ENSRNOT00000038313
|
Pgr
|
progesterone receptor |
| chr14_+_39661968 | 13.49 |
ENSRNOT00000064779
|
Gabra2
|
gamma-aminobutyric acid type A receptor alpha2 subunit |
| chr1_+_101682172 | 13.44 |
ENSRNOT00000028540
|
Car11
|
carbonic anhydrase 11 |
| chrX_-_15553720 | 13.44 |
ENSRNOT00000012646
|
Gripap1
|
GRIP1 associated protein 1 |
| chr5_-_6083083 | 13.39 |
ENSRNOT00000072411
|
Sulf1
|
sulfatase 1 |
| chr3_-_104502471 | 13.22 |
ENSRNOT00000040306
|
Ryr3
|
ryanodine receptor 3 |
| chr8_+_39848448 | 13.20 |
ENSRNOT00000012248
|
Hepacam
|
hepatocyte cell adhesion molecule |
| chr15_-_34550850 | 13.12 |
ENSRNOT00000027794
ENSRNOT00000090228 |
Cbln3
|
cerebellin 3 precursor |
| chr3_+_131351587 | 13.03 |
ENSRNOT00000010835
|
Btbd3
|
BTB domain containing 3 |
| chr2_-_173087648 | 13.03 |
ENSRNOT00000091079
|
Iqcj
|
IQ motif containing J |
| chr20_+_25990656 | 12.98 |
ENSRNOT00000081254
|
Lrrtm3
|
leucine rich repeat transmembrane neuronal 3 |
| chr1_+_168489077 | 12.93 |
ENSRNOT00000021191
|
Olr96
|
olfactory receptor 96 |
| chr5_-_137584608 | 12.90 |
ENSRNOT00000051470
|
LOC100911100
|
olfactory receptor 2A2-like |
| chr7_+_82338663 | 12.83 |
ENSRNOT00000006890
|
Emc2
|
ER membrane protein complex subunit 2 |
| chr1_+_42170583 | 12.78 |
ENSRNOT00000093104
|
Vip
|
vasoactive intestinal peptide |
| chr2_-_89498395 | 12.72 |
ENSRNOT00000068507
|
AABR07009224.1
|
|
| chr7_-_70480724 | 12.59 |
ENSRNOT00000090057
|
Dtx3
|
deltex E3 ubiquitin ligase 3 |
| chr17_-_63994169 | 12.52 |
ENSRNOT00000075651
|
Chrm3
|
cholinergic receptor, muscarinic 3 |
Network of associatons between targets according to the STRING database.

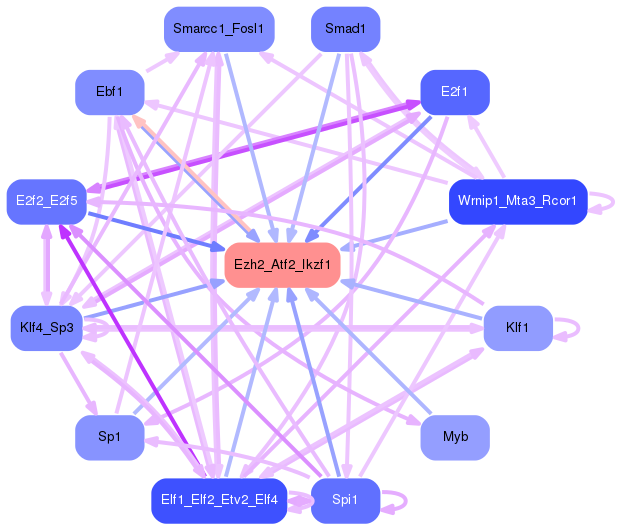
First level regulatory network of Ezh2_Atf2_Ikzf1
Gene Ontology Analysis
Gene overrepresentation in biological process category:
| Log-likelihood per target | Total log-likelihood | Term | Description |
|---|---|---|---|
| 24.0 | 168.2 | GO:0099566 | regulation of postsynaptic cytosolic calcium ion concentration(GO:0099566) |
| 22.1 | 66.3 | GO:0003365 | establishment of cell polarity involved in ameboidal cell migration(GO:0003365) |
| 22.0 | 66.0 | GO:1990926 | short-term synaptic potentiation(GO:1990926) |
| 18.1 | 108.3 | GO:0099526 | presynaptic signal transduction(GO:0098928) presynapse to nucleus signaling pathway(GO:0099526) |
| 14.2 | 56.8 | GO:1904009 | cellular response to monosodium glutamate(GO:1904009) |
| 12.7 | 89.2 | GO:0060075 | regulation of resting membrane potential(GO:0060075) |
| 11.2 | 134.6 | GO:0046543 | development of secondary female sexual characteristics(GO:0046543) |
| 9.6 | 9.6 | GO:0051643 | endoplasmic reticulum localization(GO:0051643) |
| 9.0 | 54.0 | GO:0033564 | anterior/posterior axon guidance(GO:0033564) |
| 8.6 | 25.9 | GO:0033693 | neurofilament bundle assembly(GO:0033693) |
| 8.5 | 34.2 | GO:0098961 | dendritic transport of ribonucleoprotein complex(GO:0098961) dendritic transport of messenger ribonucleoprotein complex(GO:0098963) anterograde dendritic transport of messenger ribonucleoprotein complex(GO:0098964) |
| 8.5 | 42.3 | GO:0097332 | response to antipsychotic drug(GO:0097332) |
| 8.4 | 92.3 | GO:0031915 | positive regulation of synaptic plasticity(GO:0031915) |
| 8.3 | 41.4 | GO:0051581 | negative regulation of neurotransmitter uptake(GO:0051581) regulation of serotonin uptake(GO:0051611) negative regulation of serotonin uptake(GO:0051612) |
| 8.1 | 64.4 | GO:0097118 | neuroligin clustering involved in postsynaptic membrane assembly(GO:0097118) |
| 8.0 | 31.8 | GO:0043179 | rhythmic excitation(GO:0043179) |
| 7.9 | 23.6 | GO:2000688 | positive regulation of rubidium ion transport(GO:2000682) positive regulation of rubidium ion transmembrane transporter activity(GO:2000688) |
| 7.7 | 84.2 | GO:0007258 | JUN phosphorylation(GO:0007258) |
| 7.6 | 22.7 | GO:1904879 | positive regulation of calcium ion transmembrane transport via high voltage-gated calcium channel(GO:1904879) |
| 7.5 | 60.3 | GO:0090273 | regulation of somatostatin secretion(GO:0090273) |
| 7.4 | 29.7 | GO:1903288 | positive regulation of potassium ion import(GO:1903288) |
| 7.4 | 51.8 | GO:0099645 | protein localization to postsynaptic specialization membrane(GO:0099633) neurotransmitter receptor localization to postsynaptic specialization membrane(GO:0099645) |
| 7.2 | 86.2 | GO:0046548 | retinal rod cell development(GO:0046548) |
| 6.9 | 48.0 | GO:0008627 | intrinsic apoptotic signaling pathway in response to osmotic stress(GO:0008627) |
| 6.7 | 13.4 | GO:1905244 | regulation of modification of synaptic structure(GO:1905244) |
| 6.7 | 67.0 | GO:0016198 | axon choice point recognition(GO:0016198) |
| 6.0 | 18.0 | GO:1903944 | regulation of hepatocyte apoptotic process(GO:1903943) negative regulation of hepatocyte apoptotic process(GO:1903944) |
| 5.8 | 23.3 | GO:0071896 | protein localization to adherens junction(GO:0071896) |
| 5.8 | 40.4 | GO:0031117 | positive regulation of microtubule depolymerization(GO:0031117) |
| 5.7 | 17.2 | GO:0014826 | vein smooth muscle contraction(GO:0014826) |
| 5.5 | 32.9 | GO:0021759 | globus pallidus development(GO:0021759) |
| 5.5 | 43.9 | GO:0008065 | establishment of blood-nerve barrier(GO:0008065) |
| 5.5 | 16.4 | GO:0097168 | mesenchymal stem cell proliferation(GO:0097168) |
| 5.4 | 32.7 | GO:0046813 | receptor-mediated virion attachment to host cell(GO:0046813) |
| 5.3 | 10.7 | GO:0060300 | regulation of cytokine activity(GO:0060300) |
| 5.0 | 20.0 | GO:0098912 | membrane depolarization during atrial cardiac muscle cell action potential(GO:0098912) |
| 5.0 | 29.8 | GO:0071313 | cellular response to caffeine(GO:0071313) |
| 4.9 | 44.5 | GO:0050861 | positive regulation of B cell receptor signaling pathway(GO:0050861) |
| 4.9 | 24.4 | GO:0061743 | motor learning(GO:0061743) |
| 4.8 | 14.3 | GO:0045726 | positive regulation of integrin biosynthetic process(GO:0045726) |
| 4.7 | 14.1 | GO:0001928 | regulation of exocyst assembly(GO:0001928) |
| 4.6 | 18.5 | GO:0043490 | malate-aspartate shuttle(GO:0043490) |
| 4.6 | 13.7 | GO:1904700 | granulosa cell apoptotic process(GO:1904700) regulation of granulosa cell apoptotic process(GO:1904708) |
| 4.5 | 62.6 | GO:0005513 | detection of calcium ion(GO:0005513) |
| 4.5 | 22.3 | GO:0060594 | mammary gland specification(GO:0060594) |
| 4.5 | 13.4 | GO:0014846 | esophagus smooth muscle contraction(GO:0014846) |
| 4.4 | 48.8 | GO:0045915 | positive regulation of catecholamine metabolic process(GO:0045915) positive regulation of dopamine metabolic process(GO:0045964) |
| 4.4 | 31.0 | GO:0045200 | establishment or maintenance of neuroblast polarity(GO:0045196) establishment of neuroblast polarity(GO:0045200) |
| 4.1 | 12.4 | GO:1902514 | regulation of calcium ion transmembrane transport via high voltage-gated calcium channel(GO:1902514) |
| 4.1 | 12.4 | GO:0060447 | intein-mediated protein splicing(GO:0016539) protein splicing(GO:0030908) bud outgrowth involved in lung branching(GO:0060447) positive regulation of epithelial cell proliferation involved in prostate gland development(GO:0060769) positive regulation of oligodendrocyte progenitor proliferation(GO:0070447) positive regulation of mesenchymal cell proliferation involved in ureter development(GO:2000729) |
| 4.1 | 32.9 | GO:0061193 | taste bud development(GO:0061193) |
| 4.0 | 24.2 | GO:0047484 | regulation of response to osmotic stress(GO:0047484) |
| 4.0 | 16.1 | GO:0060316 | positive regulation of ryanodine-sensitive calcium-release channel activity(GO:0060316) |
| 3.9 | 15.8 | GO:0086047 | membrane depolarization during Purkinje myocyte cell action potential(GO:0086047) |
| 3.9 | 43.2 | GO:0070327 | thyroid hormone transport(GO:0070327) |
| 3.9 | 54.8 | GO:0071420 | cellular response to histamine(GO:0071420) |
| 3.9 | 58.7 | GO:0042759 | long-chain fatty acid biosynthetic process(GO:0042759) |
| 3.9 | 15.6 | GO:1900827 | positive regulation of cell communication by electrical coupling(GO:0010650) positive regulation of membrane depolarization during cardiac muscle cell action potential(GO:1900827) |
| 3.8 | 11.4 | GO:0032972 | regulation of muscle filament sliding speed(GO:0032972) |
| 3.7 | 14.9 | GO:0061622 | glycolytic process through glucose-1-phosphate(GO:0061622) |
| 3.7 | 11.0 | GO:0042489 | negative regulation of odontogenesis of dentin-containing tooth(GO:0042489) |
| 3.5 | 21.3 | GO:0002091 | negative regulation of receptor internalization(GO:0002091) |
| 3.5 | 31.5 | GO:0045162 | clustering of voltage-gated sodium channels(GO:0045162) |
| 3.5 | 7.0 | GO:0061357 | positive regulation of Wnt protein secretion(GO:0061357) |
| 3.4 | 37.2 | GO:0071315 | cellular response to morphine(GO:0071315) |
| 3.3 | 30.1 | GO:0060406 | positive regulation of penile erection(GO:0060406) |
| 3.3 | 19.9 | GO:0072656 | maintenance of protein location in mitochondrion(GO:0072656) |
| 3.1 | 9.4 | GO:0097298 | regulation of nucleus size(GO:0097298) |
| 3.1 | 25.0 | GO:0070842 | aggresome assembly(GO:0070842) |
| 3.1 | 9.3 | GO:0071947 | protein deubiquitination involved in ubiquitin-dependent protein catabolic process(GO:0071947) protein K33-linked deubiquitination(GO:1990168) |
| 3.1 | 98.5 | GO:0007026 | negative regulation of microtubule depolymerization(GO:0007026) regulation of microtubule depolymerization(GO:0031114) |
| 3.1 | 9.2 | GO:0060066 | oviduct development(GO:0060066) |
| 3.0 | 9.1 | GO:0035860 | glial cell-derived neurotrophic factor receptor signaling pathway(GO:0035860) |
| 3.0 | 30.0 | GO:0021540 | corpus callosum morphogenesis(GO:0021540) |
| 3.0 | 17.8 | GO:0014816 | skeletal muscle satellite cell differentiation(GO:0014816) |
| 2.9 | 87.9 | GO:0045662 | negative regulation of myoblast differentiation(GO:0045662) |
| 2.9 | 8.8 | GO:0032053 | ciliary basal body organization(GO:0032053) |
| 2.9 | 14.3 | GO:0060842 | arterial endothelial cell differentiation(GO:0060842) |
| 2.7 | 8.2 | GO:0032423 | regulation of mismatch repair(GO:0032423) |
| 2.7 | 16.3 | GO:0035790 | platelet-derived growth factor receptor-alpha signaling pathway(GO:0035790) |
| 2.7 | 8.0 | GO:2000567 | memory T cell activation(GO:0035709) regulation of memory T cell activation(GO:2000567) positive regulation of memory T cell activation(GO:2000568) |
| 2.7 | 74.9 | GO:0007214 | gamma-aminobutyric acid signaling pathway(GO:0007214) |
| 2.7 | 8.0 | GO:0021678 | third ventricle development(GO:0021678) |
| 2.5 | 10.1 | GO:0001692 | histamine metabolic process(GO:0001692) |
| 2.5 | 15.0 | GO:0097039 | protein linear polyubiquitination(GO:0097039) |
| 2.5 | 55.0 | GO:0060992 | response to fungicide(GO:0060992) |
| 2.5 | 12.5 | GO:0007197 | adenylate cyclase-inhibiting G-protein coupled acetylcholine receptor signaling pathway(GO:0007197) phospholipase C-activating G-protein coupled acetylcholine receptor signaling pathway(GO:0007207) |
| 2.5 | 27.2 | GO:0021902 | commitment of neuronal cell to specific neuron type in forebrain(GO:0021902) |
| 2.5 | 24.7 | GO:0035021 | negative regulation of Rac protein signal transduction(GO:0035021) |
| 2.4 | 7.3 | GO:0006651 | diacylglycerol biosynthetic process(GO:0006651) |
| 2.4 | 16.9 | GO:0086046 | membrane depolarization during SA node cell action potential(GO:0086046) |
| 2.4 | 7.2 | GO:1902269 | positive regulation of polyamine transmembrane transport(GO:1902269) |
| 2.4 | 48.1 | GO:0032292 | myelination in peripheral nervous system(GO:0022011) peripheral nervous system axon ensheathment(GO:0032292) |
| 2.4 | 42.8 | GO:0001573 | ganglioside metabolic process(GO:0001573) |
| 2.4 | 4.7 | GO:0042539 | hypotonic salinity response(GO:0042539) cellular hypotonic salinity response(GO:0071477) |
| 2.3 | 13.8 | GO:0099525 | presynaptic dense core granule exocytosis(GO:0099525) |
| 2.3 | 13.8 | GO:0021553 | olfactory nerve development(GO:0021553) |
| 2.3 | 9.1 | GO:0072092 | ureteric bud invasion(GO:0072092) |
| 2.2 | 6.6 | GO:0031959 | mineralocorticoid receptor signaling pathway(GO:0031959) |
| 2.2 | 4.3 | GO:2000468 | regulation of peroxidase activity(GO:2000468) |
| 2.1 | 16.9 | GO:0046958 | nonassociative learning(GO:0046958) |
| 2.1 | 38.0 | GO:0031643 | positive regulation of myelination(GO:0031643) |
| 2.1 | 10.3 | GO:0030205 | dermatan sulfate metabolic process(GO:0030205) |
| 1.9 | 7.6 | GO:0097069 | cellular response to thyroxine stimulus(GO:0097069) |
| 1.8 | 9.1 | GO:0042264 | peptidyl-aspartic acid hydroxylation(GO:0042264) |
| 1.8 | 10.8 | GO:2000551 | regulation of T-helper 2 cell cytokine production(GO:2000551) |
| 1.8 | 3.6 | GO:1900126 | negative regulation of hyaluronan biosynthetic process(GO:1900126) |
| 1.8 | 28.4 | GO:0007250 | activation of NF-kappaB-inducing kinase activity(GO:0007250) |
| 1.7 | 17.4 | GO:0048934 | peripheral nervous system neuron differentiation(GO:0048934) peripheral nervous system neuron development(GO:0048935) |
| 1.7 | 6.9 | GO:0010157 | response to chlorate(GO:0010157) |
| 1.7 | 18.8 | GO:0030206 | chondroitin sulfate biosynthetic process(GO:0030206) |
| 1.7 | 6.8 | GO:1902951 | negative regulation of dendritic spine maintenance(GO:1902951) |
| 1.7 | 23.2 | GO:0060134 | prepulse inhibition(GO:0060134) |
| 1.6 | 3.3 | GO:2000017 | regulation of determination of dorsal identity(GO:2000015) positive regulation of determination of dorsal identity(GO:2000017) |
| 1.6 | 6.5 | GO:0001880 | Mullerian duct regression(GO:0001880) |
| 1.6 | 3.2 | GO:0045715 | negative regulation of low-density lipoprotein particle receptor biosynthetic process(GO:0045715) |
| 1.5 | 1.5 | GO:0050915 | sensory perception of sour taste(GO:0050915) |
| 1.5 | 6.1 | GO:0050955 | negative regulation of translational elongation(GO:0045900) thermoception(GO:0050955) |
| 1.5 | 18.2 | GO:0014049 | positive regulation of glutamate secretion(GO:0014049) |
| 1.5 | 11.9 | GO:0051388 | positive regulation of neurotrophin TRK receptor signaling pathway(GO:0051388) |
| 1.5 | 11.7 | GO:0060484 | lung-associated mesenchyme development(GO:0060484) |
| 1.5 | 26.3 | GO:0006020 | inositol metabolic process(GO:0006020) |
| 1.4 | 14.4 | GO:0070837 | dehydroascorbic acid transport(GO:0070837) |
| 1.4 | 11.5 | GO:0051386 | regulation of neurotrophin TRK receptor signaling pathway(GO:0051386) |
| 1.4 | 4.2 | GO:0042494 | detection of bacterial lipoprotein(GO:0042494) |
| 1.4 | 5.6 | GO:0003166 | bundle of His development(GO:0003166) |
| 1.4 | 15.4 | GO:0006527 | arginine catabolic process(GO:0006527) |
| 1.4 | 4.2 | GO:0015755 | fructose transport(GO:0015755) |
| 1.4 | 6.9 | GO:0034316 | negative regulation of Arp2/3 complex-mediated actin nucleation(GO:0034316) |
| 1.4 | 1.4 | GO:0034136 | negative regulation of toll-like receptor 2 signaling pathway(GO:0034136) |
| 1.3 | 5.3 | GO:2000698 | glomerular parietal epithelial cell differentiation(GO:0072139) positive regulation of epithelial cell differentiation involved in kidney development(GO:2000698) positive regulation of nephron tubule epithelial cell differentiation(GO:2000768) |
| 1.3 | 13.3 | GO:0048739 | cardiac muscle fiber development(GO:0048739) |
| 1.3 | 9.3 | GO:1902902 | negative regulation of autophagosome assembly(GO:1902902) |
| 1.3 | 6.4 | GO:0035063 | nuclear speck organization(GO:0035063) |
| 1.3 | 3.8 | GO:0098939 | dendritic transport of mitochondrion(GO:0098939) anterograde dendritic transport of mitochondrion(GO:0098972) |
| 1.3 | 5.0 | GO:0060244 | negative regulation of cell proliferation involved in contact inhibition(GO:0060244) |
| 1.2 | 3.7 | GO:0090247 | cell motility involved in somitogenic axis elongation(GO:0090247) regulation of cell motility involved in somitogenic axis elongation(GO:0090249) |
| 1.2 | 29.2 | GO:0032012 | regulation of ARF protein signal transduction(GO:0032012) |
| 1.2 | 7.3 | GO:1901898 | negative regulation of relaxation of cardiac muscle(GO:1901898) |
| 1.2 | 168.8 | GO:0007156 | homophilic cell adhesion via plasma membrane adhesion molecules(GO:0007156) |
| 1.2 | 2.4 | GO:0045105 | intermediate filament polymerization or depolymerization(GO:0045105) |
| 1.2 | 4.7 | GO:1903527 | positive regulation of membrane tubulation(GO:1903527) |
| 1.2 | 82.0 | GO:0055013 | cardiac muscle cell development(GO:0055013) |
| 1.2 | 3.5 | GO:0042335 | cuticle development(GO:0042335) |
| 1.1 | 12.5 | GO:0060012 | synaptic transmission, glycinergic(GO:0060012) |
| 1.1 | 21.3 | GO:0048714 | positive regulation of oligodendrocyte differentiation(GO:0048714) |
| 1.1 | 15.5 | GO:0006654 | phosphatidic acid biosynthetic process(GO:0006654) |
| 1.1 | 3.3 | GO:0019287 | isopentenyl diphosphate biosynthetic process, mevalonate pathway(GO:0019287) |
| 1.1 | 9.8 | GO:0070257 | positive regulation of mucus secretion(GO:0070257) |
| 1.1 | 4.3 | GO:1902856 | negative regulation of nonmotile primary cilium assembly(GO:1902856) |
| 1.1 | 12.8 | GO:0034975 | protein folding in endoplasmic reticulum(GO:0034975) |
| 1.1 | 9.6 | GO:0071688 | striated muscle myosin thick filament assembly(GO:0071688) |
| 1.0 | 3.1 | GO:0060762 | regulation of branching involved in mammary gland duct morphogenesis(GO:0060762) |
| 1.0 | 19.7 | GO:2000114 | regulation of establishment of cell polarity(GO:2000114) |
| 1.0 | 1.0 | GO:0044333 | Wnt signaling pathway involved in digestive tract morphogenesis(GO:0044333) |
| 1.0 | 6.8 | GO:0009838 | abscission(GO:0009838) |
| 1.0 | 20.2 | GO:0035641 | locomotory exploration behavior(GO:0035641) |
| 1.0 | 10.6 | GO:0097623 | potassium ion export across plasma membrane(GO:0097623) |
| 1.0 | 2.9 | GO:0016094 | polyprenol biosynthetic process(GO:0016094) |
| 0.9 | 2.8 | GO:1903070 | negative regulation of ER-associated ubiquitin-dependent protein catabolic process(GO:1903070) |
| 0.9 | 7.5 | GO:0051013 | microtubule severing(GO:0051013) |
| 0.9 | 4.6 | GO:0008078 | mesodermal cell migration(GO:0008078) establishment or maintenance of actin cytoskeleton polarity(GO:0030950) |
| 0.9 | 5.5 | GO:0042989 | sequestering of actin monomers(GO:0042989) |
| 0.9 | 9.1 | GO:0090331 | negative regulation of platelet aggregation(GO:0090331) |
| 0.9 | 4.5 | GO:0070125 | mitochondrial translational elongation(GO:0070125) |
| 0.9 | 8.0 | GO:0051255 | spindle midzone assembly(GO:0051255) |
| 0.9 | 4.4 | GO:0050957 | equilibrioception(GO:0050957) |
| 0.9 | 7.0 | GO:1902993 | positive regulation of beta-amyloid formation(GO:1902004) positive regulation of amyloid precursor protein catabolic process(GO:1902993) |
| 0.9 | 47.4 | GO:0007040 | lysosome organization(GO:0007040) lytic vacuole organization(GO:0080171) |
| 0.8 | 3.4 | GO:0046338 | phosphatidylethanolamine catabolic process(GO:0046338) |
| 0.8 | 73.5 | GO:0032091 | negative regulation of protein binding(GO:0032091) |
| 0.8 | 2.5 | GO:0007221 | positive regulation of transcription of Notch receptor target(GO:0007221) |
| 0.8 | 7.5 | GO:0051775 | response to redox state(GO:0051775) |
| 0.8 | 4.2 | GO:0009298 | GDP-mannose biosynthetic process(GO:0009298) |
| 0.8 | 4.9 | GO:1990928 | response to amino acid starvation(GO:1990928) |
| 0.8 | 5.7 | GO:0035735 | intraciliary transport involved in cilium morphogenesis(GO:0035735) |
| 0.8 | 4.8 | GO:0036438 | maintenance of lens transparency(GO:0036438) |
| 0.8 | 5.5 | GO:1903546 | protein localization to photoreceptor outer segment(GO:1903546) |
| 0.8 | 14.2 | GO:0021522 | spinal cord motor neuron differentiation(GO:0021522) |
| 0.8 | 29.1 | GO:0045744 | negative regulation of G-protein coupled receptor protein signaling pathway(GO:0045744) |
| 0.8 | 17.3 | GO:0051481 | negative regulation of cytosolic calcium ion concentration(GO:0051481) |
| 0.8 | 6.2 | GO:2000480 | negative regulation of cAMP-dependent protein kinase activity(GO:2000480) |
| 0.8 | 3.1 | GO:0009597 | detection of virus(GO:0009597) |
| 0.8 | 5.3 | GO:0060017 | parathyroid gland development(GO:0060017) |
| 0.8 | 25.6 | GO:0090218 | positive regulation of lipid kinase activity(GO:0090218) |
| 0.7 | 3.7 | GO:0000454 | snoRNA guided rRNA pseudouridine synthesis(GO:0000454) |
| 0.7 | 4.5 | GO:0071000 | response to magnetism(GO:0071000) |
| 0.7 | 11.9 | GO:0016048 | detection of temperature stimulus(GO:0016048) |
| 0.7 | 1.5 | GO:0032057 | negative regulation of translational initiation in response to stress(GO:0032057) |
| 0.7 | 11.9 | GO:0045793 | positive regulation of cell size(GO:0045793) |
| 0.7 | 8.0 | GO:0046929 | negative regulation of neurotransmitter secretion(GO:0046929) |
| 0.7 | 4.4 | GO:0010882 | regulation of cardiac muscle contraction by calcium ion signaling(GO:0010882) |
| 0.7 | 9.4 | GO:0035336 | long-chain fatty-acyl-CoA metabolic process(GO:0035336) |
| 0.7 | 3.6 | GO:1904179 | osteoblast fate commitment(GO:0002051) positive regulation of adipose tissue development(GO:1904179) |
| 0.7 | 5.7 | GO:1904424 | regulation of GTP binding(GO:1904424) |
| 0.7 | 3.5 | GO:0044860 | protein localization to plasma membrane raft(GO:0044860) protein transport into plasma membrane raft(GO:0044861) |
| 0.7 | 10.5 | GO:0021819 | layer formation in cerebral cortex(GO:0021819) |
| 0.7 | 1.4 | GO:0021827 | cerebral cortex tangential migration using cell-cell interactions(GO:0021823) postnatal olfactory bulb interneuron migration(GO:0021827) chemorepulsion involved in postnatal olfactory bulb interneuron migration(GO:0021836) negative regulation of smooth muscle cell chemotaxis(GO:0071672) |
| 0.7 | 10.3 | GO:0071801 | regulation of podosome assembly(GO:0071801) |
| 0.7 | 2.7 | GO:0051660 | establishment of centrosome localization(GO:0051660) |
| 0.7 | 5.3 | GO:0090261 | positive regulation of inclusion body assembly(GO:0090261) |
| 0.7 | 6.6 | GO:0051764 | actin crosslink formation(GO:0051764) |
| 0.7 | 2.6 | GO:1905049 | negative regulation of metallopeptidase activity(GO:1905049) |
| 0.7 | 3.9 | GO:0042045 | epithelial fluid transport(GO:0042045) |
| 0.6 | 5.2 | GO:0048743 | positive regulation of skeletal muscle fiber development(GO:0048743) |
| 0.6 | 19.6 | GO:0007628 | adult walking behavior(GO:0007628) walking behavior(GO:0090659) |
| 0.6 | 19.6 | GO:0007212 | dopamine receptor signaling pathway(GO:0007212) |
| 0.6 | 14.1 | GO:0045992 | negative regulation of embryonic development(GO:0045992) |
| 0.6 | 6.1 | GO:0036444 | calcium ion transmembrane import into mitochondrion(GO:0036444) |
| 0.6 | 4.1 | GO:0048664 | neuron fate determination(GO:0048664) |
| 0.6 | 4.0 | GO:0042148 | strand invasion(GO:0042148) |
| 0.6 | 5.0 | GO:0046855 | inositol phosphate dephosphorylation(GO:0046855) |
| 0.6 | 6.7 | GO:0089711 | L-glutamate transmembrane transport(GO:0089711) |
| 0.5 | 3.8 | GO:0006610 | ribosomal protein import into nucleus(GO:0006610) |
| 0.5 | 3.2 | GO:0097105 | presynaptic membrane assembly(GO:0097105) |
| 0.5 | 1.1 | GO:0007172 | signal complex assembly(GO:0007172) |
| 0.5 | 2.6 | GO:0060005 | vestibular reflex(GO:0060005) |
| 0.5 | 10.4 | GO:0010107 | potassium ion import(GO:0010107) |
| 0.5 | 18.8 | GO:0048747 | muscle fiber development(GO:0048747) |
| 0.5 | 13.4 | GO:0043268 | positive regulation of potassium ion transport(GO:0043268) |
| 0.5 | 45.4 | GO:0035308 | negative regulation of protein dephosphorylation(GO:0035308) |
| 0.5 | 19.6 | GO:0042220 | response to cocaine(GO:0042220) |
| 0.5 | 3.0 | GO:0050650 | chondroitin sulfate proteoglycan biosynthetic process(GO:0050650) |
| 0.5 | 4.9 | GO:0042761 | very long-chain fatty acid biosynthetic process(GO:0042761) |
| 0.5 | 1.4 | GO:0035262 | gonad morphogenesis(GO:0035262) |
| 0.5 | 10.9 | GO:0000289 | nuclear-transcribed mRNA poly(A) tail shortening(GO:0000289) |
| 0.5 | 1.9 | GO:0002378 | immunoglobulin biosynthetic process(GO:0002378) |
| 0.5 | 16.8 | GO:0048663 | neuron fate commitment(GO:0048663) |
| 0.5 | 1.4 | GO:0031989 | bombesin receptor signaling pathway(GO:0031989) |
| 0.5 | 22.7 | GO:0046928 | regulation of neurotransmitter secretion(GO:0046928) |
| 0.5 | 5.4 | GO:0051382 | kinetochore assembly(GO:0051382) |
| 0.4 | 0.9 | GO:0002481 | antigen processing and presentation of exogenous peptide antigen via MHC class Ib(GO:0002477) antigen processing and presentation of exogenous protein antigen via MHC class Ib, TAP-dependent(GO:0002481) |
| 0.4 | 6.8 | GO:0010669 | epithelial structure maintenance(GO:0010669) |
| 0.4 | 2.5 | GO:0016255 | attachment of GPI anchor to protein(GO:0016255) |
| 0.4 | 10.4 | GO:0017004 | cytochrome complex assembly(GO:0017004) |
| 0.4 | 8.7 | GO:0033169 | histone H3-K9 demethylation(GO:0033169) |
| 0.4 | 2.5 | GO:0031442 | positive regulation of mRNA 3'-end processing(GO:0031442) |
| 0.4 | 15.2 | GO:0050885 | neuromuscular process controlling balance(GO:0050885) |
| 0.4 | 1.2 | GO:0097084 | vascular smooth muscle cell development(GO:0097084) |
| 0.4 | 0.4 | GO:1903525 | regulation of membrane tubulation(GO:1903525) |
| 0.4 | 4.9 | GO:0006086 | acetyl-CoA biosynthetic process from pyruvate(GO:0006086) |
| 0.4 | 7.4 | GO:0008542 | visual learning(GO:0008542) |
| 0.4 | 3.7 | GO:0044804 | nucleophagy(GO:0044804) |
| 0.4 | 2.8 | GO:2000811 | negative regulation of anoikis(GO:2000811) |
| 0.3 | 2.7 | GO:0010668 | ectodermal cell differentiation(GO:0010668) |
| 0.3 | 1.0 | GO:0071031 | nuclear mRNA surveillance of mRNA 3'-end processing(GO:0071031) nuclear polyadenylation-dependent tRNA catabolic process(GO:0071038) nuclear retention of pre-mRNA with aberrant 3'-ends at the site of transcription(GO:0071049) |
| 0.3 | 1.6 | GO:0022007 | neural plate morphogenesis(GO:0001839) neural plate elongation(GO:0014022) convergent extension involved in neural plate elongation(GO:0022007) |
| 0.3 | 5.6 | GO:0090161 | Golgi ribbon formation(GO:0090161) |
| 0.3 | 5.1 | GO:0050774 | negative regulation of dendrite morphogenesis(GO:0050774) |
| 0.3 | 2.5 | GO:0016926 | protein desumoylation(GO:0016926) |
| 0.3 | 0.9 | GO:0000958 | mitochondrial mRNA catabolic process(GO:0000958) positive regulation of mitochondrial RNA catabolic process(GO:0000962) |
| 0.3 | 4.5 | GO:0071625 | vocalization behavior(GO:0071625) |
| 0.3 | 13.8 | GO:0032007 | negative regulation of TOR signaling(GO:0032007) |
| 0.3 | 1.5 | GO:0021903 | rostrocaudal neural tube patterning(GO:0021903) |
| 0.3 | 0.9 | GO:0019086 | late viral transcription(GO:0019086) |
| 0.3 | 3.2 | GO:0006390 | transcription from mitochondrial promoter(GO:0006390) |
| 0.3 | 1.3 | GO:0021936 | regulation of cerebellar granule cell precursor proliferation(GO:0021936) |
| 0.3 | 9.3 | GO:0021762 | substantia nigra development(GO:0021762) |
| 0.3 | 30.9 | GO:0097485 | neuron projection guidance(GO:0097485) |
| 0.3 | 9.0 | GO:0016239 | positive regulation of macroautophagy(GO:0016239) |
| 0.2 | 1.2 | GO:0090168 | Golgi reassembly(GO:0090168) |
| 0.2 | 1.4 | GO:0051418 | interphase microtubule nucleation by interphase microtubule organizing center(GO:0051415) microtubule nucleation by microtubule organizing center(GO:0051418) |
| 0.2 | 0.5 | GO:0032430 | positive regulation of phospholipase A2 activity(GO:0032430) |
| 0.2 | 1.6 | GO:0006824 | cobalt ion transport(GO:0006824) |
| 0.2 | 1.7 | GO:0009642 | response to light intensity(GO:0009642) |
| 0.2 | 0.4 | GO:0021626 | hindbrain maturation(GO:0021578) cerebellum maturation(GO:0021590) central nervous system maturation(GO:0021626) cerebellar cortex maturation(GO:0021699) |
| 0.2 | 1.1 | GO:0048254 | snoRNA localization(GO:0048254) |
| 0.2 | 3.2 | GO:0042574 | retinal metabolic process(GO:0042574) |
| 0.2 | 1.4 | GO:0010815 | bradykinin catabolic process(GO:0010815) |
| 0.2 | 0.4 | GO:2001106 | regulation of Rho guanyl-nucleotide exchange factor activity(GO:2001106) |
| 0.2 | 1.1 | GO:0051036 | regulation of endosome size(GO:0051036) |
| 0.2 | 5.8 | GO:0030199 | collagen fibril organization(GO:0030199) |
| 0.2 | 1.7 | GO:0035457 | cellular response to interferon-alpha(GO:0035457) |
| 0.2 | 2.3 | GO:0001502 | cartilage condensation(GO:0001502) |
| 0.2 | 2.7 | GO:0019236 | response to pheromone(GO:0019236) |
| 0.2 | 6.1 | GO:0090263 | positive regulation of canonical Wnt signaling pathway(GO:0090263) |
| 0.2 | 1.8 | GO:0006228 | UTP biosynthetic process(GO:0006228) |
| 0.2 | 8.1 | GO:0051290 | protein heterotetramerization(GO:0051290) |
| 0.2 | 5.1 | GO:0006270 | DNA replication initiation(GO:0006270) |
| 0.2 | 2.5 | GO:1901663 | ubiquinone biosynthetic process(GO:0006744) quinone biosynthetic process(GO:1901663) |
| 0.2 | 3.9 | GO:0000729 | DNA double-strand break processing(GO:0000729) |
| 0.1 | 0.3 | GO:1903054 | negative regulation of extracellular matrix organization(GO:1903054) |
| 0.1 | 3.0 | GO:0030239 | myofibril assembly(GO:0030239) |
| 0.1 | 1.3 | GO:0007000 | nucleolus organization(GO:0007000) |
| 0.1 | 1.9 | GO:0051601 | exocyst localization(GO:0051601) |
| 0.1 | 0.9 | GO:0019388 | galactose catabolic process(GO:0019388) |
| 0.1 | 4.4 | GO:0015991 | ATP hydrolysis coupled proton transport(GO:0015991) |
| 0.1 | 0.3 | GO:0002118 | aggressive behavior(GO:0002118) |
| 0.1 | 2.9 | GO:0030032 | lamellipodium assembly(GO:0030032) |
| 0.1 | 11.4 | GO:0007631 | feeding behavior(GO:0007631) |
| 0.1 | 4.4 | GO:0008277 | regulation of G-protein coupled receptor protein signaling pathway(GO:0008277) |
| 0.1 | 3.7 | GO:0031032 | actomyosin structure organization(GO:0031032) |
| 0.1 | 0.9 | GO:0061299 | retina vasculature morphogenesis in camera-type eye(GO:0061299) |
| 0.1 | 12.1 | GO:0050808 | synapse organization(GO:0050808) |
| 0.1 | 3.4 | GO:0032233 | positive regulation of actin filament bundle assembly(GO:0032233) |
| 0.1 | 1.6 | GO:0030150 | protein import into mitochondrial matrix(GO:0030150) |
| 0.1 | 3.0 | GO:0002446 | neutrophil mediated immunity(GO:0002446) |
| 0.1 | 20.8 | GO:0007015 | actin filament organization(GO:0007015) |
| 0.1 | 1.7 | GO:0050974 | detection of mechanical stimulus involved in sensory perception(GO:0050974) |
| 0.1 | 0.6 | GO:0032288 | myelin assembly(GO:0032288) |
| 0.1 | 0.9 | GO:2001014 | regulation of skeletal muscle cell differentiation(GO:2001014) |
| 0.1 | 0.4 | GO:0051001 | negative regulation of nitric-oxide synthase activity(GO:0051001) |
| 0.1 | 2.8 | GO:0046579 | positive regulation of Ras protein signal transduction(GO:0046579) |
| 0.1 | 0.3 | GO:0015838 | amino-acid betaine transport(GO:0015838) |
| 0.1 | 0.9 | GO:0040036 | regulation of fibroblast growth factor receptor signaling pathway(GO:0040036) |
| 0.1 | 1.2 | GO:0043982 | histone H4-K5 acetylation(GO:0043981) histone H4-K8 acetylation(GO:0043982) |
| 0.1 | 1.3 | GO:0006221 | pyrimidine nucleotide biosynthetic process(GO:0006221) |
| 0.1 | 2.7 | GO:1990090 | cellular response to nerve growth factor stimulus(GO:1990090) |
| 0.1 | 2.6 | GO:0000186 | activation of MAPKK activity(GO:0000186) |
| 0.1 | 6.8 | GO:0016358 | dendrite development(GO:0016358) |
| 0.1 | 0.5 | GO:0046085 | adenosine metabolic process(GO:0046085) |
| 0.1 | 0.9 | GO:0034587 | piRNA metabolic process(GO:0034587) |
| 0.0 | 7.3 | GO:0006813 | potassium ion transport(GO:0006813) |
| 0.0 | 0.9 | GO:0045292 | mRNA cis splicing, via spliceosome(GO:0045292) |
| 0.0 | 0.5 | GO:0036092 | phosphatidylinositol-3-phosphate biosynthetic process(GO:0036092) |
| 0.0 | 0.4 | GO:0000447 | endonucleolytic cleavage in ITS1 to separate SSU-rRNA from 5.8S rRNA and LSU-rRNA from tricistronic rRNA transcript (SSU-rRNA, 5.8S rRNA, LSU-rRNA)(GO:0000447) |
| 0.0 | 0.4 | GO:0043457 | regulation of cellular respiration(GO:0043457) |
| 0.0 | 0.4 | GO:0045879 | negative regulation of smoothened signaling pathway(GO:0045879) |
| 0.0 | 1.8 | GO:1902600 | hydrogen ion transmembrane transport(GO:1902600) |
| 0.0 | 1.0 | GO:0070286 | axonemal dynein complex assembly(GO:0070286) |
| 0.0 | 0.7 | GO:0045494 | photoreceptor cell maintenance(GO:0045494) |
| 0.0 | 0.5 | GO:0051770 | positive regulation of nitric-oxide synthase biosynthetic process(GO:0051770) |
| 0.0 | 0.4 | GO:0031424 | keratinization(GO:0031424) |
| 0.0 | 0.3 | GO:0042462 | eye photoreceptor cell development(GO:0042462) |
| 0.0 | 0.2 | GO:0046485 | ether lipid metabolic process(GO:0046485) |
| 0.0 | 0.9 | GO:0022900 | electron transport chain(GO:0022900) |
| 0.0 | 0.3 | GO:0030488 | tRNA methylation(GO:0030488) |
Gene overrepresentation in cellular component category:
| Log-likelihood per target | Total log-likelihood | Term | Description |
|---|---|---|---|
| 39.4 | 197.2 | GO:0099569 | presynaptic cytoskeleton(GO:0099569) |
| 23.5 | 141.0 | GO:0070033 | synaptobrevin 2-SNAP-25-syntaxin-1a-complexin II complex(GO:0070033) |
| 19.3 | 115.7 | GO:0044308 | axonal spine(GO:0044308) |
| 16.6 | 49.8 | GO:0034686 | integrin alphav-beta8 complex(GO:0034686) |
| 12.5 | 99.8 | GO:0032584 | growth cone membrane(GO:0032584) |
| 11.6 | 69.5 | GO:0033269 | internode region of axon(GO:0033269) |
| 10.9 | 109.3 | GO:0098839 | postsynaptic density membrane(GO:0098839) |
| 10.4 | 62.6 | GO:0042584 | chromaffin granule membrane(GO:0042584) |
| 8.5 | 25.6 | GO:0005853 | eukaryotic translation elongation factor 1 complex(GO:0005853) |
| 7.9 | 31.8 | GO:0038037 | G-protein coupled receptor dimeric complex(GO:0038037) G-protein coupled receptor complex(GO:0097648) |
| 6.4 | 64.4 | GO:0036056 | filtration diaphragm(GO:0036056) slit diaphragm(GO:0036057) |
| 6.4 | 57.4 | GO:0097442 | CA3 pyramidal cell dendrite(GO:0097442) |
| 6.0 | 24.0 | GO:0097025 | MPP7-DLG1-LIN7 complex(GO:0097025) |
| 5.0 | 115.7 | GO:1902711 | GABA receptor complex(GO:1902710) GABA-A receptor complex(GO:1902711) |
| 5.0 | 59.6 | GO:1990454 | L-type voltage-gated calcium channel complex(GO:1990454) |
| 5.0 | 14.9 | GO:0005945 | 6-phosphofructokinase complex(GO:0005945) |
| 4.8 | 96.6 | GO:0001518 | voltage-gated sodium channel complex(GO:0001518) |
| 4.6 | 18.4 | GO:0098831 | presynaptic active zone cytoplasmic component(GO:0098831) |
| 4.5 | 54.5 | GO:0043083 | synaptic cleft(GO:0043083) |
| 4.5 | 18.0 | GO:0035867 | alphav-beta3 integrin-IGF-1-IGF1R complex(GO:0035867) |
| 4.5 | 13.4 | GO:0098837 | postsynaptic recycling endosome(GO:0098837) |
| 4.4 | 39.8 | GO:0030314 | junctional membrane complex(GO:0030314) |
| 4.2 | 12.5 | GO:0098982 | glycine-gated chloride channel complex(GO:0016935) GABA-ergic synapse(GO:0098982) |
| 3.9 | 15.7 | GO:1990584 | cardiac Troponin complex(GO:1990584) |
| 3.9 | 27.2 | GO:0090571 | RNA polymerase II transcription repressor complex(GO:0090571) |
| 3.6 | 58.3 | GO:0005883 | neurofilament(GO:0005883) |
| 3.3 | 9.8 | GO:0090498 | extrinsic component of Golgi membrane(GO:0090498) |
| 3.0 | 15.0 | GO:0071797 | LUBAC complex(GO:0071797) |
| 3.0 | 32.5 | GO:0005890 | sodium:potassium-exchanging ATPase complex(GO:0005890) |
| 2.8 | 30.9 | GO:0044327 | dendritic spine head(GO:0044327) |
| 2.5 | 82.3 | GO:0005891 | voltage-gated calcium channel complex(GO:0005891) |
| 2.4 | 47.1 | GO:0043194 | axon initial segment(GO:0043194) |
| 2.3 | 34.2 | GO:0035253 | ciliary rootlet(GO:0035253) |
| 2.2 | 17.3 | GO:0043203 | axon hillock(GO:0043203) |
| 2.0 | 14.3 | GO:0071438 | invadopodium membrane(GO:0071438) |
| 2.0 | 73.3 | GO:0032809 | neuronal cell body membrane(GO:0032809) |
| 2.0 | 8.1 | GO:0097513 | myosin II filament(GO:0097513) |
| 2.0 | 371.3 | GO:0043204 | perikaryon(GO:0043204) |
| 2.0 | 13.8 | GO:0044305 | calyx of Held(GO:0044305) |
| 2.0 | 21.6 | GO:0001527 | microfibril(GO:0001527) fibril(GO:0043205) |
| 1.9 | 15.0 | GO:0005850 | eukaryotic translation initiation factor 2 complex(GO:0005850) |
| 1.8 | 16.5 | GO:0031209 | SCAR complex(GO:0031209) |
| 1.8 | 68.6 | GO:0008180 | COP9 signalosome(GO:0008180) |
| 1.7 | 17.1 | GO:0042788 | polysomal ribosome(GO:0042788) |
| 1.6 | 8.0 | GO:0032133 | chromosome passenger complex(GO:0032133) |
| 1.5 | 4.6 | GO:0005892 | acetylcholine-gated channel complex(GO:0005892) |
| 1.3 | 5.3 | GO:0071914 | prominosome(GO:0071914) |
| 1.3 | 14.4 | GO:0072546 | ER membrane protein complex(GO:0072546) |
| 1.3 | 6.5 | GO:0005927 | muscle tendon junction(GO:0005927) |
| 1.3 | 7.6 | GO:0044294 | dendritic growth cone(GO:0044294) |
| 1.2 | 20.4 | GO:0036038 | MKS complex(GO:0036038) |
| 1.1 | 27.4 | GO:0060077 | inhibitory synapse(GO:0060077) |
| 1.1 | 5.4 | GO:0033588 | Elongator holoenzyme complex(GO:0033588) |
| 1.1 | 43.9 | GO:0005834 | heterotrimeric G-protein complex(GO:0005834) |
| 1.0 | 12.5 | GO:0098984 | asymmetric synapse(GO:0032279) neuron to neuron synapse(GO:0098984) |
| 1.0 | 6.1 | GO:1990246 | uniplex complex(GO:1990246) |
| 1.0 | 4.0 | GO:0070876 | SOSS complex(GO:0070876) |
| 1.0 | 6.8 | GO:0090543 | Flemming body(GO:0090543) |
| 1.0 | 14.3 | GO:0042734 | presynaptic membrane(GO:0042734) |
| 0.9 | 69.4 | GO:0044291 | cell-cell contact zone(GO:0044291) |
| 0.9 | 10.6 | GO:0033180 | proton-transporting V-type ATPase, V1 domain(GO:0033180) |
| 0.9 | 9.6 | GO:0032982 | myosin filament(GO:0032982) |
| 0.9 | 5.1 | GO:1990316 | ATG1/ULK1 kinase complex(GO:1990316) |
| 0.8 | 22.9 | GO:0071782 | endoplasmic reticulum tubular network(GO:0071782) |
| 0.8 | 10.8 | GO:0032839 | dendrite cytoplasm(GO:0032839) |
| 0.8 | 23.0 | GO:0097228 | sperm principal piece(GO:0097228) |
| 0.8 | 7.1 | GO:0005742 | mitochondrial outer membrane translocase complex(GO:0005742) |
| 0.7 | 3.7 | GO:0090661 | box H/ACA telomerase RNP complex(GO:0090661) |
| 0.7 | 10.4 | GO:0030285 | integral component of synaptic vesicle membrane(GO:0030285) intrinsic component of synaptic vesicle membrane(GO:0098563) |
| 0.7 | 20.7 | GO:0043034 | costamere(GO:0043034) |
| 0.7 | 73.0 | GO:0030136 | clathrin-coated vesicle(GO:0030136) |
| 0.7 | 194.4 | GO:0060076 | excitatory synapse(GO:0060076) |
| 0.7 | 7.0 | GO:0034704 | calcium channel complex(GO:0034704) |
| 0.7 | 2.7 | GO:1990745 | GARP complex(GO:0000938) EARP complex(GO:1990745) |
| 0.7 | 79.5 | GO:0044306 | neuron projection terminus(GO:0044306) |
| 0.7 | 5.3 | GO:0031595 | nuclear proteasome complex(GO:0031595) |
| 0.7 | 3.3 | GO:0048179 | activin receptor complex(GO:0048179) |
| 0.6 | 1.9 | GO:0071006 | U2-type catalytic step 1 spliceosome(GO:0071006) |
| 0.6 | 10.6 | GO:0097038 | perinuclear endoplasmic reticulum(GO:0097038) |
| 0.6 | 6.1 | GO:1990124 | messenger ribonucleoprotein complex(GO:1990124) |
| 0.6 | 178.3 | GO:0030424 | axon(GO:0030424) |
| 0.6 | 24.5 | GO:0043197 | dendritic spine(GO:0043197) neuron spine(GO:0044309) |
| 0.6 | 5.8 | GO:0046581 | intercellular canaliculus(GO:0046581) |
| 0.5 | 1.6 | GO:1990923 | PET complex(GO:1990923) |
| 0.5 | 4.2 | GO:0016589 | NURF complex(GO:0016589) |
| 0.5 | 31.6 | GO:0008076 | voltage-gated potassium channel complex(GO:0008076) |
| 0.5 | 8.3 | GO:0031430 | M band(GO:0031430) |
| 0.5 | 4.9 | GO:0045254 | pyruvate dehydrogenase complex(GO:0045254) |
| 0.5 | 1.9 | GO:0098592 | cytoplasmic side of apical plasma membrane(GO:0098592) |
| 0.5 | 12.3 | GO:0002080 | acrosomal membrane(GO:0002080) |
| 0.5 | 1.4 | GO:0008274 | gamma-tubulin large complex(GO:0000931) gamma-tubulin ring complex(GO:0008274) |
| 0.5 | 44.1 | GO:0031225 | anchored component of membrane(GO:0031225) |
| 0.5 | 0.9 | GO:0045025 | mitochondrial degradosome(GO:0045025) |
| 0.4 | 6.6 | GO:0035102 | PRC1 complex(GO:0035102) |
| 0.4 | 11.1 | GO:0046540 | U4/U6 x U5 tri-snRNP complex(GO:0046540) |
| 0.4 | 30.8 | GO:0000118 | histone deacetylase complex(GO:0000118) |
| 0.4 | 2.5 | GO:0042765 | GPI-anchor transamidase complex(GO:0042765) |
| 0.4 | 47.9 | GO:0005795 | Golgi stack(GO:0005795) |
| 0.4 | 3.2 | GO:0005610 | laminin-5 complex(GO:0005610) |
| 0.4 | 13.2 | GO:0032391 | photoreceptor connecting cilium(GO:0032391) |
| 0.4 | 3.6 | GO:0030131 | clathrin adaptor complex(GO:0030131) filopodium tip(GO:0032433) |
| 0.4 | 0.4 | GO:0030478 | actin cap(GO:0030478) |
| 0.4 | 2.3 | GO:0005726 | perichromatin fibrils(GO:0005726) |
| 0.4 | 22.2 | GO:0030018 | Z disc(GO:0030018) |
| 0.4 | 4.5 | GO:0005583 | fibrillar collagen trimer(GO:0005583) banded collagen fibril(GO:0098643) |
| 0.4 | 11.2 | GO:0002102 | podosome(GO:0002102) |
| 0.4 | 26.1 | GO:0031463 | Cul3-RING ubiquitin ligase complex(GO:0031463) |
| 0.4 | 10.4 | GO:0030315 | T-tubule(GO:0030315) |
| 0.4 | 2.5 | GO:0016593 | Cdc73/Paf1 complex(GO:0016593) |
| 0.3 | 16.7 | GO:0045171 | intercellular bridge(GO:0045171) |
| 0.3 | 15.6 | GO:0016592 | mediator complex(GO:0016592) |
| 0.3 | 0.9 | GO:0032398 | MHC class Ib protein complex(GO:0032398) |
| 0.3 | 33.4 | GO:0030027 | lamellipodium(GO:0030027) |
| 0.3 | 5.5 | GO:0001917 | photoreceptor inner segment(GO:0001917) |
| 0.3 | 37.0 | GO:0043209 | myelin sheath(GO:0043209) |
| 0.3 | 14.4 | GO:0005884 | actin filament(GO:0005884) |
| 0.3 | 4.1 | GO:0031588 | nucleotide-activated protein kinase complex(GO:0031588) |
| 0.3 | 2.8 | GO:0000164 | protein phosphatase type 1 complex(GO:0000164) |
| 0.2 | 4.0 | GO:0030663 | COPI-coated vesicle membrane(GO:0030663) |
| 0.2 | 11.2 | GO:0045211 | postsynaptic membrane(GO:0045211) |
| 0.2 | 3.7 | GO:0000407 | pre-autophagosomal structure(GO:0000407) |
| 0.2 | 44.8 | GO:0043025 | neuronal cell body(GO:0043025) |
| 0.2 | 1.5 | GO:0070449 | elongin complex(GO:0070449) |
| 0.2 | 9.5 | GO:0005881 | cytoplasmic microtubule(GO:0005881) |
| 0.2 | 2.0 | GO:0070652 | HAUS complex(GO:0070652) |
| 0.2 | 3.7 | GO:0000159 | protein phosphatase type 2A complex(GO:0000159) |
| 0.2 | 1.1 | GO:0070761 | pre-snoRNP complex(GO:0070761) |
| 0.2 | 33.4 | GO:0000151 | ubiquitin ligase complex(GO:0000151) |
| 0.2 | 0.6 | GO:0032593 | insulin-responsive compartment(GO:0032593) |
| 0.2 | 13.0 | GO:0005814 | centriole(GO:0005814) |
| 0.1 | 16.8 | GO:0001650 | fibrillar center(GO:0001650) |
| 0.1 | 7.0 | GO:0005762 | organellar large ribosomal subunit(GO:0000315) mitochondrial large ribosomal subunit(GO:0005762) |
| 0.1 | 1.0 | GO:0000177 | cytoplasmic exosome (RNase complex)(GO:0000177) |
| 0.1 | 0.9 | GO:0008024 | cyclin/CDK positive transcription elongation factor complex(GO:0008024) |
| 0.1 | 0.8 | GO:0005750 | mitochondrial respiratory chain complex III(GO:0005750) |
| 0.1 | 2.8 | GO:0005763 | organellar small ribosomal subunit(GO:0000314) mitochondrial small ribosomal subunit(GO:0005763) |
| 0.1 | 1.3 | GO:0034709 | methylosome(GO:0034709) |
| 0.1 | 2.4 | GO:0005839 | proteasome core complex(GO:0005839) |
| 0.1 | 1.3 | GO:0070971 | endoplasmic reticulum exit site(GO:0070971) |
| 0.1 | 7.6 | GO:0005923 | bicellular tight junction(GO:0005923) |
| 0.1 | 2.7 | GO:0031519 | PcG protein complex(GO:0031519) |
| 0.1 | 1.0 | GO:0045277 | respiratory chain complex IV(GO:0045277) |
| 0.1 | 2.6 | GO:0005747 | mitochondrial respiratory chain complex I(GO:0005747) NADH dehydrogenase complex(GO:0030964) respiratory chain complex I(GO:0045271) |
| 0.1 | 1.2 | GO:0044665 | MLL1/2 complex(GO:0044665) MLL1 complex(GO:0071339) |
| 0.0 | 0.4 | GO:0031314 | extrinsic component of mitochondrial inner membrane(GO:0031314) |
| 0.0 | 0.8 | GO:0005721 | pericentric heterochromatin(GO:0005721) |
| 0.0 | 0.5 | GO:0005942 | phosphatidylinositol 3-kinase complex(GO:0005942) |
| 0.0 | 2.5 | GO:0000794 | condensed nuclear chromosome(GO:0000794) |
| 0.0 | 0.3 | GO:0016459 | myosin complex(GO:0016459) |
| 0.0 | 1.0 | GO:0031252 | cell leading edge(GO:0031252) |
Gene overrepresentation in molecular function category:
| Log-likelihood per target | Total log-likelihood | Term | Description |
|---|---|---|---|
| 42.0 | 168.2 | GO:0099583 | neurotransmitter receptor activity involved in regulation of postsynaptic cytosolic calcium ion concentration(GO:0099583) |
| 18.3 | 55.0 | GO:0004971 | AMPA glutamate receptor activity(GO:0004971) |
| 16.2 | 64.7 | GO:0035727 | lysophosphatidic acid binding(GO:0035727) |
| 16.1 | 64.4 | GO:0070699 | type II activin receptor binding(GO:0070699) |
| 15.4 | 77.1 | GO:0008332 | low voltage-gated calcium channel activity(GO:0008332) |
| 13.3 | 66.4 | GO:0015467 | G-protein activated inward rectifier potassium channel activity(GO:0015467) |
| 13.3 | 66.3 | GO:0043532 | angiostatin binding(GO:0043532) |
| 12.8 | 64.0 | GO:0008502 | melatonin receptor activity(GO:0008502) |
| 12.5 | 62.6 | GO:0030348 | syntaxin-3 binding(GO:0030348) |
| 12.3 | 98.2 | GO:0022842 | leak channel activity(GO:0022840) narrow pore channel activity(GO:0022842) |
| 10.8 | 54.0 | GO:0005042 | netrin receptor activity(GO:0005042) |
| 10.7 | 42.7 | GO:0086056 | voltage-gated calcium channel activity involved in AV node cell action potential(GO:0086056) |
| 10.3 | 71.8 | GO:0004111 | creatine kinase activity(GO:0004111) |
| 8.8 | 26.3 | GO:0000827 | inositol-1,3,4,5,6-pentakisphosphate kinase activity(GO:0000827) |
| 8.4 | 84.2 | GO:0016909 | JUN kinase activity(GO:0004705) SAP kinase activity(GO:0016909) |
| 6.3 | 18.8 | GO:0030158 | protein xylosyltransferase activity(GO:0030158) |
| 6.2 | 49.8 | GO:1990430 | extracellular matrix protein binding(GO:1990430) |
| 6.0 | 181.1 | GO:0017075 | syntaxin-1 binding(GO:0017075) |
| 5.4 | 43.2 | GO:0015349 | thyroid hormone transmembrane transporter activity(GO:0015349) |
| 5.3 | 15.9 | GO:0072590 | N-acetyl-L-aspartate-L-glutamate ligase activity(GO:0072590) |
| 5.1 | 15.4 | GO:0016403 | dimethylargininase activity(GO:0016403) |
| 5.1 | 20.3 | GO:0008940 | nitrate reductase activity(GO:0008940) |
| 5.0 | 89.7 | GO:0005522 | profilin binding(GO:0005522) |
| 4.9 | 39.5 | GO:0022851 | GABA-gated chloride ion channel activity(GO:0022851) |
| 4.9 | 58.7 | GO:0019911 | structural constituent of myelin sheath(GO:0019911) |
| 4.8 | 14.4 | GO:0033222 | xylose binding(GO:0033222) |
| 4.8 | 14.4 | GO:0042015 | interleukin-20 binding(GO:0042015) |
| 4.2 | 76.3 | GO:0004890 | GABA-A receptor activity(GO:0004890) |
| 4.2 | 16.9 | GO:0086059 | voltage-gated calcium channel activity involved SA node cell action potential(GO:0086059) |
| 4.2 | 12.5 | GO:0022852 | glycine-gated chloride ion channel activity(GO:0022852) |
| 4.1 | 32.9 | GO:0005169 | neurotrophin TRKB receptor binding(GO:0005169) |
| 3.9 | 110.3 | GO:0005540 | hyaluronic acid binding(GO:0005540) |
| 3.9 | 15.7 | GO:0030172 | troponin C binding(GO:0030172) |
| 3.7 | 14.9 | GO:0003872 | 6-phosphofructokinase activity(GO:0003872) |
| 3.7 | 18.5 | GO:0005314 | high-affinity glutamate transmembrane transporter activity(GO:0005314) |
| 3.6 | 86.7 | GO:0080025 | phosphatidylinositol-3,5-bisphosphate binding(GO:0080025) |
| 3.6 | 96.6 | GO:1905030 | voltage-gated sodium channel activity(GO:0005248) voltage-gated ion channel activity involved in regulation of postsynaptic membrane potential(GO:1905030) |
| 3.5 | 31.5 | GO:0086080 | protein binding involved in heterotypic cell-cell adhesion(GO:0086080) |
| 3.4 | 17.2 | GO:0004962 | endothelin receptor activity(GO:0004962) |
| 3.4 | 10.3 | GO:0047757 | chondroitin-glucuronate 5-epimerase activity(GO:0047757) |
| 3.4 | 34.2 | GO:0034190 | apolipoprotein receptor binding(GO:0034190) |
| 3.4 | 10.1 | GO:0098603 | selenol Se-methyltransferase activity(GO:0098603) |
| 3.3 | 13.4 | GO:0008449 | N-acetylglucosamine-6-sulfatase activity(GO:0008449) |
| 3.3 | 19.9 | GO:0019158 | glucokinase activity(GO:0004340) hexokinase activity(GO:0004396) fructokinase activity(GO:0008865) mannokinase activity(GO:0019158) |
| 3.3 | 13.2 | GO:0048763 | ryanodine-sensitive calcium-release channel activity(GO:0005219) calcium-induced calcium release activity(GO:0048763) |
| 3.3 | 16.4 | GO:0005250 | A-type (transient outward) potassium channel activity(GO:0005250) |
| 3.2 | 31.8 | GO:0098988 | G-protein coupled glutamate receptor activity(GO:0098988) |
| 2.9 | 26.3 | GO:0043559 | insulin binding(GO:0043559) |
| 2.9 | 14.3 | GO:0015252 | hydrogen ion channel activity(GO:0015252) |
| 2.8 | 16.8 | GO:0001515 | opioid peptide activity(GO:0001515) |
| 2.7 | 32.8 | GO:0004000 | adenosine deaminase activity(GO:0004000) |
| 2.7 | 172.6 | GO:0005080 | protein kinase C binding(GO:0005080) |
| 2.7 | 8.0 | GO:0044736 | acid-sensing ion channel activity(GO:0044736) |
| 2.6 | 15.6 | GO:0001849 | complement component C1q binding(GO:0001849) |
| 2.6 | 59.4 | GO:0002162 | dystroglycan binding(GO:0002162) |
| 2.5 | 10.1 | GO:0031697 | beta-1 adrenergic receptor binding(GO:0031697) |
| 2.5 | 12.5 | GO:0016907 | G-protein coupled acetylcholine receptor activity(GO:0016907) |
| 2.5 | 14.8 | GO:0015016 | [heparan sulfate]-glucosamine N-sulfotransferase activity(GO:0015016) |
| 2.4 | 7.2 | GO:0015489 | polyamine transmembrane transporter activity(GO:0015203) putrescine transmembrane transporter activity(GO:0015489) ornithine decarboxylase activator activity(GO:0042978) |
| 2.4 | 32.9 | GO:0001206 | transcriptional repressor activity, RNA polymerase II distal enhancer sequence-specific binding(GO:0001206) |
| 2.3 | 7.0 | GO:0031852 | mu-type opioid receptor binding(GO:0031852) |
| 2.3 | 6.8 | GO:0023030 | MHC class Ib protein complex binding(GO:0023025) MHC class Ib protein binding, via antigen binding groove(GO:0023030) |
| 2.2 | 6.7 | GO:0005294 | neutral L-amino acid secondary active transmembrane transporter activity(GO:0005294) |
| 2.2 | 15.2 | GO:0008273 | calcium, potassium:sodium antiporter activity(GO:0008273) |
| 2.1 | 29.7 | GO:0005391 | sodium:potassium-exchanging ATPase activity(GO:0005391) |
| 2.0 | 13.7 | GO:0043237 | laminin-1 binding(GO:0043237) |
| 2.0 | 27.5 | GO:0051371 | muscle alpha-actinin binding(GO:0051371) |
| 1.9 | 24.2 | GO:0098919 | structural constituent of postsynaptic specialization(GO:0098879) structural constituent of postsynaptic density(GO:0098919) |
| 1.8 | 5.4 | GO:0008607 | phosphorylase kinase regulator activity(GO:0008607) H3 histone acetyltransferase activity(GO:0010484) |
| 1.8 | 38.8 | GO:0030676 | Rac guanyl-nucleotide exchange factor activity(GO:0030676) |
| 1.7 | 12.0 | GO:0005432 | calcium:sodium antiporter activity(GO:0005432) |
| 1.7 | 6.8 | GO:0042610 | CD8 receptor binding(GO:0042610) |
| 1.7 | 6.7 | GO:0019870 | potassium channel inhibitor activity(GO:0019870) |
| 1.6 | 11.4 | GO:0045503 | dynein light chain binding(GO:0045503) |
| 1.6 | 14.5 | GO:0046974 | histone methyltransferase activity (H3-K9 specific)(GO:0046974) |
| 1.6 | 41.8 | GO:0005184 | neuropeptide hormone activity(GO:0005184) |
| 1.6 | 1.6 | GO:0050252 | retinol O-fatty-acyltransferase activity(GO:0050252) |
| 1.6 | 8.0 | GO:0004517 | nitric-oxide synthase activity(GO:0004517) |
| 1.6 | 1.6 | GO:0015087 | cobalt ion transmembrane transporter activity(GO:0015087) |
| 1.6 | 7.9 | GO:0004969 | histamine receptor activity(GO:0004969) |
| 1.6 | 18.9 | GO:0019869 | chloride channel inhibitor activity(GO:0019869) |
| 1.5 | 10.8 | GO:0016413 | O-acetyltransferase activity(GO:0016413) |
| 1.5 | 44.5 | GO:0005385 | zinc ion transmembrane transporter activity(GO:0005385) |
| 1.5 | 26.0 | GO:0071617 | lysophospholipid acyltransferase activity(GO:0071617) |
| 1.5 | 4.4 | GO:0005017 | platelet-derived growth factor-activated receptor activity(GO:0005017) |
| 1.4 | 12.6 | GO:0005001 | transmembrane receptor protein tyrosine phosphatase activity(GO:0005001) transmembrane receptor protein phosphatase activity(GO:0019198) |
| 1.4 | 28.4 | GO:0005123 | death receptor binding(GO:0005123) |
| 1.3 | 10.7 | GO:0036122 | BMP binding(GO:0036122) |
| 1.3 | 46.4 | GO:0001965 | G-protein alpha-subunit binding(GO:0001965) |
| 1.2 | 4.9 | GO:0004739 | pyruvate dehydrogenase (acetyl-transferring) activity(GO:0004739) |
| 1.2 | 7.3 | GO:0004144 | 2-acylglycerol O-acyltransferase activity(GO:0003846) diacylglycerol O-acyltransferase activity(GO:0004144) |
| 1.2 | 4.8 | GO:0008109 | N-acetyllactosaminide beta-1,6-N-acetylglucosaminyltransferase activity(GO:0008109) |
| 1.2 | 9.4 | GO:0030274 | LIM domain binding(GO:0030274) |
| 1.2 | 29.2 | GO:0005086 | ARF guanyl-nucleotide exchange factor activity(GO:0005086) |
| 1.2 | 25.6 | GO:0003746 | translation elongation factor activity(GO:0003746) |
| 1.2 | 5.8 | GO:0090555 | phosphatidylethanolamine-translocating ATPase activity(GO:0090555) |
| 1.1 | 4.5 | GO:0004525 | ribonuclease III activity(GO:0004525) double-stranded RNA-specific ribonuclease activity(GO:0032296) |
| 1.1 | 6.6 | GO:0035374 | chondroitin sulfate binding(GO:0035374) |
| 1.1 | 19.7 | GO:0004115 | 3',5'-cyclic-AMP phosphodiesterase activity(GO:0004115) |
| 1.1 | 3.2 | GO:0030337 | DNA polymerase processivity factor activity(GO:0030337) |
| 1.1 | 9.5 | GO:0031702 | type 1 angiotensin receptor binding(GO:0031702) |
| 1.0 | 3.0 | GO:0051373 | FATZ binding(GO:0051373) |
| 1.0 | 3.9 | GO:0016802 | adenosylhomocysteinase activity(GO:0004013) trialkylsulfonium hydrolase activity(GO:0016802) |
| 0.9 | 25.8 | GO:0015269 | calcium-activated potassium channel activity(GO:0015269) |
| 0.9 | 9.8 | GO:0030159 | receptor signaling complex scaffold activity(GO:0030159) |
| 0.9 | 5.3 | GO:0036402 | proteasome-activating ATPase activity(GO:0036402) |
| 0.8 | 39.5 | GO:0030544 | Hsp70 protein binding(GO:0030544) |
| 0.8 | 7.1 | GO:0015266 | protein channel activity(GO:0015266) |
| 0.8 | 27.7 | GO:0017080 | sodium channel regulator activity(GO:0017080) |
| 0.8 | 3.9 | GO:0008310 | single-stranded DNA 3'-5' exodeoxyribonuclease activity(GO:0008310) |
| 0.8 | 2.3 | GO:0000703 | oxidized pyrimidine nucleobase lesion DNA N-glycosylase activity(GO:0000703) |
| 0.8 | 6.9 | GO:0071933 | Arp2/3 complex binding(GO:0071933) |
| 0.8 | 12.1 | GO:0035174 | histone serine kinase activity(GO:0035174) |
| 0.7 | 10.7 | GO:0031005 | filamin binding(GO:0031005) |
| 0.7 | 2.8 | GO:1904288 | BAT3 complex binding(GO:1904288) |
| 0.7 | 7.0 | GO:0008190 | eukaryotic initiation factor 4E binding(GO:0008190) |
| 0.7 | 4.2 | GO:1990239 | steroid hormone binding(GO:1990239) |
| 0.7 | 4.0 | GO:0000150 | recombinase activity(GO:0000150) |
| 0.7 | 7.9 | GO:0042809 | vitamin D receptor binding(GO:0042809) |
| 0.6 | 11.0 | GO:0005227 | calcium activated cation channel activity(GO:0005227) |
| 0.6 | 5.1 | GO:0045545 | syndecan binding(GO:0045545) |
| 0.6 | 7.6 | GO:0033691 | sialic acid binding(GO:0033691) |
| 0.6 | 5.0 | GO:0001075 | transcription factor activity, RNA polymerase II core promoter sequence-specific binding involved in preinitiation complex assembly(GO:0001075) |
| 0.6 | 5.0 | GO:0004439 | phosphatidylinositol-4,5-bisphosphate 5-phosphatase activity(GO:0004439) |
| 0.6 | 10.4 | GO:0005242 | inward rectifier potassium channel activity(GO:0005242) |
| 0.6 | 90.3 | GO:0051015 | actin filament binding(GO:0051015) |
| 0.6 | 10.6 | GO:0046933 | proton-transporting ATP synthase activity, rotational mechanism(GO:0046933) |
| 0.6 | 17.1 | GO:0030371 | translation repressor activity(GO:0030371) |
| 0.6 | 6.2 | GO:0004862 | cAMP-dependent protein kinase inhibitor activity(GO:0004862) |
| 0.5 | 3.3 | GO:0016361 | activin receptor activity, type I(GO:0016361) |
| 0.5 | 4.9 | GO:0001730 | 2'-5'-oligoadenylate synthetase activity(GO:0001730) |
| 0.5 | 13.9 | GO:0005104 | fibroblast growth factor receptor binding(GO:0005104) |
| 0.5 | 5.9 | GO:0016846 | carbon-sulfur lyase activity(GO:0016846) |
| 0.5 | 5.8 | GO:0050811 | GABA receptor binding(GO:0050811) |
| 0.5 | 14.3 | GO:0030507 | spectrin binding(GO:0030507) |
| 0.5 | 15.6 | GO:0001106 | RNA polymerase II transcription corepressor activity(GO:0001106) |
| 0.5 | 7.5 | GO:0008568 | microtubule-severing ATPase activity(GO:0008568) |
| 0.5 | 7.9 | GO:0001594 | trace-amine receptor activity(GO:0001594) |
| 0.5 | 1.4 | GO:0004946 | bombesin receptor activity(GO:0004946) |
| 0.5 | 11.4 | GO:0070530 | K63-linked polyubiquitin binding(GO:0070530) |
| 0.5 | 2.3 | GO:0042731 | PH domain binding(GO:0042731) |
| 0.4 | 24.0 | GO:0032947 | protein complex scaffold(GO:0032947) |
| 0.4 | 32.5 | GO:0004860 | protein kinase inhibitor activity(GO:0004860) |
| 0.4 | 131.0 | GO:0015631 | tubulin binding(GO:0015631) |
| 0.4 | 3.4 | GO:0047499 | calcium-independent phospholipase A2 activity(GO:0047499) |
| 0.4 | 2.5 | GO:0003923 | GPI-anchor transamidase activity(GO:0003923) GPI anchor binding(GO:0034235) |
| 0.4 | 4.2 | GO:0016861 | intramolecular oxidoreductase activity, interconverting aldoses and ketoses(GO:0016861) |
| 0.4 | 3.7 | GO:0034513 | box H/ACA snoRNA binding(GO:0034513) |
| 0.4 | 11.6 | GO:0019894 | kinesin binding(GO:0019894) |
| 0.4 | 4.7 | GO:0015379 | potassium:chloride symporter activity(GO:0015379) potassium ion symporter activity(GO:0022820) |
| 0.4 | 46.8 | GO:0004222 | metalloendopeptidase activity(GO:0004222) |
| 0.4 | 5.4 | GO:0033038 | bitter taste receptor activity(GO:0033038) |
| 0.4 | 1.5 | GO:0071535 | RING-like zinc finger domain binding(GO:0071535) |
| 0.4 | 16.5 | GO:0005546 | phosphatidylinositol-4,5-bisphosphate binding(GO:0005546) |
| 0.3 | 1.5 | GO:0004694 | eukaryotic translation initiation factor 2alpha kinase activity(GO:0004694) |
| 0.3 | 1.4 | GO:0070181 | small ribosomal subunit rRNA binding(GO:0070181) |
| 0.3 | 5.2 | GO:0051879 | Hsp90 protein binding(GO:0051879) |
| 0.3 | 2.6 | GO:0008191 | metalloendopeptidase inhibitor activity(GO:0008191) |
| 0.3 | 3.1 | GO:0022889 | L-serine transmembrane transporter activity(GO:0015194) serine transmembrane transporter activity(GO:0022889) |
| 0.3 | 24.7 | GO:0008565 | protein transporter activity(GO:0008565) |
| 0.3 | 0.8 | GO:0050656 | 3'-phosphoadenosine 5'-phosphosulfate binding(GO:0050656) |
| 0.2 | 2.5 | GO:0016929 | SUMO-specific protease activity(GO:0016929) |
| 0.2 | 25.4 | GO:0005516 | calmodulin binding(GO:0005516) |
| 0.2 | 1.2 | GO:0071253 | connexin binding(GO:0071253) |
| 0.2 | 0.9 | GO:0008241 | peptidyl-dipeptidase activity(GO:0008241) |
| 0.2 | 1.7 | GO:0022833 | mechanically-gated ion channel activity(GO:0008381) mechanically gated channel activity(GO:0022833) |
| 0.2 | 5.3 | GO:0042805 | actinin binding(GO:0042805) |
| 0.2 | 5.5 | GO:0005355 | glucose transmembrane transporter activity(GO:0005355) |
| 0.2 | 4.6 | GO:0048365 | Rac GTPase binding(GO:0048365) |
| 0.2 | 2.4 | GO:0019215 | intermediate filament binding(GO:0019215) |
| 0.2 | 2.9 | GO:0004659 | prenyltransferase activity(GO:0004659) |
| 0.2 | 0.9 | GO:0004614 | phosphoglucomutase activity(GO:0004614) |
| 0.2 | 0.9 | GO:0097322 | 7SK snRNA binding(GO:0097322) |
| 0.2 | 39.7 | GO:0005096 | GTPase activator activity(GO:0005096) |
| 0.2 | 2.2 | GO:0000983 | transcription factor activity, RNA polymerase II core promoter sequence-specific(GO:0000983) |
| 0.2 | 14.6 | GO:0030165 | PDZ domain binding(GO:0030165) |
| 0.2 | 1.1 | GO:0008432 | JUN kinase binding(GO:0008432) |
| 0.1 | 2.6 | GO:0070273 | phosphatidylinositol-4-phosphate binding(GO:0070273) |
| 0.1 | 1.1 | GO:0001094 | TFIID-class transcription factor binding(GO:0001094) |
| 0.1 | 2.8 | GO:0008157 | protein phosphatase 1 binding(GO:0008157) |
| 0.1 | 10.6 | GO:0044325 | ion channel binding(GO:0044325) |
| 0.1 | 1.5 | GO:0008527 | taste receptor activity(GO:0008527) |
| 0.1 | 0.5 | GO:0004514 | nicotinate-nucleotide diphosphorylase (carboxylating) activity(GO:0004514) |
| 0.1 | 1.2 | GO:0043995 | histone acetyltransferase activity (H4-K5 specific)(GO:0043995) histone acetyltransferase activity (H4-K8 specific)(GO:0043996) histone acetyltransferase activity (H4-K16 specific)(GO:0046972) |
| 0.1 | 6.8 | GO:0003743 | translation initiation factor activity(GO:0003743) |
| 0.1 | 0.8 | GO:0008121 | ubiquinol-cytochrome-c reductase activity(GO:0008121) oxidoreductase activity, acting on diphenols and related substances as donors, cytochrome as acceptor(GO:0016681) |
| 0.1 | 3.1 | GO:0005484 | SNAP receptor activity(GO:0005484) |
| 0.1 | 2.5 | GO:0004709 | MAP kinase kinase kinase activity(GO:0004709) |
| 0.1 | 6.3 | GO:0008013 | beta-catenin binding(GO:0008013) |
| 0.1 | 2.6 | GO:0008137 | NADH dehydrogenase (ubiquinone) activity(GO:0008137) NADH dehydrogenase (quinone) activity(GO:0050136) |
| 0.1 | 0.3 | GO:0004809 | tRNA (guanine-N2-)-methyltransferase activity(GO:0004809) |
| 0.1 | 11.3 | GO:0005179 | hormone activity(GO:0005179) |
| 0.1 | 3.7 | GO:0004601 | peroxidase activity(GO:0004601) |
| 0.1 | 2.4 | GO:0004298 | threonine-type endopeptidase activity(GO:0004298) threonine-type peptidase activity(GO:0070003) |
| 0.1 | 0.6 | GO:0016308 | 1-phosphatidylinositol-4-phosphate 5-kinase activity(GO:0016308) |
| 0.1 | 4.1 | GO:0004879 | RNA polymerase II transcription factor activity, ligand-activated sequence-specific DNA binding(GO:0004879) transcription factor activity, direct ligand regulated sequence-specific DNA binding(GO:0098531) |
| 0.1 | 7.6 | GO:0016503 | pheromone receptor activity(GO:0016503) |
| 0.1 | 0.8 | GO:0097027 | ubiquitin-protein transferase activator activity(GO:0097027) |
| 0.1 | 2.4 | GO:0001105 | RNA polymerase II transcription coactivator activity(GO:0001105) |
| 0.1 | 1.3 | GO:0008327 | methyl-CpG binding(GO:0008327) |
| 0.1 | 1.2 | GO:0000993 | RNA polymerase II core binding(GO:0000993) |
| 0.1 | 0.5 | GO:0035005 | 1-phosphatidylinositol-4-phosphate 3-kinase activity(GO:0035005) |
| 0.1 | 1.8 | GO:0004712 | protein serine/threonine/tyrosine kinase activity(GO:0004712) |
| 0.1 | 2.1 | GO:0070888 | E-box binding(GO:0070888) |
| 0.0 | 0.4 | GO:0001591 | dopamine neurotransmitter receptor activity, coupled via Gi/Go(GO:0001591) |
| 0.0 | 1.2 | GO:0004364 | glutathione transferase activity(GO:0004364) |
| 0.0 | 7.3 | GO:0008168 | methyltransferase activity(GO:0008168) |
| 0.0 | 0.8 | GO:0032454 | histone demethylase activity (H3-K9 specific)(GO:0032454) |
| 0.0 | 1.5 | GO:0017112 | Rab guanyl-nucleotide exchange factor activity(GO:0017112) |
| 0.0 | 0.4 | GO:0016594 | glycine binding(GO:0016594) |
| 0.0 | 1.0 | GO:0015002 | cytochrome-c oxidase activity(GO:0004129) heme-copper terminal oxidase activity(GO:0015002) oxidoreductase activity, acting on a heme group of donors, oxygen as acceptor(GO:0016676) |
| 0.0 | 2.3 | GO:0005262 | calcium channel activity(GO:0005262) |
| 0.0 | 0.2 | GO:0016714 | oxidoreductase activity, acting on paired donors, with incorporation or reduction of molecular oxygen, reduced pteridine as one donor, and incorporation of one atom of oxygen(GO:0016714) |
| 0.0 | 0.5 | GO:0008253 | 5'-nucleotidase activity(GO:0008253) |
| 0.0 | 1.4 | GO:0016836 | hydro-lyase activity(GO:0016836) |
| 0.0 | 1.2 | GO:0030145 | manganese ion binding(GO:0030145) |
| 0.0 | 1.0 | GO:0003678 | DNA helicase activity(GO:0003678) |
| 0.0 | 0.1 | GO:0035252 | UDP-xylosyltransferase activity(GO:0035252) xylosyltransferase activity(GO:0042285) |
Gene overrepresentation in curated gene sets: canonical pathways category:
| Log-likelihood per target | Total log-likelihood | Term | Description |
|---|---|---|---|
| 3.6 | 163.8 | SIG CD40PATHWAYMAP | Genes related to CD40 signaling |
| 2.6 | 112.2 | NABA PROTEOGLYCANS | Genes encoding proteoglycans |
| 2.6 | 33.2 | SA PTEN PATHWAY | PTEN is a tumor suppressor that dephosphorylates the lipid messenger phosphatidylinositol triphosphate. |
| 2.4 | 60.7 | PID NETRIN PATHWAY | Netrin-mediated signaling events |
| 2.3 | 79.2 | PID NCADHERIN PATHWAY | N-cadherin signaling events |
| 2.2 | 116.5 | PID EPHB FWD PATHWAY | EPHB forward signaling |
| 1.5 | 44.8 | PID REELIN PATHWAY | Reelin signaling pathway |
| 1.0 | 9.1 | PID ECADHERIN KERATINOCYTE PATHWAY | E-cadherin signaling in keratinocytes |
| 1.0 | 49.5 | PID AJDISS 2PATHWAY | Posttranslational regulation of adherens junction stability and dissassembly |
| 0.9 | 15.1 | PID NECTIN PATHWAY | Nectin adhesion pathway |
| 0.9 | 13.8 | PID HEDGEHOG GLI PATHWAY | Hedgehog signaling events mediated by Gli proteins |
| 0.8 | 9.8 | PID ALK2 PATHWAY | ALK2 signaling events |
| 0.8 | 10.8 | ST TYPE I INTERFERON PATHWAY | Type I Interferon (alpha/beta IFN) Pathway |
| 0.8 | 15.2 | PID INTEGRIN5 PATHWAY | Beta5 beta6 beta7 and beta8 integrin cell surface interactions |
| 0.8 | 15.9 | ST GA13 PATHWAY | G alpha 13 Pathway |
| 0.8 | 47.4 | PID LKB1 PATHWAY | LKB1 signaling events |
| 0.7 | 28.5 | SIG REGULATION OF THE ACTIN CYTOSKELETON BY RHO GTPASES | Genes related to regulation of the actin cytoskeleton |
| 0.7 | 7.6 | PID P38 MK2 PATHWAY | p38 signaling mediated by MAPKAP kinases |
| 0.6 | 13.8 | PID P75 NTR PATHWAY | p75(NTR)-mediated signaling |
| 0.6 | 4.4 | PID PDGFRA PATHWAY | PDGFR-alpha signaling pathway |
| 0.5 | 10.3 | PID HEDGEHOG 2PATHWAY | Signaling events mediated by the Hedgehog family |
| 0.5 | 13.3 | PID RHODOPSIN PATHWAY | Visual signal transduction: Rods |
| 0.5 | 17.4 | PID FGF PATHWAY | FGF signaling pathway |
| 0.4 | 9.1 | PID ECADHERIN NASCENT AJ PATHWAY | E-cadherin signaling in the nascent adherens junction |
| 0.4 | 7.5 | PID CIRCADIAN PATHWAY | Circadian rhythm pathway |
| 0.4 | 8.3 | PID ARF 3PATHWAY | Arf1 pathway |
| 0.4 | 5.4 | PID RET PATHWAY | Signaling events regulated by Ret tyrosine kinase |
| 0.4 | 8.2 | PID IL8 CXCR1 PATHWAY | IL8- and CXCR1-mediated signaling events |
| 0.4 | 8.2 | PID SYNDECAN 2 PATHWAY | Syndecan-2-mediated signaling events |
| 0.4 | 9.5 | PID HDAC CLASSIII PATHWAY | Signaling events mediated by HDAC Class III |
| 0.4 | 23.1 | PID AP1 PATHWAY | AP-1 transcription factor network |
| 0.3 | 3.2 | PID INTEGRIN4 PATHWAY | Alpha6 beta4 integrin-ligand interactions |
| 0.3 | 2.4 | PID ANTHRAX PATHWAY | Cellular roles of Anthrax toxin |
| 0.3 | 9.1 | PID ARF6 TRAFFICKING PATHWAY | Arf6 trafficking events |
| 0.2 | 3.5 | PID LIS1 PATHWAY | Lissencephaly gene (LIS1) in neuronal migration and development |
| 0.2 | 8.3 | PID RAC1 REG PATHWAY | Regulation of RAC1 activity |
| 0.2 | 13.6 | PID NOTCH PATHWAY | Notch signaling pathway |
| 0.2 | 40.9 | NABA ECM GLYCOPROTEINS | Genes encoding structural ECM glycoproteins |
| 0.2 | 3.6 | PID ALPHA SYNUCLEIN PATHWAY | Alpha-synuclein signaling |
| 0.1 | 1.9 | PID IL6 7 PATHWAY | IL6-mediated signaling events |
| 0.1 | 0.3 | SA B CELL RECEPTOR COMPLEXES | Antigen binding to B cell receptors activates protein tyrosine kinases, such as the Src family, which ultimate activate MAP kinases. |
| 0.1 | 5.0 | PID RB 1PATHWAY | Regulation of retinoblastoma protein |
| 0.1 | 5.7 | PID MYC ACTIV PATHWAY | Validated targets of C-MYC transcriptional activation |
| 0.1 | 1.4 | PID TCPTP PATHWAY | Signaling events mediated by TCPTP |
| 0.0 | 1.4 | PID AURORA B PATHWAY | Aurora B signaling |
| 0.0 | 1.1 | PID PLK1 PATHWAY | PLK1 signaling events |
Gene overrepresentation in curated gene sets: REACTOME pathways category:
| Log-likelihood per target | Total log-likelihood | Term | Description |
|---|---|---|---|
| 12.4 | 223.2 | REACTOME UNBLOCKING OF NMDA RECEPTOR GLUTAMATE BINDING AND ACTIVATION | Genes involved in Unblocking of NMDA receptor, glutamate binding and activation |
| 9.2 | 128.7 | REACTOME NOREPINEPHRINE NEUROTRANSMITTER RELEASE CYCLE | Genes involved in Norepinephrine Neurotransmitter Release Cycle |
| 6.8 | 114.9 | REACTOME GABA A RECEPTOR ACTIVATION | Genes involved in GABA A receptor activation |
| 5.4 | 53.9 | REACTOME TRANSPORT OF ORGANIC ANIONS | Genes involved in Transport of organic anions |
| 5.3 | 84.2 | REACTOME ACTIVATION OF THE AP1 FAMILY OF TRANSCRIPTION FACTORS | Genes involved in Activation of the AP-1 family of transcription factors |
| 3.6 | 106.6 | REACTOME INHIBITION OF VOLTAGE GATED CA2 CHANNELS VIA GBETA GAMMA SUBUNITS | Genes involved in Inhibition of voltage gated Ca2+ channels via Gbeta/gamma subunits |
| 3.4 | 119.4 | REACTOME INTERACTION BETWEEN L1 AND ANKYRINS | Genes involved in Interaction between L1 and Ankyrins |
| 3.4 | 71.6 | REACTOME NEPHRIN INTERACTIONS | Genes involved in Nephrin interactions |
| 3.1 | 70.8 | REACTOME SIGNALING BY HIPPO | Genes involved in Signaling by Hippo |
| 2.9 | 35.1 | REACTOME DSCAM INTERACTIONS | Genes involved in DSCAM interactions |
| 2.8 | 8.4 | REACTOME DOPAMINE NEUROTRANSMITTER RELEASE CYCLE | Genes involved in Dopamine Neurotransmitter Release Cycle |
| 2.6 | 39.1 | REACTOME CRMPS IN SEMA3A SIGNALING | Genes involved in CRMPs in Sema3A signaling |
| 2.4 | 16.8 | REACTOME G PROTEIN ACTIVATION | Genes involved in G-protein activation |
| 2.3 | 44.5 | REACTOME ZINC TRANSPORTERS | Genes involved in Zinc transporters |
| 2.1 | 29.5 | REACTOME SEROTONIN RECEPTORS | Genes involved in Serotonin receptors |
| 1.7 | 31.8 | REACTOME CLASS C 3 METABOTROPIC GLUTAMATE PHEROMONE RECEPTORS | Genes involved in Class C/3 (Metabotropic glutamate/pheromone receptors) |
| 1.5 | 22.7 | REACTOME INHIBITION OF INSULIN SECRETION BY ADRENALINE NORADRENALINE | Genes involved in Inhibition of Insulin Secretion by Adrenaline/Noradrenaline |
| 1.5 | 11.9 | REACTOME NEGATIVE REGULATION OF THE PI3K AKT NETWORK | Genes involved in Negative regulation of the PI3K/AKT network |
| 1.3 | 30.1 | REACTOME GLUCAGON TYPE LIGAND RECEPTORS | Genes involved in Glucagon-type ligand receptors |
| 1.3 | 12.5 | REACTOME REGULATION OF INSULIN SECRETION BY ACETYLCHOLINE | Genes involved in Regulation of Insulin Secretion by Acetylcholine |
| 1.2 | 13.4 | REACTOME LIGAND GATED ION CHANNEL TRANSPORT | Genes involved in Ligand-gated ion channel transport |
| 1.2 | 33.6 | REACTOME ADHERENS JUNCTIONS INTERACTIONS | Genes involved in Adherens junctions interactions |
| 1.2 | 18.8 | REACTOME CELL EXTRACELLULAR MATRIX INTERACTIONS | Genes involved in Cell-extracellular matrix interactions |
| 1.2 | 14.1 | REACTOME GLUTAMATE NEUROTRANSMITTER RELEASE CYCLE | Genes involved in Glutamate Neurotransmitter Release Cycle |
| 1.2 | 19.9 | REACTOME FACILITATIVE NA INDEPENDENT GLUCOSE TRANSPORTERS | Genes involved in Facilitative Na+-independent glucose transporters |
| 0.9 | 11.8 | REACTOME TRAFFICKING OF GLUR2 CONTAINING AMPA RECEPTORS | Genes involved in Trafficking of GluR2-containing AMPA receptors |
| 0.9 | 11.7 | REACTOME SIGNALING BY FGFR3 MUTANTS | Genes involved in Signaling by FGFR3 mutants |
| 0.8 | 62.5 | REACTOME NUCLEAR RECEPTOR TRANSCRIPTION PATHWAY | Genes involved in Nuclear Receptor transcription pathway |
| 0.8 | 14.1 | REACTOME CREB PHOSPHORYLATION THROUGH THE ACTIVATION OF RAS | Genes involved in CREB phosphorylation through the activation of Ras |
| 0.8 | 10.8 | REACTOME TRAF3 DEPENDENT IRF ACTIVATION PATHWAY | Genes involved in TRAF3-dependent IRF activation pathway |
| 0.7 | 20.5 | REACTOME HS GAG BIOSYNTHESIS | Genes involved in HS-GAG biosynthesis |
| 0.7 | 9.9 | REACTOME SYNTHESIS SECRETION AND INACTIVATION OF GIP | Genes involved in Synthesis, Secretion, and Inactivation of Glucose-dependent Insulinotropic Polypeptide (GIP) |
| 0.7 | 15.5 | REACTOME SYNTHESIS OF PA | Genes involved in Synthesis of PA |
| 0.6 | 10.5 | REACTOME ACYL CHAIN REMODELLING OF PI | Genes involved in Acyl chain remodelling of PI |
| 0.6 | 6.8 | REACTOME YAP1 AND WWTR1 TAZ STIMULATED GENE EXPRESSION | Genes involved in YAP1- and WWTR1 (TAZ)-stimulated gene expression |
| 0.6 | 23.2 | REACTOME NCAM1 INTERACTIONS | Genes involved in NCAM1 interactions |
| 0.6 | 5.8 | REACTOME TRAF6 MEDIATED IRF7 ACTIVATION | Genes involved in TRAF6 mediated IRF7 activation |
| 0.6 | 21.6 | REACTOME STRIATED MUSCLE CONTRACTION | Genes involved in Striated Muscle Contraction |
| 0.5 | 21.3 | REACTOME NETRIN1 SIGNALING | Genes involved in Netrin-1 signaling |
| 0.5 | 20.0 | REACTOME ION CHANNEL TRANSPORT | Genes involved in Ion channel transport |
| 0.5 | 9.3 | REACTOME CIRCADIAN REPRESSION OF EXPRESSION BY REV ERBA | Genes involved in Circadian Repression of Expression by REV-ERBA |
| 0.5 | 12.0 | REACTOME PLATELET CALCIUM HOMEOSTASIS | Genes involved in Platelet calcium homeostasis |
| 0.5 | 23.3 | REACTOME VOLTAGE GATED POTASSIUM CHANNELS | Genes involved in Voltage gated Potassium channels |
| 0.5 | 8.6 | REACTOME G ALPHA Z SIGNALLING EVENTS | Genes involved in G alpha (z) signalling events |
| 0.4 | 22.6 | REACTOME NRAGE SIGNALS DEATH THROUGH JNK | Genes involved in NRAGE signals death through JNK |
| 0.4 | 3.4 | REACTOME ACYL CHAIN REMODELLING OF PE | Genes involved in Acyl chain remodelling of PE |
| 0.4 | 20.3 | REACTOME METABOLISM OF VITAMINS AND COFACTORS | Genes involved in Metabolism of vitamins and cofactors |
| 0.4 | 14.6 | REACTOME GLUCOSE TRANSPORT | Genes involved in Glucose transport |
| 0.4 | 3.2 | REACTOME PECAM1 INTERACTIONS | Genes involved in PECAM1 interactions |
| 0.3 | 10.3 | REACTOME KINESINS | Genes involved in Kinesins |
| 0.3 | 7.3 | REACTOME DARPP 32 EVENTS | Genes involved in DARPP-32 events |
| 0.3 | 4.9 | REACTOME REGULATION OF PYRUVATE DEHYDROGENASE PDH COMPLEX | Genes involved in Regulation of pyruvate dehydrogenase (PDH) complex |
| 0.3 | 4.5 | REACTOME KERATAN SULFATE DEGRADATION | Genes involved in Keratan sulfate degradation |
| 0.3 | 7.4 | REACTOME AMINE LIGAND BINDING RECEPTORS | Genes involved in Amine ligand-binding receptors |
| 0.3 | 12.1 | REACTOME GLYCOLYSIS | Genes involved in Glycolysis |
| 0.3 | 5.7 | REACTOME SYNTHESIS OF PIPS AT THE GOLGI MEMBRANE | Genes involved in Synthesis of PIPs at the Golgi membrane |
| 0.3 | 8.0 | REACTOME NITRIC OXIDE STIMULATES GUANYLATE CYCLASE | Genes involved in Nitric oxide stimulates guanylate cyclase |
| 0.3 | 2.5 | REACTOME NOTCH HLH TRANSCRIPTION PATHWAY | Genes involved in Notch-HLH transcription pathway |
| 0.3 | 7.1 | REACTOME SIGNALING BY BMP | Genes involved in Signaling by BMP |
| 0.2 | 9.9 | REACTOME GENERIC TRANSCRIPTION PATHWAY | Genes involved in Generic Transcription Pathway |
| 0.2 | 3.1 | REACTOME PROTEOLYTIC CLEAVAGE OF SNARE COMPLEX PROTEINS | Genes involved in Proteolytic cleavage of SNARE complex proteins |
| 0.2 | 10.7 | REACTOME CLASS B 2 SECRETIN FAMILY RECEPTORS | Genes involved in Class B/2 (Secretin family receptors) |
| 0.2 | 13.1 | REACTOME TRANSCRIPTIONAL REGULATION OF WHITE ADIPOCYTE DIFFERENTIATION | Genes involved in Transcriptional Regulation of White Adipocyte Differentiation |
| 0.2 | 2.3 | REACTOME BASE FREE SUGAR PHOSPHATE REMOVAL VIA THE SINGLE NUCLEOTIDE REPLACEMENT PATHWAY | Genes involved in Base-free sugar-phosphate removal via the single-nucleotide replacement pathway |
| 0.2 | 3.6 | REACTOME PEROXISOMAL LIPID METABOLISM | Genes involved in Peroxisomal lipid metabolism |
| 0.2 | 3.2 | REACTOME CELL JUNCTION ORGANIZATION | Genes involved in Cell junction organization |
| 0.2 | 4.9 | REACTOME P75 NTR RECEPTOR MEDIATED SIGNALLING | Genes involved in p75 NTR receptor-mediated signalling |
| 0.2 | 2.3 | REACTOME ACTIVATION OF CHAPERONES BY ATF6 ALPHA | Genes involved in Activation of Chaperones by ATF6-alpha |
| 0.1 | 3.0 | REACTOME SYNTHESIS AND INTERCONVERSION OF NUCLEOTIDE DI AND TRIPHOSPHATES | Genes involved in Synthesis and interconversion of nucleotide di- and triphosphates |
| 0.1 | 7.7 | REACTOME VIF MEDIATED DEGRADATION OF APOBEC3G | Genes involved in Vif-mediated degradation of APOBEC3G |
| 0.1 | 11.5 | REACTOME TRANSMISSION ACROSS CHEMICAL SYNAPSES | Genes involved in Transmission across Chemical Synapses |
| 0.1 | 3.3 | REACTOME CHOLESTEROL BIOSYNTHESIS | Genes involved in Cholesterol biosynthesis |
| 0.1 | 1.4 | REACTOME RECRUITMENT OF NUMA TO MITOTIC CENTROSOMES | Genes involved in Recruitment of NuMA to mitotic centrosomes |
| 0.1 | 3.6 | REACTOME G0 AND EARLY G1 | Genes involved in G0 and Early G1 |
| 0.1 | 3.6 | REACTOME NOTCH1 INTRACELLULAR DOMAIN REGULATES TRANSCRIPTION | Genes involved in NOTCH1 Intracellular Domain Regulates Transcription |
| 0.1 | 1.1 | REACTOME CYCLIN A B1 ASSOCIATED EVENTS DURING G2 M TRANSITION | Genes involved in Cyclin A/B1 associated events during G2/M transition |
| 0.1 | 1.9 | REACTOME INSULIN SYNTHESIS AND PROCESSING | Genes involved in Insulin Synthesis and Processing |
| 0.1 | 1.0 | REACTOME MRNA DECAY BY 3 TO 5 EXORIBONUCLEASE | Genes involved in mRNA Decay by 3' to 5' Exoribonuclease |
| 0.0 | 2.3 | REACTOME DOWNSTREAM SIGNAL TRANSDUCTION | Genes involved in Downstream signal transduction |
| 0.0 | 2.6 | REACTOME RESPIRATORY ELECTRON TRANSPORT | Genes involved in Respiratory electron transport |
| 0.0 | 0.8 | REACTOME CHONDROITIN SULFATE BIOSYNTHESIS | Genes involved in Chondroitin sulfate biosynthesis |
| 0.0 | 5.8 | REACTOME ANTIGEN PROCESSING UBIQUITINATION PROTEASOME DEGRADATION | Genes involved in Antigen processing: Ubiquitination & Proteasome degradation |
| 0.0 | 0.4 | REACTOME ENOS ACTIVATION AND REGULATION | Genes involved in eNOS activation and regulation |
| 0.0 | 0.3 | REACTOME SIGNALING BY FGFR1 FUSION MUTANTS | Genes involved in Signaling by FGFR1 fusion mutants |
| 0.0 | 0.3 | REACTOME REGULATION OF INSULIN LIKE GROWTH FACTOR IGF ACTIVITY BY INSULIN LIKE GROWTH FACTOR BINDING PROTEINS IGFBPS | Genes involved in Regulation of Insulin-like Growth Factor (IGF) Activity by Insulin-like Growth Factor Binding Proteins (IGFBPs) |