Project
GSE53960: rat RNA-Seq transcriptomic Bodymap
Navigation
Downloads
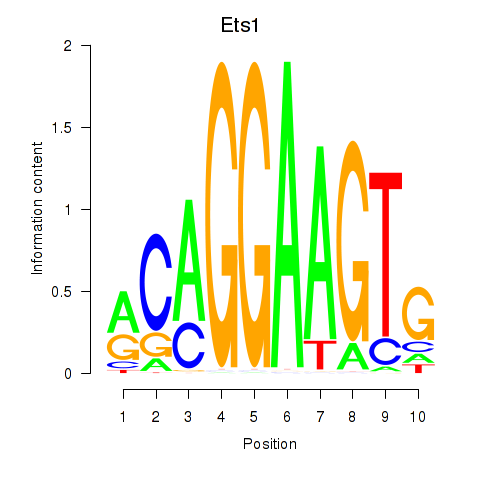
Results for Ets1
Z-value: 2.58
Motif logo
Transcription factors associated with Ets1
| Gene Symbol | Gene ID | Gene Info |
|---|---|---|
|
Ets1
|
ENSRNOG00000008941 | ETS proto-oncogene 1, transcription factor |
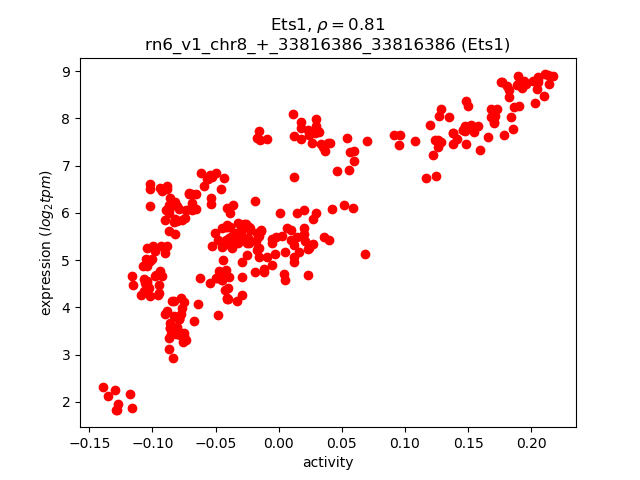
Activity-expression correlation:
| Gene | Promoter | Pearson corr. coef. | P-value | Plot |
|---|---|---|---|---|
| Ets1 | rn6_v1_chr8_+_33816386_33816386 | 0.81 | 8.5e-76 | Click! |
Activity profile of Ets1 motif
Sorted Z-values of Ets1 motif
| Promoter | Log-likelihood | Transcript | Gene | Gene Info |
|---|---|---|---|---|
| chr1_-_198662610 | 212.60 |
ENSRNOT00000055012
|
Sept1
|
septin 1 |
| chr13_+_89774764 | 165.17 |
ENSRNOT00000005619
|
Arhgap30
|
Rho GTPase activating protein 30 |
| chr1_+_198744050 | 149.82 |
ENSRNOT00000024404
|
Itgal
|
integrin subunit alpha L |
| chr1_+_219403970 | 114.23 |
ENSRNOT00000029607
|
Ptprcap
|
protein tyrosine phosphatase, receptor type, C-associated protein |
| chr1_-_198577226 | 113.22 |
ENSRNOT00000055013
|
Spn
|
sialophorin |
| chr15_+_57221292 | 110.12 |
ENSRNOT00000014502
|
Lcp1
|
lymphocyte cytosolic protein 1 |
| chr13_+_50164563 | 106.05 |
ENSRNOT00000029533
|
Lax1
|
lymphocyte transmembrane adaptor 1 |
| chr1_+_201620642 | 97.48 |
ENSRNOT00000093674
|
Dmbt1
|
deleted in malignant brain tumors 1 |
| chr5_-_147761983 | 97.43 |
ENSRNOT00000012936
|
Lck
|
LCK proto-oncogene, Src family tyrosine kinase |
| chr10_+_11810926 | 96.78 |
ENSRNOT00000036205
ENSRNOT00000036189 |
Nlrc3
|
NLR family, CARD domain containing 3 |
| chr5_-_79222687 | 95.59 |
ENSRNOT00000010516
|
Akna
|
AT-hook transcription factor |
| chr1_+_81779380 | 93.26 |
ENSRNOT00000065865
ENSRNOT00000080143 ENSRNOT00000089592 ENSRNOT00000080840 |
Arhgef1
|
Rho guanine nucleotide exchange factor 1 |
| chr1_-_219438779 | 92.33 |
ENSRNOT00000029237
|
Tbc1d10c
|
TBC1 domain family, member 10C |
| chr8_-_49308806 | 90.91 |
ENSRNOT00000047291
|
Cd3e
|
CD3e molecule |
| chr11_+_84745904 | 84.46 |
ENSRNOT00000002617
|
Klhl6
|
kelch-like family member 6 |
| chr20_+_4355175 | 83.85 |
ENSRNOT00000000510
|
Gpsm3
|
G-protein signaling modulator 3 |
| chr1_+_81763614 | 82.65 |
ENSRNOT00000027254
|
Cd79a
|
CD79a molecule |
| chr8_+_55603968 | 82.46 |
ENSRNOT00000066848
|
Pou2af1
|
POU class 2 associating factor 1 |
| chr13_+_83996080 | 81.59 |
ENSRNOT00000004403
ENSRNOT00000070958 |
Cd247
|
Cd247 molecule |
| chr16_-_9430743 | 80.56 |
ENSRNOT00000043811
|
Wdfy4
|
WDFY family member 4 |
| chr3_+_159995064 | 78.02 |
ENSRNOT00000012606
|
Ttpal
|
alpha tocopherol transfer protein like |
| chr1_-_197770669 | 77.11 |
ENSRNOT00000023563
|
Lat
|
linker for activation of T cells |
| chr10_-_87067456 | 77.00 |
ENSRNOT00000014163
|
Ccr7
|
C-C motif chemokine receptor 7 |
| chr14_-_23604834 | 74.53 |
ENSRNOT00000002760
|
Stap1
|
signal transducing adaptor family member 1 |
| chr20_+_30915213 | 74.34 |
ENSRNOT00000000681
|
Prf1
|
perforin 1 |
| chr9_-_9675110 | 74.30 |
ENSRNOT00000073294
|
Vav1
|
vav guanine nucleotide exchange factor 1 |
| chr13_-_55173692 | 74.16 |
ENSRNOT00000064785
ENSRNOT00000029878 ENSRNOT00000029865 ENSRNOT00000060292 ENSRNOT00000000814 |
Ptprc
|
protein tyrosine phosphatase, receptor type, C |
| chr14_+_44889287 | 73.80 |
ENSRNOT00000091312
ENSRNOT00000032273 |
Tmem156
|
transmembrane protein 156 |
| chr9_-_16795887 | 71.63 |
ENSRNOT00000071609
|
Cd79al
|
Cd79a molecule-like |
| chr5_+_154522119 | 71.25 |
ENSRNOT00000072618
|
E2f2
|
E2F transcription factor 2 |
| chr1_-_199823386 | 70.83 |
ENSRNOT00000027375
|
Rgs10
|
regulator of G-protein signaling 10 |
| chr11_+_54619129 | 70.38 |
ENSRNOT00000059924
|
Trat1
|
T cell receptor associated transmembrane adaptor 1 |
| chr10_-_59112788 | 70.02 |
ENSRNOT00000041886
|
Spns3
|
SPNS sphingolipid transporter 3 |
| chr2_-_190100276 | 68.24 |
ENSRNOT00000015351
|
S100a9
|
S100 calcium binding protein A9 |
| chr20_+_9948908 | 67.92 |
ENSRNOT00000001541
|
Ubash3a
|
ubiquitin associated and SH3 domain containing, A |
| chr1_-_227441442 | 67.77 |
ENSRNOT00000028433
|
Ms4a1
|
membrane spanning 4-domains A1 |
| chr7_-_107616038 | 67.64 |
ENSRNOT00000088752
|
Sla
|
src-like adaptor |
| chr20_+_5509059 | 66.43 |
ENSRNOT00000065349
|
Kifc1
|
kinesin family member C1 |
| chr7_+_125288081 | 66.05 |
ENSRNOT00000085216
|
Parvg
|
parvin, gamma |
| chr1_-_85317968 | 65.70 |
ENSRNOT00000026891
|
Gmfg
|
glia maturation factor, gamma |
| chr3_+_28627084 | 65.15 |
ENSRNOT00000049884
|
Arhgap15
|
Rho GTPase activating protein 15 |
| chr9_+_67763897 | 64.75 |
ENSRNOT00000071226
|
Icos
|
inducible T-cell co-stimulator |
| chr2_+_187218851 | 64.66 |
ENSRNOT00000017798
|
Sh2d2a
|
SH2 domain containing 2A |
| chr15_+_60084918 | 64.55 |
ENSRNOT00000012632
|
Epsti1
|
epithelial stromal interaction 1 |
| chr17_-_78812111 | 62.26 |
ENSRNOT00000021506
|
Dclre1c
|
DNA cross-link repair 1C |
| chr13_+_48426820 | 61.24 |
ENSRNOT00000048391
|
Ctse
|
cathepsin E |
| chr7_-_143837780 | 60.15 |
ENSRNOT00000016642
|
Itgb7
|
integrin subunit beta 7 |
| chr1_+_198528635 | 59.28 |
ENSRNOT00000022765
|
LOC308990
|
hypothetical protein LOC308990 |
| chr13_+_48427038 | 58.59 |
ENSRNOT00000009241
|
Ctse
|
cathepsin E |
| chrX_+_15155230 | 58.36 |
ENSRNOT00000073289
ENSRNOT00000051439 |
Was
|
Wiskott-Aldrich syndrome |
| chr7_+_70614617 | 58.29 |
ENSRNOT00000035382
|
Arhgap9
|
Rho GTPase activating protein 9 |
| chr3_-_160802433 | 58.02 |
ENSRNOT00000076191
|
Slpi
|
secretory leukocyte peptidase inhibitor |
| chr1_-_101236065 | 56.92 |
ENSRNOT00000066834
|
Cd37
|
CD37 molecule |
| chr8_-_23148396 | 56.55 |
ENSRNOT00000075237
|
Acp5
|
acid phosphatase 5, tartrate resistant |
| chr13_-_47979797 | 56.43 |
ENSRNOT00000080035
|
Rassf5
|
Ras association domain family member 5 |
| chr1_+_260289589 | 55.64 |
ENSRNOT00000051058
|
Dntt
|
DNA nucleotidylexotransferase |
| chr7_-_107392972 | 55.57 |
ENSRNOT00000093425
|
Tmem71
|
transmembrane protein 71 |
| chr2_+_183674522 | 55.12 |
ENSRNOT00000014433
|
Tmem154
|
transmembrane protein 154 |
| chr1_-_167347490 | 53.82 |
ENSRNOT00000076499
|
Rhog
|
ras homolog family member G |
| chr1_-_222272285 | 53.60 |
ENSRNOT00000028737
|
Fermt3
|
fermitin family member 3 |
| chr1_-_227932603 | 52.85 |
ENSRNOT00000033795
|
Ms4a6a
|
membrane spanning 4-domains A6A |
| chr8_-_21968415 | 52.45 |
ENSRNOT00000067325
ENSRNOT00000064932 |
Dnmt1
|
DNA methyltransferase 1 |
| chr7_-_119716238 | 52.44 |
ENSRNOT00000075678
|
Il2rb
|
interleukin 2 receptor subunit beta |
| chr15_-_29246222 | 52.13 |
ENSRNOT00000081806
|
AABR07017617.1
|
|
| chr10_+_84309430 | 51.93 |
ENSRNOT00000030159
|
Skap1
|
src kinase associated phosphoprotein 1 |
| chr10_+_91254058 | 51.75 |
ENSRNOT00000087218
ENSRNOT00000065373 |
Fmnl1
|
formin-like 1 |
| chr5_-_169630340 | 51.58 |
ENSRNOT00000087043
|
Kcnab2
|
potassium voltage-gated channel subfamily A regulatory beta subunit 2 |
| chr10_+_94566928 | 51.46 |
ENSRNOT00000078446
|
Prr29
|
proline rich 29 |
| chr12_+_13716596 | 51.27 |
ENSRNOT00000080216
|
Actb
|
actin, beta |
| chr5_-_159602251 | 51.26 |
ENSRNOT00000011394
|
Necap2
|
NECAP endocytosis associated 2 |
| chr10_+_106785077 | 51.07 |
ENSRNOT00000075047
|
Tmc8
|
transmembrane channel-like 8 |
| chr8_+_60760078 | 50.06 |
ENSRNOT00000063930
|
Pstpip1
|
proline-serine-threonine phosphatase-interacting protein 1 |
| chr1_+_229642412 | 50.06 |
ENSRNOT00000017109
|
Lpxn
|
leupaxin |
| chr14_+_3058993 | 49.83 |
ENSRNOT00000002807
|
Gfi1
|
growth factor independent 1 transcriptional repressor |
| chr1_-_88881460 | 49.27 |
ENSRNOT00000028287
|
Hcst
|
hematopoietic cell signal transducer |
| chr2_+_212257225 | 48.77 |
ENSRNOT00000077883
|
Vav3
|
vav guanine nucleotide exchange factor 3 |
| chr5_+_153507093 | 48.73 |
ENSRNOT00000086650
ENSRNOT00000083645 |
Runx3
|
runt-related transcription factor 3 |
| chr4_-_78342863 | 48.59 |
ENSRNOT00000049038
|
Gimap6
|
GTPase, IMAP family member 6 |
| chr5_+_149047681 | 48.08 |
ENSRNOT00000015198
|
Laptm5
|
lysosomal protein transmembrane 5 |
| chr11_-_66759402 | 47.54 |
ENSRNOT00000003326
|
Hcls1
|
hematopoietic cell specific Lyn substrate 1 |
| chr12_-_39667849 | 47.06 |
ENSRNOT00000011499
|
Arpc3
|
actin related protein 2/3 complex, subunit 3 |
| chr3_-_118959850 | 47.01 |
ENSRNOT00000092750
|
Atp8b4
|
ATPase phospholipid transporting 8B4 (putative) |
| chr9_+_65620658 | 46.19 |
ENSRNOT00000084498
|
Casp8
|
caspase 8 |
| chr8_-_62424303 | 46.16 |
ENSRNOT00000091223
|
Csk
|
c-src tyrosine kinase |
| chr7_+_118895405 | 45.82 |
ENSRNOT00000092095
|
RGD1309808
|
similar to apolipoprotein L2; apolipoprotein L-II |
| chrX_+_70461718 | 45.78 |
ENSRNOT00000078233
ENSRNOT00000003789 |
Kif4a
|
kinesin family member 4A |
| chrX_-_71616997 | 45.65 |
ENSRNOT00000004406
|
Cxcr3
|
C-X-C motif chemokine receptor 3 |
| chr3_-_110517163 | 45.50 |
ENSRNOT00000078037
|
Plcb2
|
phospholipase C, beta 2 |
| chr10_+_18996523 | 45.39 |
ENSRNOT00000046135
|
Lcp2
|
lymphocyte cytosolic protein 2 |
| chr1_-_226791773 | 45.20 |
ENSRNOT00000082482
ENSRNOT00000065376 ENSRNOT00000054812 ENSRNOT00000086669 |
LOC100911215
|
T-cell surface glycoprotein CD5-like |
| chr1_-_198225580 | 45.18 |
ENSRNOT00000026909
|
Ppp4c
|
protein phosphatase 4, catalytic subunit |
| chr9_-_9985358 | 44.60 |
ENSRNOT00000080856
|
Crb3
|
crumbs 3, cell polarity complex component |
| chr1_+_87938042 | 44.25 |
ENSRNOT00000027837
|
Map4k1
|
mitogen activated protein kinase kinase kinase kinase 1 |
| chr1_+_88875375 | 44.11 |
ENSRNOT00000028284
|
Tyrobp
|
Tyro protein tyrosine kinase binding protein |
| chr20_+_5441876 | 43.96 |
ENSRNOT00000092476
|
Rps18
|
ribosomal protein S18 |
| chr2_+_186776644 | 43.92 |
ENSRNOT00000046778
|
Fcrl3
|
Fc receptor-like 3 |
| chr2_+_236233239 | 43.89 |
ENSRNOT00000013694
|
Lef1
|
lymphoid enhancer binding factor 1 |
| chr20_+_6973398 | 43.61 |
ENSRNOT00000041665
|
Fgd2
|
FYVE, RhoGEF and PH domain containing 2 |
| chr7_+_37812831 | 43.49 |
ENSRNOT00000005910
|
Btg1
|
BTG anti-proliferation factor 1 |
| chr11_-_60180031 | 43.28 |
ENSRNOT00000043020
ENSRNOT00000093731 |
Gcsam
|
germinal center-associated, signaling and motility |
| chr3_-_160738927 | 43.11 |
ENSRNOT00000043470
|
Slpil2
|
antileukoproteinase-like 2 |
| chr4_-_163227242 | 42.61 |
ENSRNOT00000091552
ENSRNOT00000077793 |
Clec7a
|
C-type lectin domain family 7, member A |
| chr4_-_162189994 | 42.40 |
ENSRNOT00000045501
|
LOC689757
|
similar to osteoclast inhibitory lectin |
| chr1_-_222118459 | 42.28 |
ENSRNOT00000067217
|
Ccdc88b
|
coiled-coil domain containing 88B |
| chr3_-_2853272 | 42.22 |
ENSRNOT00000023022
|
Fcna
|
ficolin A |
| chr1_-_167347662 | 41.94 |
ENSRNOT00000027641
ENSRNOT00000076592 |
Rhog
|
ras homolog family member G |
| chr3_-_160739137 | 41.35 |
ENSRNOT00000075836
|
Slpil2
|
antileukoproteinase-like 2 |
| chr10_-_31419235 | 39.90 |
ENSRNOT00000059496
|
Cyfip2
|
cytoplasmic FMR1 interacting protein 2 |
| chr8_+_96551245 | 39.58 |
ENSRNOT00000039850
|
Bcl2a1
|
BCL2-related protein A1 |
| chr15_-_42898150 | 39.54 |
ENSRNOT00000030036
|
Ptk2b
|
protein tyrosine kinase 2 beta |
| chr8_+_102304095 | 38.98 |
ENSRNOT00000011358
|
Slc9a9
|
solute carrier family 9 member A9 |
| chr4_+_78320190 | 38.47 |
ENSRNOT00000032742
ENSRNOT00000091359 |
Gimap4
|
GTPase, IMAP family member 4 |
| chr4_-_157263890 | 38.33 |
ENSRNOT00000065416
|
Ptpn6
|
protein tyrosine phosphatase, non-receptor type 6 |
| chr10_+_59529785 | 38.04 |
ENSRNOT00000064840
ENSRNOT00000065181 |
Atp2a3
|
ATPase sarcoplasmic/endoplasmic reticulum Ca2+ transporting 3 |
| chr7_+_11077411 | 37.92 |
ENSRNOT00000007117
|
S1pr4
|
sphingosine-1-phosphate receptor 4 |
| chr5_-_140585408 | 37.86 |
ENSRNOT00000018711
|
Cap1
|
adenylate cyclase associated protein 1 |
| chr4_+_78378144 | 37.67 |
ENSRNOT00000059156
|
Gimap5
|
GTPase, IMAP family member 5 |
| chr1_+_86938138 | 37.60 |
ENSRNOT00000075601
|
Ccer2
|
coiled-coil glutamate-rich protein 2 |
| chr20_-_3397039 | 37.37 |
ENSRNOT00000001084
ENSRNOT00000085259 |
Ppp1r18
|
protein phosphatase 1, regulatory subunit 18 |
| chr16_-_19918644 | 37.18 |
ENSRNOT00000083345
ENSRNOT00000023926 |
Plvap
|
plasmalemma vesicle associated protein |
| chr4_+_78371121 | 37.17 |
ENSRNOT00000059157
|
Gimap1
|
GTPase, IMAP family member 1 |
| chr2_+_55835151 | 37.02 |
ENSRNOT00000018634
|
Fyb
|
FYN binding protein |
| chr2_-_187909394 | 36.63 |
ENSRNOT00000032355
|
Rab25
|
RAB25, member RAS oncogene family |
| chr9_-_61528882 | 36.52 |
ENSRNOT00000015432
|
Ankrd44
|
ankyrin repeat domain 44 |
| chr20_+_46199981 | 36.24 |
ENSRNOT00000000337
|
Mical1
|
microtubule associated monooxygenase, calponin and LIM domain containing 1 |
| chr1_-_206282575 | 36.23 |
ENSRNOT00000024974
|
Adam12
|
ADAM metallopeptidase domain 12 |
| chr3_+_79918969 | 36.18 |
ENSRNOT00000016306
|
Spi1
|
Spi-1 proto-oncogene |
| chr13_+_47602692 | 36.16 |
ENSRNOT00000038822
|
Fcmr
|
Fc fragment of IgM receptor |
| chr16_-_7588841 | 36.13 |
ENSRNOT00000084645
|
Mettl6
|
methyltransferase like 6 |
| chr4_+_78378313 | 36.01 |
ENSRNOT00000083891
|
Gimap5
|
GTPase, IMAP family member 5 |
| chr14_-_100184192 | 35.56 |
ENSRNOT00000007044
|
Plek
|
pleckstrin |
| chr10_+_31324512 | 35.55 |
ENSRNOT00000008559
|
Fndc9
|
fibronectin type III domain containing 9 |
| chr2_+_32820322 | 35.44 |
ENSRNOT00000013768
|
Cd180
|
CD180 molecule |
| chr1_-_47502952 | 35.40 |
ENSRNOT00000025580
|
Tagap
|
T-cell activation RhoGTPase activating protein |
| chr10_+_17421075 | 35.01 |
ENSRNOT00000047011
|
Stk10
|
serine/threonine kinase 10 |
| chr9_+_65614142 | 34.92 |
ENSRNOT00000016613
|
Casp8
|
caspase 8 |
| chr10_-_57275708 | 34.83 |
ENSRNOT00000005370
|
Pfn1
|
profilin 1 |
| chr17_-_21591203 | 34.59 |
ENSRNOT00000036195
|
Pak1ip1
|
PAK1 interacting protein 1 |
| chr1_-_89269930 | 34.49 |
ENSRNOT00000028532
|
Ffar2
|
free fatty acid receptor 2 |
| chr3_+_20641664 | 34.45 |
ENSRNOT00000044699
|
AABR07051741.1
|
|
| chr3_+_146365092 | 34.37 |
ENSRNOT00000008865
|
Cst7
|
cystatin F |
| chr9_+_81518584 | 34.27 |
ENSRNOT00000084309
|
Arpc2
|
actin related protein 2/3 complex, subunit 2 |
| chr11_-_14304603 | 34.21 |
ENSRNOT00000040202
ENSRNOT00000082143 |
Samsn1
|
SAM domain, SH3 domain and nuclear localization signals, 1 |
| chr1_-_89474252 | 34.13 |
ENSRNOT00000028597
|
Fxyd5
|
FXYD domain-containing ion transport regulator 5 |
| chr7_+_18440742 | 34.07 |
ENSRNOT00000011513
|
Myo1f
|
myosin IF |
| chrX_+_1311121 | 33.86 |
ENSRNOT00000038909
|
Cfp
|
complement factor properdin |
| chr7_-_12640232 | 33.79 |
ENSRNOT00000014981
|
Elane
|
elastase, neutrophil expressed |
| chr10_-_70341837 | 33.54 |
ENSRNOT00000077261
|
Slfn13
|
schlafen family member 13 |
| chr10_+_43067299 | 33.23 |
ENSRNOT00000003447
|
Galnt10
|
polypeptide N-acetylgalactosaminyltransferase 10 |
| chr18_+_44716226 | 33.22 |
ENSRNOT00000086431
|
Tnfaip8
|
TNF alpha induced protein 8 |
| chr13_+_88606894 | 32.94 |
ENSRNOT00000048692
|
Sh2d1b
|
SH2 domain containing 1B |
| chr3_+_110618298 | 32.85 |
ENSRNOT00000012454
|
Knstrn
|
kinetochore-localized astrin/SPAG5 binding protein |
| chr6_+_126170911 | 32.84 |
ENSRNOT00000077477
|
Rin3
|
Ras and Rab interactor 3 |
| chr17_-_9791781 | 32.67 |
ENSRNOT00000090536
|
Rgs14
|
regulator of G-protein signaling 14 |
| chr5_-_147953093 | 32.65 |
ENSRNOT00000075270
|
Khdrbs1
|
KH RNA binding domain containing, signal transduction associated 1 |
| chr9_+_8052210 | 32.19 |
ENSRNOT00000073659
|
Adgre4
|
adhesion G protein-coupled receptor E4 |
| chr13_-_83202864 | 32.18 |
ENSRNOT00000003976
|
Xcl1
|
X-C motif chemokine ligand 1 |
| chr5_+_25042710 | 32.13 |
ENSRNOT00000061385
|
RGD1559904
|
similar to mKIAA1429 protein |
| chr14_-_69927938 | 32.13 |
ENSRNOT00000058838
|
Ncapg
|
non-SMC condensin I complex, subunit G |
| chr4_-_119327822 | 32.09 |
ENSRNOT00000012645
|
Arhgap25
|
Rho GTPase activating protein 25 |
| chr10_+_55013703 | 31.82 |
ENSRNOT00000032785
|
Pik3r5
|
phosphoinositide-3-kinase, regulatory subunit 5 |
| chr4_+_157523320 | 31.82 |
ENSRNOT00000023192
|
Zfp384
|
zinc finger protein 384 |
| chr13_+_90759260 | 31.64 |
ENSRNOT00000010551
|
Pigm
|
phosphatidylinositol glycan anchor biosynthesis, class M |
| chr3_+_148327965 | 31.62 |
ENSRNOT00000010851
ENSRNOT00000088481 |
Tpx2
|
TPX2, microtubule nucleation factor |
| chr6_+_126170720 | 31.53 |
ENSRNOT00000065246
|
Rin3
|
Ras and Rab interactor 3 |
| chr15_-_29465807 | 31.36 |
ENSRNOT00000075046
|
AABR07017635.1
|
|
| chr20_-_11815647 | 31.02 |
ENSRNOT00000001639
|
Itgb2
|
integrin subunit beta 2 |
| chr3_-_172537877 | 30.99 |
ENSRNOT00000072069
|
Ctsz
|
cathepsin Z |
| chr10_-_70802782 | 30.85 |
ENSRNOT00000045867
|
Ccl6
|
chemokine (C-C motif) ligand 6 |
| chr14_-_34115273 | 30.76 |
ENSRNOT00000032156
|
Cep135
|
centrosomal protein 135 |
| chr15_+_31989041 | 30.69 |
ENSRNOT00000073686
|
AABR07017868.2
|
|
| chr2_-_243224883 | 30.56 |
ENSRNOT00000014139
|
Dapp1
|
dual adaptor of phosphotyrosine and 3-phosphoinositides 1 |
| chr3_-_79390956 | 30.39 |
ENSRNOT00000077943
|
Ptprj
|
protein tyrosine phosphatase, receptor type, J |
| chr16_+_61758917 | 30.35 |
ENSRNOT00000084858
|
Leprotl1
|
leptin receptor overlapping transcript-like 1 |
| chr16_+_20293229 | 30.33 |
ENSRNOT00000025421
|
Rpl18a
|
ribosomal protein L18A |
| chr5_-_76756140 | 30.24 |
ENSRNOT00000022107
ENSRNOT00000089251 |
Ptbp3
|
polypyrimidine tract binding protein 3 |
| chr1_+_78767911 | 30.16 |
ENSRNOT00000022360
|
Prkd2
|
protein kinase D2 |
| chr10_+_94988362 | 30.05 |
ENSRNOT00000066525
|
Cep95
|
centrosomal protein 95 |
| chr4_+_34282625 | 29.97 |
ENSRNOT00000011138
ENSRNOT00000086735 |
Glcci1
|
glucocorticoid induced 1 |
| chr8_+_28075551 | 29.86 |
ENSRNOT00000012078
|
Ncapd3
|
non-SMC condensin II complex, subunit D3 |
| chr8_+_133029625 | 29.82 |
ENSRNOT00000008809
|
Ccr3
|
C-C motif chemokine receptor 3 |
| chr3_-_151625644 | 29.59 |
ENSRNOT00000026657
|
Rbm12
|
RNA binding motif protein 12 |
| chr1_-_89473904 | 29.39 |
ENSRNOT00000089474
|
Fxyd5
|
FXYD domain-containing ion transport regulator 5 |
| chr14_+_85230648 | 29.30 |
ENSRNOT00000089866
|
Ap1b1
|
adaptor-related protein complex 1, beta 1 subunit |
| chr2_-_58534211 | 29.28 |
ENSRNOT00000089178
|
Skp2
|
S-phase kinase associated protein 2 |
| chr10_+_75088422 | 29.09 |
ENSRNOT00000081951
|
Mpo
|
myeloperoxidase |
| chr7_+_12471824 | 28.99 |
ENSRNOT00000068197
|
Sbno2
|
strawberry notch homolog 2 |
| chr7_+_145068286 | 28.94 |
ENSRNOT00000088956
ENSRNOT00000065753 |
Nckap1l
|
NCK associated protein 1 like |
| chr10_+_29123273 | 28.68 |
ENSRNOT00000005171
|
Ccnjl
|
cyclin J-like |
| chr7_+_119482272 | 28.67 |
ENSRNOT00000009544
|
Ncf4
|
neutrophil cytosolic factor 4 |
| chr1_-_198476476 | 28.59 |
ENSRNOT00000027525
|
Kif22
|
kinesin family member 22 |
| chr1_-_134871167 | 28.40 |
ENSRNOT00000076300
|
Chd2
|
chromodomain helicase DNA binding protein 2 |
| chr16_-_19303824 | 28.33 |
ENSRNOT00000019350
|
Ap1m1
|
adaptor-related protein complex 1, mu 1 subunit |
| chr5_+_142845114 | 28.15 |
ENSRNOT00000039870
|
Yrdc
|
yrdC N(6)-threonylcarbamoyltransferase domain containing |
| chr17_-_9792007 | 27.92 |
ENSRNOT00000021596
|
Rgs14
|
regulator of G-protein signaling 14 |
| chr8_+_22559098 | 27.78 |
ENSRNOT00000041091
|
LOC691141
|
hypothetical protein LOC691141 |
| chr8_+_133195288 | 27.49 |
ENSRNOT00000078529
|
Ccr2
|
C-C motif chemokine receptor 2 |
| chr10_+_56576428 | 27.33 |
ENSRNOT00000079237
ENSRNOT00000023291 |
Cldn7
|
claudin 7 |
| chr15_-_30323833 | 27.31 |
ENSRNOT00000071631
|
AABR07017714.1
|
|
| chr1_-_260254600 | 27.29 |
ENSRNOT00000019014
|
Blnk
|
B-cell linker |
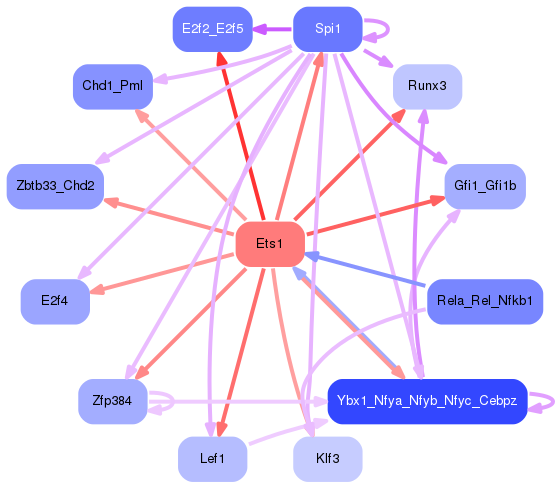
Network of associatons between targets according to the STRING database.

First level regulatory network of Ets1
Gene Ontology Analysis
Gene overrepresentation in biological process category:
| Log-likelihood per target | Total log-likelihood | Term | Description |
|---|---|---|---|
| 70.9 | 212.6 | GO:0007056 | spindle assembly involved in female meiosis(GO:0007056) |
| 37.7 | 113.2 | GO:0001807 | regulation of type IV hypersensitivity(GO:0001807) |
| 31.5 | 94.5 | GO:1902226 | regulation of macrophage colony-stimulating factor signaling pathway(GO:1902226) regulation of response to macrophage colony-stimulating factor(GO:1903969) regulation of cellular response to macrophage colony-stimulating factor stimulus(GO:1903972) |
| 28.3 | 141.3 | GO:1900226 | negative regulation of NLRP3 inflammasome complex assembly(GO:1900226) |
| 27.5 | 27.5 | GO:1902567 | negative regulation of eosinophil activation(GO:1902567) |
| 27.4 | 274.2 | GO:0046645 | positive regulation of gamma-delta T cell differentiation(GO:0045588) positive regulation of gamma-delta T cell activation(GO:0046645) |
| 24.9 | 49.8 | GO:0070103 | regulation of interleukin-6-mediated signaling pathway(GO:0070103) |
| 23.9 | 71.7 | GO:2000538 | regulation of B cell chemotaxis(GO:2000537) positive regulation of B cell chemotaxis(GO:2000538) |
| 20.2 | 60.6 | GO:0010070 | zygote asymmetric cell division(GO:0010070) |
| 19.2 | 77.0 | GO:2000525 | regulation of T cell costimulation(GO:2000523) positive regulation of T cell costimulation(GO:2000525) |
| 19.2 | 76.7 | GO:0002752 | cell surface pattern recognition receptor signaling pathway(GO:0002752) |
| 19.0 | 114.2 | GO:0002669 | positive regulation of T cell anergy(GO:0002669) positive regulation of lymphocyte anergy(GO:0002913) |
| 17.7 | 53.2 | GO:0002148 | hypochlorous acid metabolic process(GO:0002148) hypochlorous acid biosynthetic process(GO:0002149) |
| 16.6 | 49.7 | GO:0061152 | trachea submucosa development(GO:0061152) trachea gland development(GO:0061153) |
| 16.5 | 132.3 | GO:0050859 | negative regulation of B cell receptor signaling pathway(GO:0050859) |
| 15.1 | 75.4 | GO:0034316 | negative regulation of Arp2/3 complex-mediated actin nucleation(GO:0034316) |
| 15.0 | 60.0 | GO:2000814 | positive regulation of barbed-end actin filament capping(GO:2000814) |
| 15.0 | 149.8 | GO:0002291 | T cell activation via T cell receptor contact with antigen bound to MHC molecule on antigen presenting cell(GO:0002291) |
| 14.2 | 56.9 | GO:0030886 | negative regulation of myeloid dendritic cell activation(GO:0030886) |
| 14.2 | 42.6 | GO:0071226 | cellular response to molecule of fungal origin(GO:0071226) |
| 13.1 | 52.4 | GO:0090309 | DNA methylation on cytosine within a CG sequence(GO:0010424) positive regulation of methylation-dependent chromatin silencing(GO:0090309) |
| 13.1 | 52.4 | GO:0038110 | interleukin-2-mediated signaling pathway(GO:0038110) |
| 12.2 | 36.5 | GO:1901726 | negative regulation of histone deacetylase activity(GO:1901726) |
| 12.1 | 36.2 | GO:0019417 | sulfur oxidation(GO:0019417) |
| 11.9 | 47.5 | GO:0042509 | regulation of tyrosine phosphorylation of STAT protein(GO:0042509) positive regulation of tyrosine phosphorylation of STAT protein(GO:0042531) |
| 11.9 | 71.2 | GO:1990086 | lens fiber cell apoptotic process(GO:1990086) |
| 11.7 | 58.4 | GO:0002457 | T cell antigen processing and presentation(GO:0002457) |
| 11.4 | 68.2 | GO:0045113 | regulation of integrin biosynthetic process(GO:0045113) |
| 11.3 | 33.8 | GO:0045079 | negative regulation of chemokine biosynthetic process(GO:0045079) |
| 11.1 | 99.9 | GO:0051534 | negative regulation of NFAT protein import into nucleus(GO:0051534) |
| 10.9 | 32.6 | GO:0046833 | positive regulation of RNA export from nucleus(GO:0046833) |
| 10.8 | 21.6 | GO:0002084 | protein depalmitoylation(GO:0002084) |
| 10.6 | 105.7 | GO:0050862 | positive regulation of T cell receptor signaling pathway(GO:0050862) |
| 10.0 | 30.1 | GO:1904383 | response to sodium phosphate(GO:1904383) |
| 9.8 | 39.2 | GO:0044027 | hypermethylation of CpG island(GO:0044027) |
| 9.7 | 29.0 | GO:0071348 | cellular response to interleukin-11(GO:0071348) |
| 9.6 | 28.9 | GO:0002322 | B cell proliferation involved in immune response(GO:0002322) |
| 9.4 | 28.2 | GO:0002949 | tRNA threonylcarbamoyladenosine modification(GO:0002949) |
| 9.4 | 56.2 | GO:0032929 | negative regulation of superoxide anion generation(GO:0032929) |
| 8.9 | 35.6 | GO:0070560 | protein secretion by platelet(GO:0070560) |
| 8.6 | 34.4 | GO:2001168 | regulation of histone H2B ubiquitination(GO:2001166) positive regulation of histone H2B ubiquitination(GO:2001168) |
| 8.6 | 154.5 | GO:0001833 | inner cell mass cell proliferation(GO:0001833) |
| 8.6 | 25.7 | GO:0002232 | leukocyte chemotaxis involved in inflammatory response(GO:0002232) |
| 8.2 | 24.6 | GO:0042631 | cellular response to water deprivation(GO:0042631) |
| 8.2 | 24.5 | GO:0038158 | granulocyte colony-stimulating factor signaling pathway(GO:0038158) |
| 8.1 | 24.2 | GO:1901227 | negative regulation of transcription from RNA polymerase II promoter involved in heart development(GO:1901227) |
| 8.0 | 24.1 | GO:0007089 | traversing start control point of mitotic cell cycle(GO:0007089) |
| 8.0 | 119.8 | GO:0016540 | protein autoprocessing(GO:0016540) |
| 7.9 | 31.5 | GO:0070475 | rRNA base methylation(GO:0070475) |
| 7.8 | 62.3 | GO:0031848 | protection from non-homologous end joining at telomere(GO:0031848) |
| 7.7 | 46.2 | GO:0042997 | negative regulation of low-density lipoprotein particle clearance(GO:0010989) negative regulation of Golgi to plasma membrane protein transport(GO:0042997) |
| 7.5 | 82.8 | GO:0002517 | T cell tolerance induction(GO:0002517) |
| 7.5 | 52.7 | GO:2000402 | negative regulation of lymphocyte migration(GO:2000402) |
| 7.5 | 22.5 | GO:1904845 | response to L-glutamine(GO:1904844) cellular response to L-glutamine(GO:1904845) |
| 7.3 | 110.1 | GO:0051764 | actin filament network formation(GO:0051639) actin crosslink formation(GO:0051764) |
| 7.3 | 139.4 | GO:0097284 | hepatocyte apoptotic process(GO:0097284) |
| 7.3 | 43.9 | GO:0002281 | macrophage activation involved in immune response(GO:0002281) |
| 7.2 | 14.5 | GO:0051088 | PMA-inducible membrane protein ectodomain proteolysis(GO:0051088) |
| 7.2 | 107.9 | GO:0003376 | sphingosine-1-phosphate signaling pathway(GO:0003376) |
| 7.1 | 21.4 | GO:0048210 | Golgi vesicle fusion to target membrane(GO:0048210) |
| 7.1 | 120.6 | GO:0002418 | immune response to tumor cell(GO:0002418) |
| 6.9 | 20.7 | GO:0000432 | regulation of transcription from RNA polymerase II promoter by glucose(GO:0000430) positive regulation of transcription from RNA polymerase II promoter by glucose(GO:0000432) |
| 6.9 | 96.5 | GO:0002467 | germinal center formation(GO:0002467) |
| 6.9 | 20.7 | GO:1904211 | membrane protein proteolysis involved in retrograde protein transport, ER to cytosol(GO:1904211) |
| 6.7 | 53.6 | GO:0033632 | regulation of cell-cell adhesion mediated by integrin(GO:0033632) |
| 6.5 | 45.8 | GO:0000022 | mitotic spindle elongation(GO:0000022) mitotic spindle midzone assembly(GO:0051256) |
| 6.4 | 38.6 | GO:1904747 | apoptotic process involved in mammary gland involution(GO:0060057) positive regulation of apoptotic process involved in mammary gland involution(GO:0060058) positive regulation of apoptotic process involved in morphogenesis(GO:1902339) regulation of mammary gland involution(GO:1903519) positive regulation of mammary gland involution(GO:1903521) positive regulation of apoptotic process involved in development(GO:1904747) |
| 6.4 | 44.7 | GO:0022614 | membrane to membrane docking(GO:0022614) |
| 6.2 | 18.5 | GO:0097029 | mature conventional dendritic cell differentiation(GO:0097029) |
| 6.1 | 79.7 | GO:1900017 | positive regulation of cytokine production involved in inflammatory response(GO:1900017) |
| 6.1 | 30.3 | GO:0000454 | snoRNA guided rRNA pseudouridine synthesis(GO:0000454) |
| 6.0 | 18.0 | GO:0072697 | protein localization to cell cortex(GO:0072697) |
| 5.9 | 29.3 | GO:1902916 | positive regulation of protein polyubiquitination(GO:1902916) |
| 5.8 | 34.8 | GO:1900029 | positive regulation of ruffle assembly(GO:1900029) |
| 5.8 | 80.7 | GO:0045954 | positive regulation of natural killer cell mediated cytotoxicity(GO:0045954) |
| 5.7 | 17.2 | GO:1902564 | negative regulation of neutrophil degranulation(GO:0043314) negative regulation of neutrophil activation(GO:1902564) |
| 5.7 | 39.9 | GO:0051388 | positive regulation of neurotrophin TRK receptor signaling pathway(GO:0051388) |
| 5.5 | 98.3 | GO:0050858 | negative regulation of antigen receptor-mediated signaling pathway(GO:0050858) negative regulation of T cell receptor signaling pathway(GO:0050860) |
| 5.4 | 16.2 | GO:0038172 | interleukin-33-mediated signaling pathway(GO:0038172) |
| 5.3 | 10.6 | GO:0009826 | unidimensional cell growth(GO:0009826) |
| 5.3 | 58.3 | GO:1990001 | inhibition of cysteine-type endopeptidase activity involved in apoptotic process(GO:1990001) |
| 5.3 | 448.0 | GO:0050851 | antigen receptor-mediated signaling pathway(GO:0050851) |
| 5.2 | 31.0 | GO:0010757 | negative regulation of plasminogen activation(GO:0010757) |
| 5.1 | 15.4 | GO:0021997 | neural plate axis specification(GO:0021997) |
| 5.1 | 15.2 | GO:0072434 | signal transduction involved in G2 DNA damage checkpoint(GO:0072425) signal transduction involved in mitotic G2 DNA damage checkpoint(GO:0072434) telomerase catalytic core complex assembly(GO:1904868) regulation of telomerase catalytic core complex assembly(GO:1904882) positive regulation of telomerase catalytic core complex assembly(GO:1904884) |
| 5.0 | 14.9 | GO:0071169 | establishment of protein localization to chromatin(GO:0071169) |
| 4.9 | 9.9 | GO:0043380 | regulation of memory T cell differentiation(GO:0043380) positive regulation of memory T cell differentiation(GO:0043382) |
| 4.9 | 24.3 | GO:0044806 | G-quadruplex DNA unwinding(GO:0044806) |
| 4.9 | 14.6 | GO:0061092 | regulation of phospholipid translocation(GO:0061091) positive regulation of phospholipid translocation(GO:0061092) |
| 4.8 | 24.2 | GO:1904044 | response to aldosterone(GO:1904044) |
| 4.8 | 4.8 | GO:0006408 | snRNA export from nucleus(GO:0006408) |
| 4.8 | 24.1 | GO:0042256 | mature ribosome assembly(GO:0042256) |
| 4.8 | 14.4 | GO:0014739 | positive regulation of muscle hyperplasia(GO:0014739) |
| 4.8 | 95.8 | GO:1900027 | regulation of ruffle assembly(GO:1900027) |
| 4.8 | 62.0 | GO:0007076 | mitotic chromosome condensation(GO:0007076) |
| 4.6 | 27.7 | GO:0006361 | transcription initiation from RNA polymerase I promoter(GO:0006361) |
| 4.6 | 78.4 | GO:0032460 | negative regulation of protein oligomerization(GO:0032460) |
| 4.6 | 9.2 | GO:0006407 | rRNA export from nucleus(GO:0006407) |
| 4.6 | 54.9 | GO:0051014 | actin filament severing(GO:0051014) |
| 4.6 | 50.2 | GO:1902255 | positive regulation of intrinsic apoptotic signaling pathway by p53 class mediator(GO:1902255) |
| 4.5 | 13.6 | GO:2000158 | positive regulation of ubiquitin-specific protease activity(GO:2000158) |
| 4.5 | 17.9 | GO:0000389 | mRNA 3'-splice site recognition(GO:0000389) |
| 4.4 | 8.7 | GO:1902566 | regulation of eosinophil degranulation(GO:0043309) regulation of eosinophil activation(GO:1902566) |
| 4.3 | 43.5 | GO:2000271 | positive regulation of fibroblast apoptotic process(GO:2000271) |
| 4.3 | 12.9 | GO:0038165 | oncostatin-M-mediated signaling pathway(GO:0038165) |
| 4.3 | 124.4 | GO:0048025 | negative regulation of mRNA splicing, via spliceosome(GO:0048025) |
| 4.3 | 17.2 | GO:0035509 | negative regulation of myosin-light-chain-phosphatase activity(GO:0035509) negative regulation of bicellular tight junction assembly(GO:1903347) |
| 4.2 | 12.7 | GO:1901097 | negative regulation of autophagosome maturation(GO:1901097) |
| 4.1 | 45.6 | GO:1900118 | negative regulation of execution phase of apoptosis(GO:1900118) |
| 4.0 | 11.9 | GO:0036066 | protein O-linked fucosylation(GO:0036066) |
| 4.0 | 11.9 | GO:0034635 | glutathione transport(GO:0034635) tripeptide transport(GO:0042939) |
| 3.9 | 66.8 | GO:0000185 | activation of MAPKKK activity(GO:0000185) |
| 3.8 | 30.3 | GO:0097327 | response to antineoplastic agent(GO:0097327) |
| 3.7 | 26.0 | GO:0032511 | late endosome to vacuole transport via multivesicular body sorting pathway(GO:0032511) |
| 3.6 | 40.0 | GO:0048245 | eosinophil chemotaxis(GO:0048245) |
| 3.6 | 36.3 | GO:1901978 | positive regulation of cell cycle checkpoint(GO:1901978) |
| 3.6 | 14.5 | GO:0051684 | maintenance of Golgi location(GO:0051684) double-strand break repair via classical nonhomologous end joining(GO:0097680) |
| 3.6 | 14.4 | GO:0030242 | pexophagy(GO:0030242) |
| 3.6 | 10.7 | GO:1900245 | positive regulation of MDA-5 signaling pathway(GO:1900245) |
| 3.6 | 28.6 | GO:0000083 | regulation of transcription involved in G1/S transition of mitotic cell cycle(GO:0000083) |
| 3.5 | 39.0 | GO:0098719 | sodium ion import across plasma membrane(GO:0098719) sodium ion import into cell(GO:1990118) |
| 3.5 | 14.2 | GO:0072429 | response to intra-S DNA damage checkpoint signaling(GO:0072429) |
| 3.5 | 35.4 | GO:2000234 | positive regulation of ribosome biogenesis(GO:0090070) positive regulation of rRNA processing(GO:2000234) |
| 3.4 | 6.8 | GO:0032747 | positive regulation of interleukin-23 production(GO:0032747) |
| 3.3 | 10.0 | GO:0006713 | glucocorticoid catabolic process(GO:0006713) |
| 3.3 | 33.2 | GO:0016266 | O-glycan processing(GO:0016266) |
| 3.3 | 13.1 | GO:0032707 | negative regulation of interleukin-23 production(GO:0032707) |
| 3.3 | 45.8 | GO:0007213 | G-protein coupled acetylcholine receptor signaling pathway(GO:0007213) |
| 3.1 | 43.5 | GO:1902857 | positive regulation of nonmotile primary cilium assembly(GO:1902857) |
| 3.1 | 31.0 | GO:0002523 | leukocyte migration involved in inflammatory response(GO:0002523) |
| 3.1 | 34.1 | GO:0043312 | neutrophil degranulation(GO:0043312) |
| 3.1 | 21.6 | GO:0034625 | fatty acid elongation, monounsaturated fatty acid(GO:0034625) |
| 3.1 | 9.2 | GO:0072137 | condensed mesenchymal cell proliferation(GO:0072137) |
| 3.1 | 36.6 | GO:0031268 | pseudopodium organization(GO:0031268) |
| 3.0 | 42.3 | GO:0042832 | defense response to protozoan(GO:0042832) |
| 3.0 | 12.1 | GO:0045359 | positive regulation of interferon-beta biosynthetic process(GO:0045359) |
| 3.0 | 36.1 | GO:0051988 | regulation of attachment of spindle microtubules to kinetochore(GO:0051988) |
| 3.0 | 15.0 | GO:1900246 | positive regulation of RIG-I signaling pathway(GO:1900246) |
| 3.0 | 11.9 | GO:0038096 | immune response-regulating cell surface receptor signaling pathway involved in phagocytosis(GO:0002433) Fc-gamma receptor signaling pathway involved in phagocytosis(GO:0038096) |
| 3.0 | 23.8 | GO:0051533 | positive regulation of NFAT protein import into nucleus(GO:0051533) |
| 3.0 | 17.8 | GO:0046836 | glycolipid transport(GO:0046836) |
| 2.9 | 20.5 | GO:0090650 | response to oxygen-glucose deprivation(GO:0090649) cellular response to oxygen-glucose deprivation(GO:0090650) |
| 2.9 | 14.6 | GO:0045048 | protein insertion into ER membrane(GO:0045048) |
| 2.9 | 126.0 | GO:0072676 | lymphocyte migration(GO:0072676) |
| 2.9 | 5.7 | GO:0090669 | telomerase RNA stabilization(GO:0090669) |
| 2.8 | 28.3 | GO:0043482 | endosome to melanosome transport(GO:0035646) pigment accumulation(GO:0043476) cellular pigment accumulation(GO:0043482) endosome to pigment granule transport(GO:0043485) pigment granule maturation(GO:0048757) |
| 2.8 | 25.4 | GO:0080009 | mRNA methylation(GO:0080009) |
| 2.7 | 87.6 | GO:0007080 | mitotic metaphase plate congression(GO:0007080) |
| 2.6 | 26.3 | GO:0070995 | NADPH oxidation(GO:0070995) |
| 2.6 | 13.1 | GO:1904668 | positive regulation of ubiquitin protein ligase activity(GO:1904668) |
| 2.6 | 7.7 | GO:0071630 | nucleus-associated proteasomal ubiquitin-dependent protein catabolic process(GO:0071630) |
| 2.6 | 7.7 | GO:0000738 | DNA catabolic process, exonucleolytic(GO:0000738) |
| 2.6 | 51.3 | GO:0071257 | cellular response to electrical stimulus(GO:0071257) |
| 2.5 | 7.6 | GO:1903588 | negative regulation of blood vessel endothelial cell proliferation involved in sprouting angiogenesis(GO:1903588) |
| 2.5 | 5.0 | GO:0032066 | nucleolus to nucleoplasm transport(GO:0032066) |
| 2.5 | 15.0 | GO:1900244 | positive regulation of synaptic vesicle endocytosis(GO:1900244) |
| 2.5 | 20.0 | GO:0060836 | lymphatic endothelial cell differentiation(GO:0060836) |
| 2.5 | 19.7 | GO:1903715 | regulation of aerobic respiration(GO:1903715) |
| 2.5 | 14.8 | GO:0006398 | mRNA 3'-end processing by stem-loop binding and cleavage(GO:0006398) |
| 2.4 | 7.2 | GO:0002143 | tRNA wobble position uridine thiolation(GO:0002143) |
| 2.4 | 9.6 | GO:0090187 | positive regulation of pancreatic juice secretion(GO:0090187) |
| 2.4 | 4.8 | GO:0060266 | regulation of respiratory burst involved in inflammatory response(GO:0060264) negative regulation of respiratory burst involved in inflammatory response(GO:0060266) |
| 2.4 | 14.2 | GO:0051415 | interphase microtubule nucleation by interphase microtubule organizing center(GO:0051415) microtubule nucleation by microtubule organizing center(GO:0051418) |
| 2.3 | 9.3 | GO:0051542 | negative regulation of iron ion transmembrane transport(GO:0034760) elastin biosynthetic process(GO:0051542) |
| 2.3 | 25.0 | GO:0060236 | regulation of mitotic spindle organization(GO:0060236) |
| 2.3 | 6.8 | GO:1902299 | pre-replicative complex assembly involved in nuclear cell cycle DNA replication(GO:0006267) pre-replicative complex assembly(GO:0036388) pre-replicative complex assembly involved in cell cycle DNA replication(GO:1902299) |
| 2.2 | 6.7 | GO:0071461 | cellular response to redox state(GO:0071461) |
| 2.2 | 17.7 | GO:1900264 | regulation of DNA-directed DNA polymerase activity(GO:1900262) positive regulation of DNA-directed DNA polymerase activity(GO:1900264) |
| 2.2 | 11.0 | GO:2000002 | negative regulation of DNA damage checkpoint(GO:2000002) |
| 2.1 | 55.2 | GO:0009299 | mRNA transcription(GO:0009299) |
| 2.1 | 14.6 | GO:1901098 | positive regulation of autophagosome maturation(GO:1901098) |
| 2.1 | 16.6 | GO:0006265 | DNA topological change(GO:0006265) |
| 2.1 | 4.1 | GO:1902214 | negative regulation of MyD88-dependent toll-like receptor signaling pathway(GO:0034125) regulation of interleukin-4-mediated signaling pathway(GO:1902214) negative regulation of apoptotic cell clearance(GO:2000426) |
| 2.0 | 18.4 | GO:0060059 | embryonic retina morphogenesis in camera-type eye(GO:0060059) |
| 2.0 | 8.1 | GO:0071802 | negative regulation of podosome assembly(GO:0071802) |
| 2.0 | 22.1 | GO:0007016 | cytoskeletal anchoring at plasma membrane(GO:0007016) |
| 2.0 | 5.9 | GO:0036334 | epidermal stem cell homeostasis(GO:0036334) |
| 2.0 | 45.2 | GO:0010569 | regulation of double-strand break repair via homologous recombination(GO:0010569) |
| 1.9 | 13.4 | GO:0000447 | endonucleolytic cleavage in ITS1 to separate SSU-rRNA from 5.8S rRNA and LSU-rRNA from tricistronic rRNA transcript (SSU-rRNA, 5.8S rRNA, LSU-rRNA)(GO:0000447) |
| 1.9 | 116.1 | GO:0045576 | mast cell activation(GO:0045576) |
| 1.9 | 34.2 | GO:0050869 | negative regulation of B cell activation(GO:0050869) |
| 1.9 | 41.7 | GO:0034314 | Arp2/3 complex-mediated actin nucleation(GO:0034314) |
| 1.9 | 33.8 | GO:0060218 | hematopoietic stem cell differentiation(GO:0060218) |
| 1.9 | 3.7 | GO:0010847 | regulation of chromatin assembly(GO:0010847) |
| 1.8 | 9.2 | GO:1901668 | regulation of superoxide dismutase activity(GO:1901668) |
| 1.8 | 11.0 | GO:0032494 | response to peptidoglycan(GO:0032494) |
| 1.8 | 7.3 | GO:0006011 | UDP-glucose metabolic process(GO:0006011) |
| 1.8 | 5.4 | GO:1904154 | positive regulation of retrograde protein transport, ER to cytosol(GO:1904154) endoplasmic reticulum mannose trimming(GO:1904380) |
| 1.8 | 5.4 | GO:0042350 | GDP-L-fucose biosynthetic process(GO:0042350) |
| 1.8 | 73.2 | GO:0050912 | detection of chemical stimulus involved in sensory perception of taste(GO:0050912) |
| 1.8 | 8.9 | GO:0016259 | selenocysteine metabolic process(GO:0016259) |
| 1.8 | 21.4 | GO:0031468 | nuclear envelope reassembly(GO:0031468) |
| 1.8 | 7.1 | GO:0032824 | natural killer cell differentiation involved in immune response(GO:0002325) negative regulation of natural killer cell differentiation(GO:0032824) regulation of natural killer cell differentiation involved in immune response(GO:0032826) negative regulation of natural killer cell differentiation involved in immune response(GO:0032827) |
| 1.8 | 58.0 | GO:0019731 | antibacterial humoral response(GO:0019731) |
| 1.7 | 47.2 | GO:0000028 | ribosomal small subunit assembly(GO:0000028) |
| 1.7 | 7.0 | GO:0009212 | dTTP biosynthetic process(GO:0006235) pyrimidine deoxyribonucleoside triphosphate biosynthetic process(GO:0009212) |
| 1.7 | 3.5 | GO:1903003 | positive regulation of protein deubiquitination(GO:1903003) |
| 1.7 | 5.2 | GO:1903896 | positive regulation of IRE1-mediated unfolded protein response(GO:1903896) |
| 1.7 | 5.1 | GO:0048102 | autophagic cell death(GO:0048102) |
| 1.7 | 18.7 | GO:0033601 | positive regulation of mammary gland epithelial cell proliferation(GO:0033601) |
| 1.7 | 8.5 | GO:0097338 | response to clozapine(GO:0097338) |
| 1.7 | 11.8 | GO:0036260 | 7-methylguanosine RNA capping(GO:0009452) RNA capping(GO:0036260) |
| 1.7 | 6.6 | GO:0000492 | box C/D snoRNP assembly(GO:0000492) |
| 1.6 | 55.9 | GO:0000387 | spliceosomal snRNP assembly(GO:0000387) |
| 1.6 | 26.1 | GO:0046339 | diacylglycerol metabolic process(GO:0046339) |
| 1.6 | 11.2 | GO:1901299 | negative regulation of hydrogen peroxide-mediated programmed cell death(GO:1901299) |
| 1.6 | 11.2 | GO:0006477 | protein sulfation(GO:0006477) |
| 1.6 | 15.9 | GO:0006388 | tRNA splicing, via endonucleolytic cleavage and ligation(GO:0006388) |
| 1.6 | 12.6 | GO:0040016 | embryonic cleavage(GO:0040016) |
| 1.6 | 17.3 | GO:2000059 | negative regulation of protein ubiquitination involved in ubiquitin-dependent protein catabolic process(GO:2000059) |
| 1.6 | 12.6 | GO:2001138 | positive regulation of cellular respiration(GO:1901857) regulation of phospholipid transport(GO:2001138) positive regulation of phospholipid transport(GO:2001140) |
| 1.6 | 39.0 | GO:0000462 | maturation of SSU-rRNA from tricistronic rRNA transcript (SSU-rRNA, 5.8S rRNA, LSU-rRNA)(GO:0000462) |
| 1.6 | 4.7 | GO:0006933 | negative regulation of cell adhesion involved in substrate-bound cell migration(GO:0006933) |
| 1.5 | 60.9 | GO:0010501 | RNA secondary structure unwinding(GO:0010501) |
| 1.5 | 12.0 | GO:0072673 | lamellipodium morphogenesis(GO:0072673) |
| 1.5 | 13.4 | GO:0043983 | histone H4-K12 acetylation(GO:0043983) |
| 1.5 | 2.9 | GO:0006701 | progesterone biosynthetic process(GO:0006701) |
| 1.4 | 11.5 | GO:0090435 | protein localization to nuclear envelope(GO:0090435) |
| 1.4 | 5.7 | GO:0032485 | regulation of Ral protein signal transduction(GO:0032485) |
| 1.4 | 15.6 | GO:0007212 | dopamine receptor signaling pathway(GO:0007212) |
| 1.4 | 23.8 | GO:0090557 | establishment of endothelial intestinal barrier(GO:0090557) |
| 1.3 | 8.0 | GO:0032515 | negative regulation of phosphoprotein phosphatase activity(GO:0032515) |
| 1.3 | 5.3 | GO:0043353 | enucleate erythrocyte differentiation(GO:0043353) |
| 1.3 | 2.6 | GO:0030382 | sperm mitochondrion organization(GO:0030382) |
| 1.3 | 34.1 | GO:0046329 | negative regulation of JNK cascade(GO:0046329) |
| 1.3 | 5.2 | GO:0033183 | negative regulation of histone ubiquitination(GO:0033183) negative regulation of protein K63-linked ubiquitination(GO:1900045) regulation of histone H2A K63-linked ubiquitination(GO:1901314) negative regulation of histone H2A K63-linked ubiquitination(GO:1901315) negative regulation of protein polyubiquitination(GO:1902915) |
| 1.3 | 11.7 | GO:0042790 | transcription of nuclear large rRNA transcript from RNA polymerase I promoter(GO:0042790) |
| 1.3 | 10.4 | GO:0045876 | positive regulation of sister chromatid cohesion(GO:0045876) |
| 1.3 | 6.5 | GO:0031394 | positive regulation of prostaglandin biosynthetic process(GO:0031394) positive regulation of unsaturated fatty acid biosynthetic process(GO:2001280) |
| 1.3 | 7.7 | GO:0006362 | transcription elongation from RNA polymerase I promoter(GO:0006362) |
| 1.3 | 7.7 | GO:0015860 | purine nucleoside transmembrane transport(GO:0015860) |
| 1.3 | 6.3 | GO:0017182 | peptidyl-diphthamide metabolic process(GO:0017182) peptidyl-diphthamide biosynthetic process from peptidyl-histidine(GO:0017183) |
| 1.3 | 17.7 | GO:0042274 | ribosomal small subunit biogenesis(GO:0042274) |
| 1.3 | 3.8 | GO:0039689 | negative stranded viral RNA replication(GO:0039689) multi-organism biosynthetic process(GO:0044034) |
| 1.3 | 8.8 | GO:0015866 | ADP transport(GO:0015866) |
| 1.2 | 33.2 | GO:0050830 | defense response to Gram-positive bacterium(GO:0050830) |
| 1.2 | 28.1 | GO:0000470 | maturation of LSU-rRNA(GO:0000470) |
| 1.2 | 9.8 | GO:1903140 | regulation of endothelial cell development(GO:1901550) regulation of establishment of endothelial barrier(GO:1903140) |
| 1.2 | 3.6 | GO:0006436 | tryptophanyl-tRNA aminoacylation(GO:0006436) |
| 1.2 | 8.5 | GO:2000210 | positive regulation of anoikis(GO:2000210) |
| 1.2 | 44.6 | GO:0006505 | GPI anchor metabolic process(GO:0006505) |
| 1.2 | 1.2 | GO:2000370 | positive regulation of clathrin-mediated endocytosis(GO:2000370) |
| 1.2 | 9.3 | GO:0006348 | chromatin silencing at telomere(GO:0006348) |
| 1.2 | 22.1 | GO:0002115 | store-operated calcium entry(GO:0002115) |
| 1.2 | 10.4 | GO:0001973 | adenosine receptor signaling pathway(GO:0001973) |
| 1.2 | 8.1 | GO:2000096 | positive regulation of Wnt signaling pathway, planar cell polarity pathway(GO:2000096) |
| 1.1 | 37.1 | GO:0033198 | response to ATP(GO:0033198) |
| 1.1 | 2.2 | GO:1901423 | response to benzene(GO:1901423) |
| 1.1 | 5.6 | GO:0046477 | glycosylceramide catabolic process(GO:0046477) |
| 1.1 | 50.2 | GO:0038083 | peptidyl-tyrosine autophosphorylation(GO:0038083) |
| 1.1 | 33.4 | GO:0006911 | phagocytosis, engulfment(GO:0006911) |
| 1.1 | 3.3 | GO:0010993 | regulation of ubiquitin homeostasis(GO:0010993) free ubiquitin chain polymerization(GO:0010994) |
| 1.1 | 19.8 | GO:0060216 | definitive hemopoiesis(GO:0060216) |
| 1.1 | 7.7 | GO:0061052 | negative regulation of cell growth involved in cardiac muscle cell development(GO:0061052) |
| 1.1 | 8.7 | GO:0070417 | cellular response to cold(GO:0070417) |
| 1.1 | 37.6 | GO:0070527 | platelet aggregation(GO:0070527) |
| 1.1 | 9.6 | GO:0034472 | snRNA 3'-end processing(GO:0034472) |
| 1.0 | 6.3 | GO:0045974 | miRNA mediated inhibition of translation(GO:0035278) negative regulation of translation, ncRNA-mediated(GO:0040033) regulation of translation, ncRNA-mediated(GO:0045974) |
| 1.0 | 5.1 | GO:0090073 | positive regulation of protein homodimerization activity(GO:0090073) |
| 1.0 | 11.2 | GO:0045023 | G0 to G1 transition(GO:0045023) |
| 1.0 | 8.1 | GO:0070934 | CRD-mediated mRNA stabilization(GO:0070934) |
| 1.0 | 8.1 | GO:0000012 | single strand break repair(GO:0000012) |
| 1.0 | 4.0 | GO:1904798 | regulation of core promoter binding(GO:1904796) positive regulation of core promoter binding(GO:1904798) |
| 1.0 | 4.0 | GO:0009597 | detection of virus(GO:0009597) |
| 1.0 | 44.4 | GO:0000413 | protein peptidyl-prolyl isomerization(GO:0000413) |
| 1.0 | 8.8 | GO:0060837 | blood vessel endothelial cell differentiation(GO:0060837) |
| 1.0 | 15.6 | GO:0006359 | regulation of transcription from RNA polymerase III promoter(GO:0006359) |
| 1.0 | 5.8 | GO:0032878 | regulation of establishment or maintenance of cell polarity(GO:0032878) |
| 1.0 | 2.9 | GO:0045347 | negative regulation of MHC class II biosynthetic process(GO:0045347) |
| 1.0 | 4.8 | GO:0001555 | oocyte growth(GO:0001555) |
| 0.9 | 6.6 | GO:0035542 | regulation of SNARE complex assembly(GO:0035542) |
| 0.9 | 9.4 | GO:0043970 | histone H3-K9 acetylation(GO:0043970) |
| 0.9 | 15.7 | GO:0048268 | clathrin coat assembly(GO:0048268) |
| 0.9 | 7.4 | GO:0001842 | neural fold formation(GO:0001842) |
| 0.9 | 24.8 | GO:0043551 | regulation of phosphatidylinositol 3-kinase activity(GO:0043551) |
| 0.9 | 1.8 | GO:0046604 | positive regulation of mitotic centrosome separation(GO:0046604) |
| 0.9 | 39.5 | GO:0030520 | intracellular estrogen receptor signaling pathway(GO:0030520) |
| 0.9 | 14.3 | GO:0045653 | negative regulation of megakaryocyte differentiation(GO:0045653) |
| 0.9 | 4.5 | GO:0043456 | regulation of pentose-phosphate shunt(GO:0043456) |
| 0.9 | 7.1 | GO:1904262 | negative regulation of TORC1 signaling(GO:1904262) |
| 0.9 | 13.3 | GO:0045793 | positive regulation of cell size(GO:0045793) |
| 0.9 | 8.9 | GO:0035562 | negative regulation of chromatin binding(GO:0035562) |
| 0.9 | 4.4 | GO:2000622 | regulation of nuclear-transcribed mRNA catabolic process, nonsense-mediated decay(GO:2000622) negative regulation of nuclear-transcribed mRNA catabolic process, nonsense-mediated decay(GO:2000623) |
| 0.9 | 410.0 | GO:0043547 | positive regulation of GTPase activity(GO:0043547) |
| 0.9 | 6.1 | GO:0010756 | positive regulation of plasminogen activation(GO:0010756) |
| 0.9 | 9.6 | GO:0032506 | cytokinetic process(GO:0032506) |
| 0.9 | 3.5 | GO:0033602 | negative regulation of dopamine secretion(GO:0033602) |
| 0.8 | 13.6 | GO:0043984 | histone H4-K16 acetylation(GO:0043984) |
| 0.8 | 0.8 | GO:0000350 | generation of catalytic spliceosome for second transesterification step(GO:0000350) spliceosomal conformational changes to generate catalytic conformation(GO:0000393) |
| 0.8 | 4.2 | GO:0070389 | chaperone cofactor-dependent protein refolding(GO:0070389) |
| 0.8 | 5.8 | GO:0010668 | ectodermal cell differentiation(GO:0010668) |
| 0.8 | 5.7 | GO:0006517 | mannose metabolic process(GO:0006013) protein deglycosylation(GO:0006517) |
| 0.8 | 7.2 | GO:0035330 | regulation of hippo signaling(GO:0035330) |
| 0.8 | 18.0 | GO:0030488 | tRNA methylation(GO:0030488) |
| 0.8 | 21.0 | GO:0032007 | negative regulation of TOR signaling(GO:0032007) |
| 0.8 | 30.4 | GO:0042273 | ribosomal large subunit biogenesis(GO:0042273) |
| 0.8 | 26.3 | GO:2000036 | regulation of stem cell population maintenance(GO:2000036) |
| 0.8 | 0.8 | GO:0070370 | cellular heat acclimation(GO:0070370) |
| 0.8 | 55.3 | GO:0030183 | B cell differentiation(GO:0030183) |
| 0.8 | 3.8 | GO:0010735 | positive regulation of transcription via serum response element binding(GO:0010735) |
| 0.8 | 13.5 | GO:0045742 | positive regulation of epidermal growth factor receptor signaling pathway(GO:0045742) positive regulation of ERBB signaling pathway(GO:1901186) |
| 0.7 | 14.2 | GO:0009642 | response to light intensity(GO:0009642) |
| 0.7 | 2.2 | GO:0021649 | vestibulocochlear nerve structural organization(GO:0021649) ganglion morphogenesis(GO:0061552) dorsal root ganglion morphogenesis(GO:1904835) dorsal root ganglion development(GO:1990791) |
| 0.7 | 7.4 | GO:2000010 | positive regulation of protein localization to cell surface(GO:2000010) |
| 0.7 | 37.9 | GO:0045761 | regulation of adenylate cyclase activity(GO:0045761) |
| 0.7 | 10.3 | GO:0048026 | positive regulation of mRNA splicing, via spliceosome(GO:0048026) |
| 0.7 | 2.2 | GO:0021764 | amygdala development(GO:0021764) |
| 0.7 | 11.7 | GO:1900037 | regulation of cellular response to hypoxia(GO:1900037) |
| 0.7 | 45.4 | GO:0031398 | positive regulation of protein ubiquitination(GO:0031398) |
| 0.7 | 38.2 | GO:2000649 | regulation of sodium ion transmembrane transporter activity(GO:2000649) |
| 0.7 | 8.6 | GO:0043388 | positive regulation of DNA binding(GO:0043388) |
| 0.7 | 27.9 | GO:0045773 | positive regulation of axon extension(GO:0045773) |
| 0.7 | 22.4 | GO:0030521 | androgen receptor signaling pathway(GO:0030521) |
| 0.7 | 2.0 | GO:0006433 | prolyl-tRNA aminoacylation(GO:0006433) |
| 0.7 | 13.9 | GO:0034508 | centromere complex assembly(GO:0034508) |
| 0.7 | 11.7 | GO:0006491 | N-glycan processing(GO:0006491) |
| 0.7 | 5.9 | GO:0070933 | histone H4 deacetylation(GO:0070933) |
| 0.6 | 6.8 | GO:0030259 | lipid glycosylation(GO:0030259) |
| 0.6 | 4.3 | GO:0031665 | negative regulation of lipopolysaccharide-mediated signaling pathway(GO:0031665) |
| 0.6 | 3.6 | GO:0032757 | positive regulation of interleukin-8 production(GO:0032757) |
| 0.6 | 12.3 | GO:0034724 | DNA replication-independent nucleosome organization(GO:0034724) |
| 0.6 | 12.2 | GO:0006298 | mismatch repair(GO:0006298) |
| 0.6 | 4.0 | GO:0033210 | leptin-mediated signaling pathway(GO:0033210) |
| 0.6 | 3.9 | GO:0035372 | protein localization to microtubule(GO:0035372) |
| 0.5 | 2.7 | GO:0070234 | positive regulation of T cell apoptotic process(GO:0070234) |
| 0.5 | 5.9 | GO:0034643 | establishment of mitochondrion localization, microtubule-mediated(GO:0034643) mitochondrion transport along microtubule(GO:0047497) |
| 0.5 | 4.8 | GO:0001675 | acrosome assembly(GO:0001675) |
| 0.5 | 1.6 | GO:0090164 | asymmetric Golgi ribbon formation(GO:0090164) |
| 0.5 | 2.1 | GO:1903758 | regulation of postsynaptic density protein 95 clustering(GO:1902897) positive regulation of dendritic spine maintenance(GO:1902952) regulation of transcription from RNA polymerase II promoter by histone modification(GO:1903756) negative regulation of transcription from RNA polymerase II promoter by histone modification(GO:1903758) |
| 0.5 | 6.7 | GO:0035066 | positive regulation of histone acetylation(GO:0035066) |
| 0.5 | 4.1 | GO:0045722 | positive regulation of gluconeogenesis(GO:0045722) |
| 0.5 | 16.7 | GO:0007274 | neuromuscular synaptic transmission(GO:0007274) |
| 0.5 | 38.9 | GO:0042157 | lipoprotein metabolic process(GO:0042157) |
| 0.5 | 13.3 | GO:0045744 | negative regulation of G-protein coupled receptor protein signaling pathway(GO:0045744) |
| 0.5 | 4.7 | GO:0046325 | negative regulation of glucose import(GO:0046325) |
| 0.5 | 1.4 | GO:0009249 | protein lipoylation(GO:0009249) |
| 0.5 | 0.5 | GO:1903608 | protein localization to cytoplasmic stress granule(GO:1903608) |
| 0.5 | 15.7 | GO:0045907 | positive regulation of vasoconstriction(GO:0045907) |
| 0.4 | 19.1 | GO:0006406 | mRNA export from nucleus(GO:0006406) mRNA-containing ribonucleoprotein complex export from nucleus(GO:0071427) |
| 0.4 | 4.4 | GO:0021683 | cerebellar granular layer morphogenesis(GO:0021683) cerebellar granular layer formation(GO:0021684) cerebellar granule cell differentiation(GO:0021707) |
| 0.4 | 8.7 | GO:0001954 | positive regulation of cell-matrix adhesion(GO:0001954) |
| 0.4 | 8.5 | GO:2000279 | negative regulation of DNA biosynthetic process(GO:2000279) |
| 0.4 | 61.5 | GO:0050714 | positive regulation of protein secretion(GO:0050714) |
| 0.4 | 12.7 | GO:0046839 | phospholipid dephosphorylation(GO:0046839) |
| 0.4 | 5.5 | GO:0007095 | mitotic G2 DNA damage checkpoint(GO:0007095) G2 DNA damage checkpoint(GO:0031572) |
| 0.4 | 5.1 | GO:0035196 | production of miRNAs involved in gene silencing by miRNA(GO:0035196) |
| 0.4 | 5.0 | GO:0051084 | 'de novo' posttranslational protein folding(GO:0051084) |
| 0.4 | 5.2 | GO:0035518 | histone H2A monoubiquitination(GO:0035518) |
| 0.4 | 33.2 | GO:0051607 | defense response to virus(GO:0051607) |
| 0.4 | 16.7 | GO:0071549 | cellular response to dexamethasone stimulus(GO:0071549) |
| 0.4 | 18.1 | GO:0050863 | regulation of T cell activation(GO:0050863) |
| 0.4 | 2.9 | GO:0045292 | mRNA cis splicing, via spliceosome(GO:0045292) |
| 0.3 | 5.2 | GO:0032008 | positive regulation of TOR signaling(GO:0032008) |
| 0.3 | 5.1 | GO:0006271 | DNA strand elongation involved in DNA replication(GO:0006271) |
| 0.3 | 5.1 | GO:0006376 | mRNA splice site selection(GO:0006376) |
| 0.3 | 2.7 | GO:0070197 | meiotic telomere tethering at nuclear periphery(GO:0044821) meiotic attachment of telomere to nuclear envelope(GO:0070197) chromosome attachment to the nuclear envelope(GO:0097240) |
| 0.3 | 1.3 | GO:0060666 | dichotomous subdivision of terminal units involved in salivary gland branching(GO:0060666) |
| 0.3 | 1.3 | GO:0046855 | phosphorylated carbohydrate dephosphorylation(GO:0046838) inositol phosphate dephosphorylation(GO:0046855) |
| 0.3 | 4.8 | GO:0046415 | urate metabolic process(GO:0046415) |
| 0.3 | 2.1 | GO:1901741 | positive regulation of myoblast fusion(GO:1901741) |
| 0.3 | 53.1 | GO:0008380 | RNA splicing(GO:0008380) |
| 0.3 | 0.6 | GO:0010481 | epidermal cell division(GO:0010481) regulation of epidermal cell division(GO:0010482) |
| 0.3 | 7.9 | GO:1990090 | cellular response to nerve growth factor stimulus(GO:1990090) |
| 0.3 | 1.5 | GO:0075522 | IRES-dependent viral translational initiation(GO:0075522) |
| 0.3 | 2.6 | GO:0045947 | negative regulation of translational initiation(GO:0045947) |
| 0.3 | 3.2 | GO:0051457 | maintenance of protein location in nucleus(GO:0051457) |
| 0.3 | 9.7 | GO:0043966 | histone H3 acetylation(GO:0043966) |
| 0.3 | 4.7 | GO:0045070 | positive regulation of viral genome replication(GO:0045070) |
| 0.3 | 9.7 | GO:0033209 | tumor necrosis factor-mediated signaling pathway(GO:0033209) |
| 0.3 | 6.6 | GO:0034067 | protein localization to Golgi apparatus(GO:0034067) |
| 0.3 | 8.9 | GO:0002224 | toll-like receptor signaling pathway(GO:0002224) |
| 0.3 | 1.8 | GO:0032780 | negative regulation of ATPase activity(GO:0032780) |
| 0.3 | 2.3 | GO:0002002 | regulation of angiotensin levels in blood(GO:0002002) regulation of angiotensin metabolic process(GO:0060177) |
| 0.3 | 1.8 | GO:2000480 | regulation of cAMP-dependent protein kinase activity(GO:2000479) negative regulation of cAMP-dependent protein kinase activity(GO:2000480) |
| 0.3 | 3.3 | GO:0045948 | positive regulation of translational initiation(GO:0045948) |
| 0.3 | 3.5 | GO:0006895 | Golgi to endosome transport(GO:0006895) |
| 0.2 | 75.5 | GO:0006897 | endocytosis(GO:0006897) |
| 0.2 | 6.6 | GO:0032465 | regulation of cytokinesis(GO:0032465) |
| 0.2 | 5.0 | GO:1903146 | regulation of mitophagy(GO:1903146) |
| 0.2 | 10.4 | GO:0031532 | actin cytoskeleton reorganization(GO:0031532) |
| 0.2 | 1.4 | GO:0043550 | regulation of lipid kinase activity(GO:0043550) |
| 0.2 | 4.7 | GO:0045879 | negative regulation of smoothened signaling pathway(GO:0045879) |
| 0.2 | 1.5 | GO:0090141 | positive regulation of mitochondrial fission(GO:0090141) |
| 0.2 | 4.7 | GO:0031047 | gene silencing by RNA(GO:0031047) |
| 0.2 | 14.5 | GO:0030307 | positive regulation of cell growth(GO:0030307) |
| 0.2 | 5.6 | GO:0006400 | tRNA modification(GO:0006400) |
| 0.2 | 1.7 | GO:0035970 | peptidyl-threonine dephosphorylation(GO:0035970) |
| 0.2 | 2.6 | GO:0010165 | response to X-ray(GO:0010165) |
| 0.2 | 2.3 | GO:0016180 | snRNA processing(GO:0016180) |
| 0.2 | 1.0 | GO:0015074 | DNA integration(GO:0015074) |
| 0.2 | 2.2 | GO:0007257 | activation of JUN kinase activity(GO:0007257) |
| 0.2 | 3.8 | GO:0006801 | superoxide metabolic process(GO:0006801) |
| 0.2 | 3.2 | GO:0043967 | histone H4 acetylation(GO:0043967) |
| 0.2 | 3.7 | GO:0042113 | B cell activation(GO:0042113) |
| 0.2 | 0.3 | GO:0048702 | embryonic neurocranium morphogenesis(GO:0048702) |
| 0.2 | 11.8 | GO:0030217 | T cell differentiation(GO:0030217) |
| 0.1 | 0.4 | GO:0034628 | nicotinamide nucleotide biosynthetic process from aspartate(GO:0019355) 'de novo' NAD biosynthetic process from aspartate(GO:0034628) |
| 0.1 | 2.5 | GO:0071539 | protein localization to centrosome(GO:0071539) |
| 0.1 | 3.6 | GO:0000186 | activation of MAPKK activity(GO:0000186) |
| 0.1 | 1.9 | GO:0043248 | proteasome assembly(GO:0043248) |
| 0.1 | 2.2 | GO:0032456 | endocytic recycling(GO:0032456) |
| 0.1 | 3.2 | GO:0045739 | positive regulation of DNA repair(GO:0045739) |
| 0.1 | 1.5 | GO:0032508 | DNA duplex unwinding(GO:0032508) |
| 0.1 | 2.3 | GO:0006270 | DNA replication initiation(GO:0006270) |
| 0.1 | 0.4 | GO:0030576 | Cajal body organization(GO:0030576) |
| 0.1 | 3.0 | GO:0051057 | positive regulation of small GTPase mediated signal transduction(GO:0051057) |
| 0.1 | 2.3 | GO:0016573 | histone acetylation(GO:0016573) |
| 0.1 | 9.3 | GO:0000209 | protein polyubiquitination(GO:0000209) |
| 0.1 | 0.6 | GO:0097428 | protein maturation by iron-sulfur cluster transfer(GO:0097428) |
| 0.1 | 2.6 | GO:0008299 | isoprenoid biosynthetic process(GO:0008299) |
| 0.1 | 10.9 | GO:0090305 | nucleic acid phosphodiester bond hydrolysis(GO:0090305) |
| 0.1 | 3.2 | GO:0031023 | microtubule organizing center organization(GO:0031023) |
| 0.1 | 0.8 | GO:0030206 | chondroitin sulfate biosynthetic process(GO:0030206) |
| 0.1 | 1.8 | GO:0009615 | response to virus(GO:0009615) |
| 0.1 | 2.9 | GO:0010212 | response to ionizing radiation(GO:0010212) |
| 0.1 | 0.2 | GO:0006172 | ADP biosynthetic process(GO:0006172) dATP metabolic process(GO:0046060) |
| 0.0 | 0.7 | GO:0000731 | DNA synthesis involved in DNA repair(GO:0000731) |
| 0.0 | 0.6 | GO:0000184 | nuclear-transcribed mRNA catabolic process, nonsense-mediated decay(GO:0000184) |
| 0.0 | 1.5 | GO:0050776 | regulation of immune response(GO:0050776) |
| 0.0 | 2.3 | GO:0070588 | calcium ion transmembrane transport(GO:0070588) |
| 0.0 | 0.0 | GO:0033234 | negative regulation of protein sumoylation(GO:0033234) |
Gene overrepresentation in cellular component category:
| Log-likelihood per target | Total log-likelihood | Term | Description |
|---|---|---|---|
| 28.7 | 86.2 | GO:0030690 | Noc1p-Noc2p complex(GO:0030690) |
| 26.4 | 210.8 | GO:0042105 | alpha-beta T cell receptor complex(GO:0042105) |
| 25.2 | 100.8 | GO:0019815 | B cell receptor complex(GO:0019815) |
| 22.7 | 45.4 | GO:0036398 | TCR signalosome(GO:0036398) |
| 15.2 | 136.9 | GO:0042101 | T cell receptor complex(GO:0042101) |
| 15.2 | 45.5 | GO:0031680 | G-protein beta/gamma-subunit complex(GO:0031680) |
| 14.6 | 43.9 | GO:1990907 | beta-catenin-TCF complex(GO:1990907) |
| 14.2 | 212.6 | GO:0072687 | meiotic spindle(GO:0072687) |
| 12.4 | 74.3 | GO:0031904 | endosome lumen(GO:0031904) |
| 12.1 | 422.4 | GO:0001772 | immunological synapse(GO:0001772) |
| 12.0 | 132.0 | GO:0031254 | uropod(GO:0001931) cell trailing edge(GO:0031254) |
| 10.7 | 64.2 | GO:0036195 | muscle cell projection(GO:0036194) muscle cell projection membrane(GO:0036195) |
| 10.6 | 31.8 | GO:0005944 | phosphatidylinositol 3-kinase complex, class IB(GO:0005944) |
| 10.0 | 29.9 | GO:0042585 | germinal vesicle(GO:0042585) |
| 8.5 | 50.8 | GO:0030289 | protein phosphatase 4 complex(GO:0030289) |
| 7.5 | 37.3 | GO:0034455 | t-UTP complex(GO:0034455) |
| 6.9 | 61.9 | GO:0008024 | cyclin/CDK positive transcription elongation factor complex(GO:0008024) |
| 6.4 | 51.2 | GO:0043020 | NADPH oxidase complex(GO:0043020) |
| 6.3 | 50.1 | GO:0005826 | actomyosin contractile ring(GO:0005826) |
| 6.1 | 30.3 | GO:0090661 | box H/ACA telomerase RNP complex(GO:0090661) |
| 5.8 | 40.8 | GO:0042406 | extrinsic component of endoplasmic reticulum membrane(GO:0042406) |
| 5.8 | 17.5 | GO:0044609 | DBIRD complex(GO:0044609) |
| 5.8 | 46.3 | GO:0005885 | Arp2/3 protein complex(GO:0005885) |
| 5.7 | 5.7 | GO:0000814 | ESCRT II complex(GO:0000814) |
| 5.6 | 276.4 | GO:0002102 | podosome(GO:0002102) |
| 5.4 | 27.2 | GO:1990726 | Lsm1-7-Pat1 complex(GO:1990726) |
| 5.1 | 97.5 | GO:0042589 | zymogen granule membrane(GO:0042589) |
| 4.8 | 90.3 | GO:0031527 | filopodium membrane(GO:0031527) |
| 4.7 | 55.9 | GO:0005687 | U4 snRNP(GO:0005687) |
| 4.6 | 32.1 | GO:0000796 | condensin complex(GO:0000796) |
| 4.6 | 41.0 | GO:0031209 | SCAR complex(GO:0031209) |
| 4.5 | 40.8 | GO:0019907 | cyclin-dependent protein kinase activating kinase holoenzyme complex(GO:0019907) |
| 4.5 | 31.6 | GO:0043203 | axon hillock(GO:0043203) |
| 4.3 | 38.7 | GO:0070419 | nonhomologous end joining complex(GO:0070419) |
| 4.3 | 12.8 | GO:0071001 | U4/U6 snRNP(GO:0071001) |
| 4.2 | 25.4 | GO:0036396 | MIS complex(GO:0036396) |
| 3.9 | 30.9 | GO:0016589 | NURF complex(GO:0016589) |
| 3.8 | 53.2 | GO:0042582 | primary lysosome(GO:0005766) azurophil granule(GO:0042582) |
| 3.8 | 11.3 | GO:0035101 | FACT complex(GO:0035101) |
| 3.7 | 51.6 | GO:0044224 | juxtaparanode region of axon(GO:0044224) |
| 3.7 | 18.4 | GO:0044530 | supraspliceosomal complex(GO:0044530) |
| 3.7 | 36.6 | GO:0031143 | pseudopodium(GO:0031143) |
| 3.6 | 10.7 | GO:0000839 | Hrd1p ubiquitin ligase ERAD-L complex(GO:0000839) |
| 3.5 | 42.2 | GO:0031232 | extrinsic component of external side of plasma membrane(GO:0031232) |
| 3.5 | 10.5 | GO:0005853 | eukaryotic translation elongation factor 1 complex(GO:0005853) |
| 3.4 | 13.6 | GO:0072487 | MSL complex(GO:0072487) |
| 3.3 | 9.8 | GO:0031515 | tRNA (m1A) methyltransferase complex(GO:0031515) |
| 3.3 | 91.2 | GO:0008305 | integrin complex(GO:0008305) |
| 3.1 | 21.5 | GO:0032584 | growth cone membrane(GO:0032584) |
| 3.1 | 21.4 | GO:0098553 | integral component of cytoplasmic side of endoplasmic reticulum membrane(GO:0071458) integral component of lumenal side of endoplasmic reticulum membrane(GO:0071556) lumenal side of endoplasmic reticulum membrane(GO:0098553) |
| 3.0 | 24.2 | GO:0032059 | bleb(GO:0032059) |
| 3.0 | 18.0 | GO:0070847 | core mediator complex(GO:0070847) |
| 3.0 | 14.9 | GO:0031933 | telomeric heterochromatin(GO:0031933) |
| 3.0 | 14.9 | GO:0061689 | tricellular tight junction(GO:0061689) |
| 2.9 | 2.9 | GO:0031467 | Cul7-RING ubiquitin ligase complex(GO:0031467) |
| 2.9 | 20.0 | GO:0097136 | Bcl-2 family protein complex(GO:0097136) |
| 2.8 | 33.2 | GO:0030125 | clathrin vesicle coat(GO:0030125) |
| 2.6 | 33.8 | GO:0005686 | U2 snRNP(GO:0005686) |
| 2.5 | 7.4 | GO:0044611 | nuclear pore inner ring(GO:0044611) |
| 2.4 | 14.6 | GO:1990316 | ATG1/ULK1 kinase complex(GO:1990316) |
| 2.4 | 7.2 | GO:0071006 | U2-type catalytic step 1 spliceosome(GO:0071006) |
| 2.4 | 7.2 | GO:0097543 | ciliary inversin compartment(GO:0097543) |
| 2.4 | 14.2 | GO:0000923 | equatorial microtubule organizing center(GO:0000923) |
| 2.3 | 9.4 | GO:0044299 | C-fiber(GO:0044299) |
| 2.3 | 76.9 | GO:0030131 | clathrin adaptor complex(GO:0030131) |
| 2.3 | 20.5 | GO:0016600 | flotillin complex(GO:0016600) |
| 2.3 | 6.8 | GO:0036387 | nuclear pre-replicative complex(GO:0005656) pre-replicative complex(GO:0036387) |
| 2.2 | 22.0 | GO:0042588 | zymogen granule(GO:0042588) |
| 2.2 | 24.1 | GO:0031080 | nuclear pore outer ring(GO:0031080) |
| 2.1 | 14.5 | GO:0097197 | tetraspanin-enriched microdomain(GO:0097197) |
| 2.0 | 16.0 | GO:0071141 | SMAD protein complex(GO:0071141) |
| 2.0 | 8.0 | GO:1990745 | GARP complex(GO:0000938) EARP complex(GO:1990745) |
| 2.0 | 6.0 | GO:0061574 | ASAP complex(GO:0061574) |
| 2.0 | 11.9 | GO:0032426 | stereocilium tip(GO:0032426) |
| 2.0 | 23.7 | GO:0035631 | CD40 receptor complex(GO:0035631) |
| 2.0 | 17.7 | GO:0031390 | Ctf18 RFC-like complex(GO:0031390) |
| 1.9 | 61.8 | GO:0033017 | sarcoplasmic reticulum membrane(GO:0033017) |
| 1.9 | 126.9 | GO:0005871 | kinesin complex(GO:0005871) |
| 1.9 | 9.6 | GO:0070938 | contractile ring(GO:0070938) |
| 1.9 | 15.3 | GO:0071541 | eukaryotic translation initiation factor 3 complex, eIF3m(GO:0071541) |
| 1.9 | 140.4 | GO:0022627 | cytosolic small ribosomal subunit(GO:0022627) |
| 1.9 | 48.3 | GO:0030687 | preribosome, large subunit precursor(GO:0030687) |
| 1.8 | 49.8 | GO:0005721 | pericentric heterochromatin(GO:0005721) |
| 1.8 | 11.0 | GO:0005672 | transcription factor TFIIA complex(GO:0005672) |
| 1.8 | 19.8 | GO:0001527 | microfibril(GO:0001527) fibril(GO:0043205) |
| 1.8 | 532.0 | GO:0009897 | external side of plasma membrane(GO:0009897) |
| 1.7 | 19.1 | GO:0005662 | DNA replication factor A complex(GO:0005662) |
| 1.7 | 5.2 | GO:0034272 | phosphatidylinositol 3-kinase complex, class III, type I(GO:0034271) phosphatidylinositol 3-kinase complex, class III, type II(GO:0034272) |
| 1.7 | 30.7 | GO:0030140 | trans-Golgi network transport vesicle(GO:0030140) |
| 1.7 | 6.6 | GO:0005726 | perichromatin fibrils(GO:0005726) |
| 1.6 | 24.7 | GO:0071011 | precatalytic spliceosome(GO:0071011) |
| 1.6 | 121.8 | GO:0071013 | catalytic step 2 spliceosome(GO:0071013) |
| 1.6 | 146.3 | GO:0022625 | cytosolic large ribosomal subunit(GO:0022625) |
| 1.5 | 58.6 | GO:0000791 | euchromatin(GO:0000791) |
| 1.5 | 21.1 | GO:0060091 | kinocilium(GO:0060091) |
| 1.5 | 32.9 | GO:0035371 | microtubule plus-end(GO:0035371) |
| 1.4 | 21.4 | GO:0030119 | AP-type membrane coat adaptor complex(GO:0030119) |
| 1.4 | 7.0 | GO:0000120 | RNA polymerase I transcription factor complex(GO:0000120) |
| 1.4 | 5.5 | GO:0097422 | tubular endosome(GO:0097422) |
| 1.4 | 21.6 | GO:0005942 | phosphatidylinositol 3-kinase complex(GO:0005942) |
| 1.3 | 41.2 | GO:0034451 | centriolar satellite(GO:0034451) |
| 1.3 | 130.0 | GO:0005884 | actin filament(GO:0005884) |
| 1.3 | 13.1 | GO:0044613 | nuclear pore central transport channel(GO:0044613) |
| 1.3 | 13.1 | GO:0005847 | mRNA cleavage and polyadenylation specificity factor complex(GO:0005847) |
| 1.3 | 10.4 | GO:0000798 | nuclear cohesin complex(GO:0000798) |
| 1.3 | 16.3 | GO:0032045 | guanyl-nucleotide exchange factor complex(GO:0032045) |
| 1.2 | 8.7 | GO:0043219 | lateral loop(GO:0043219) |
| 1.2 | 4.9 | GO:0005968 | Rab-protein geranylgeranyltransferase complex(GO:0005968) |
| 1.2 | 9.9 | GO:0071004 | U2-type prespliceosome(GO:0071004) |
| 1.2 | 9.5 | GO:0032593 | insulin-responsive compartment(GO:0032593) |
| 1.2 | 5.8 | GO:0043625 | delta DNA polymerase complex(GO:0043625) |
| 1.2 | 3.5 | GO:0038039 | G-protein coupled receptor heterodimeric complex(GO:0038039) |
| 1.1 | 6.7 | GO:0042765 | GPI-anchor transamidase complex(GO:0042765) |
| 1.1 | 7.7 | GO:0097504 | Gemini of coiled bodies(GO:0097504) |
| 1.1 | 12.0 | GO:0071564 | npBAF complex(GO:0071564) |
| 1.1 | 53.4 | GO:0045335 | phagocytic vesicle(GO:0045335) |
| 1.1 | 8.5 | GO:0005952 | cAMP-dependent protein kinase complex(GO:0005952) |
| 1.1 | 20.0 | GO:0016460 | myosin II complex(GO:0016460) |
| 1.0 | 12.5 | GO:0005736 | DNA-directed RNA polymerase I complex(GO:0005736) |
| 1.0 | 5.1 | GO:0061700 | GATOR2 complex(GO:0061700) |
| 1.0 | 6.0 | GO:0030914 | STAGA complex(GO:0030914) |
| 1.0 | 31.0 | GO:0099738 | cell cortex region(GO:0099738) |
| 1.0 | 13.5 | GO:0017119 | Golgi transport complex(GO:0017119) |
| 1.0 | 122.7 | GO:0001726 | ruffle(GO:0001726) |
| 1.0 | 88.0 | GO:0016605 | PML body(GO:0016605) |
| 0.9 | 11.3 | GO:0005697 | telomerase holoenzyme complex(GO:0005697) |
| 0.9 | 27.1 | GO:0032040 | small-subunit processome(GO:0032040) |
| 0.9 | 112.0 | GO:0001650 | fibrillar center(GO:0001650) |
| 0.9 | 6.1 | GO:0035068 | micro-ribonucleoprotein complex(GO:0035068) |
| 0.9 | 5.1 | GO:0043202 | lysosomal lumen(GO:0043202) |
| 0.8 | 16.0 | GO:0032588 | trans-Golgi network membrane(GO:0032588) |
| 0.8 | 27.1 | GO:0030864 | cortical actin cytoskeleton(GO:0030864) |
| 0.8 | 4.1 | GO:1903767 | sweet taste receptor complex(GO:1903767) taste receptor complex(GO:1903768) |
| 0.8 | 83.6 | GO:0031234 | extrinsic component of cytoplasmic side of plasma membrane(GO:0031234) |
| 0.8 | 47.8 | GO:0030139 | endocytic vesicle(GO:0030139) |
| 0.8 | 68.8 | GO:0017053 | transcriptional repressor complex(GO:0017053) |
| 0.8 | 4.7 | GO:0044322 | endoplasmic reticulum quality control compartment(GO:0044322) |
| 0.8 | 3.8 | GO:0033588 | Elongator holoenzyme complex(GO:0033588) |
| 0.8 | 35.7 | GO:0016328 | lateral plasma membrane(GO:0016328) |
| 0.8 | 29.3 | GO:0005657 | replication fork(GO:0005657) |
| 0.7 | 72.4 | GO:0090575 | RNA polymerase II transcription factor complex(GO:0090575) |
| 0.7 | 51.8 | GO:0019005 | SCF ubiquitin ligase complex(GO:0019005) |
| 0.7 | 51.7 | GO:0000922 | spindle pole(GO:0000922) |
| 0.7 | 4.7 | GO:0030688 | preribosome, small subunit precursor(GO:0030688) |
| 0.7 | 9.3 | GO:0035145 | exon-exon junction complex(GO:0035145) |
| 0.6 | 15.2 | GO:1990391 | DNA repair complex(GO:1990391) |
| 0.6 | 12.0 | GO:0005640 | nuclear outer membrane(GO:0005640) |
| 0.6 | 8.2 | GO:0033179 | proton-transporting V-type ATPase, V0 domain(GO:0033179) |
| 0.6 | 8.9 | GO:0000346 | transcription export complex(GO:0000346) |
| 0.6 | 8.8 | GO:0044665 | MLL1/2 complex(GO:0044665) MLL1 complex(GO:0071339) |
| 0.6 | 22.8 | GO:0016235 | aggresome(GO:0016235) |
| 0.6 | 9.5 | GO:0005671 | Ada2/Gcn5/Ada3 transcription activator complex(GO:0005671) |
| 0.6 | 10.5 | GO:0008074 | guanylate cyclase complex, soluble(GO:0008074) |
| 0.5 | 4.4 | GO:0008290 | F-actin capping protein complex(GO:0008290) |
| 0.5 | 2.5 | GO:0001652 | granular component(GO:0001652) |
| 0.5 | 1.5 | GO:0098835 | presynaptic endocytic zone(GO:0098833) presynaptic endocytic zone membrane(GO:0098835) |
| 0.5 | 5.9 | GO:0030008 | TRAPP complex(GO:0030008) |
| 0.5 | 4.8 | GO:0044666 | MLL3/4 complex(GO:0044666) |
| 0.5 | 15.3 | GO:0045171 | intercellular bridge(GO:0045171) |
| 0.5 | 117.3 | GO:0005925 | focal adhesion(GO:0005925) |
| 0.5 | 2.3 | GO:0000808 | origin recognition complex(GO:0000808) nuclear origin of replication recognition complex(GO:0005664) |
| 0.4 | 10.8 | GO:0032153 | cell division site(GO:0032153) cell division site part(GO:0032155) |
| 0.4 | 5.4 | GO:0090544 | BAF-type complex(GO:0090544) |
| 0.4 | 21.2 | GO:0031594 | neuromuscular junction(GO:0031594) |
| 0.4 | 80.5 | GO:0005765 | lysosomal membrane(GO:0005765) lytic vacuole membrane(GO:0098852) |
| 0.4 | 0.8 | GO:0005682 | U5 snRNP(GO:0005682) |
| 0.4 | 83.4 | GO:0005764 | lytic vacuole(GO:0000323) lysosome(GO:0005764) |
| 0.4 | 5.4 | GO:0000164 | protein phosphatase type 1 complex(GO:0000164) |
| 0.4 | 37.0 | GO:0005814 | centriole(GO:0005814) |
| 0.4 | 87.5 | GO:0098857 | membrane raft(GO:0045121) membrane microdomain(GO:0098857) |
| 0.4 | 83.6 | GO:0005667 | transcription factor complex(GO:0005667) |
| 0.4 | 7.7 | GO:0005776 | autophagosome(GO:0005776) |
| 0.4 | 13.4 | GO:0000123 | histone acetyltransferase complex(GO:0000123) |
| 0.4 | 5.1 | GO:0000421 | autophagosome membrane(GO:0000421) |
| 0.3 | 86.6 | GO:0016607 | nuclear speck(GO:0016607) |
| 0.3 | 20.4 | GO:0000776 | kinetochore(GO:0000776) |
| 0.3 | 2.1 | GO:0042788 | polysomal ribosome(GO:0042788) |
| 0.3 | 16.0 | GO:0030426 | growth cone(GO:0030426) |
| 0.3 | 20.4 | GO:0005793 | endoplasmic reticulum-Golgi intermediate compartment(GO:0005793) |
| 0.3 | 6.5 | GO:0035327 | transcriptionally active chromatin(GO:0035327) |
| 0.3 | 4.7 | GO:0030014 | CCR4-NOT complex(GO:0030014) |
| 0.2 | 5.0 | GO:0080008 | Cul4-RING E3 ubiquitin ligase complex(GO:0080008) |
| 0.2 | 5.0 | GO:0015030 | Cajal body(GO:0015030) |
| 0.2 | 2.6 | GO:0016327 | apicolateral plasma membrane(GO:0016327) |
| 0.2 | 4.6 | GO:0034364 | high-density lipoprotein particle(GO:0034364) |
| 0.2 | 29.7 | GO:0044306 | neuron projection terminus(GO:0044306) |
| 0.2 | 71.6 | GO:0005768 | endosome(GO:0005768) |
| 0.2 | 14.9 | GO:0032993 | protein-DNA complex(GO:0032993) |
| 0.1 | 53.0 | GO:0048471 | perinuclear region of cytoplasm(GO:0048471) |
| 0.1 | 9.5 | GO:0000784 | nuclear chromosome, telomeric region(GO:0000784) |
| 0.1 | 1.5 | GO:0098799 | outer mitochondrial membrane protein complex(GO:0098799) |
| 0.1 | 7.4 | GO:0031463 | Cul3-RING ubiquitin ligase complex(GO:0031463) |
| 0.1 | 1.8 | GO:1904115 | axon cytoplasm(GO:1904115) |
| 0.1 | 4.0 | GO:0030173 | integral component of Golgi membrane(GO:0030173) |
| 0.1 | 1.1 | GO:0032039 | integrator complex(GO:0032039) |
| 0.0 | 0.6 | GO:0060077 | inhibitory synapse(GO:0060077) |
| 0.0 | 5.8 | GO:0043235 | receptor complex(GO:0043235) |
Gene overrepresentation in molecular function category:
| Log-likelihood per target | Total log-likelihood | Term | Description |
|---|---|---|---|
| 24.8 | 74.5 | GO:0005157 | macrophage colony-stimulating factor receptor binding(GO:0005157) |
| 24.4 | 97.4 | GO:0042610 | CD8 receptor binding(GO:0042610) |
| 20.3 | 81.1 | GO:0035877 | death effector domain binding(GO:0035877) |
| 17.5 | 52.4 | GO:0004911 | interleukin-2 receptor activity(GO:0004911) |
| 13.9 | 97.5 | GO:0035375 | zymogen binding(GO:0035375) |
| 13.8 | 41.5 | GO:0034211 | GTP-dependent protein kinase activity(GO:0034211) |
| 13.8 | 55.2 | GO:0045159 | myosin II binding(GO:0045159) |
| 13.4 | 134.3 | GO:0019957 | C-C chemokine binding(GO:0019957) |
| 11.7 | 35.2 | GO:0051916 | granulocyte colony-stimulating factor binding(GO:0051916) |
| 11.7 | 70.0 | GO:0046624 | sphingolipid transporter activity(GO:0046624) |
| 11.5 | 103.9 | GO:0005001 | transmembrane receptor protein tyrosine phosphatase activity(GO:0005001) transmembrane receptor protein phosphatase activity(GO:0019198) |
| 11.4 | 68.2 | GO:0035662 | Toll-like receptor 4 binding(GO:0035662) |
| 11.1 | 55.4 | GO:0003886 | DNA (cytosine-5-)-methyltransferase activity(GO:0003886) |
| 10.6 | 31.8 | GO:0046935 | 1-phosphatidylinositol-3-kinase regulator activity(GO:0046935) |
| 10.1 | 70.4 | GO:0035312 | 5'-3' exodeoxyribonuclease activity(GO:0035312) |
| 10.0 | 60.0 | GO:0035650 | AP-1 adaptor complex binding(GO:0035650) |
| 8.8 | 229.3 | GO:0005070 | SH3/SH2 adaptor activity(GO:0005070) |
| 8.2 | 49.2 | GO:0008349 | MAP kinase kinase kinase kinase activity(GO:0008349) |
| 8.0 | 24.0 | GO:0001069 | regulatory region RNA binding(GO:0001069) |
| 7.5 | 37.4 | GO:0030229 | very-low-density lipoprotein particle receptor activity(GO:0030229) |
| 7.3 | 43.9 | GO:0030284 | estrogen receptor activity(GO:0030284) |
| 7.2 | 21.5 | GO:0071208 | histone pre-mRNA DCP binding(GO:0071208) |
| 7.1 | 121.3 | GO:0036312 | phosphatidylinositol 3-kinase regulatory subunit binding(GO:0036312) |
| 6.7 | 20.0 | GO:0097677 | STAT family protein binding(GO:0097677) |
| 6.6 | 59.0 | GO:0030957 | Tat protein binding(GO:0030957) |
| 6.4 | 19.1 | GO:0004566 | beta-glucuronidase activity(GO:0004566) |
| 6.3 | 31.6 | GO:0061676 | importin-alpha family protein binding(GO:0061676) |
| 6.3 | 75.4 | GO:0071933 | Arp2/3 complex binding(GO:0071933) |
| 6.1 | 36.5 | GO:0034647 | histone demethylase activity (H3-trimethyl-K4 specific)(GO:0034647) |
| 5.9 | 17.8 | GO:0017089 | glycolipid transporter activity(GO:0017089) |
| 5.7 | 17.2 | GO:0008384 | IkappaB kinase activity(GO:0008384) |
| 5.7 | 45.6 | GO:0019958 | C-X-C chemokine receptor activity(GO:0016494) C-X-C chemokine binding(GO:0019958) |
| 5.6 | 39.5 | GO:0043423 | 3-phosphoinositide-dependent protein kinase binding(GO:0043423) |
| 5.6 | 44.9 | GO:0051525 | NFAT protein binding(GO:0051525) |
| 5.5 | 121.7 | GO:0030676 | Rac guanyl-nucleotide exchange factor activity(GO:0030676) |
| 5.4 | 16.2 | GO:0002114 | interleukin-33 receptor activity(GO:0002114) |
| 5.4 | 139.6 | GO:0004190 | aspartic-type endopeptidase activity(GO:0004190) |
| 5.3 | 85.4 | GO:0008329 | signaling pattern recognition receptor activity(GO:0008329) pattern recognition receptor activity(GO:0038187) |
| 5.3 | 106.5 | GO:0032794 | GTPase activating protein binding(GO:0032794) |
| 5.3 | 47.3 | GO:1990948 | ligase inhibitor activity(GO:0055104) ubiquitin ligase inhibitor activity(GO:1990948) |
| 5.0 | 14.9 | GO:0070506 | high-density lipoprotein particle receptor activity(GO:0070506) |
| 4.5 | 13.6 | GO:0035800 | deubiquitinase activator activity(GO:0035800) |
| 4.5 | 9.0 | GO:0004045 | aminoacyl-tRNA hydrolase activity(GO:0004045) |
| 4.4 | 26.3 | GO:0043141 | ATP-dependent 5'-3' DNA helicase activity(GO:0043141) |
| 4.3 | 34.2 | GO:0001784 | phosphotyrosine binding(GO:0001784) |
| 4.2 | 12.6 | GO:1990050 | phosphatidic acid transporter activity(GO:1990050) |
| 4.1 | 28.7 | GO:0016176 | superoxide-generating NADPH oxidase activator activity(GO:0016176) |
| 3.9 | 15.7 | GO:0048408 | epidermal growth factor binding(GO:0048408) |
| 3.9 | 39.0 | GO:0015386 | potassium:proton antiporter activity(GO:0015386) |
| 3.9 | 31.1 | GO:0017070 | U6 snRNA binding(GO:0017070) |
| 3.8 | 15.2 | GO:0004677 | DNA-dependent protein kinase activity(GO:0004677) |
| 3.8 | 37.9 | GO:0038036 | sphingosine-1-phosphate receptor activity(GO:0038036) |
| 3.8 | 30.3 | GO:0034513 | box H/ACA snoRNA binding(GO:0034513) |
| 3.8 | 112.5 | GO:0042169 | SH2 domain binding(GO:0042169) |
| 3.7 | 59.6 | GO:0051400 | BH domain binding(GO:0051400) |
| 3.7 | 18.6 | GO:0001042 | RNA polymerase I core binding(GO:0001042) |
| 3.6 | 28.7 | GO:0016936 | galactoside binding(GO:0016936) |
| 3.5 | 67.0 | GO:0003993 | acid phosphatase activity(GO:0003993) |
| 3.5 | 34.8 | GO:0000774 | adenyl-nucleotide exchange factor activity(GO:0000774) |
| 3.4 | 17.2 | GO:0070180 | large ribosomal subunit rRNA binding(GO:0070180) 5.8S rRNA binding(GO:1990932) |
| 3.3 | 20.0 | GO:0016361 | activin receptor activity, type I(GO:0016361) |
| 3.3 | 13.3 | GO:0050815 | phosphoserine binding(GO:0050815) |
| 3.3 | 9.8 | GO:0016429 | tRNA (adenine-N1-)-methyltransferase activity(GO:0016429) |
| 3.2 | 12.6 | GO:0046934 | phosphatidylinositol-4,5-bisphosphate 3-kinase activity(GO:0046934) phosphatidylinositol bisphosphate kinase activity(GO:0052813) |
| 3.1 | 9.4 | GO:0031727 | CCR2 chemokine receptor binding(GO:0031727) |
| 3.1 | 21.6 | GO:0098599 | palmitoyl-(protein) hydrolase activity(GO:0008474) palmitoyl hydrolase activity(GO:0098599) |
| 3.1 | 61.6 | GO:0043325 | phosphatidylinositol-3,4-bisphosphate binding(GO:0043325) |
| 3.1 | 45.8 | GO:0008574 | ATP-dependent microtubule motor activity, plus-end-directed(GO:0008574) |
| 3.0 | 30.4 | GO:0070097 | delta-catenin binding(GO:0070097) |
| 3.0 | 33.2 | GO:0004653 | polypeptide N-acetylgalactosaminyltransferase activity(GO:0004653) |
| 3.0 | 12.0 | GO:0043533 | inositol hexakisphosphate binding(GO:0000822) inositol 1,3,4,5 tetrakisphosphate binding(GO:0043533) |
| 2.9 | 20.4 | GO:0097322 | 7SK snRNA binding(GO:0097322) |
| 2.9 | 26.1 | GO:0001727 | lipid kinase activity(GO:0001727) |
| 2.9 | 8.7 | GO:0016230 | sphingomyelin phosphodiesterase activator activity(GO:0016230) |
| 2.9 | 409.7 | GO:0017124 | SH3 domain binding(GO:0017124) |
| 2.8 | 14.2 | GO:0015616 | DNA translocase activity(GO:0015616) |
| 2.8 | 8.5 | GO:0004691 | cAMP-dependent protein kinase activity(GO:0004691) |
| 2.8 | 8.4 | GO:0003945 | N-acetyllactosamine synthase activity(GO:0003945) |
| 2.7 | 57.7 | GO:0023026 | MHC class II protein complex binding(GO:0023026) |
| 2.7 | 8.0 | GO:0032564 | dATP binding(GO:0032564) |
| 2.6 | 30.9 | GO:0017166 | vinculin binding(GO:0017166) |
| 2.6 | 46.2 | GO:0070064 | proline-rich region binding(GO:0070064) |
| 2.5 | 22.5 | GO:0008409 | 5'-3' exonuclease activity(GO:0008409) |
| 2.5 | 175.5 | GO:0005089 | Rho guanyl-nucleotide exchange factor activity(GO:0005089) |
| 2.4 | 17.1 | GO:0004652 | polynucleotide adenylyltransferase activity(GO:0004652) |
| 2.4 | 9.8 | GO:0043120 | tumor necrosis factor binding(GO:0043120) |
| 2.4 | 29.1 | GO:0035925 | mRNA 3'-UTR AU-rich region binding(GO:0035925) |
| 2.4 | 12.1 | GO:0001032 | RNA polymerase III type 3 promoter DNA binding(GO:0001032) |
| 2.3 | 51.6 | GO:0004033 | aldo-keto reductase (NADP) activity(GO:0004033) |
| 2.3 | 9.4 | GO:0008140 | cAMP response element binding protein binding(GO:0008140) |
| 2.3 | 49.1 | GO:0005521 | lamin binding(GO:0005521) |
| 2.3 | 58.0 | GO:0031489 | myosin V binding(GO:0031489) |
| 2.3 | 16.0 | GO:1901612 | cardiolipin binding(GO:1901612) |
| 2.3 | 45.5 | GO:0004435 | phosphatidylinositol phospholipase C activity(GO:0004435) |
| 2.2 | 81.7 | GO:0022829 | wide pore channel activity(GO:0022829) |
| 2.2 | 13.1 | GO:0051022 | Rho GDP-dissociation inhibitor binding(GO:0051022) |
| 2.2 | 21.6 | GO:0102336 | fatty acid elongase activity(GO:0009922) 3-oxo-arachidoyl-CoA synthase activity(GO:0102336) 3-oxo-cerotoyl-CoA synthase activity(GO:0102337) 3-oxo-lignoceronyl-CoA synthase activity(GO:0102338) |
| 2.1 | 12.8 | GO:0034191 | apolipoprotein A-I receptor binding(GO:0034191) |
| 2.1 | 10.5 | GO:0031683 | G-protein beta/gamma-subunit complex binding(GO:0031683) |
| 1.9 | 526.6 | GO:0030695 | GTPase regulator activity(GO:0030695) |
| 1.9 | 53.2 | GO:0003887 | DNA-directed DNA polymerase activity(GO:0003887) |
| 1.9 | 11.2 | GO:0004340 | glucokinase activity(GO:0004340) hexokinase activity(GO:0004396) fructokinase activity(GO:0008865) mannokinase activity(GO:0019158) |
| 1.9 | 9.3 | GO:0032767 | copper-exporting ATPase activity(GO:0004008) copper-dependent protein binding(GO:0032767) copper-transporting ATPase activity(GO:0043682) |
| 1.9 | 11.2 | GO:0008467 | [heparan sulfate]-glucosamine 3-sulfotransferase 1 activity(GO:0008467) |
| 1.9 | 63.0 | GO:0008009 | chemokine activity(GO:0008009) |
| 1.8 | 9.2 | GO:0046966 | thyroid hormone receptor binding(GO:0046966) |
| 1.8 | 81.7 | GO:0017080 | sodium channel regulator activity(GO:0017080) |
| 1.8 | 21.6 | GO:0050897 | cobalt ion binding(GO:0050897) |
| 1.8 | 16.0 | GO:0003958 | NADPH-hemoprotein reductase activity(GO:0003958) |
| 1.8 | 17.7 | GO:0033170 | DNA clamp loader activity(GO:0003689) protein-DNA loading ATPase activity(GO:0033170) |
| 1.8 | 56.7 | GO:1990841 | promoter-specific chromatin binding(GO:1990841) |
| 1.8 | 35.1 | GO:0005388 | calcium-transporting ATPase activity(GO:0005388) |
| 1.7 | 30.2 | GO:0004697 | protein kinase C activity(GO:0004697) |
| 1.7 | 59.9 | GO:0017112 | Rab guanyl-nucleotide exchange factor activity(GO:0017112) |
| 1.7 | 8.3 | GO:0046976 | histone methyltransferase activity (H3-K27 specific)(GO:0046976) |
| 1.6 | 13.2 | GO:0017049 | GTP-Rho binding(GO:0017049) |
| 1.6 | 8.2 | GO:0030348 | syntaxin-3 binding(GO:0030348) |
| 1.6 | 39.0 | GO:0043027 | cysteine-type endopeptidase inhibitor activity involved in apoptotic process(GO:0043027) |
| 1.6 | 17.8 | GO:0008641 | small protein activating enzyme activity(GO:0008641) |
| 1.6 | 75.2 | GO:0001105 | RNA polymerase II transcription coactivator activity(GO:0001105) |
| 1.6 | 64.8 | GO:0030544 | Hsp70 protein binding(GO:0030544) |
| 1.6 | 11.0 | GO:0050700 | CARD domain binding(GO:0050700) |
| 1.6 | 4.7 | GO:0008169 | C-methyltransferase activity(GO:0008169) |
| 1.6 | 12.4 | GO:0032036 | myosin heavy chain binding(GO:0032036) |
| 1.5 | 16.5 | GO:0000295 | adenine nucleotide transmembrane transporter activity(GO:0000295) purine ribonucleotide transmembrane transporter activity(GO:0005346) |
| 1.5 | 6.0 | GO:0009019 | tRNA (guanine-N1-)-methyltransferase activity(GO:0009019) |
| 1.5 | 17.7 | GO:0034450 | ubiquitin-ubiquitin ligase activity(GO:0034450) |
| 1.5 | 14.5 | GO:0070300 | phosphatidic acid binding(GO:0070300) |
| 1.4 | 8.6 | GO:0003917 | DNA topoisomerase type I activity(GO:0003917) |
| 1.4 | 14.3 | GO:0001135 | transcription factor activity, RNA polymerase II transcription factor recruiting(GO:0001135) |
| 1.4 | 12.9 | GO:1990825 | sequence-specific mRNA binding(GO:1990825) |
| 1.4 | 5.6 | GO:0070568 | guanylyltransferase activity(GO:0070568) |
| 1.4 | 15.4 | GO:1990381 | ubiquitin-specific protease binding(GO:1990381) |
| 1.4 | 28.9 | GO:0005487 | nucleocytoplasmic transporter activity(GO:0005487) |
| 1.3 | 68.2 | GO:0019843 | rRNA binding(GO:0019843) |
| 1.3 | 13.3 | GO:1901702 | urate transmembrane transporter activity(GO:0015143) salt transmembrane transporter activity(GO:1901702) |
| 1.3 | 21.2 | GO:0098641 | cadherin binding involved in cell-cell adhesion(GO:0098641) |
| 1.3 | 27.4 | GO:0048027 | mRNA 5'-UTR binding(GO:0048027) |
| 1.3 | 14.2 | GO:0051011 | microtubule minus-end binding(GO:0051011) |
| 1.3 | 53.8 | GO:0004715 | non-membrane spanning protein tyrosine kinase activity(GO:0004715) |
| 1.3 | 7.7 | GO:1990247 | N6-methyladenosine-containing RNA binding(GO:1990247) |
| 1.3 | 81.8 | GO:0004004 | RNA helicase activity(GO:0003724) ATP-dependent RNA helicase activity(GO:0004004) |
| 1.3 | 2.5 | GO:0055100 | adiponectin binding(GO:0055100) |
| 1.2 | 53.2 | GO:0016684 | peroxidase activity(GO:0004601) oxidoreductase activity, acting on peroxide as acceptor(GO:0016684) |
| 1.2 | 8.6 | GO:0043024 | ribosomal small subunit binding(GO:0043024) |
| 1.2 | 22.1 | GO:0015279 | store-operated calcium channel activity(GO:0015279) |
| 1.2 | 3.6 | GO:0004830 | tryptophan-tRNA ligase activity(GO:0004830) |
| 1.2 | 33.8 | GO:0001106 | RNA polymerase II transcription corepressor activity(GO:0001106) |
| 1.2 | 24.0 | GO:0043548 | phosphatidylinositol 3-kinase binding(GO:0043548) |
| 1.2 | 178.8 | GO:0051015 | actin filament binding(GO:0051015) |
| 1.2 | 3.5 | GO:0019961 | interferon binding(GO:0019961) |
| 1.2 | 419.5 | GO:0005525 | GTP binding(GO:0005525) |
| 1.2 | 47.3 | GO:1990782 | protein tyrosine kinase binding(GO:1990782) |
| 1.2 | 8.1 | GO:1990446 | U1 snRNP binding(GO:1990446) |
| 1.2 | 12.7 | GO:0042577 | lipid phosphatase activity(GO:0042577) |
| 1.1 | 12.6 | GO:0017160 | Ral GTPase binding(GO:0017160) |
| 1.1 | 4.5 | GO:0004082 | bisphosphoglycerate mutase activity(GO:0004082) phosphoglycerate mutase activity(GO:0004619) 2,3-bisphosphoglycerate-dependent phosphoglycerate mutase activity(GO:0046538) |
| 1.1 | 6.7 | GO:0003923 | GPI-anchor transamidase activity(GO:0003923) |
| 1.1 | 65.2 | GO:0035064 | methylated histone binding(GO:0035064) |
| 1.1 | 38.5 | GO:0003755 | peptidyl-prolyl cis-trans isomerase activity(GO:0003755) |
| 1.1 | 7.4 | GO:0097027 | ubiquitin-protein transferase activator activity(GO:0097027) |
| 1.0 | 7.3 | GO:0035251 | UDP-glucosyltransferase activity(GO:0035251) |
| 1.0 | 4.1 | GO:0097001 | interleukin-4 receptor binding(GO:0005136) ceramide binding(GO:0097001) |
| 1.0 | 4.1 | GO:0003842 | 1-pyrroline-5-carboxylate dehydrogenase activity(GO:0003842) |
| 1.0 | 5.1 | GO:0050733 | RS domain binding(GO:0050733) |
| 1.0 | 4.0 | GO:0001093 | TFIIB-class transcription factor binding(GO:0001093) |
| 1.0 | 41.0 | GO:0004869 | cysteine-type endopeptidase inhibitor activity(GO:0004869) |
| 1.0 | 6.9 | GO:0034452 | dynactin binding(GO:0034452) |
| 1.0 | 26.7 | GO:0003697 | single-stranded DNA binding(GO:0003697) |
| 1.0 | 3.9 | GO:0005522 | profilin binding(GO:0005522) |
| 1.0 | 23.6 | GO:0008527 | taste receptor activity(GO:0008527) |
| 1.0 | 53.2 | GO:0004386 | helicase activity(GO:0004386) |
| 1.0 | 35.5 | GO:0005164 | tumor necrosis factor receptor binding(GO:0005164) |
| 0.9 | 7.5 | GO:1990380 | Lys48-specific deubiquitinase activity(GO:1990380) |
| 0.9 | 3.7 | GO:0061575 | cyclin-dependent protein serine/threonine kinase activator activity(GO:0061575) |
| 0.9 | 2.8 | GO:0004814 | arginine-tRNA ligase activity(GO:0004814) |
| 0.9 | 9.1 | GO:0003688 | DNA replication origin binding(GO:0003688) |
| 0.9 | 53.4 | GO:0004527 | exonuclease activity(GO:0004527) |
| 0.9 | 19.8 | GO:0030515 | snoRNA binding(GO:0030515) |
| 0.9 | 36.9 | GO:0005044 | scavenger receptor activity(GO:0005044) |
| 0.9 | 3.5 | GO:0004965 | G-protein coupled GABA receptor activity(GO:0004965) |
| 0.8 | 6.8 | GO:0046703 | natural killer cell lectin-like receptor binding(GO:0046703) |
| 0.8 | 33.3 | GO:0004180 | carboxypeptidase activity(GO:0004180) |
| 0.8 | 1.6 | GO:0004629 | phospholipase C activity(GO:0004629) |
| 0.8 | 23.6 | GO:0001221 | transcription cofactor binding(GO:0001221) |
| 0.7 | 2.2 | GO:0004809 | tRNA (guanine-N2-)-methyltransferase activity(GO:0004809) |
| 0.7 | 3.7 | GO:0005105 | type 1 fibroblast growth factor receptor binding(GO:0005105) |
| 0.7 | 12.9 | GO:0016922 | ligand-dependent nuclear receptor binding(GO:0016922) |
| 0.7 | 33.9 | GO:0031491 | nucleosome binding(GO:0031491) |
| 0.7 | 13.3 | GO:0010485 | H4 histone acetyltransferase activity(GO:0010485) |
| 0.7 | 14.6 | GO:0004012 | phospholipid-translocating ATPase activity(GO:0004012) |
| 0.7 | 2.0 | GO:0004827 | proline-tRNA ligase activity(GO:0004827) |
| 0.7 | 32.5 | GO:0000049 | tRNA binding(GO:0000049) |
| 0.6 | 20.7 | GO:0043425 | bHLH transcription factor binding(GO:0043425) |
| 0.6 | 243.8 | GO:0050839 | cell adhesion molecule binding(GO:0050839) |
| 0.6 | 19.7 | GO:0001104 | RNA polymerase II transcription cofactor activity(GO:0001104) |
| 0.6 | 15.5 | GO:0042162 | telomeric DNA binding(GO:0042162) |
| 0.6 | 3.1 | GO:0008318 | protein prenyltransferase activity(GO:0008318) |
| 0.6 | 22.5 | GO:0001228 | transcriptional activator activity, RNA polymerase II transcription regulatory region sequence-specific binding(GO:0001228) |
| 0.6 | 1.8 | GO:0016882 | cyclo-ligase activity(GO:0016882) |
| 0.6 | 2.3 | GO:0010997 | anaphase-promoting complex binding(GO:0010997) |
| 0.6 | 11.1 | GO:0004559 | alpha-mannosidase activity(GO:0004559) |
| 0.5 | 2.2 | GO:0019003 | GDP binding(GO:0019003) |
| 0.5 | 9.0 | GO:0005537 | mannose binding(GO:0005537) |
| 0.5 | 2.1 | GO:0002046 | opsin binding(GO:0002046) |
| 0.5 | 52.7 | GO:0004702 | receptor signaling protein serine/threonine kinase activity(GO:0004702) |
| 0.5 | 5.5 | GO:0008242 | omega peptidase activity(GO:0008242) |
| 0.5 | 14.3 | GO:0005080 | protein kinase C binding(GO:0005080) |
| 0.5 | 132.2 | GO:0003712 | transcription cofactor activity(GO:0003712) |
| 0.5 | 16.9 | GO:0019894 | kinesin binding(GO:0019894) |
| 0.5 | 22.7 | GO:0005057 | receptor signaling protein activity(GO:0005057) |
| 0.4 | 2.2 | GO:0005021 | vascular endothelial growth factor-activated receptor activity(GO:0005021) |
| 0.4 | 11.8 | GO:0031369 | translation initiation factor binding(GO:0031369) |
| 0.4 | 45.8 | GO:0017016 | Ras GTPase binding(GO:0017016) |
| 0.4 | 8.2 | GO:0070006 | metalloaminopeptidase activity(GO:0070006) |
| 0.4 | 9.2 | GO:0043236 | laminin binding(GO:0043236) |
| 0.4 | 6.4 | GO:0008094 | DNA-dependent ATPase activity(GO:0008094) |
| 0.4 | 3.4 | GO:0047498 | calcium-dependent phospholipase A2 activity(GO:0047498) |
| 0.4 | 4.8 | GO:0015643 | toxic substance binding(GO:0015643) |
| 0.4 | 5.2 | GO:0002162 | dystroglycan binding(GO:0002162) |
| 0.4 | 9.1 | GO:0005546 | phosphatidylinositol-4,5-bisphosphate binding(GO:0005546) |
| 0.4 | 12.0 | GO:0031624 | ubiquitin conjugating enzyme binding(GO:0031624) |
| 0.4 | 2.5 | GO:0004767 | sphingomyelin phosphodiesterase activity(GO:0004767) |
| 0.4 | 12.2 | GO:0003684 | damaged DNA binding(GO:0003684) |
| 0.4 | 7.2 | GO:0050699 | WW domain binding(GO:0050699) |
| 0.4 | 6.0 | GO:0000993 | RNA polymerase II core binding(GO:0000993) |
| 0.4 | 8.4 | GO:0000030 | mannosyltransferase activity(GO:0000030) |
| 0.3 | 30.3 | GO:0008565 | protein transporter activity(GO:0008565) |
| 0.3 | 9.0 | GO:0051219 | phosphoprotein binding(GO:0051219) |
| 0.3 | 2.1 | GO:0004931 | extracellular ATP-gated cation channel activity(GO:0004931) ATP-gated ion channel activity(GO:0035381) |
| 0.3 | 1.4 | GO:0016303 | 1-phosphatidylinositol-3-kinase activity(GO:0016303) phosphatidylinositol 3-kinase activity(GO:0035004) |
| 0.3 | 7.6 | GO:0030145 | manganese ion binding(GO:0030145) |
| 0.3 | 2.7 | GO:0031490 | chromatin DNA binding(GO:0031490) |
| 0.3 | 20.3 | GO:0005085 | guanyl-nucleotide exchange factor activity(GO:0005085) |
| 0.3 | 18.0 | GO:0004843 | thiol-dependent ubiquitin-specific protease activity(GO:0004843) |
| 0.3 | 0.8 | GO:0000386 | second spliceosomal transesterification activity(GO:0000386) |
| 0.3 | 33.8 | GO:0019902 | phosphatase binding(GO:0019902) |
| 0.3 | 8.6 | GO:0019707 | protein-cysteine S-palmitoyltransferase activity(GO:0019706) protein-cysteine S-acyltransferase activity(GO:0019707) |
| 0.3 | 26.6 | GO:0008022 | protein C-terminus binding(GO:0008022) |
| 0.3 | 13.9 | GO:0004722 | protein serine/threonine phosphatase activity(GO:0004722) |
| 0.3 | 5.8 | GO:0035254 | glutamate receptor binding(GO:0035254) |
| 0.3 | 2.1 | GO:0008494 | translation activator activity(GO:0008494) |
| 0.3 | 1.8 | GO:0008603 | cAMP-dependent protein kinase regulator activity(GO:0008603) |
| 0.3 | 18.6 | GO:0005262 | calcium channel activity(GO:0005262) |
| 0.2 | 33.1 | GO:0008168 | methyltransferase activity(GO:0008168) |
| 0.2 | 30.8 | GO:0004866 | endopeptidase inhibitor activity(GO:0004866) |
| 0.2 | 233.0 | GO:0003723 | RNA binding(GO:0003723) |
| 0.2 | 123.5 | GO:0044212 | transcription regulatory region DNA binding(GO:0044212) |
| 0.2 | 1.3 | GO:0008934 | inositol monophosphate 1-phosphatase activity(GO:0008934) inositol monophosphate 3-phosphatase activity(GO:0052832) |
| 0.2 | 1.0 | GO:0097602 | cullin family protein binding(GO:0097602) |
| 0.2 | 2.9 | GO:0017127 | cholesterol transporter activity(GO:0017127) |
| 0.2 | 2.4 | GO:0046875 | ephrin receptor binding(GO:0046875) |
| 0.1 | 1.7 | GO:0008179 | adenylate cyclase binding(GO:0008179) |
| 0.1 | 0.4 | GO:0004515 | nicotinamide-nucleotide adenylyltransferase activity(GO:0000309) nicotinate-nucleotide adenylyltransferase activity(GO:0004515) |
| 0.1 | 2.9 | GO:0008013 | beta-catenin binding(GO:0008013) |
| 0.1 | 1.7 | GO:0017017 | MAP kinase tyrosine/serine/threonine phosphatase activity(GO:0017017) |
| 0.1 | 19.5 | GO:0005126 | cytokine receptor binding(GO:0005126) |
| 0.1 | 1.6 | GO:0070273 | phosphatidylinositol-4-phosphate binding(GO:0070273) |
| 0.1 | 5.6 | GO:0004860 | protein kinase inhibitor activity(GO:0004860) |
| 0.0 | 0.4 | GO:0032183 | SUMO binding(GO:0032183) |
| 0.0 | 3.4 | GO:0000981 | RNA polymerase II transcription factor activity, sequence-specific DNA binding(GO:0000981) |
| 0.0 | 8.7 | GO:0046982 | protein heterodimerization activity(GO:0046982) |
| 0.0 | 0.9 | GO:0005507 | copper ion binding(GO:0005507) |
| 0.0 | 0.2 | GO:0032266 | phosphatidylinositol-3-phosphate binding(GO:0032266) |
Gene overrepresentation in curated gene sets: canonical pathways category:
| Log-likelihood per target | Total log-likelihood | Term | Description |
|---|---|---|---|
| 12.4 | 819.1 | PID CD8 TCR PATHWAY | TCR signaling in naïve CD8+ T cells |
| 7.9 | 230.2 | PID INTEGRIN CS PATHWAY | Integrin family cell surface interactions |
| 7.4 | 81.1 | SA FAS SIGNALING | The TNF-type receptor Fas induces apoptosis on ligand binding. |
| 6.8 | 123.0 | SA MMP CYTOKINE CONNECTION | Cytokines can induce activation of matrix metalloproteinases, which degrade extracellular matrix. |
| 6.6 | 124.5 | PID TCR PATHWAY | TCR signaling in naïve CD4+ T cells |
| 5.6 | 96.0 | SA REG CASCADE OF CYCLIN EXPR | Expression of cyclins regulates progression through the cell cycle by activating cyclin-dependent kinases. |
| 5.6 | 50.4 | PID S1P S1P4 PATHWAY | S1P4 pathway |
| 5.1 | 242.0 | PID AURORA B PATHWAY | Aurora B signaling |
| 5.0 | 69.7 | PID THROMBIN PAR4 PATHWAY | PAR4-mediated thrombin signaling events |
| 4.8 | 116.3 | SA B CELL RECEPTOR COMPLEXES | Antigen binding to B cell receptors activates protein tyrosine kinases, such as the Src family, which ultimate activate MAP kinases. |
| 4.8 | 52.9 | SA PTEN PATHWAY | PTEN is a tumor suppressor that dephosphorylates the lipid messenger phosphatidylinositol triphosphate. |
| 4.5 | 99.9 | PID THROMBIN PAR1 PATHWAY | PAR1-mediated thrombin signaling events |
| 4.0 | 76.7 | PID DNA PK PATHWAY | DNA-PK pathway in nonhomologous end joining |
| 3.6 | 72.8 | PID GMCSF PATHWAY | GMCSF-mediated signaling events |
| 3.6 | 64.6 | PID CXCR3 PATHWAY | CXCR3-mediated signaling events |
| 3.6 | 131.7 | PID BCR 5PATHWAY | BCR signaling pathway |
| 3.5 | 187.4 | PID RAC1 PATHWAY | RAC1 signaling pathway |
| 3.5 | 62.3 | PID IL23 PATHWAY | IL23-mediated signaling events |
| 3.3 | 71.7 | PID CD40 PATHWAY | CD40/CD40L signaling |
| 3.2 | 22.1 | PID ERBB1 RECEPTOR PROXIMAL PATHWAY | EGF receptor (ErbB1) signaling pathway |
| 3.1 | 74.5 | PID KIT PATHWAY | Signaling events mediated by Stem cell factor receptor (c-Kit) |
| 3.1 | 61.7 | PID TOLL ENDOGENOUS PATHWAY | Endogenous TLR signaling |
| 3.0 | 90.8 | SIG INSULIN RECEPTOR PATHWAY IN CARDIAC MYOCYTES | Genes related to the insulin receptor pathway |
| 3.0 | 66.5 | PID IL2 1PATHWAY | IL2-mediated signaling events |
| 3.0 | 111.6 | PID VEGFR1 2 PATHWAY | Signaling events mediated by VEGFR1 and VEGFR2 |
| 3.0 | 62.9 | PID FCER1 PATHWAY | Fc-epsilon receptor I signaling in mast cells |
| 2.8 | 110.7 | PID ILK PATHWAY | Integrin-linked kinase signaling |
| 2.6 | 37.1 | SIG PIP3 SIGNALING IN B LYMPHOCYTES | Genes related to PIP3 signaling in B lymphocytes |
| 2.3 | 51.1 | PID P38 MKK3 6PATHWAY | p38 MAPK signaling pathway |
| 2.2 | 123.1 | PID RB 1PATHWAY | Regulation of retinoblastoma protein |
| 2.1 | 36.2 | PID INTEGRIN A9B1 PATHWAY | Alpha9 beta1 integrin signaling events |
| 2.0 | 12.2 | PID AJDISS 2PATHWAY | Posttranslational regulation of adherens junction stability and dissassembly |
| 2.0 | 40.5 | PID ECADHERIN NASCENT AJ PATHWAY | E-cadherin signaling in the nascent adherens junction |
| 2.0 | 72.4 | PID RAC1 REG PATHWAY | Regulation of RAC1 activity |
| 1.8 | 20.1 | PID P38 MK2 PATHWAY | p38 signaling mediated by MAPKAP kinases |
| 1.8 | 8.8 | PID IL2 STAT5 PATHWAY | IL2 signaling events mediated by STAT5 |
| 1.6 | 74.9 | ST FAS SIGNALING PATHWAY | Fas Signaling Pathway |
| 1.5 | 85.2 | PID CMYB PATHWAY | C-MYB transcription factor network |
| 1.5 | 55.4 | PID PDGFRB PATHWAY | PDGFR-beta signaling pathway |
| 1.5 | 96.2 | PID SMAD2 3NUCLEAR PATHWAY | Regulation of nuclear SMAD2/3 signaling |
| 1.3 | 17.1 | PID MYC PATHWAY | C-MYC pathway |
| 1.3 | 52.1 | PID P53 REGULATION PATHWAY | p53 pathway |
| 1.3 | 53.4 | PID MYC REPRESS PATHWAY | Validated targets of C-MYC transcriptional repression |
| 1.1 | 7.8 | PID TRAIL PATHWAY | TRAIL signaling pathway |
| 1.0 | 24.3 | PID RHOA PATHWAY | RhoA signaling pathway |
| 1.0 | 4.0 | SA G2 AND M PHASES | Cdc25 activates the cdc2/cyclin B complex to induce the G2/M transition. |
| 0.9 | 15.1 | PID ATM PATHWAY | ATM pathway |
| 0.8 | 6.6 | PID HDAC CLASSII PATHWAY | Signaling events mediated by HDAC Class II |
| 0.8 | 9.0 | PID SMAD2 3PATHWAY | Regulation of cytoplasmic and nuclear SMAD2/3 signaling |
| 0.7 | 33.0 | PID HDAC CLASSI PATHWAY | Signaling events mediated by HDAC Class I |
| 0.7 | 26.2 | PID E2F PATHWAY | E2F transcription factor network |
| 0.7 | 24.3 | PID TELOMERASE PATHWAY | Regulation of Telomerase |
| 0.7 | 14.0 | PID P38 ALPHA BETA DOWNSTREAM PATHWAY | Signaling mediated by p38-alpha and p38-beta |
| 0.6 | 3.8 | ST INTERFERON GAMMA PATHWAY | Interferon gamma pathway. |
| 0.6 | 8.7 | PID INSULIN GLUCOSE PATHWAY | Insulin-mediated glucose transport |
| 0.6 | 8.7 | PID ANGIOPOIETIN RECEPTOR PATHWAY | Angiopoietin receptor Tie2-mediated signaling |
| 0.5 | 15.5 | PID FANCONI PATHWAY | Fanconi anemia pathway |
| 0.4 | 101.6 | NABA ECM REGULATORS | Genes encoding enzymes and their regulators involved in the remodeling of the extracellular matrix |
| 0.4 | 1.6 | PID SYNDECAN 1 PATHWAY | Syndecan-1-mediated signaling events |
| 0.4 | 2.2 | PID VEGF VEGFR PATHWAY | VEGF and VEGFR signaling network |
| 0.3 | 23.4 | WNT SIGNALING | Genes related to Wnt-mediated signal transduction |
| 0.3 | 13.5 | PID AR PATHWAY | Coregulation of Androgen receptor activity |
| 0.3 | 5.6 | PID INTEGRIN2 PATHWAY | Beta2 integrin cell surface interactions |
| 0.3 | 9.5 | PID RXR VDR PATHWAY | RXR and RAR heterodimerization with other nuclear receptor |
| 0.3 | 8.4 | PID HES HEY PATHWAY | Notch-mediated HES/HEY network |
| 0.3 | 3.7 | PID FOXM1 PATHWAY | FOXM1 transcription factor network |
| 0.3 | 11.0 | PID MYC ACTIV PATHWAY | Validated targets of C-MYC transcriptional activation |
| 0.3 | 6.8 | PID IL4 2PATHWAY | IL4-mediated signaling events |
| 0.3 | 4.0 | PID ALPHA SYNUCLEIN PATHWAY | Alpha-synuclein signaling |
| 0.2 | 5.9 | PID HEDGEHOG GLI PATHWAY | Hedgehog signaling events mediated by Gli proteins |
| 0.2 | 17.7 | PID P53 DOWNSTREAM PATHWAY | Direct p53 effectors |
| 0.2 | 5.0 | PID TAP63 PATHWAY | Validated transcriptional targets of TAp63 isoforms |
| 0.2 | 8.2 | PID RHOA REG PATHWAY | Regulation of RhoA activity |
| 0.2 | 4.0 | PID AP1 PATHWAY | AP-1 transcription factor network |
| 0.1 | 4.5 | PID LKB1 PATHWAY | LKB1 signaling events |
| 0.1 | 28.0 | NABA ECM GLYCOPROTEINS | Genes encoding structural ECM glycoproteins |
| 0.1 | 1.8 | PID INTEGRIN A4B1 PATHWAY | Alpha4 beta1 integrin signaling events |
| 0.1 | 2.3 | PID PLK1 PATHWAY | PLK1 signaling events |
| 0.1 | 1.4 | PID ARF6 PATHWAY | Arf6 signaling events |
| 0.1 | 2.1 | PID ARF6 TRAFFICKING PATHWAY | Arf6 trafficking events |
Gene overrepresentation in curated gene sets: REACTOME pathways category:
| Log-likelihood per target | Total log-likelihood | Term | Description |
|---|---|---|---|
| 35.5 | 390.2 | REACTOME PHOSPHORYLATION OF CD3 AND TCR ZETA CHAINS | Genes involved in Phosphorylation of CD3 and TCR zeta chains |
| 11.0 | 176.1 | REACTOME SIGNAL REGULATORY PROTEIN SIRP FAMILY INTERACTIONS | Genes involved in Signal regulatory protein (SIRP) family interactions |
| 10.8 | 421.7 | REACTOME GPVI MEDIATED ACTIVATION CASCADE | Genes involved in GPVI-mediated activation cascade |
| 8.9 | 98.3 | REACTOME NFKB ACTIVATION THROUGH FADD RIP1 PATHWAY MEDIATED BY CASPASE 8 AND10 | Genes involved in NF-kB activation through FADD/RIP-1 pathway mediated by caspase-8 and -10 |
| 7.9 | 94.6 | REACTOME THE NLRP3 INFLAMMASOME | Genes involved in The NLRP3 inflammasome |
| 7.5 | 330.0 | REACTOME IMMUNOREGULATORY INTERACTIONS BETWEEN A LYMPHOID AND A NON LYMPHOID CELL | Genes involved in Immunoregulatory interactions between a Lymphoid and a non-Lymphoid cell |
| 6.9 | 27.5 | REACTOME BETA DEFENSINS | Genes involved in Beta defensins |
| 6.8 | 47.8 | REACTOME NEF MEDIATED DOWNREGULATION OF MHC CLASS I COMPLEX CELL SURFACE EXPRESSION | Genes involved in Nef mediated downregulation of MHC class I complex cell surface expression |
| 6.4 | 172.6 | REACTOME ANTIGEN ACTIVATES B CELL RECEPTOR LEADING TO GENERATION OF SECOND MESSENGERS | Genes involved in Antigen Activates B Cell Receptor Leading to Generation of Second Messengers |
| 5.9 | 76.9 | REACTOME DOWNSTREAM TCR SIGNALING | Genes involved in Downstream TCR signaling |
| 5.4 | 16.3 | REACTOME THE ROLE OF NEF IN HIV1 REPLICATION AND DISEASE PATHOGENESIS | Genes involved in The role of Nef in HIV-1 replication and disease pathogenesis |
| 4.8 | 82.0 | REACTOME CDC6 ASSOCIATION WITH THE ORC ORIGIN COMPLEX | Genes involved in CDC6 association with the ORC:origin complex |
| 4.6 | 45.5 | REACTOME REGULATION OF INSULIN SECRETION BY ACETYLCHOLINE | Genes involved in Regulation of Insulin Secretion by Acetylcholine |
| 4.4 | 136.9 | REACTOME KINESINS | Genes involved in Kinesins |
| 4.2 | 58.4 | REACTOME GENERATION OF SECOND MESSENGER MOLECULES | Genes involved in Generation of second messenger molecules |
| 4.1 | 116.0 | REACTOME BASIGIN INTERACTIONS | Genes involved in Basigin interactions |
| 4.1 | 94.4 | REACTOME IL RECEPTOR SHC SIGNALING | Genes involved in Interleukin receptor SHC signaling |
| 4.0 | 193.8 | REACTOME CHEMOKINE RECEPTORS BIND CHEMOKINES | Genes involved in Chemokine receptors bind chemokines |
| 3.9 | 15.6 | REACTOME ADP SIGNALLING THROUGH P2RY12 | Genes involved in ADP signalling through P2Y purinoceptor 12 |
| 3.0 | 9.0 | REACTOME CROSS PRESENTATION OF SOLUBLE EXOGENOUS ANTIGENS ENDOSOMES | Genes involved in Cross-presentation of soluble exogenous antigens (endosomes) |
| 2.8 | 290.1 | REACTOME PEPTIDE CHAIN ELONGATION | Genes involved in Peptide chain elongation |
| 2.8 | 30.8 | REACTOME GRB2 SOS PROVIDES LINKAGE TO MAPK SIGNALING FOR INTERGRINS | Genes involved in GRB2:SOS provides linkage to MAPK signaling for Intergrins |
| 2.5 | 80.9 | REACTOME SIGNALING BY ROBO RECEPTOR | Genes involved in Signaling by Robo receptor |
| 2.4 | 46.5 | REACTOME PRE NOTCH PROCESSING IN GOLGI | Genes involved in Pre-NOTCH Processing in Golgi |
| 2.4 | 14.5 | REACTOME RECEPTOR LIGAND BINDING INITIATES THE SECOND PROTEOLYTIC CLEAVAGE OF NOTCH RECEPTOR | Genes involved in Receptor-ligand binding initiates the second proteolytic cleavage of Notch receptor |
| 2.4 | 40.8 | REACTOME RAP1 SIGNALLING | Genes involved in Rap1 signalling |
| 2.4 | 177.4 | REACTOME G ALPHA1213 SIGNALLING EVENTS | Genes involved in G alpha (12/13) signalling events |
| 2.4 | 25.9 | REACTOME REMOVAL OF THE FLAP INTERMEDIATE FROM THE C STRAND | Genes involved in Removal of the Flap Intermediate from the C-strand |
| 2.2 | 22.0 | REACTOME CALNEXIN CALRETICULIN CYCLE | Genes involved in Calnexin/calreticulin cycle |
| 2.2 | 15.2 | REACTOME REGULATION OF THE FANCONI ANEMIA PATHWAY | Genes involved in Regulation of the Fanconi anemia pathway |
| 2.0 | 177.0 | REACTOME SIGNALING BY RHO GTPASES | Genes involved in Signaling by Rho GTPases |
| 2.0 | 21.5 | REACTOME SLBP DEPENDENT PROCESSING OF REPLICATION DEPENDENT HISTONE PRE MRNAS | Genes involved in SLBP Dependent Processing of Replication-Dependent Histone Pre-mRNAs |
| 1.9 | 64.2 | REACTOME TIGHT JUNCTION INTERACTIONS | Genes involved in Tight junction interactions |
| 1.8 | 91.3 | REACTOME TRANSPORT OF MATURE TRANSCRIPT TO CYTOPLASM | Genes involved in Transport of Mature Transcript to Cytoplasm |
| 1.7 | 58.8 | REACTOME MRNA SPLICING MINOR PATHWAY | Genes involved in mRNA Splicing - Minor Pathway |
| 1.7 | 29.4 | REACTOME TRAF6 MEDIATED IRF7 ACTIVATION | Genes involved in TRAF6 mediated IRF7 activation |
| 1.7 | 25.4 | REACTOME MRNA DECAY BY 5 TO 3 EXORIBONUCLEASE | Genes involved in mRNA Decay by 5' to 3' Exoribonuclease |
| 1.7 | 45.1 | REACTOME SMAD2 SMAD3 SMAD4 HETEROTRIMER REGULATES TRANSCRIPTION | Genes involved in SMAD2/SMAD3:SMAD4 heterotrimer regulates transcription |
| 1.7 | 31.6 | REACTOME SYNTHESIS OF GLYCOSYLPHOSPHATIDYLINOSITOL GPI | Genes involved in Synthesis of glycosylphosphatidylinositol (GPI) |
| 1.6 | 11.5 | REACTOME INFLAMMASOMES | Genes involved in Inflammasomes |
| 1.6 | 6.5 | REACTOME ADP SIGNALLING THROUGH P2RY1 | Genes involved in ADP signalling through P2Y purinoceptor 1 |
| 1.5 | 37.0 | REACTOME G1 PHASE | Genes involved in G1 Phase |
| 1.5 | 20.0 | REACTOME REGULATION OF IFNG SIGNALING | Genes involved in Regulation of IFNG signaling |
| 1.4 | 14.0 | REACTOME ACTIVATION OF CHAPERONE GENES BY ATF6 ALPHA | Genes involved in Activation of Chaperone Genes by ATF6-alpha |
| 1.3 | 20.5 | REACTOME METABOLISM OF NON CODING RNA | Genes involved in Metabolism of non-coding RNA |
| 1.3 | 8.8 | REACTOME INTERACTIONS OF VPR WITH HOST CELLULAR PROTEINS | Genes involved in Interactions of Vpr with host cellular proteins |
| 1.2 | 72.1 | REACTOME MRNA SPLICING | Genes involved in mRNA Splicing |
| 1.2 | 9.6 | REACTOME SIGNALING BY CONSTITUTIVELY ACTIVE EGFR | Genes involved in Signaling by constitutively active EGFR |
| 1.2 | 14.3 | REACTOME TRAFFICKING AND PROCESSING OF ENDOSOMAL TLR | Genes involved in Trafficking and processing of endosomal TLR |
| 1.2 | 42.7 | REACTOME COSTIMULATION BY THE CD28 FAMILY | Genes involved in Costimulation by the CD28 family |
| 1.1 | 16.9 | REACTOME ENOS ACTIVATION AND REGULATION | Genes involved in eNOS activation and regulation |
| 1.1 | 20.0 | REACTOME HS GAG DEGRADATION | Genes involved in HS-GAG degradation |
| 1.1 | 19.3 | REACTOME LYSOSOME VESICLE BIOGENESIS | Genes involved in Lysosome Vesicle Biogenesis |
| 1.0 | 35.1 | REACTOME LATENT INFECTION OF HOMO SAPIENS WITH MYCOBACTERIUM TUBERCULOSIS | Genes involved in Latent infection of Homo sapiens with Mycobacterium tuberculosis |
| 1.0 | 22.1 | REACTOME RECYCLING PATHWAY OF L1 | Genes involved in Recycling pathway of L1 |
| 1.0 | 51.6 | REACTOME VOLTAGE GATED POTASSIUM CHANNELS | Genes involved in Voltage gated Potassium channels |
| 1.0 | 9.8 | REACTOME EXTRINSIC PATHWAY FOR APOPTOSIS | Genes involved in Extrinsic Pathway for Apoptosis |
| 0.9 | 21.1 | REACTOME NUCLEOTIDE BINDING DOMAIN LEUCINE RICH REPEAT CONTAINING RECEPTOR NLR SIGNALING PATHWAYS | Genes involved in Nucleotide-binding domain, leucine rich repeat containing receptor (NLR) signaling pathways |
| 0.9 | 15.5 | REACTOME FANCONI ANEMIA PATHWAY | Genes involved in Fanconi Anemia pathway |
| 0.8 | 10.1 | REACTOME ROLE OF DCC IN REGULATING APOPTOSIS | Genes involved in Role of DCC in regulating apoptosis |
| 0.8 | 12.4 | REACTOME SEMA4D INDUCED CELL MIGRATION AND GROWTH CONE COLLAPSE | Genes involved in Sema4D induced cell migration and growth-cone collapse |
| 0.8 | 11.2 | REACTOME GLUCOSE TRANSPORT | Genes involved in Glucose transport |
| 0.8 | 5.6 | REACTOME PLATELET ADHESION TO EXPOSED COLLAGEN | Genes involved in Platelet Adhesion to exposed collagen |
| 0.8 | 20.3 | REACTOME 3 UTR MEDIATED TRANSLATIONAL REGULATION | Genes involved in 3' -UTR-mediated translational regulation |
| 0.7 | 13.4 | REACTOME SIGNALING BY HIPPO | Genes involved in Signaling by Hippo |
| 0.7 | 6.3 | REACTOME REGULATORY RNA PATHWAYS | Genes involved in Regulatory RNA pathways |
| 0.7 | 27.1 | REACTOME ION TRANSPORT BY P TYPE ATPASES | Genes involved in Ion transport by P-type ATPases |
| 0.7 | 21.6 | REACTOME INTERFERON GAMMA SIGNALING | Genes involved in Interferon gamma signaling |
| 0.7 | 15.0 | REACTOME RNA POL I TRANSCRIPTION INITIATION | Genes involved in RNA Polymerase I Transcription Initiation |
| 0.6 | 10.3 | REACTOME FACILITATIVE NA INDEPENDENT GLUCOSE TRANSPORTERS | Genes involved in Facilitative Na+-independent glucose transporters |
| 0.6 | 13.1 | REACTOME REGULATION OF MRNA STABILITY BY PROTEINS THAT BIND AU RICH ELEMENTS | Genes involved in Regulation of mRNA Stability by Proteins that Bind AU-rich Elements |
| 0.6 | 8.6 | REACTOME NONSENSE MEDIATED DECAY ENHANCED BY THE EXON JUNCTION COMPLEX | Genes involved in Nonsense Mediated Decay Enhanced by the Exon Junction Complex |
| 0.6 | 14.8 | REACTOME DEGRADATION OF THE EXTRACELLULAR MATRIX | Genes involved in Degradation of the extracellular matrix |
| 0.5 | 13.0 | REACTOME ASSOCIATION OF TRIC CCT WITH TARGET PROTEINS DURING BIOSYNTHESIS | Genes involved in Association of TriC/CCT with target proteins during biosynthesis |
| 0.5 | 35.5 | REACTOME TOLL RECEPTOR CASCADES | Genes involved in Toll Receptor Cascades |
| 0.5 | 8.8 | REACTOME RNA POL II TRANSCRIPTION PRE INITIATION AND PROMOTER OPENING | Genes involved in RNA Polymerase II Transcription Pre-Initiation And Promoter Opening |
| 0.5 | 14.7 | REACTOME SIGNALING BY EGFR IN CANCER | Genes involved in Signaling by EGFR in Cancer |
| 0.5 | 30.3 | REACTOME MITOTIC PROMETAPHASE | Genes involved in Mitotic Prometaphase |
| 0.4 | 26.4 | REACTOME LOSS OF NLP FROM MITOTIC CENTROSOMES | Genes involved in Loss of Nlp from mitotic centrosomes |
| 0.4 | 9.4 | REACTOME PREFOLDIN MEDIATED TRANSFER OF SUBSTRATE TO CCT TRIC | Genes involved in Prefoldin mediated transfer of substrate to CCT/TriC |
| 0.4 | 8.5 | REACTOME INTRINSIC PATHWAY FOR APOPTOSIS | Genes involved in Intrinsic Pathway for Apoptosis |
| 0.3 | 7.5 | REACTOME CLASS C 3 METABOTROPIC GLUTAMATE PHEROMONE RECEPTORS | Genes involved in Class C/3 (Metabotropic glutamate/pheromone receptors) |
| 0.3 | 6.9 | REACTOME N GLYCAN ANTENNAE ELONGATION IN THE MEDIAL TRANS GOLGI | Genes involved in N-glycan antennae elongation in the medial/trans-Golgi |
| 0.3 | 3.7 | REACTOME SIGNALING BY ACTIVATED POINT MUTANTS OF FGFR1 | Genes involved in Signaling by activated point mutants of FGFR1 |
| 0.3 | 6.1 | REACTOME EXTENSION OF TELOMERES | Genes involved in Extension of Telomeres |
| 0.2 | 4.6 | REACTOME NEGATIVE REGULATORS OF RIG I MDA5 SIGNALING | Genes involved in Negative regulators of RIG-I/MDA5 signaling |
| 0.2 | 2.6 | REACTOME COMMON PATHWAY | Genes involved in Common Pathway |
| 0.2 | 8.6 | REACTOME MEIOTIC RECOMBINATION | Genes involved in Meiotic Recombination |
| 0.2 | 8.7 | REACTOME O LINKED GLYCOSYLATION OF MUCINS | Genes involved in O-linked glycosylation of mucins |
| 0.2 | 2.2 | REACTOME VEGF LIGAND RECEPTOR INTERACTIONS | Genes involved in VEGF ligand-receptor interactions |
| 0.2 | 9.9 | REACTOME METABOLISM OF VITAMINS AND COFACTORS | Genes involved in Metabolism of vitamins and cofactors |
| 0.1 | 1.8 | REACTOME REGULATION OF INSULIN SECRETION BY GLUCAGON LIKE PEPTIDE1 | Genes involved in Regulation of Insulin Secretion by Glucagon-like Peptide-1 |
| 0.1 | 10.6 | REACTOME TRANSCRIPTIONAL REGULATION OF WHITE ADIPOCYTE DIFFERENTIATION | Genes involved in Transcriptional Regulation of White Adipocyte Differentiation |
| 0.1 | 1.9 | REACTOME PEROXISOMAL LIPID METABOLISM | Genes involved in Peroxisomal lipid metabolism |
| 0.1 | 2.7 | REACTOME INSULIN SYNTHESIS AND PROCESSING | Genes involved in Insulin Synthesis and Processing |
| 0.1 | 13.9 | REACTOME G ALPHA I SIGNALLING EVENTS | Genes involved in G alpha (i) signalling events |
| 0.1 | 1.4 | REACTOME SYNTHESIS OF PIPS AT THE GOLGI MEMBRANE | Genes involved in Synthesis of PIPs at the Golgi membrane |
| 0.1 | 1.3 | REACTOME OTHER SEMAPHORIN INTERACTIONS | Genes involved in Other semaphorin interactions |
| 0.1 | 0.8 | REACTOME DEPOSITION OF NEW CENPA CONTAINING NUCLEOSOMES AT THE CENTROMERE | Genes involved in Deposition of New CENPA-containing Nucleosomes at the Centromere |
| 0.0 | 1.4 | REACTOME STEROID HORMONES | Genes involved in Steroid hormones |
| 0.0 | 2.7 | REACTOME G ALPHA Q SIGNALLING EVENTS | Genes involved in G alpha (q) signalling events |
| 0.0 | 0.3 | REACTOME ACYL CHAIN REMODELLING OF PS | Genes involved in Acyl chain remodelling of PS |