Project
GSE53960: rat RNA-Seq transcriptomic Bodymap
Navigation
Downloads
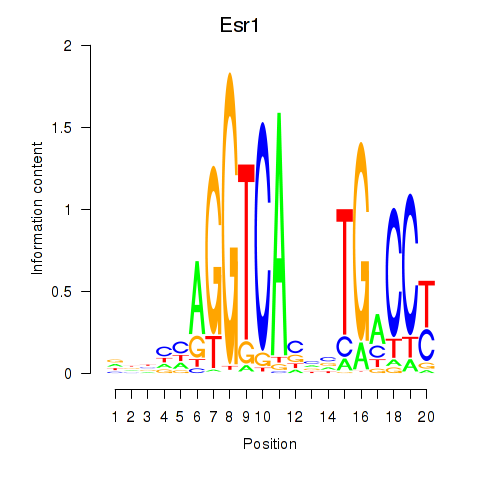
Results for Esr1
Z-value: 1.89
Motif logo
Transcription factors associated with Esr1
| Gene Symbol | Gene ID | Gene Info |
|---|---|---|
|
Esr1
|
ENSRNOG00000019358 | estrogen receptor 1 |
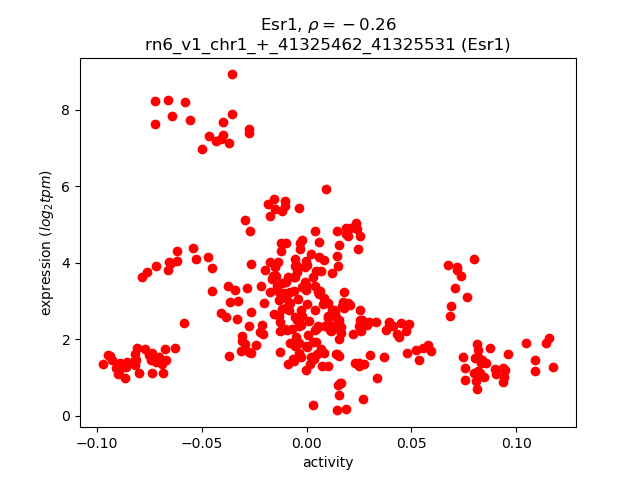
Activity-expression correlation:
| Gene | Promoter | Pearson corr. coef. | P-value | Plot |
|---|---|---|---|---|
| Esr1 | rn6_v1_chr1_+_41325462_41325531 | -0.26 | 3.5e-06 | Click! |
Activity profile of Esr1 motif
Sorted Z-values of Esr1 motif
| Promoter | Log-likelihood | Transcript | Gene | Gene Info |
|---|---|---|---|---|
| chr6_-_138250089 | 103.03 |
ENSRNOT00000048378
|
Ighm
|
immunoglobulin heavy constant mu |
| chr3_-_17081510 | 70.59 |
ENSRNOT00000063862
|
AABR07051562.1
|
|
| chr3_+_19495628 | 64.51 |
ENSRNOT00000077990
|
Igkv4-57
|
immunoglobulin kappa variable 4-57 |
| chr17_-_31780120 | 56.83 |
ENSRNOT00000058388
|
AABR07027450.1
|
|
| chr3_+_16817051 | 55.09 |
ENSRNOT00000071666
|
AABR07051550.1
|
|
| chr6_-_138249382 | 52.84 |
ENSRNOT00000085678
ENSRNOT00000006912 |
Ighm
|
immunoglobulin heavy constant mu |
| chr3_+_18706988 | 48.42 |
ENSRNOT00000074650
|
AABR07051652.1
|
|
| chr6_-_140102325 | 48.10 |
ENSRNOT00000072238
|
AABR07065750.2
|
|
| chr7_-_118840634 | 43.71 |
ENSRNOT00000031568
|
Apol11a
|
apolipoprotein L 11a |
| chr7_-_107391184 | 40.06 |
ENSRNOT00000056793
|
Tmem71
|
transmembrane protein 71 |
| chr3_+_16753703 | 40.05 |
ENSRNOT00000077741
|
AABR07051548.2
|
|
| chr5_-_152324469 | 39.50 |
ENSRNOT00000020688
|
Cd52
|
CD52 molecule |
| chr4_+_98457810 | 39.06 |
ENSRNOT00000074175
|
AABR07060872.1
|
|
| chr6_-_137664133 | 37.91 |
ENSRNOT00000018613
|
Gpr132
|
G protein-coupled receptor 132 |
| chr7_+_70614617 | 37.88 |
ENSRNOT00000035382
|
Arhgap9
|
Rho GTPase activating protein 9 |
| chr1_-_219438779 | 37.14 |
ENSRNOT00000029237
|
Tbc1d10c
|
TBC1 domain family, member 10C |
| chr15_-_34647421 | 36.56 |
ENSRNOT00000072426
|
Mcpt8
|
mast cell protease 8 |
| chr12_+_19680712 | 36.22 |
ENSRNOT00000081310
|
AABR07035561.2
|
|
| chr3_+_19045214 | 35.12 |
ENSRNOT00000070878
|
AABR07051670.1
|
|
| chr9_-_16795887 | 34.21 |
ENSRNOT00000071609
|
Cd79al
|
Cd79a molecule-like |
| chr1_+_81763614 | 33.91 |
ENSRNOT00000027254
|
Cd79a
|
CD79a molecule |
| chr3_-_16750564 | 33.58 |
ENSRNOT00000084111
|
AABR07051548.1
|
|
| chr4_-_103369224 | 33.32 |
ENSRNOT00000075709
|
AABR07061057.1
|
|
| chr15_-_34625121 | 32.33 |
ENSRNOT00000073555
|
Mcpt8l2
|
mast cell protease 8-like 2 |
| chr1_-_85317968 | 32.28 |
ENSRNOT00000026891
|
Gmfg
|
glia maturation factor, gamma |
| chrX_+_96991658 | 32.07 |
ENSRNOT00000049969
|
AABR07040288.1
|
|
| chr20_+_3945601 | 31.95 |
ENSRNOT00000075342
|
RT1-DMb
|
RT1 class II, locus DMb |
| chr3_+_19174027 | 31.32 |
ENSRNOT00000074445
|
AABR07051678.1
|
|
| chr15_-_28081465 | 30.85 |
ENSRNOT00000033739
|
Rnase6
|
ribonuclease, RNase A family, 6 |
| chr6_-_139997537 | 30.73 |
ENSRNOT00000073207
|
AABR07065740.1
|
|
| chr16_-_75481115 | 30.69 |
ENSRNOT00000035128
|
Defa7
|
defensin alpha 7 |
| chr4_+_106323089 | 30.08 |
ENSRNOT00000091402
|
AABR07061134.1
|
|
| chr3_+_19441604 | 29.93 |
ENSRNOT00000090581
|
AABR07051692.1
|
|
| chr20_+_4039413 | 28.39 |
ENSRNOT00000082136
|
RT1-Bb
|
RT1 class II, locus Bb |
| chr3_-_123631109 | 27.30 |
ENSRNOT00000091493
|
Siglec1
|
sialic acid binding Ig like lectin 1 |
| chr1_-_98521551 | 27.13 |
ENSRNOT00000081922
|
Siglec10
|
sialic acid binding Ig-like lectin 10 |
| chr3_-_2853272 | 26.97 |
ENSRNOT00000023022
|
Fcna
|
ficolin A |
| chr11_+_85618714 | 26.50 |
ENSRNOT00000074614
|
AC109901.1
|
|
| chr4_+_101645731 | 26.36 |
ENSRNOT00000087901
|
AABR07060953.1
|
|
| chr2_+_87418517 | 26.11 |
ENSRNOT00000048046
|
LOC100909879
|
tyrosine-protein phosphatase non-receptor type substrate 1-like |
| chr15_-_34479741 | 26.07 |
ENSRNOT00000027759
|
Ripk3
|
receptor-interacting serine-threonine kinase 3 |
| chr11_+_85508300 | 25.96 |
ENSRNOT00000038646
|
AABR07034730.3
|
|
| chr6_-_138852571 | 25.81 |
ENSRNOT00000081803
|
AABR07065656.8
|
|
| chr3_-_16537433 | 25.75 |
ENSRNOT00000048523
|
AABR07051533.2
|
|
| chr9_+_9761536 | 25.65 |
ENSRNOT00000074247
|
Tnfsf14
|
tumor necrosis factor superfamily member 14 |
| chr3_-_16753987 | 25.48 |
ENSRNOT00000091257
|
AABR07051548.1
|
|
| chr19_-_37907714 | 25.04 |
ENSRNOT00000026361
|
Ctrl
|
chymotrypsin-like |
| chr1_+_64074231 | 24.81 |
ENSRNOT00000077327
|
Lilrb3l
|
leukocyte immunoglobulin-like receptor, subfamily B (with TM and ITIM domains), member 3-like |
| chr5_+_151172206 | 24.58 |
ENSRNOT00000013778
|
Fgr
|
FGR proto-oncogene, Src family tyrosine kinase |
| chr11_-_60547201 | 24.03 |
ENSRNOT00000093151
|
Btla
|
B and T lymphocyte associated |
| chr4_+_14151343 | 23.97 |
ENSRNOT00000061687
ENSRNOT00000076573 ENSRNOT00000077219 ENSRNOT00000008319 |
Cd36
|
CD36 molecule |
| chr10_-_87067456 | 23.94 |
ENSRNOT00000014163
|
Ccr7
|
C-C motif chemokine receptor 7 |
| chr10_+_45258887 | 23.93 |
ENSRNOT00000048642
|
Btnl10
|
butyrophilin like 10 |
| chr10_-_66858598 | 23.78 |
ENSRNOT00000018898
|
Evi2b
|
ecotropic viral integration site 2B |
| chr14_-_71814523 | 23.77 |
ENSRNOT00000004094
|
Bst1
|
bone marrow stromal cell antigen 1 |
| chr6_-_139142218 | 23.47 |
ENSRNOT00000006975
|
Ighg
|
Immunoglobulin heavy chain (gamma polypeptide) |
| chr1_-_99587205 | 23.44 |
ENSRNOT00000048947
|
Siglec8
|
sialic acid binding Ig-like lectin 8 |
| chr4_+_14070553 | 23.35 |
ENSRNOT00000077505
|
Cd36
|
CD36 molecule |
| chr5_-_160383782 | 23.33 |
ENSRNOT00000018349
|
Cela2a
|
chymotrypsin-like elastase family, member 2A |
| chr6_-_142676432 | 22.73 |
ENSRNOT00000074947
|
AABR07065815.2
|
|
| chr1_-_169534896 | 22.57 |
ENSRNOT00000082645
|
Trim30c
|
tripartite motif-containing 30C |
| chr16_+_20027348 | 22.14 |
ENSRNOT00000034589
|
Fam129c
|
family with sequence similarity 129, member C |
| chr1_+_63842277 | 21.95 |
ENSRNOT00000087957
ENSRNOT00000080820 |
Lilrb3a
|
leukocyte immunoglobulin-like receptor, subfamily B (with TM and ITIM domains), member 3A |
| chr20_-_9876008 | 21.94 |
ENSRNOT00000001537
|
Tff2
|
trefoil factor 2 |
| chr9_-_9675110 | 21.92 |
ENSRNOT00000073294
|
Vav1
|
vav guanine nucleotide exchange factor 1 |
| chr15_+_32811135 | 21.91 |
ENSRNOT00000067689
|
AABR07017902.1
|
|
| chr4_-_103145058 | 21.91 |
ENSRNOT00000073076
|
AABR07061048.1
|
|
| chr20_-_5179217 | 21.78 |
ENSRNOT00000065940
ENSRNOT00000092443 |
Lst1
|
leukocyte specific transcript 1 |
| chr7_-_18793289 | 21.77 |
ENSRNOT00000036375
|
AABR07056026.1
|
|
| chr4_+_102351036 | 21.75 |
ENSRNOT00000079277
|
AABR07060994.1
|
|
| chr3_-_80012750 | 21.72 |
ENSRNOT00000018154
|
Nr1h3
|
nuclear receptor subfamily 1, group H, member 3 |
| chr3_+_17107861 | 21.48 |
ENSRNOT00000043097
|
AABR07051563.1
|
|
| chr12_-_21923281 | 21.38 |
ENSRNOT00000075641
|
RGD1561143
|
similar to cell surface receptor FDFACT |
| chr11_-_60546997 | 21.09 |
ENSRNOT00000083124
ENSRNOT00000050092 |
Btla
|
B and T lymphocyte associated |
| chr1_+_64506735 | 20.94 |
ENSRNOT00000086331
|
Nlrp12
|
NLR family, pyrin domain containing 12 |
| chr6_-_138772736 | 20.93 |
ENSRNOT00000071492
|
AABR07065651.1
|
|
| chr20_-_27682861 | 20.80 |
ENSRNOT00000057317
|
Fam26f
|
family with sequence similarity 26, member F |
| chr2_+_186555632 | 20.79 |
ENSRNOT00000052347
|
Fcrl1
|
Fc receptor-like 1 |
| chr10_-_29026002 | 20.75 |
ENSRNOT00000005070
|
Pttg1
|
pituitary tumor-transforming 1 |
| chr8_+_96551245 | 20.33 |
ENSRNOT00000039850
|
Bcl2a1
|
BCL2-related protein A1 |
| chr4_-_157252104 | 20.27 |
ENSRNOT00000082739
|
Ptpn6
|
protein tyrosine phosphatase, non-receptor type 6 |
| chr4_-_157252565 | 20.16 |
ENSRNOT00000079947
|
Ptpn6
|
protein tyrosine phosphatase, non-receptor type 6 |
| chr5_-_160405050 | 20.06 |
ENSRNOT00000081899
|
Ctrc
|
chymotrypsin C |
| chr17_-_12669573 | 19.94 |
ENSRNOT00000016942
ENSRNOT00000041726 |
Syk
|
spleen associated tyrosine kinase |
| chr3_+_19141133 | 19.88 |
ENSRNOT00000058323
|
AABR07051675.1
|
|
| chr4_+_119225040 | 19.82 |
ENSRNOT00000012365
|
Bmp10
|
bone morphogenetic protein 10 |
| chr6_-_143590448 | 19.74 |
ENSRNOT00000056771
|
Ighv8-4
|
immunoglobulin heavy variable V8-4 |
| chr1_-_73682247 | 19.53 |
ENSRNOT00000079498
|
Lilra5
|
leukocyte immunoglobulin-like receptor, subfamily A (with TM domain), member 5 |
| chr11_+_85992696 | 19.46 |
ENSRNOT00000084433
|
AABR07034736.1
|
|
| chr6_-_138662365 | 19.26 |
ENSRNOT00000066209
ENSRNOT00000084892 |
Ighm
|
immunoglobulin heavy constant mu |
| chr16_-_81309954 | 19.24 |
ENSRNOT00000092361
|
LOC290876
|
similar to RIKEN cDNA 1700029H14 |
| chr1_+_101249522 | 19.15 |
ENSRNOT00000033882
|
Slc6a16
|
solute carrier family 6, member 16 |
| chr4_+_70614524 | 19.00 |
ENSRNOT00000041100
|
Prss3
|
protease, serine 3 |
| chr6_-_142993147 | 19.00 |
ENSRNOT00000044381
|
LOC100359978
|
mCG1038839-like |
| chr20_-_4943564 | 18.93 |
ENSRNOT00000049310
|
RT1-CE1
|
RT1 class I, locus1 |
| chr6_+_138432550 | 18.85 |
ENSRNOT00000056829
|
Adam6
|
a disintegrin and metallopeptidase domain 6 |
| chr3_+_16413080 | 18.69 |
ENSRNOT00000040386
|
LOC100912707
|
Ig kappa chain V19-17-like |
| chr3_+_19366370 | 18.64 |
ENSRNOT00000086557
|
AABR07051689.1
|
|
| chr13_-_27653839 | 18.43 |
ENSRNOT00000071638
|
LOC100360575
|
signal-regulatory protein alpha-like |
| chr8_-_66893083 | 18.41 |
ENSRNOT00000037028
ENSRNOT00000091755 |
Kif23
|
kinesin family member 23 |
| chr7_-_54778848 | 18.41 |
ENSRNOT00000005399
|
Glipr1
|
GLI pathogenesis-related 1 |
| chr6_+_139209936 | 17.94 |
ENSRNOT00000087620
|
AABR07065680.1
|
|
| chr17_-_44793927 | 17.86 |
ENSRNOT00000086309
|
Hist1h2bo
|
histone cluster 1 H2B family member o |
| chr15_-_34670217 | 17.82 |
ENSRNOT00000049315
|
Mcpt8
|
mast cell protease 8 |
| chr6_-_140485913 | 17.80 |
ENSRNOT00000048463
|
AABR07065768.1
|
|
| chr10_-_31493419 | 17.79 |
ENSRNOT00000009211
|
Itk
|
IL2-inducible T-cell kinase |
| chr5_-_155252003 | 17.68 |
ENSRNOT00000017060
|
C1qb
|
complement C1q B chain |
| chr10_-_34242985 | 17.60 |
ENSRNOT00000046438
|
RGD1559575
|
similar to novel protein |
| chr1_+_247562202 | 17.51 |
ENSRNOT00000021614
|
Pdcd1lg2
|
programmed cell death 1 ligand 2 |
| chr6_+_139158334 | 17.40 |
ENSRNOT00000089227
|
AABR07065673.1
|
|
| chr9_+_112293388 | 17.37 |
ENSRNOT00000020767
|
Man2a1
|
mannosidase, alpha, class 2A, member 1 |
| chr6_-_138685656 | 17.26 |
ENSRNOT00000041706
|
AABR07065651.7
|
|
| chr20_-_5166252 | 17.26 |
ENSRNOT00000001138
|
Aif1
|
allograft inflammatory factor 1 |
| chr13_-_89306219 | 17.23 |
ENSRNOT00000004183
ENSRNOT00000079247 |
Fcrla
|
Fc receptor-like A |
| chr9_-_54457753 | 17.13 |
ENSRNOT00000020032
|
Stat1
|
signal transducer and activator of transcription 1 |
| chr17_-_8429338 | 16.90 |
ENSRNOT00000016390
|
Tgfbi
|
transforming growth factor, beta induced |
| chr17_-_31916553 | 16.86 |
ENSRNOT00000074220
|
LOC100911032
|
uncharacterized LOC100911032 |
| chr3_+_19690016 | 16.85 |
ENSRNOT00000085460
|
AABR07051707.1
|
|
| chr6_-_25211494 | 16.60 |
ENSRNOT00000009634
|
Xdh
|
xanthine dehydrogenase |
| chr14_+_17195014 | 16.52 |
ENSRNOT00000031667
|
Cxcl11
|
C-X-C motif chemokine ligand 11 |
| chr20_-_3397039 | 16.50 |
ENSRNOT00000001084
ENSRNOT00000085259 |
Ppp1r18
|
protein phosphatase 1, regulatory subunit 18 |
| chr9_-_52912293 | 16.48 |
ENSRNOT00000005228
|
Slc40a1
|
solute carrier family 40 member 1 |
| chr6_-_128727374 | 16.40 |
ENSRNOT00000082152
|
Syne3
|
spectrin repeat containing, nuclear envelope family member 3 |
| chr1_-_73399579 | 16.28 |
ENSRNOT00000077186
|
Lilrb4
|
leukocyte immunoglobulin like receptor B4 |
| chr16_-_31301880 | 16.26 |
ENSRNOT00000084847
ENSRNOT00000083943 |
AABR07025272.1
|
|
| chr10_-_70339578 | 16.10 |
ENSRNOT00000076618
|
Slfn13
|
schlafen family member 13 |
| chr12_+_1903165 | 15.99 |
ENSRNOT00000083947
|
AABR07034956.1
|
|
| chr10_-_89900131 | 15.92 |
ENSRNOT00000028238
|
Sost
|
sclerostin |
| chr2_-_30458542 | 15.90 |
ENSRNOT00000072926
|
Naip6
|
NLR family, apoptosis inhibitory protein 6 |
| chr4_-_164536556 | 15.81 |
ENSRNOT00000087796
|
Ly49i2
|
Ly49 inhibitory receptor 2 |
| chr12_-_18274515 | 15.74 |
ENSRNOT00000078075
|
LOC100361826
|
sialophorin-like |
| chr19_+_50045020 | 15.65 |
ENSRNOT00000090165
|
Plcg2
|
phospholipase C, gamma 2 |
| chr4_-_163954817 | 15.58 |
ENSRNOT00000079951
|
Ly49si3
|
immunoreceptor Ly49si3 |
| chr14_+_46649971 | 15.54 |
ENSRNOT00000085875
|
AABR07015078.1
|
|
| chr4_-_157408176 | 15.50 |
ENSRNOT00000021915
|
Cd4
|
Cd4 molecule |
| chr11_+_84506703 | 15.44 |
ENSRNOT00000066953
|
Cyp2ab1
|
cytochrome P450, family 2, subfamily ab, polypeptide 1 |
| chr7_+_125288081 | 15.44 |
ENSRNOT00000085216
|
Parvg
|
parvin, gamma |
| chr6_+_139405966 | 15.42 |
ENSRNOT00000088974
|
AABR07065693.3
|
|
| chr20_-_30888735 | 15.40 |
ENSRNOT00000090004
ENSRNOT00000063875 |
Adamts14
|
ADAM metallopeptidase with thrombospondin type 1 motif, 14 |
| chr15_-_34694180 | 15.40 |
ENSRNOT00000079505
ENSRNOT00000027950 ENSRNOT00000079782 ENSRNOT00000080221 |
Mcpt8
|
mast cell protease 8 |
| chr20_-_5166448 | 15.36 |
ENSRNOT00000076331
|
Aif1
|
allograft inflammatory factor 1 |
| chr3_+_171037957 | 15.34 |
ENSRNOT00000008764
|
Rbm38
|
RNA binding motif protein 38 |
| chr15_+_32809069 | 15.33 |
ENSRNOT00000070848
|
AABR07017902.1
|
|
| chr19_-_10620671 | 15.25 |
ENSRNOT00000021842
|
Ccl17
|
C-C motif chemokine ligand 17 |
| chr7_-_126701872 | 15.24 |
ENSRNOT00000041057
|
Pkdrej
|
polycystin (PKD) family receptor for egg jelly |
| chr6_-_139637354 | 15.23 |
ENSRNOT00000072900
|
LOC100359993
|
Ighg protein-like |
| chr11_+_67465236 | 15.22 |
ENSRNOT00000042374
|
Stfa2
|
stefin A2 |
| chr11_+_84745904 | 15.16 |
ENSRNOT00000002617
|
Klhl6
|
kelch-like family member 6 |
| chr5_-_138239306 | 15.14 |
ENSRNOT00000039305
|
Ermap
|
erythroblast membrane-associated protein |
| chr7_-_14435967 | 15.13 |
ENSRNOT00000074801
|
Pglyrp2
|
peptidoglycan recognition protein 2 |
| chr10_-_15125408 | 15.07 |
ENSRNOT00000026395
|
Msln
|
mesothelin |
| chr10_+_12046701 | 15.06 |
ENSRNOT00000011073
ENSRNOT00000084004 |
Mefv
|
MEFV, pyrin innate immunity regulator |
| chr6_-_138068648 | 15.01 |
ENSRNOT00000081908
|
Ighm
|
immunoglobulin heavy constant mu |
| chr11_+_85633243 | 14.98 |
ENSRNOT00000045807
|
LOC682352
|
Ig lambda chain V-VI region AR-like |
| chr3_+_19071980 | 14.94 |
ENSRNOT00000079487
|
Igkv4-81
|
immunoglobulin kappa variable 4-81 |
| chr9_-_10897240 | 14.92 |
ENSRNOT00000074502
|
Tnfaip8l1
|
TNF alpha induced protein 8 like 1 |
| chr4_-_28437676 | 14.84 |
ENSRNOT00000012995
|
Hepacam2
|
HEPACAM family member 2 |
| chr10_+_91254058 | 14.80 |
ENSRNOT00000087218
ENSRNOT00000065373 |
Fmnl1
|
formin-like 1 |
| chr1_-_173528943 | 14.63 |
ENSRNOT00000020393
|
Nlrp10
|
NLR family, pyrin domain containing 10 |
| chr3_+_19128400 | 14.58 |
ENSRNOT00000074272
|
AABR07051673.1
|
|
| chr5_-_166628028 | 14.53 |
ENSRNOT00000066179
|
Pik3cd
|
phosphatidylinositol-4,5-bisphosphate 3-kinase, catalytic subunit delta |
| chr10_-_75171774 | 14.52 |
ENSRNOT00000011735
|
Epx
|
eosinophil peroxidase |
| chr10_+_14689094 | 14.38 |
ENSRNOT00000036630
|
RGD1559662
|
similar to implantation serine proteinase 2 |
| chr6_-_138550417 | 14.37 |
ENSRNOT00000071945
|
AABR07065645.1
|
|
| chr18_+_56431820 | 14.33 |
ENSRNOT00000079360
ENSRNOT00000049357 |
Csf1r
|
colony stimulating factor 1 receptor |
| chr3_-_123630929 | 14.30 |
ENSRNOT00000028855
|
Siglec1
|
sialic acid binding Ig like lectin 1 |
| chr20_-_4921348 | 14.24 |
ENSRNOT00000082497
ENSRNOT00000041151 |
RT1-CE4
|
RT1 class I, locus CE4 |
| chr6_-_139710905 | 14.15 |
ENSRNOT00000077430
|
AABR07065705.2
|
|
| chr6_-_143131118 | 14.07 |
ENSRNOT00000074930
|
AABR07065834.1
|
|
| chr5_+_173460354 | 13.97 |
ENSRNOT00000038747
|
Tnfrsf18
|
TNF receptor superfamily member 18 |
| chr1_-_208020454 | 13.97 |
ENSRNOT00000038176
|
Mki67
|
marker of proliferation Ki-67 |
| chr3_-_105298108 | 13.94 |
ENSRNOT00000010994
|
Arhgap11a
|
Rho GTPase activating protein 11A |
| chr12_-_22126350 | 13.91 |
ENSRNOT00000076328
|
Sap25
|
Sin3A-associated protein 25 |
| chr2_-_250778269 | 13.89 |
ENSRNOT00000085670
ENSRNOT00000083535 ENSRNOT00000017824 |
Clca5
|
chloride channel accessory 5 |
| chr3_-_20457554 | 13.89 |
ENSRNOT00000074237
|
AABR07051733.1
|
|
| chr6_-_138764901 | 13.85 |
ENSRNOT00000075175
|
AABR07065651.2
|
|
| chr15_-_44411004 | 13.80 |
ENSRNOT00000031163
|
Cdca2
|
cell division cycle associated 2 |
| chr6_-_138954741 | 13.74 |
ENSRNOT00000083278
|
AABR07065656.7
|
|
| chr13_-_83425641 | 13.45 |
ENSRNOT00000063870
|
Tbx19
|
T-box 19 |
| chr12_+_19714324 | 13.43 |
ENSRNOT00000072303
|
RGD1559588
|
similar to cell surface receptor FDFACT |
| chr1_+_100830064 | 13.36 |
ENSRNOT00000027320
|
Il4i1
|
interleukin 4 induced 1 |
| chr1_-_190914610 | 13.33 |
ENSRNOT00000023189
|
Cdr2
|
cerebellar degeneration-related protein 2 |
| chr18_+_12056113 | 13.25 |
ENSRNOT00000038450
|
Dsg4
|
desmoglein 4 |
| chr1_-_47502952 | 13.15 |
ENSRNOT00000025580
|
Tagap
|
T-cell activation RhoGTPase activating protein |
| chr20_-_2191640 | 13.12 |
ENSRNOT00000001016
|
Trim10
|
tripartite motif-containing 10 |
| chr1_+_63964155 | 12.93 |
ENSRNOT00000078512
|
AABR07002001.1
|
|
| chr15_+_52234563 | 12.85 |
ENSRNOT00000015169
|
Reep4
|
receptor accessory protein 4 |
| chr6_-_51498337 | 12.83 |
ENSRNOT00000012487
|
Pik3cg
|
phosphatidylinositol-4,5-bisphosphate 3-kinase, catalytic subunit gamma |
| chr1_+_213040024 | 12.77 |
ENSRNOT00000050237
|
Olr300
|
olfactory receptor 300 |
| chr13_-_36101411 | 12.76 |
ENSRNOT00000074471
|
Tmem37
|
transmembrane protein 37 |
| chr10_+_90192627 | 12.75 |
ENSRNOT00000080965
ENSRNOT00000065182 |
LOC303566
|
E2F1-inducible gene |
| chr13_+_92136290 | 12.73 |
ENSRNOT00000049819
|
Olr1587
|
olfactory receptor 1587 |
| chr17_-_43614844 | 12.70 |
ENSRNOT00000023054
|
Hist1h1a
|
histone cluster 1 H1 family member a |
| chr8_+_116708027 | 12.69 |
ENSRNOT00000047309
|
Actl11
|
actin-like 11 |
| chr8_-_33661049 | 12.66 |
ENSRNOT00000068037
|
Fli1
|
Fli-1 proto-oncogene, ETS transcription factor |
| chr6_+_139412328 | 12.56 |
ENSRNOT00000070810
|
AABR07065693.1
|
|
| chr7_+_118692851 | 12.55 |
ENSRNOT00000091911
|
LOC100911562
|
apolipoprotein L3-like |
| chr20_-_3793985 | 12.50 |
ENSRNOT00000049540
ENSRNOT00000086293 |
RT1-CE16
|
RT1 class I, locus CE16 |
| chr15_+_60084918 | 12.43 |
ENSRNOT00000012632
|
Epsti1
|
epithelial stromal interaction 1 |
| chr1_+_226077120 | 12.38 |
ENSRNOT00000027611
|
Rab3il1
|
RAB3A interacting protein-like 1 |
Network of associatons between targets according to the STRING database.

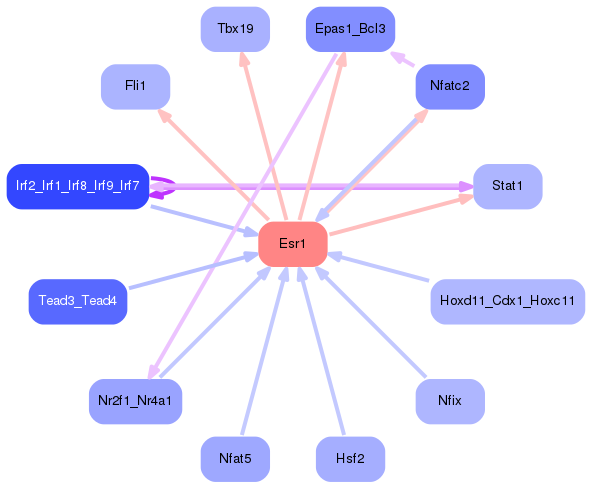
First level regulatory network of Esr1
Gene Ontology Analysis
Gene overrepresentation in biological process category:
| Log-likelihood per target | Total log-likelihood | Term | Description |
|---|---|---|---|
| 15.5 | 46.6 | GO:0008588 | release of cytoplasmic sequestered NF-kappaB(GO:0008588) |
| 10.9 | 32.6 | GO:0014739 | positive regulation of muscle hyperplasia(GO:0014739) |
| 10.5 | 41.9 | GO:2001190 | positive regulation of T cell activation via T cell receptor contact with antigen bound to MHC molecule on antigen presenting cell(GO:2001190) |
| 10.1 | 40.4 | GO:0033277 | abortive mitotic cell cycle(GO:0033277) |
| 10.0 | 19.9 | GO:0071226 | cellular response to molecule of fungal origin(GO:0071226) |
| 9.6 | 28.9 | GO:2000449 | regulation of CD8-positive, alpha-beta T cell extravasation(GO:2000449) |
| 8.3 | 33.1 | GO:0097029 | mature conventional dendritic cell differentiation(GO:0097029) |
| 8.2 | 41.1 | GO:0034316 | negative regulation of Arp2/3 complex-mediated actin nucleation(GO:0034316) |
| 7.9 | 47.3 | GO:0072564 | blood microparticle formation(GO:0072564) regulation of blood microparticle formation(GO:2000332) positive regulation of blood microparticle formation(GO:2000334) |
| 7.8 | 23.5 | GO:0001788 | antibody-dependent cellular cytotoxicity(GO:0001788) |
| 7.8 | 23.4 | GO:0060101 | negative regulation of phagocytosis, engulfment(GO:0060101) |
| 7.1 | 28.4 | GO:0002343 | peripheral B cell selection(GO:0002343) B cell affinity maturation(GO:0002344) |
| 6.7 | 27.0 | GO:0002752 | cell surface pattern recognition receptor signaling pathway(GO:0002752) |
| 6.1 | 18.4 | GO:0000915 | assembly of actomyosin apparatus involved in cytokinesis(GO:0000912) actomyosin contractile ring assembly(GO:0000915) actomyosin contractile ring organization(GO:0044837) |
| 5.7 | 17.0 | GO:0060128 | corticotropin hormone secreting cell differentiation(GO:0060128) |
| 5.3 | 15.9 | GO:2000054 | negative regulation of Wnt signaling pathway involved in dorsal/ventral axis specification(GO:2000054) |
| 5.2 | 15.5 | GO:0035723 | interleukin-15-mediated signaling pathway(GO:0035723) cellular response to interleukin-15(GO:0071350) |
| 4.9 | 48.8 | GO:0046642 | negative regulation of alpha-beta T cell proliferation(GO:0046642) |
| 4.8 | 14.5 | GO:0002215 | defense response to nematode(GO:0002215) |
| 4.8 | 43.2 | GO:0043031 | negative regulation of macrophage activation(GO:0043031) |
| 4.7 | 14.0 | GO:1990705 | cholangiocyte proliferation(GO:1990705) |
| 4.4 | 8.8 | GO:1902412 | regulation of mitotic cytokinesis(GO:1902412) |
| 4.3 | 13.0 | GO:0002149 | hypochlorous acid metabolic process(GO:0002148) hypochlorous acid biosynthetic process(GO:0002149) |
| 4.3 | 21.5 | GO:0042536 | negative regulation of tumor necrosis factor biosynthetic process(GO:0042536) |
| 4.3 | 17.1 | GO:0034240 | negative regulation of macrophage fusion(GO:0034240) |
| 4.2 | 25.0 | GO:0033031 | positive regulation of neutrophil apoptotic process(GO:0033031) |
| 4.1 | 12.4 | GO:0060370 | susceptibility to T cell mediated cytotoxicity(GO:0060370) |
| 4.1 | 16.5 | GO:0034395 | regulation of transcription from RNA polymerase II promoter in response to iron(GO:0034395) divalent metal ion export(GO:0070839) |
| 4.1 | 12.3 | GO:0043316 | cytotoxic T cell degranulation(GO:0043316) constitutive secretory pathway(GO:0045054) |
| 4.0 | 19.8 | GO:0060298 | positive regulation of sarcomere organization(GO:0060298) |
| 3.8 | 15.1 | GO:0032824 | natural killer cell differentiation involved in immune response(GO:0002325) negative regulation of natural killer cell differentiation(GO:0032824) regulation of natural killer cell differentiation involved in immune response(GO:0032826) negative regulation of natural killer cell differentiation involved in immune response(GO:0032827) |
| 3.7 | 14.6 | GO:2000318 | positive regulation of T-helper 17 type immune response(GO:2000318) |
| 3.6 | 10.8 | GO:0046601 | positive regulation of centriole replication(GO:0046601) |
| 3.5 | 31.6 | GO:0051534 | negative regulation of NFAT protein import into nucleus(GO:0051534) |
| 3.4 | 10.3 | GO:1903774 | positive regulation of viral budding via host ESCRT complex(GO:1903774) |
| 3.3 | 10.0 | GO:0046967 | cytosol to ER transport(GO:0046967) peptide antigen transport(GO:0046968) |
| 3.3 | 16.6 | GO:0009115 | xanthine catabolic process(GO:0009115) |
| 3.2 | 12.8 | GO:0007084 | mitotic nuclear envelope reassembly(GO:0007084) |
| 3.2 | 6.4 | GO:0002238 | response to molecule of fungal origin(GO:0002238) |
| 3.0 | 15.1 | GO:1900226 | negative regulation of NLRP3 inflammasome complex assembly(GO:1900226) |
| 2.9 | 8.8 | GO:0019355 | nicotinamide nucleotide biosynthetic process from aspartate(GO:0019355) 'de novo' NAD biosynthetic process from aspartate(GO:0034628) |
| 2.9 | 14.3 | GO:0038145 | macrophage colony-stimulating factor signaling pathway(GO:0038145) |
| 2.8 | 8.5 | GO:0032417 | positive regulation of sodium:proton antiporter activity(GO:0032417) |
| 2.8 | 11.3 | GO:0042590 | antigen processing and presentation of exogenous peptide antigen via MHC class I(GO:0042590) |
| 2.7 | 27.3 | GO:0032959 | inositol trisphosphate biosynthetic process(GO:0032959) |
| 2.7 | 8.2 | GO:0008594 | photoreceptor cell morphogenesis(GO:0008594) |
| 2.7 | 5.4 | GO:0002296 | T-helper 1 cell lineage commitment(GO:0002296) |
| 2.7 | 10.7 | GO:0034080 | CENP-A containing nucleosome assembly(GO:0034080) CENP-A containing chromatin organization(GO:0061641) |
| 2.7 | 5.3 | GO:0032258 | CVT pathway(GO:0032258) |
| 2.6 | 2.6 | GO:1904975 | response to bleomycin(GO:1904975) |
| 2.6 | 34.1 | GO:0010818 | T cell chemotaxis(GO:0010818) |
| 2.6 | 26.1 | GO:0038094 | Fc-gamma receptor signaling pathway(GO:0038094) |
| 2.6 | 10.4 | GO:0002184 | cytoplasmic translational termination(GO:0002184) |
| 2.6 | 41.6 | GO:0070234 | positive regulation of T cell apoptotic process(GO:0070234) |
| 2.5 | 5.0 | GO:0043133 | hindgut contraction(GO:0043133) regulation of hindgut contraction(GO:0043134) |
| 2.4 | 12.2 | GO:1903300 | negative regulation of glucokinase activity(GO:0033132) negative regulation of hexokinase activity(GO:1903300) |
| 2.4 | 11.9 | GO:0072719 | cellular response to cisplatin(GO:0072719) |
| 2.4 | 9.5 | GO:0097278 | complement-dependent cytotoxicity(GO:0097278) |
| 2.3 | 9.3 | GO:1904009 | cellular response to monosodium glutamate(GO:1904009) |
| 2.3 | 15.9 | GO:0070269 | pyroptosis(GO:0070269) |
| 2.2 | 8.6 | GO:0046985 | positive regulation of hemoglobin biosynthetic process(GO:0046985) |
| 2.2 | 6.5 | GO:0001543 | ovarian follicle rupture(GO:0001543) |
| 2.1 | 8.2 | GO:2001295 | malonyl-CoA biosynthetic process(GO:2001295) |
| 2.0 | 12.3 | GO:0015860 | purine nucleoside transmembrane transport(GO:0015860) |
| 2.0 | 8.0 | GO:0051987 | positive regulation of attachment of spindle microtubules to kinetochore(GO:0051987) |
| 2.0 | 6.0 | GO:0002337 | B-1a B cell differentiation(GO:0002337) |
| 1.9 | 5.8 | GO:0045409 | negative regulation of interleukin-6 biosynthetic process(GO:0045409) |
| 1.9 | 5.8 | GO:1904404 | traversing start control point of mitotic cell cycle(GO:0007089) response to formaldehyde(GO:1904404) |
| 1.9 | 5.7 | GO:0046671 | regulation of nitrogen utilization(GO:0006808) nitrogen utilization(GO:0019740) negative regulation of retinal cell programmed cell death(GO:0046671) cellular response to fluoride(GO:1902618) |
| 1.9 | 7.5 | GO:0060279 | positive regulation of ovulation(GO:0060279) |
| 1.9 | 7.5 | GO:0090290 | positive regulation of osteoclast proliferation(GO:0090290) |
| 1.8 | 12.8 | GO:0032252 | secretory granule localization(GO:0032252) |
| 1.8 | 5.5 | GO:1902268 | negative regulation of polyamine transmembrane transport(GO:1902268) |
| 1.8 | 43.9 | GO:0045671 | negative regulation of osteoclast differentiation(GO:0045671) |
| 1.8 | 7.2 | GO:1904373 | response to kainic acid(GO:1904373) |
| 1.8 | 5.4 | GO:0071283 | cellular response to iron(III) ion(GO:0071283) |
| 1.8 | 19.7 | GO:0085020 | protein K6-linked ubiquitination(GO:0085020) |
| 1.8 | 5.3 | GO:1902304 | positive regulation of potassium ion export(GO:1902304) |
| 1.8 | 5.3 | GO:0072702 | regulation of endoplasmic reticulum stress-induced eIF2 alpha phosphorylation(GO:0060734) response to methyl methanesulfonate(GO:0072702) cellular response to methyl methanesulfonate(GO:0072703) response to environmental enrichment(GO:0090648) positive regulation of peptidyl-serine dephosphorylation(GO:1902310) response to gold nanoparticle(GO:1990268) |
| 1.8 | 14.1 | GO:0042989 | sequestering of actin monomers(GO:0042989) |
| 1.7 | 13.8 | GO:0090286 | cytoskeletal anchoring at nuclear membrane(GO:0090286) |
| 1.7 | 10.2 | GO:0010360 | negative regulation of anion channel activity(GO:0010360) |
| 1.7 | 53.0 | GO:0035458 | cellular response to interferon-beta(GO:0035458) |
| 1.7 | 8.3 | GO:0042276 | error-prone translesion synthesis(GO:0042276) |
| 1.7 | 66.2 | GO:0050853 | B cell receptor signaling pathway(GO:0050853) |
| 1.6 | 17.8 | GO:1900028 | negative regulation of ruffle assembly(GO:1900028) |
| 1.6 | 17.8 | GO:0001865 | NK T cell differentiation(GO:0001865) |
| 1.6 | 17.4 | GO:0010603 | regulation of cytoplasmic mRNA processing body assembly(GO:0010603) |
| 1.6 | 17.4 | GO:0006013 | mannose metabolic process(GO:0006013) |
| 1.5 | 4.6 | GO:0009227 | nucleotide-sugar catabolic process(GO:0009227) |
| 1.5 | 4.6 | GO:0032077 | positive regulation of deoxyribonuclease activity(GO:0032077) |
| 1.5 | 5.9 | GO:2001274 | negative regulation of glucose import in response to insulin stimulus(GO:2001274) |
| 1.5 | 20.5 | GO:0043306 | positive regulation of mast cell activation involved in immune response(GO:0033008) positive regulation of mast cell degranulation(GO:0043306) |
| 1.4 | 4.3 | GO:0036378 | calcitriol biosynthetic process from calciol(GO:0036378) |
| 1.4 | 7.1 | GO:0006548 | histidine catabolic process(GO:0006548) |
| 1.4 | 1.4 | GO:0032741 | positive regulation of interleukin-18 production(GO:0032741) |
| 1.4 | 7.0 | GO:0070309 | lens fiber cell morphogenesis(GO:0070309) |
| 1.4 | 1.4 | GO:0010609 | mRNA localization resulting in posttranscriptional regulation of gene expression(GO:0010609) |
| 1.4 | 4.2 | GO:0043605 | cellular amide catabolic process(GO:0043605) |
| 1.4 | 8.3 | GO:0071918 | urea transmembrane transport(GO:0071918) |
| 1.4 | 5.5 | GO:0039534 | negative regulation of MDA-5 signaling pathway(GO:0039534) |
| 1.4 | 18.0 | GO:0043312 | neutrophil degranulation(GO:0043312) |
| 1.4 | 4.1 | GO:0031204 | posttranslational protein targeting to membrane, translocation(GO:0031204) |
| 1.4 | 17.8 | GO:0070935 | 3'-UTR-mediated mRNA stabilization(GO:0070935) |
| 1.3 | 14.8 | GO:0051014 | actin filament severing(GO:0051014) |
| 1.3 | 4.0 | GO:0009182 | purine deoxyribonucleoside diphosphate metabolic process(GO:0009182) dGDP metabolic process(GO:0046066) |
| 1.3 | 9.3 | GO:0000056 | ribosomal small subunit export from nucleus(GO:0000056) |
| 1.3 | 5.2 | GO:0090403 | oxidative stress-induced premature senescence(GO:0090403) |
| 1.3 | 6.5 | GO:0006751 | glutathione catabolic process(GO:0006751) |
| 1.3 | 8.9 | GO:0006685 | sphingomyelin catabolic process(GO:0006685) |
| 1.3 | 3.8 | GO:1905225 | positive regulation of phospholipase C-activating G-protein coupled receptor signaling pathway(GO:1900738) response to thyrotropin-releasing hormone(GO:1905225) |
| 1.3 | 10.0 | GO:0086073 | bundle of His cell-Purkinje myocyte adhesion involved in cell communication(GO:0086073) |
| 1.2 | 2.5 | GO:0030824 | negative regulation of cGMP metabolic process(GO:0030824) |
| 1.2 | 2.5 | GO:0018076 | N-terminal peptidyl-lysine acetylation(GO:0018076) |
| 1.2 | 3.7 | GO:0033364 | mast cell secretory granule organization(GO:0033364) |
| 1.2 | 12.3 | GO:0032237 | activation of store-operated calcium channel activity(GO:0032237) |
| 1.2 | 9.8 | GO:0001955 | blood vessel maturation(GO:0001955) |
| 1.2 | 2.4 | GO:0001546 | preantral ovarian follicle growth(GO:0001546) multi-layer follicle stage(GO:0048162) |
| 1.2 | 8.5 | GO:0007144 | female meiosis I(GO:0007144) |
| 1.2 | 10.8 | GO:0000463 | maturation of LSU-rRNA from tricistronic rRNA transcript (SSU-rRNA, 5.8S rRNA, LSU-rRNA)(GO:0000463) |
| 1.2 | 3.6 | GO:0010133 | proline catabolic process to glutamate(GO:0010133) |
| 1.2 | 9.5 | GO:0050916 | sensory perception of sweet taste(GO:0050916) |
| 1.2 | 10.6 | GO:0007603 | phototransduction, visible light(GO:0007603) |
| 1.2 | 3.5 | GO:0060112 | generation of ovulation cycle rhythm(GO:0060112) |
| 1.2 | 4.7 | GO:0032914 | positive regulation of transforming growth factor beta1 production(GO:0032914) |
| 1.2 | 3.5 | GO:0016267 | O-glycan processing, core 1(GO:0016267) |
| 1.2 | 4.6 | GO:0072709 | cellular response to sorbitol(GO:0072709) |
| 1.1 | 3.4 | GO:0048319 | axial mesoderm morphogenesis(GO:0048319) |
| 1.1 | 8.0 | GO:0006477 | protein sulfation(GO:0006477) |
| 1.1 | 3.4 | GO:0000973 | posttranscriptional tethering of RNA polymerase II gene DNA at nuclear periphery(GO:0000973) |
| 1.1 | 3.3 | GO:1904569 | regulation of selenocysteine incorporation(GO:1904569) |
| 1.1 | 7.7 | GO:2000609 | regulation of thyroid hormone generation(GO:2000609) |
| 1.1 | 4.3 | GO:0010510 | regulation of acetyl-CoA biosynthetic process from pyruvate(GO:0010510) |
| 1.1 | 11.8 | GO:0014883 | transition between fast and slow fiber(GO:0014883) |
| 1.1 | 6.4 | GO:2000819 | regulation of nucleotide-excision repair(GO:2000819) |
| 1.0 | 4.2 | GO:0071718 | sodium-independent icosanoid transport(GO:0071718) |
| 1.0 | 3.1 | GO:0002803 | positive regulation of antimicrobial peptide production(GO:0002225) positive regulation of antimicrobial humoral response(GO:0002760) positive regulation of antibacterial peptide production(GO:0002803) |
| 1.0 | 3.1 | GO:2000360 | regulation of binding of sperm to zona pellucida(GO:2000359) negative regulation of binding of sperm to zona pellucida(GO:2000360) |
| 1.0 | 9.4 | GO:0060700 | regulation of ribonuclease activity(GO:0060700) |
| 1.0 | 7.3 | GO:0061086 | negative regulation of histone H3-K27 methylation(GO:0061086) |
| 1.0 | 9.3 | GO:0070235 | regulation of activation-induced cell death of T cells(GO:0070235) |
| 1.0 | 10.4 | GO:1990001 | inhibition of cysteine-type endopeptidase activity involved in apoptotic process(GO:1990001) |
| 1.0 | 12.4 | GO:0002176 | male germ cell proliferation(GO:0002176) |
| 1.0 | 5.2 | GO:0002553 | histamine production involved in inflammatory response(GO:0002349) histamine secretion involved in inflammatory response(GO:0002441) histamine secretion by mast cell(GO:0002553) Golgi reassembly(GO:0090168) |
| 1.0 | 5.1 | GO:0042695 | thelarche(GO:0042695) mammary gland branching involved in thelarche(GO:0060744) |
| 1.0 | 6.1 | GO:0045743 | positive regulation of fibroblast growth factor receptor signaling pathway(GO:0045743) |
| 1.0 | 7.0 | GO:1990822 | basic amino acid transmembrane transport(GO:1990822) |
| 1.0 | 5.0 | GO:0016557 | peroxisome membrane biogenesis(GO:0016557) |
| 1.0 | 12.0 | GO:0005981 | regulation of glycogen catabolic process(GO:0005981) |
| 1.0 | 4.0 | GO:2000813 | negative regulation of barbed-end actin filament capping(GO:2000813) |
| 1.0 | 8.9 | GO:0007023 | post-chaperonin tubulin folding pathway(GO:0007023) |
| 1.0 | 9.8 | GO:0043374 | CD8-positive, alpha-beta T cell differentiation(GO:0043374) |
| 1.0 | 5.8 | GO:0061737 | leukotriene signaling pathway(GO:0061737) |
| 1.0 | 4.8 | GO:0045852 | pH elevation(GO:0045852) intracellular pH elevation(GO:0051454) |
| 1.0 | 12.5 | GO:0007076 | mitotic chromosome condensation(GO:0007076) |
| 1.0 | 2.9 | GO:0032430 | regulation of renal output by angiotensin(GO:0002019) positive regulation of phospholipase A2 activity(GO:0032430) phospholipase C-activating angiotensin-activated signaling pathway(GO:0086097) |
| 0.9 | 40.6 | GO:0010972 | negative regulation of G2/M transition of mitotic cell cycle(GO:0010972) |
| 0.9 | 17.5 | GO:0032693 | negative regulation of interleukin-10 production(GO:0032693) |
| 0.9 | 2.7 | GO:0071724 | response to bacterial lipopeptide(GO:0070339) cellular response to bacterial lipoprotein(GO:0071220) cellular response to bacterial lipopeptide(GO:0071221) response to diacyl bacterial lipopeptide(GO:0071724) cellular response to diacyl bacterial lipopeptide(GO:0071726) |
| 0.9 | 4.6 | GO:1904717 | regulation of AMPA glutamate receptor clustering(GO:1904717) |
| 0.9 | 23.3 | GO:0061436 | establishment of skin barrier(GO:0061436) |
| 0.9 | 3.6 | GO:0018211 | protein C-linked glycosylation(GO:0018103) peptidyl-tryptophan modification(GO:0018211) protein C-linked glycosylation via tryptophan(GO:0018317) protein C-linked glycosylation via 2'-alpha-mannosyl-L-tryptophan(GO:0018406) |
| 0.9 | 3.6 | GO:0071802 | negative regulation of podosome assembly(GO:0071802) |
| 0.9 | 3.5 | GO:0061055 | myotome development(GO:0061055) |
| 0.9 | 3.4 | GO:0060155 | platelet dense granule organization(GO:0060155) |
| 0.9 | 64.9 | GO:0030593 | neutrophil chemotaxis(GO:0030593) |
| 0.8 | 10.2 | GO:1902993 | positive regulation of beta-amyloid formation(GO:1902004) positive regulation of amyloid precursor protein catabolic process(GO:1902993) |
| 0.8 | 2.5 | GO:0010813 | neuropeptide catabolic process(GO:0010813) |
| 0.8 | 6.6 | GO:0051798 | positive regulation of hair follicle development(GO:0051798) |
| 0.8 | 3.3 | GO:0035772 | interleukin-13-mediated signaling pathway(GO:0035772) |
| 0.8 | 4.1 | GO:0036233 | glycine import(GO:0036233) |
| 0.8 | 30.0 | GO:0002474 | antigen processing and presentation of peptide antigen via MHC class I(GO:0002474) |
| 0.8 | 3.2 | GO:0030576 | Cajal body organization(GO:0030576) |
| 0.8 | 4.8 | GO:0060312 | regulation of blood vessel remodeling(GO:0060312) |
| 0.8 | 12.7 | GO:0035855 | megakaryocyte development(GO:0035855) |
| 0.8 | 2.3 | GO:0070084 | protein initiator methionine removal(GO:0070084) |
| 0.8 | 1.5 | GO:0021747 | cochlear nucleus development(GO:0021747) |
| 0.8 | 12.2 | GO:0051016 | barbed-end actin filament capping(GO:0051016) |
| 0.7 | 2.2 | GO:0030242 | pexophagy(GO:0030242) |
| 0.7 | 2.2 | GO:0010936 | negative regulation of macrophage cytokine production(GO:0010936) |
| 0.7 | 4.5 | GO:0014042 | positive regulation of neuron maturation(GO:0014042) |
| 0.7 | 2.2 | GO:0006663 | platelet activating factor biosynthetic process(GO:0006663) |
| 0.7 | 2.9 | GO:0032464 | positive regulation of protein homooligomerization(GO:0032464) |
| 0.7 | 2.9 | GO:0044211 | CTP salvage(GO:0044211) |
| 0.7 | 2.1 | GO:0060267 | positive regulation of respiratory burst(GO:0060267) |
| 0.7 | 2.8 | GO:0060178 | regulation of exocyst localization(GO:0060178) |
| 0.7 | 6.3 | GO:0071415 | cellular response to purine-containing compound(GO:0071415) |
| 0.7 | 3.5 | GO:0060346 | bone trabecula formation(GO:0060346) |
| 0.7 | 6.3 | GO:0018206 | peptidyl-methionine modification(GO:0018206) |
| 0.7 | 1.4 | GO:0060468 | prevention of polyspermy(GO:0060468) |
| 0.7 | 2.7 | GO:0090666 | scaRNA localization to Cajal body(GO:0090666) |
| 0.7 | 2.7 | GO:0000960 | mitochondrial RNA catabolic process(GO:0000957) regulation of mitochondrial RNA catabolic process(GO:0000960) |
| 0.7 | 6.7 | GO:0071284 | cellular response to lead ion(GO:0071284) |
| 0.7 | 6.0 | GO:0006474 | N-terminal protein amino acid acetylation(GO:0006474) |
| 0.7 | 4.0 | GO:0033184 | positive regulation of histone ubiquitination(GO:0033184) |
| 0.7 | 19.0 | GO:0006958 | complement activation, classical pathway(GO:0006958) |
| 0.6 | 1.9 | GO:0002877 | regulation of acute inflammatory response to non-antigenic stimulus(GO:0002877) |
| 0.6 | 17.5 | GO:0006335 | DNA replication-dependent nucleosome assembly(GO:0006335) DNA replication-dependent nucleosome organization(GO:0034723) |
| 0.6 | 16.1 | GO:0007064 | mitotic sister chromatid cohesion(GO:0007064) |
| 0.6 | 3.2 | GO:0043652 | engulfment of apoptotic cell(GO:0043652) phosphatidylserine exposure on apoptotic cell surface(GO:0070782) |
| 0.6 | 3.8 | GO:0042256 | mature ribosome assembly(GO:0042256) |
| 0.6 | 7.6 | GO:0007379 | segment specification(GO:0007379) |
| 0.6 | 3.1 | GO:0032957 | inositol trisphosphate metabolic process(GO:0032957) |
| 0.6 | 5.0 | GO:0021540 | corpus callosum morphogenesis(GO:0021540) |
| 0.6 | 2.5 | GO:0014064 | positive regulation of serotonin secretion(GO:0014064) regulation of defecation(GO:2000292) negative regulation of defecation(GO:2000293) |
| 0.6 | 3.0 | GO:0000055 | ribosomal large subunit export from nucleus(GO:0000055) positive regulation of protein localization to nucleolus(GO:1904751) |
| 0.6 | 7.8 | GO:0036035 | osteoclast development(GO:0036035) |
| 0.6 | 13.2 | GO:0050901 | leukocyte tethering or rolling(GO:0050901) |
| 0.6 | 3.0 | GO:2001270 | regulation of cysteine-type endopeptidase activity involved in execution phase of apoptosis(GO:2001270) negative regulation of cysteine-type endopeptidase activity involved in execution phase of apoptosis(GO:2001271) |
| 0.6 | 7.7 | GO:0098719 | sodium ion import(GO:0097369) sodium ion import across plasma membrane(GO:0098719) sodium ion import into cell(GO:1990118) |
| 0.6 | 10.5 | GO:0097435 | fibril organization(GO:0097435) |
| 0.6 | 2.3 | GO:1903847 | regulation of aorta morphogenesis(GO:1903847) positive regulation of aorta morphogenesis(GO:1903849) |
| 0.6 | 1.7 | GO:0001827 | inner cell mass cell fate commitment(GO:0001827) |
| 0.6 | 1.2 | GO:0045415 | negative regulation of interleukin-8 biosynthetic process(GO:0045415) |
| 0.6 | 4.0 | GO:0070417 | cellular response to cold(GO:0070417) |
| 0.6 | 5.1 | GO:0052697 | xenobiotic glucuronidation(GO:0052697) |
| 0.6 | 7.7 | GO:1900048 | positive regulation of blood coagulation(GO:0030194) positive regulation of hemostasis(GO:1900048) |
| 0.6 | 3.3 | GO:0006528 | asparagine metabolic process(GO:0006528) |
| 0.6 | 8.3 | GO:0002227 | innate immune response in mucosa(GO:0002227) |
| 0.5 | 1.6 | GO:1990167 | protein K27-linked deubiquitination(GO:1990167) |
| 0.5 | 1.6 | GO:0030208 | dermatan sulfate biosynthetic process(GO:0030208) |
| 0.5 | 4.3 | GO:2000052 | positive regulation of non-canonical Wnt signaling pathway(GO:2000052) |
| 0.5 | 4.3 | GO:0050862 | positive regulation of antigen receptor-mediated signaling pathway(GO:0050857) positive regulation of T cell receptor signaling pathway(GO:0050862) |
| 0.5 | 5.4 | GO:0099638 | endosome to plasma membrane protein transport(GO:0099638) |
| 0.5 | 7.3 | GO:0036065 | fucosylation(GO:0036065) |
| 0.5 | 1.5 | GO:0042732 | D-xylose metabolic process(GO:0042732) |
| 0.5 | 8.2 | GO:0046415 | urate metabolic process(GO:0046415) |
| 0.5 | 4.5 | GO:0035879 | plasma membrane lactate transport(GO:0035879) |
| 0.5 | 7.2 | GO:0006851 | mitochondrial calcium ion transport(GO:0006851) |
| 0.5 | 4.8 | GO:0006265 | DNA topological change(GO:0006265) |
| 0.5 | 8.0 | GO:0030261 | chromosome condensation(GO:0030261) |
| 0.5 | 2.3 | GO:1903275 | positive regulation of sodium ion export(GO:1903275) positive regulation of sodium ion export from cell(GO:1903278) |
| 0.5 | 5.9 | GO:0061418 | regulation of transcription from RNA polymerase II promoter in response to hypoxia(GO:0061418) |
| 0.5 | 5.0 | GO:0031936 | negative regulation of chromatin silencing(GO:0031936) |
| 0.5 | 6.3 | GO:0042832 | defense response to protozoan(GO:0042832) |
| 0.4 | 1.3 | GO:0009186 | deoxyribonucleoside diphosphate metabolic process(GO:0009186) |
| 0.4 | 4.3 | GO:0010891 | negative regulation of sequestering of triglyceride(GO:0010891) |
| 0.4 | 3.9 | GO:0010756 | positive regulation of plasminogen activation(GO:0010756) |
| 0.4 | 1.7 | GO:0035234 | ectopic germ cell programmed cell death(GO:0035234) |
| 0.4 | 2.1 | GO:0070164 | negative regulation of adiponectin secretion(GO:0070164) |
| 0.4 | 0.8 | GO:0045347 | negative regulation of MHC class II biosynthetic process(GO:0045347) |
| 0.4 | 4.6 | GO:0030259 | lipid glycosylation(GO:0030259) |
| 0.4 | 1.6 | GO:0060672 | epithelial cell differentiation involved in embryonic placenta development(GO:0060671) epithelial cell morphogenesis involved in placental branching(GO:0060672) |
| 0.4 | 9.5 | GO:0060046 | regulation of acrosome reaction(GO:0060046) |
| 0.4 | 1.2 | GO:0021898 | regulation of transcription from RNA polymerase II promoter involved in forebrain neuron fate commitment(GO:0021882) commitment of multipotent stem cells to neuronal lineage in forebrain(GO:0021898) |
| 0.4 | 1.2 | GO:1990164 | histone H2A phosphorylation(GO:1990164) |
| 0.4 | 2.8 | GO:0051531 | NFAT protein import into nucleus(GO:0051531) regulation of NFAT protein import into nucleus(GO:0051532) |
| 0.4 | 4.8 | GO:0070233 | negative regulation of T cell apoptotic process(GO:0070233) |
| 0.4 | 2.0 | GO:0033313 | meiotic cell cycle checkpoint(GO:0033313) |
| 0.4 | 2.8 | GO:0000103 | sulfate assimilation(GO:0000103) |
| 0.4 | 7.1 | GO:0006198 | cAMP catabolic process(GO:0006198) |
| 0.4 | 50.5 | GO:0090501 | RNA phosphodiester bond hydrolysis(GO:0090501) |
| 0.4 | 1.6 | GO:0070662 | mast cell homeostasis(GO:0033023) mast cell apoptotic process(GO:0033024) regulation of mast cell apoptotic process(GO:0033025) negative regulation of mast cell apoptotic process(GO:0033026) mast cell proliferation(GO:0070662) regulation of mast cell proliferation(GO:0070666) positive regulation of mast cell proliferation(GO:0070668) |
| 0.4 | 2.3 | GO:0006561 | proline biosynthetic process(GO:0006561) |
| 0.4 | 2.3 | GO:0015866 | ADP transport(GO:0015866) |
| 0.4 | 6.9 | GO:0006907 | pinocytosis(GO:0006907) |
| 0.4 | 1.9 | GO:0048743 | positive regulation of skeletal muscle fiber development(GO:0048743) |
| 0.4 | 5.3 | GO:0033622 | integrin activation(GO:0033622) |
| 0.4 | 1.1 | GO:0072429 | response to intra-S DNA damage checkpoint signaling(GO:0072429) |
| 0.4 | 10.0 | GO:0000028 | ribosomal small subunit assembly(GO:0000028) |
| 0.4 | 2.6 | GO:0015722 | canalicular bile acid transport(GO:0015722) |
| 0.4 | 6.2 | GO:0046597 | negative regulation of viral entry into host cell(GO:0046597) |
| 0.4 | 5.4 | GO:0002675 | positive regulation of acute inflammatory response(GO:0002675) |
| 0.4 | 6.1 | GO:0006349 | regulation of gene expression by genetic imprinting(GO:0006349) |
| 0.4 | 4.3 | GO:0035634 | response to stilbenoid(GO:0035634) |
| 0.4 | 1.4 | GO:1904252 | negative regulation of bile acid biosynthetic process(GO:0070858) negative regulation of bile acid metabolic process(GO:1904252) |
| 0.4 | 5.3 | GO:0019835 | cytolysis(GO:0019835) |
| 0.4 | 3.5 | GO:0017121 | phospholipid scrambling(GO:0017121) |
| 0.4 | 6.7 | GO:0008210 | estrogen metabolic process(GO:0008210) |
| 0.3 | 0.7 | GO:0015015 | heparan sulfate proteoglycan biosynthetic process, enzymatic modification(GO:0015015) |
| 0.3 | 12.5 | GO:0030199 | collagen fibril organization(GO:0030199) |
| 0.3 | 1.0 | GO:1905098 | negative regulation of guanyl-nucleotide exchange factor activity(GO:1905098) |
| 0.3 | 4.5 | GO:0097577 | intracellular sequestering of iron ion(GO:0006880) sequestering of iron ion(GO:0097577) |
| 0.3 | 1.7 | GO:1900364 | negative regulation of mRNA polyadenylation(GO:1900364) |
| 0.3 | 17.5 | GO:0019882 | antigen processing and presentation(GO:0019882) |
| 0.3 | 4.0 | GO:0009312 | oligosaccharide biosynthetic process(GO:0009312) |
| 0.3 | 9.0 | GO:0070098 | chemokine-mediated signaling pathway(GO:0070098) |
| 0.3 | 7.6 | GO:1902042 | negative regulation of extrinsic apoptotic signaling pathway via death domain receptors(GO:1902042) |
| 0.3 | 79.2 | GO:0016485 | protein processing(GO:0016485) |
| 0.3 | 7.2 | GO:1900047 | negative regulation of blood coagulation(GO:0030195) negative regulation of hemostasis(GO:1900047) |
| 0.3 | 1.0 | GO:0035544 | negative regulation of SNARE complex assembly(GO:0035544) |
| 0.3 | 3.9 | GO:0048025 | negative regulation of mRNA splicing, via spliceosome(GO:0048025) |
| 0.3 | 2.6 | GO:0006545 | glycine biosynthetic process(GO:0006545) |
| 0.3 | 1.9 | GO:0006268 | DNA unwinding involved in DNA replication(GO:0006268) |
| 0.3 | 1.3 | GO:0002074 | extraocular skeletal muscle development(GO:0002074) |
| 0.3 | 2.5 | GO:0071985 | multivesicular body sorting pathway(GO:0071985) |
| 0.3 | 3.8 | GO:0051292 | nuclear pore complex assembly(GO:0051292) |
| 0.3 | 5.3 | GO:0048240 | sperm capacitation(GO:0048240) |
| 0.3 | 3.7 | GO:0055015 | ventricular cardiac muscle cell development(GO:0055015) |
| 0.3 | 3.7 | GO:0006921 | cellular component disassembly involved in execution phase of apoptosis(GO:0006921) apoptotic nuclear changes(GO:0030262) |
| 0.3 | 4.8 | GO:2000678 | negative regulation of transcription regulatory region DNA binding(GO:2000678) |
| 0.3 | 4.2 | GO:0006346 | methylation-dependent chromatin silencing(GO:0006346) |
| 0.3 | 2.7 | GO:0032790 | ribosome disassembly(GO:0032790) |
| 0.3 | 1.2 | GO:0043301 | negative regulation of myeloid leukocyte mediated immunity(GO:0002887) negative regulation of leukocyte degranulation(GO:0043301) negative regulation of mast cell degranulation(GO:0043305) |
| 0.3 | 3.6 | GO:0033262 | regulation of nuclear cell cycle DNA replication(GO:0033262) |
| 0.3 | 11.8 | GO:0032945 | negative regulation of mononuclear cell proliferation(GO:0032945) negative regulation of lymphocyte proliferation(GO:0050672) |
| 0.3 | 0.3 | GO:0042270 | protection from natural killer cell mediated cytotoxicity(GO:0042270) |
| 0.3 | 13.4 | GO:0033209 | tumor necrosis factor-mediated signaling pathway(GO:0033209) |
| 0.3 | 1.4 | GO:0061450 | trophoblast cell migration(GO:0061450) |
| 0.3 | 8.0 | GO:0000184 | nuclear-transcribed mRNA catabolic process, nonsense-mediated decay(GO:0000184) |
| 0.3 | 1.7 | GO:0098535 | de novo centriole assembly(GO:0098535) |
| 0.3 | 7.1 | GO:0006879 | cellular iron ion homeostasis(GO:0006879) |
| 0.3 | 2.7 | GO:0046085 | adenosine metabolic process(GO:0046085) |
| 0.3 | 2.7 | GO:0006614 | SRP-dependent cotranslational protein targeting to membrane(GO:0006614) |
| 0.3 | 0.8 | GO:0018401 | peptidyl-proline hydroxylation to 4-hydroxy-L-proline(GO:0018401) |
| 0.3 | 2.8 | GO:0071044 | histone mRNA catabolic process(GO:0071044) |
| 0.3 | 2.5 | GO:0034975 | protein folding in endoplasmic reticulum(GO:0034975) |
| 0.2 | 3.0 | GO:0000712 | resolution of meiotic recombination intermediates(GO:0000712) |
| 0.2 | 3.1 | GO:0006783 | heme biosynthetic process(GO:0006783) |
| 0.2 | 6.6 | GO:0006458 | 'de novo' protein folding(GO:0006458) |
| 0.2 | 2.1 | GO:2000060 | positive regulation of protein ubiquitination involved in ubiquitin-dependent protein catabolic process(GO:2000060) |
| 0.2 | 6.0 | GO:0035902 | response to immobilization stress(GO:0035902) |
| 0.2 | 2.3 | GO:0051895 | negative regulation of focal adhesion assembly(GO:0051895) negative regulation of adherens junction organization(GO:1903392) |
| 0.2 | 2.3 | GO:0006120 | mitochondrial electron transport, NADH to ubiquinone(GO:0006120) |
| 0.2 | 1.3 | GO:0042699 | follicle-stimulating hormone signaling pathway(GO:0042699) |
| 0.2 | 9.8 | GO:0051225 | spindle assembly(GO:0051225) |
| 0.2 | 3.8 | GO:0006895 | Golgi to endosome transport(GO:0006895) |
| 0.2 | 7.1 | GO:0002260 | lymphocyte homeostasis(GO:0002260) |
| 0.2 | 12.4 | GO:0006342 | chromatin silencing(GO:0006342) |
| 0.2 | 0.2 | GO:0034021 | response to silicon dioxide(GO:0034021) |
| 0.2 | 12.9 | GO:0034446 | substrate adhesion-dependent cell spreading(GO:0034446) |
| 0.2 | 1.1 | GO:0035766 | cell chemotaxis to fibroblast growth factor(GO:0035766) endothelial cell chemotaxis to fibroblast growth factor(GO:0035768) branch elongation involved in ureteric bud branching(GO:0060681) regulation of cell chemotaxis to fibroblast growth factor(GO:1904847) regulation of endothelial cell chemotaxis to fibroblast growth factor(GO:2000544) |
| 0.2 | 9.4 | GO:2000134 | negative regulation of G1/S transition of mitotic cell cycle(GO:2000134) |
| 0.2 | 2.5 | GO:0046784 | viral mRNA export from host cell nucleus(GO:0046784) |
| 0.2 | 3.3 | GO:0006359 | regulation of transcription from RNA polymerase III promoter(GO:0006359) |
| 0.2 | 3.3 | GO:0050434 | positive regulation of viral transcription(GO:0050434) |
| 0.2 | 1.7 | GO:0045603 | positive regulation of endothelial cell differentiation(GO:0045603) |
| 0.2 | 0.8 | GO:1990830 | response to leukemia inhibitory factor(GO:1990823) cellular response to leukemia inhibitory factor(GO:1990830) |
| 0.2 | 1.4 | GO:0061029 | eyelid development in camera-type eye(GO:0061029) |
| 0.2 | 1.2 | GO:0043686 | co-translational protein modification(GO:0043686) |
| 0.2 | 3.9 | GO:0035196 | dsRNA fragmentation(GO:0031050) production of miRNAs involved in gene silencing by miRNA(GO:0035196) production of small RNA involved in gene silencing by RNA(GO:0070918) |
| 0.2 | 4.5 | GO:0006303 | double-strand break repair via nonhomologous end joining(GO:0006303) |
| 0.2 | 2.9 | GO:0019236 | response to pheromone(GO:0019236) |
| 0.2 | 1.3 | GO:0019511 | peptidyl-proline hydroxylation(GO:0019511) |
| 0.2 | 21.8 | GO:0002250 | adaptive immune response(GO:0002250) |
| 0.2 | 0.5 | GO:1904430 | negative regulation of t-circle formation(GO:1904430) |
| 0.2 | 5.8 | GO:0051290 | protein heterotetramerization(GO:0051290) |
| 0.2 | 0.5 | GO:0098507 | polynucleotide 5' dephosphorylation(GO:0098507) |
| 0.2 | 1.4 | GO:0010578 | regulation of adenylate cyclase activity involved in G-protein coupled receptor signaling pathway(GO:0010578) positive regulation of adenylate cyclase activity involved in G-protein coupled receptor signaling pathway(GO:0010579) |
| 0.2 | 1.0 | GO:2000766 | negative regulation of cytoplasmic translation(GO:2000766) |
| 0.2 | 2.0 | GO:0070266 | necroptotic process(GO:0070266) |
| 0.2 | 4.4 | GO:0033120 | positive regulation of RNA splicing(GO:0033120) |
| 0.2 | 0.7 | GO:0009597 | detection of virus(GO:0009597) |
| 0.2 | 8.9 | GO:0006334 | nucleosome assembly(GO:0006334) |
| 0.2 | 6.9 | GO:0006904 | vesicle docking involved in exocytosis(GO:0006904) |
| 0.2 | 2.8 | GO:0036159 | inner dynein arm assembly(GO:0036159) |
| 0.2 | 7.9 | GO:0050728 | negative regulation of inflammatory response(GO:0050728) |
| 0.2 | 3.9 | GO:0000462 | maturation of SSU-rRNA from tricistronic rRNA transcript (SSU-rRNA, 5.8S rRNA, LSU-rRNA)(GO:0000462) |
| 0.2 | 3.7 | GO:0030970 | retrograde protein transport, ER to cytosol(GO:0030970) |
| 0.2 | 0.8 | GO:0021650 | vestibulocochlear nerve formation(GO:0021650) |
| 0.2 | 1.2 | GO:0018298 | protein-chromophore linkage(GO:0018298) |
| 0.2 | 0.6 | GO:0070973 | protein localization to endoplasmic reticulum exit site(GO:0070973) |
| 0.1 | 3.6 | GO:0046856 | phosphatidylinositol dephosphorylation(GO:0046856) |
| 0.1 | 9.2 | GO:0001942 | hair follicle development(GO:0001942) skin epidermis development(GO:0098773) |
| 0.1 | 0.4 | GO:0071692 | sequestering of BMP in extracellular matrix(GO:0035582) protein localization to extracellular region(GO:0071692) maintenance of protein location in extracellular region(GO:0071694) |
| 0.1 | 0.4 | GO:0033869 | coenzyme A catabolic process(GO:0015938) nucleoside bisphosphate catabolic process(GO:0033869) ribonucleoside bisphosphate catabolic process(GO:0034031) purine nucleoside bisphosphate catabolic process(GO:0034034) acetyl-CoA catabolic process(GO:0046356) |
| 0.1 | 2.8 | GO:0031116 | positive regulation of microtubule polymerization(GO:0031116) |
| 0.1 | 1.5 | GO:0072393 | microtubule anchoring at microtubule organizing center(GO:0072393) |
| 0.1 | 0.4 | GO:1901550 | regulation of endothelial cell development(GO:1901550) regulation of establishment of endothelial barrier(GO:1903140) |
| 0.1 | 9.0 | GO:0031398 | positive regulation of protein ubiquitination(GO:0031398) |
| 0.1 | 2.1 | GO:0031163 | iron-sulfur cluster assembly(GO:0016226) metallo-sulfur cluster assembly(GO:0031163) |
| 0.1 | 0.4 | GO:0046061 | dATP catabolic process(GO:0046061) |
| 0.1 | 1.1 | GO:0048312 | intracellular distribution of mitochondria(GO:0048312) |
| 0.1 | 1.1 | GO:0070934 | CRD-mediated mRNA stabilization(GO:0070934) |
| 0.1 | 1.3 | GO:0045899 | positive regulation of RNA polymerase II transcriptional preinitiation complex assembly(GO:0045899) |
| 0.1 | 4.0 | GO:0006278 | RNA-dependent DNA biosynthetic process(GO:0006278) telomere maintenance via telomerase(GO:0007004) |
| 0.1 | 25.0 | GO:0007059 | chromosome segregation(GO:0007059) |
| 0.1 | 0.4 | GO:0010041 | response to iron(III) ion(GO:0010041) |
| 0.1 | 1.1 | GO:0007250 | activation of NF-kappaB-inducing kinase activity(GO:0007250) |
| 0.1 | 1.1 | GO:0045648 | positive regulation of erythrocyte differentiation(GO:0045648) |
| 0.1 | 5.3 | GO:0046834 | lipid phosphorylation(GO:0046834) |
| 0.1 | 0.3 | GO:0032472 | Golgi calcium ion transport(GO:0032472) |
| 0.1 | 0.7 | GO:0033572 | transferrin transport(GO:0033572) |
| 0.1 | 4.0 | GO:0000245 | spliceosomal complex assembly(GO:0000245) |
| 0.1 | 6.0 | GO:0035914 | skeletal muscle cell differentiation(GO:0035914) |
| 0.1 | 0.2 | GO:0072003 | kidney rudiment formation(GO:0072003) nephric duct formation(GO:0072179) mesonephric duct morphogenesis(GO:0072180) mesonephric duct formation(GO:0072181) |
| 0.1 | 1.1 | GO:0055012 | ventricular cardiac muscle cell differentiation(GO:0055012) |
| 0.1 | 6.0 | GO:0031016 | pancreas development(GO:0031016) |
| 0.1 | 0.8 | GO:0045736 | negative regulation of cyclin-dependent protein serine/threonine kinase activity(GO:0045736) |
| 0.1 | 0.9 | GO:0007602 | phototransduction(GO:0007602) |
| 0.1 | 0.2 | GO:0032429 | negative regulation of phospholipase activity(GO:0010519) regulation of phospholipase A2 activity(GO:0032429) |
| 0.1 | 0.5 | GO:0055091 | phospholipid homeostasis(GO:0055091) |
| 0.1 | 1.7 | GO:0006471 | protein ADP-ribosylation(GO:0006471) |
| 0.1 | 3.0 | GO:0010501 | RNA secondary structure unwinding(GO:0010501) |
| 0.1 | 0.3 | GO:0000255 | allantoin metabolic process(GO:0000255) |
| 0.1 | 0.8 | GO:1902065 | response to L-glutamate(GO:1902065) |
| 0.1 | 4.0 | GO:0007229 | integrin-mediated signaling pathway(GO:0007229) |
| 0.1 | 0.2 | GO:0042350 | GDP-L-fucose biosynthetic process(GO:0042350) GDP-L-fucose metabolic process(GO:0046368) |
| 0.1 | 0.5 | GO:0017062 | respiratory chain complex III assembly(GO:0017062) mitochondrial respiratory chain complex III assembly(GO:0034551) mitochondrial respiratory chain complex III biogenesis(GO:0097033) |
| 0.1 | 1.4 | GO:0043280 | positive regulation of cysteine-type endopeptidase activity involved in apoptotic process(GO:0043280) |
| 0.1 | 1.0 | GO:0043248 | proteasome assembly(GO:0043248) |
| 0.1 | 0.4 | GO:2000324 | positive regulation of glucocorticoid receptor signaling pathway(GO:2000324) |
| 0.1 | 0.7 | GO:0001833 | inner cell mass cell proliferation(GO:0001833) |
| 0.1 | 0.2 | GO:0060296 | regulation of cilium movement involved in cell motility(GO:0060295) regulation of cilium beat frequency involved in ciliary motility(GO:0060296) regulation of cilium-dependent cell motility(GO:1902019) |
| 0.1 | 1.9 | GO:0009250 | glycogen biosynthetic process(GO:0005978) glucan biosynthetic process(GO:0009250) |
| 0.1 | 0.4 | GO:2000051 | negative regulation of non-canonical Wnt signaling pathway(GO:2000051) |
| 0.1 | 0.2 | GO:0019262 | N-acetylneuraminate catabolic process(GO:0019262) |
| 0.1 | 2.4 | GO:0006182 | cGMP biosynthetic process(GO:0006182) |
| 0.1 | 1.1 | GO:2000036 | regulation of stem cell population maintenance(GO:2000036) |
| 0.1 | 2.9 | GO:0032092 | positive regulation of protein binding(GO:0032092) |
| 0.1 | 0.3 | GO:0046654 | brainstem development(GO:0003360) 'de novo' IMP biosynthetic process(GO:0006189) tetrahydrofolate biosynthetic process(GO:0046654) |
| 0.1 | 0.1 | GO:0032823 | regulation of natural killer cell differentiation(GO:0032823) |
| 0.1 | 0.8 | GO:1900087 | positive regulation of G1/S transition of mitotic cell cycle(GO:1900087) |
| 0.0 | 1.6 | GO:0060711 | labyrinthine layer development(GO:0060711) |
| 0.0 | 1.8 | GO:0002088 | lens development in camera-type eye(GO:0002088) |
| 0.0 | 0.5 | GO:0045947 | negative regulation of translational initiation(GO:0045947) |
| 0.0 | 1.7 | GO:0045454 | cell redox homeostasis(GO:0045454) |
| 0.0 | 2.6 | GO:0007368 | determination of left/right symmetry(GO:0007368) |
| 0.0 | 1.3 | GO:0032007 | negative regulation of TOR signaling(GO:0032007) |
| 0.0 | 0.6 | GO:0050830 | defense response to Gram-positive bacterium(GO:0050830) |
| 0.0 | 1.2 | GO:0006405 | RNA export from nucleus(GO:0006405) |
| 0.0 | 0.1 | GO:0003365 | establishment of cell polarity involved in ameboidal cell migration(GO:0003365) |
| 0.0 | 0.2 | GO:0044458 | motile cilium assembly(GO:0044458) |
| 0.0 | 0.1 | GO:0045329 | carnitine biosynthetic process(GO:0045329) |
| 0.0 | 0.1 | GO:0042226 | interleukin-6 biosynthetic process(GO:0042226) |
| 0.0 | 0.9 | GO:0002062 | chondrocyte differentiation(GO:0002062) |
| 0.0 | 0.8 | GO:0045727 | positive regulation of translation(GO:0045727) |
| 0.0 | 0.3 | GO:0019373 | epoxygenase P450 pathway(GO:0019373) |
| 0.0 | 0.1 | GO:0035356 | cellular triglyceride homeostasis(GO:0035356) |
| 0.0 | 0.3 | GO:0016925 | protein sumoylation(GO:0016925) |
Gene overrepresentation in cellular component category:
| Log-likelihood per target | Total log-likelihood | Term | Description |
|---|---|---|---|
| 13.5 | 53.9 | GO:0019815 | B cell receptor complex(GO:0019815) |
| 6.8 | 27.3 | GO:0042571 | immunoglobulin complex, circulating(GO:0042571) |
| 5.1 | 40.4 | GO:0042105 | alpha-beta T cell receptor complex(GO:0042105) |
| 4.9 | 19.7 | GO:0031436 | BRCA1-BARD1 complex(GO:0031436) |
| 4.8 | 28.9 | GO:0097342 | ripoptosome(GO:0097342) |
| 4.8 | 14.3 | GO:1990682 | CSF1-CSF1R complex(GO:1990682) |
| 4.6 | 18.4 | GO:0097149 | centralspindlin complex(GO:0097149) |
| 4.4 | 70.3 | GO:0042613 | MHC class II protein complex(GO:0042613) |
| 4.3 | 12.8 | GO:0005944 | phosphatidylinositol 3-kinase complex, class IB(GO:0005944) |
| 3.3 | 16.6 | GO:0020003 | symbiont-containing vacuole(GO:0020003) |
| 3.1 | 18.8 | GO:0033093 | Weibel-Palade body(GO:0033093) |
| 3.1 | 15.5 | GO:0072557 | IPAF inflammasome complex(GO:0072557) |
| 2.9 | 8.8 | GO:0097629 | extrinsic component of omegasome membrane(GO:0097629) |
| 2.6 | 10.5 | GO:0000444 | MIS12/MIND type complex(GO:0000444) |
| 2.6 | 10.4 | GO:0018444 | translation release factor complex(GO:0018444) |
| 2.3 | 34.8 | GO:0001931 | uropod(GO:0001931) cell trailing edge(GO:0031254) |
| 2.2 | 27.0 | GO:0031232 | extrinsic component of external side of plasma membrane(GO:0031232) |
| 2.2 | 10.8 | GO:0098536 | deuterosome(GO:0098536) |
| 2.2 | 6.5 | GO:0046691 | intracellular canaliculus(GO:0046691) |
| 2.0 | 13.8 | GO:0034993 | microtubule organizing center attachment site(GO:0034992) LINC complex(GO:0034993) |
| 1.8 | 5.3 | GO:0034272 | phosphatidylinositol 3-kinase complex, class III, type I(GO:0034271) phosphatidylinositol 3-kinase complex, class III, type II(GO:0034272) |
| 1.7 | 8.3 | GO:0008622 | epsilon DNA polymerase complex(GO:0008622) |
| 1.6 | 25.5 | GO:0042612 | MHC class I protein complex(GO:0042612) |
| 1.6 | 40.6 | GO:0097225 | sperm midpiece(GO:0097225) |
| 1.5 | 4.6 | GO:0070557 | PCNA-p21 complex(GO:0070557) |
| 1.5 | 28.3 | GO:0031527 | filopodium membrane(GO:0031527) |
| 1.4 | 10.0 | GO:0042825 | TAP complex(GO:0042825) |
| 1.4 | 19.5 | GO:0000164 | protein phosphatase type 1 complex(GO:0000164) |
| 1.3 | 2.5 | GO:1990462 | omegasome membrane(GO:1903349) omegasome(GO:1990462) |
| 1.2 | 10.9 | GO:0033256 | I-kappaB/NF-kappaB complex(GO:0033256) |
| 1.2 | 14.3 | GO:0005861 | troponin complex(GO:0005861) |
| 1.2 | 9.3 | GO:0005638 | lamin filament(GO:0005638) |
| 1.1 | 10.3 | GO:0000813 | ESCRT I complex(GO:0000813) |
| 1.1 | 16.8 | GO:1990023 | mitotic spindle midzone(GO:1990023) |
| 1.1 | 3.3 | GO:1990590 | ATF1-ATF4 transcription factor complex(GO:1990590) |
| 1.1 | 3.2 | GO:0032173 | septin collar(GO:0032173) |
| 1.0 | 3.1 | GO:0031205 | endoplasmic reticulum Sec complex(GO:0031205) |
| 1.0 | 17.3 | GO:0042581 | specific granule(GO:0042581) |
| 1.0 | 23.3 | GO:0030057 | desmosome(GO:0030057) |
| 1.0 | 8.9 | GO:1990075 | periciliary membrane compartment(GO:1990075) |
| 1.0 | 3.9 | GO:0070876 | SOSS complex(GO:0070876) |
| 1.0 | 6.8 | GO:0005862 | muscle thin filament tropomyosin(GO:0005862) |
| 0.9 | 6.3 | GO:0090543 | Flemming body(GO:0090543) |
| 0.9 | 4.5 | GO:1903768 | sweet taste receptor complex(GO:1903767) taste receptor complex(GO:1903768) |
| 0.9 | 17.6 | GO:0010369 | chromocenter(GO:0010369) |
| 0.9 | 40.2 | GO:0016235 | aggresome(GO:0016235) |
| 0.8 | 12.7 | GO:0005942 | phosphatidylinositol 3-kinase complex(GO:0005942) |
| 0.8 | 5.8 | GO:0097197 | tetraspanin-enriched microdomain(GO:0097197) |
| 0.8 | 2.5 | GO:0044611 | nuclear pore inner ring(GO:0044611) |
| 0.8 | 4.5 | GO:0042567 | insulin-like growth factor ternary complex(GO:0042567) |
| 0.7 | 3.0 | GO:0002947 | tumor necrosis factor receptor superfamily complex(GO:0002947) |
| 0.7 | 222.8 | GO:0009897 | external side of plasma membrane(GO:0009897) |
| 0.7 | 4.4 | GO:0089701 | U2AF(GO:0089701) |
| 0.7 | 4.3 | GO:0097512 | cardiac myofibril(GO:0097512) |
| 0.7 | 5.0 | GO:0036449 | microtubule minus-end(GO:0036449) |
| 0.7 | 7.1 | GO:0070652 | HAUS complex(GO:0070652) |
| 0.7 | 4.7 | GO:0001652 | granular component(GO:0001652) |
| 0.7 | 9.3 | GO:0005832 | chaperonin-containing T-complex(GO:0005832) |
| 0.7 | 7.3 | GO:0031464 | Cul4A-RING E3 ubiquitin ligase complex(GO:0031464) |
| 0.7 | 63.9 | GO:0000786 | nucleosome(GO:0000786) |
| 0.6 | 15.5 | GO:0005839 | proteasome core complex(GO:0005839) |
| 0.6 | 2.6 | GO:0070552 | BRISC complex(GO:0070552) |
| 0.6 | 4.1 | GO:0031415 | NatA complex(GO:0031415) |
| 0.6 | 1.7 | GO:0000839 | Hrd1p ubiquitin ligase ERAD-L complex(GO:0000839) |
| 0.6 | 3.4 | GO:0031904 | endosome lumen(GO:0031904) |
| 0.5 | 3.1 | GO:0097209 | epidermal lamellar body(GO:0097209) |
| 0.5 | 12.6 | GO:0001891 | phagocytic cup(GO:0001891) |
| 0.5 | 7.4 | GO:0000800 | lateral element(GO:0000800) |
| 0.5 | 7.3 | GO:0035098 | ESC/E(Z) complex(GO:0035098) |
| 0.5 | 4.6 | GO:0008290 | F-actin capping protein complex(GO:0008290) |
| 0.5 | 4.2 | GO:0031983 | vesicle lumen(GO:0031983) |
| 0.4 | 27.8 | GO:0000777 | condensed chromosome kinetochore(GO:0000777) |
| 0.4 | 4.5 | GO:0005796 | Golgi lumen(GO:0005796) |
| 0.4 | 3.0 | GO:0044322 | endoplasmic reticulum quality control compartment(GO:0044322) |
| 0.4 | 1.7 | GO:0032044 | DSIF complex(GO:0032044) |
| 0.4 | 2.9 | GO:0005850 | eukaryotic translation initiation factor 2 complex(GO:0005850) |
| 0.4 | 29.4 | GO:0022627 | cytosolic small ribosomal subunit(GO:0022627) |
| 0.4 | 4.1 | GO:0030688 | preribosome, small subunit precursor(GO:0030688) |
| 0.4 | 2.5 | GO:0016602 | CCAAT-binding factor complex(GO:0016602) |
| 0.3 | 2.1 | GO:0002081 | outer acrosomal membrane(GO:0002081) |
| 0.3 | 2.7 | GO:0005786 | signal recognition particle, endoplasmic reticulum targeting(GO:0005786) |
| 0.3 | 3.0 | GO:0071821 | FANCM-MHF complex(GO:0071821) |
| 0.3 | 8.4 | GO:0035145 | exon-exon junction complex(GO:0035145) |
| 0.3 | 2.2 | GO:1990316 | ATG1/ULK1 kinase complex(GO:1990316) |
| 0.3 | 5.9 | GO:0030014 | CCR4-NOT complex(GO:0030014) |
| 0.3 | 2.4 | GO:0044613 | nuclear pore central transport channel(GO:0044613) nuclear pore nuclear basket(GO:0044615) |
| 0.3 | 28.3 | GO:0022625 | cytosolic large ribosomal subunit(GO:0022625) |
| 0.3 | 5.3 | GO:0043196 | varicosity(GO:0043196) |
| 0.3 | 1.5 | GO:0005642 | annulate lamellae(GO:0005642) |
| 0.3 | 2.0 | GO:0036128 | CatSper complex(GO:0036128) |
| 0.3 | 1.4 | GO:0071203 | WASH complex(GO:0071203) |
| 0.3 | 1.4 | GO:0042587 | glycogen granule(GO:0042587) |
| 0.3 | 5.1 | GO:0033391 | chromatoid body(GO:0033391) |
| 0.3 | 2.9 | GO:0032541 | cortical endoplasmic reticulum(GO:0032541) |
| 0.3 | 1.0 | GO:0005851 | eukaryotic translation initiation factor 2B complex(GO:0005851) |
| 0.3 | 2.5 | GO:0000347 | THO complex(GO:0000347) THO complex part of transcription export complex(GO:0000445) |
| 0.2 | 1.0 | GO:0097422 | tubular endosome(GO:0097422) |
| 0.2 | 11.3 | GO:0005801 | cis-Golgi network(GO:0005801) |
| 0.2 | 1.6 | GO:0000796 | condensin complex(GO:0000796) |
| 0.2 | 5.6 | GO:0000145 | exocyst(GO:0000145) |
| 0.2 | 1.1 | GO:0048476 | Holliday junction resolvase complex(GO:0048476) ERCC4-ERCC1 complex(GO:0070522) |
| 0.2 | 1.5 | GO:0000127 | transcription factor TFIIIC complex(GO:0000127) |
| 0.2 | 1.3 | GO:0097550 | transcriptional preinitiation complex(GO:0097550) |
| 0.2 | 5.2 | GO:0042629 | mast cell granule(GO:0042629) |
| 0.2 | 3.4 | GO:0031011 | Ino80 complex(GO:0031011) DNA helicase complex(GO:0033202) |
| 0.2 | 1.4 | GO:0045293 | mRNA editing complex(GO:0045293) |
| 0.2 | 7.9 | GO:0055038 | recycling endosome membrane(GO:0055038) |
| 0.2 | 14.2 | GO:0005776 | autophagosome(GO:0005776) |
| 0.2 | 1.9 | GO:0042555 | MCM complex(GO:0042555) |
| 0.2 | 4.5 | GO:0046930 | pore complex(GO:0046930) |
| 0.2 | 0.5 | GO:0097543 | ciliary inversin compartment(GO:0097543) |
| 0.2 | 3.0 | GO:0016327 | apicolateral plasma membrane(GO:0016327) |
| 0.2 | 1.4 | GO:0032009 | early phagosome(GO:0032009) |
| 0.2 | 2.7 | GO:0016471 | vacuolar proton-transporting V-type ATPase complex(GO:0016471) |
| 0.1 | 3.4 | GO:0035327 | transcriptionally active chromatin(GO:0035327) |
| 0.1 | 0.4 | GO:0032798 | Swi5-Sfr1 complex(GO:0032798) |
| 0.1 | 1.1 | GO:0070937 | CRD-mediated mRNA stability complex(GO:0070937) |
| 0.1 | 6.9 | GO:0005876 | spindle microtubule(GO:0005876) |
| 0.1 | 0.8 | GO:0000125 | PCAF complex(GO:0000125) |
| 0.1 | 12.4 | GO:0000793 | condensed chromosome(GO:0000793) |
| 0.1 | 0.8 | GO:0097539 | ciliary transition fiber(GO:0097539) |
| 0.1 | 2.8 | GO:1990752 | microtubule end(GO:1990752) |
| 0.1 | 2.9 | GO:0008074 | guanylate cyclase complex, soluble(GO:0008074) |
| 0.1 | 15.5 | GO:0044798 | nuclear transcription factor complex(GO:0044798) |
| 0.1 | 2.1 | GO:0030670 | phagocytic vesicle membrane(GO:0030670) |
| 0.1 | 1.3 | GO:0005859 | muscle myosin complex(GO:0005859) |
| 0.1 | 1.0 | GO:0008541 | proteasome regulatory particle, lid subcomplex(GO:0008541) |
| 0.1 | 1.2 | GO:0071564 | npBAF complex(GO:0071564) |
| 0.1 | 1.4 | GO:0044666 | MLL3/4 complex(GO:0044666) |
| 0.1 | 1.7 | GO:0001520 | outer dense fiber(GO:0001520) |
| 0.1 | 10.2 | GO:0030496 | midbody(GO:0030496) |
| 0.1 | 3.6 | GO:0002102 | podosome(GO:0002102) |
| 0.1 | 1.0 | GO:0042582 | primary lysosome(GO:0005766) azurophil granule(GO:0042582) |
| 0.1 | 1.2 | GO:0005847 | mRNA cleavage and polyadenylation specificity factor complex(GO:0005847) |
| 0.1 | 4.0 | GO:0015030 | Cajal body(GO:0015030) |
| 0.1 | 1.4 | GO:0098636 | integrin complex(GO:0008305) protein complex involved in cell adhesion(GO:0098636) |
| 0.1 | 7.0 | GO:0072562 | blood microparticle(GO:0072562) |
| 0.1 | 1.2 | GO:0008250 | oligosaccharyltransferase complex(GO:0008250) |
| 0.1 | 1.2 | GO:0035102 | PRC1 complex(GO:0035102) |
| 0.1 | 1.1 | GO:0045120 | pronucleus(GO:0045120) |
| 0.1 | 1.0 | GO:1990124 | messenger ribonucleoprotein complex(GO:1990124) |
| 0.1 | 0.4 | GO:1990635 | proximal dendrite(GO:1990635) |
| 0.1 | 90.3 | GO:0005615 | extracellular space(GO:0005615) |
| 0.1 | 1.3 | GO:0005779 | integral component of peroxisomal membrane(GO:0005779) intrinsic component of peroxisomal membrane(GO:0031231) |
| 0.1 | 0.4 | GO:0072357 | PTW/PP1 phosphatase complex(GO:0072357) |
| 0.0 | 0.4 | GO:0030061 | mitochondrial crista(GO:0030061) |
| 0.0 | 1.3 | GO:0008180 | COP9 signalosome(GO:0008180) |
| 0.0 | 0.3 | GO:0005658 | alpha DNA polymerase:primase complex(GO:0005658) |
| 0.0 | 0.1 | GO:0005899 | insulin receptor complex(GO:0005899) |
| 0.0 | 0.8 | GO:0032420 | stereocilium(GO:0032420) |
| 0.0 | 1.8 | GO:0005814 | centriole(GO:0005814) |
| 0.0 | 1.5 | GO:0036064 | ciliary basal body(GO:0036064) |
| 0.0 | 1.2 | GO:0045095 | keratin filament(GO:0045095) |
| 0.0 | 3.6 | GO:0000790 | nuclear chromatin(GO:0000790) |
| 0.0 | 0.1 | GO:0000243 | commitment complex(GO:0000243) |
| 0.0 | 0.2 | GO:0031229 | integral component of nuclear inner membrane(GO:0005639) intrinsic component of nuclear inner membrane(GO:0031229) |
| 0.0 | 0.1 | GO:0031143 | pseudopodium(GO:0031143) |
| 0.0 | 0.9 | GO:0015934 | large ribosomal subunit(GO:0015934) |
Gene overrepresentation in molecular function category:
| Log-likelihood per target | Total log-likelihood | Term | Description |
|---|---|---|---|
| 9.5 | 47.3 | GO:0070892 | lipoteichoic acid receptor activity(GO:0070892) |
| 8.7 | 26.1 | GO:0004704 | NF-kappaB-inducing kinase activity(GO:0004704) |
| 7.9 | 23.8 | GO:0003953 | NAD+ nucleosidase activity(GO:0003953) |
| 7.2 | 21.7 | GO:0032810 | sterol response element binding(GO:0032810) |
| 5.2 | 26.1 | GO:0019770 | IgG receptor activity(GO:0019770) |
| 4.6 | 9.2 | GO:0031735 | CCR10 chemokine receptor binding(GO:0031735) |
| 4.5 | 40.4 | GO:0019198 | transmembrane receptor protein tyrosine phosphatase activity(GO:0005001) transmembrane receptor protein phosphatase activity(GO:0019198) |
| 4.5 | 13.4 | GO:0001716 | L-amino-acid oxidase activity(GO:0001716) |
| 4.3 | 51.9 | GO:0034987 | immunoglobulin receptor binding(GO:0034987) |
| 3.8 | 15.1 | GO:0016019 | peptidoglycan receptor activity(GO:0016019) |
| 3.6 | 14.3 | GO:0031686 | A1 adenosine receptor binding(GO:0031686) |
| 3.3 | 10.0 | GO:0015433 | peptide antigen-transporting ATPase activity(GO:0015433) tapasin binding(GO:0046980) |
| 3.3 | 16.6 | GO:0016726 | xanthine dehydrogenase activity(GO:0004854) oxidoreductase activity, acting on CH or CH2 groups, NAD or NADP as acceptor(GO:0016726) |
| 3.3 | 16.5 | GO:0048248 | CXCR3 chemokine receptor binding(GO:0048248) |
| 3.3 | 9.9 | GO:0004852 | uroporphyrinogen-III synthase activity(GO:0004852) |
| 3.1 | 12.3 | GO:0005415 | nucleoside:sodium symporter activity(GO:0005415) |
| 3.0 | 27.0 | GO:0008329 | signaling pattern recognition receptor activity(GO:0008329) pattern recognition receptor activity(GO:0038187) |
| 2.9 | 8.8 | GO:0004515 | nicotinamide-nucleotide adenylyltransferase activity(GO:0000309) nicotinate-nucleotide adenylyltransferase activity(GO:0004515) |
| 2.8 | 19.8 | GO:0031433 | telethonin binding(GO:0031433) |
| 2.8 | 8.4 | GO:0001847 | opsonin receptor activity(GO:0001847) |
| 2.7 | 10.8 | GO:0004949 | cannabinoid receptor activity(GO:0004949) |
| 2.6 | 10.6 | GO:0019862 | IgA binding(GO:0019862) |
| 2.6 | 7.9 | GO:0070976 | TIR domain binding(GO:0070976) |
| 2.6 | 15.5 | GO:0042289 | MHC class II protein binding(GO:0042289) |
| 2.5 | 12.7 | GO:0046934 | phosphatidylinositol-4,5-bisphosphate 3-kinase activity(GO:0046934) phosphatidylinositol bisphosphate kinase activity(GO:0052813) |
| 2.4 | 21.9 | GO:0045236 | CXCR chemokine receptor binding(GO:0045236) |
| 2.4 | 12.0 | GO:0019834 | phospholipase A2 inhibitor activity(GO:0019834) |
| 2.4 | 23.9 | GO:0019957 | C-C chemokine binding(GO:0019957) |
| 2.2 | 20.0 | GO:0004716 | receptor signaling protein tyrosine kinase activity(GO:0004716) |
| 2.2 | 28.4 | GO:1990405 | protein antigen binding(GO:1990405) |
| 2.2 | 6.5 | GO:0015203 | polyamine transmembrane transporter activity(GO:0015203) putrescine transmembrane transporter activity(GO:0015489) |
| 2.2 | 32.3 | GO:0071933 | Arp2/3 complex binding(GO:0071933) |
| 2.1 | 8.5 | GO:0043533 | inositol 1,3,4,5 tetrakisphosphate binding(GO:0043533) |
| 2.1 | 38.0 | GO:0023026 | MHC class II protein complex binding(GO:0023026) |
| 2.1 | 8.2 | GO:0003989 | acetyl-CoA carboxylase activity(GO:0003989) |
| 2.0 | 6.0 | GO:0004060 | arylamine N-acetyltransferase activity(GO:0004060) |
| 2.0 | 43.8 | GO:0042288 | MHC class I protein binding(GO:0042288) |
| 2.0 | 5.9 | GO:0031728 | CCR3 chemokine receptor binding(GO:0031728) |
| 2.0 | 9.8 | GO:0005111 | type 1 fibroblast growth factor receptor binding(GO:0005105) type 2 fibroblast growth factor receptor binding(GO:0005111) |
| 1.9 | 13.6 | GO:0004767 | sphingomyelin phosphodiesterase activity(GO:0004767) |
| 1.8 | 16.5 | GO:0015093 | ferrous iron transmembrane transporter activity(GO:0015093) |
| 1.8 | 23.0 | GO:0033691 | sialic acid binding(GO:0033691) |
| 1.7 | 13.9 | GO:0030274 | LIM domain binding(GO:0030274) |
| 1.7 | 12.1 | GO:0005432 | calcium:sodium antiporter activity(GO:0005432) |
| 1.7 | 8.5 | GO:0008310 | single-stranded DNA 3'-5' exodeoxyribonuclease activity(GO:0008310) |
| 1.5 | 12.4 | GO:0016494 | C-X-C chemokine receptor activity(GO:0016494) C-X-C chemokine binding(GO:0019958) |
| 1.5 | 7.7 | GO:0001729 | ceramide kinase activity(GO:0001729) |
| 1.5 | 4.6 | GO:0032139 | dinucleotide insertion or deletion binding(GO:0032139) |
| 1.5 | 9.0 | GO:0016493 | C-C chemokine receptor activity(GO:0016493) |
| 1.5 | 8.8 | GO:0032051 | clathrin light chain binding(GO:0032051) |
| 1.4 | 5.8 | GO:0005087 | Ran guanyl-nucleotide exchange factor activity(GO:0005087) |
| 1.4 | 2.9 | GO:0031711 | bradykinin receptor binding(GO:0031711) |
| 1.4 | 5.7 | GO:0008241 | peptidyl-dipeptidase activity(GO:0008241) |
| 1.4 | 17.1 | GO:0031730 | CCR5 chemokine receptor binding(GO:0031730) |
| 1.4 | 4.1 | GO:0048408 | epidermal growth factor binding(GO:0048408) |
| 1.3 | 12.1 | GO:0008525 | phosphatidylcholine transporter activity(GO:0008525) |
| 1.3 | 4.0 | GO:0044715 | 8-oxo-dGDP phosphatase activity(GO:0044715) |
| 1.3 | 17.4 | GO:0015924 | mannosyl-oligosaccharide mannosidase activity(GO:0015924) |
| 1.3 | 8.0 | GO:0008467 | [heparan sulfate]-glucosamine 3-sulfotransferase 1 activity(GO:0008467) |
| 1.3 | 6.5 | GO:0030348 | syntaxin-3 binding(GO:0030348) |
| 1.3 | 20.6 | GO:0051400 | BH domain binding(GO:0051400) |
| 1.3 | 3.8 | GO:0070053 | thrombospondin receptor activity(GO:0070053) |
| 1.3 | 5.0 | GO:0015265 | urea channel activity(GO:0015265) |
| 1.2 | 7.4 | GO:0000150 | recombinase activity(GO:0000150) |
| 1.2 | 3.6 | GO:0004657 | proline dehydrogenase activity(GO:0004657) |
| 1.2 | 4.8 | GO:0089720 | caspase binding(GO:0089720) |
| 1.2 | 5.8 | GO:0004974 | leukotriene receptor activity(GO:0004974) |
| 1.2 | 12.8 | GO:0016303 | 1-phosphatidylinositol-3-kinase activity(GO:0016303) |
| 1.2 | 3.5 | GO:0016263 | glycoprotein-N-acetylgalactosamine 3-beta-galactosyltransferase activity(GO:0016263) |
| 1.1 | 3.4 | GO:0035651 | AP-1 adaptor complex binding(GO:0035650) AP-3 adaptor complex binding(GO:0035651) |
| 1.1 | 3.4 | GO:0008107 | galactoside 2-alpha-L-fucosyltransferase activity(GO:0008107) alpha-(1,2)-fucosyltransferase activity(GO:0031127) |
| 1.1 | 4.5 | GO:0003842 | 1-pyrroline-5-carboxylate dehydrogenase activity(GO:0003842) |
| 1.1 | 4.5 | GO:0005163 | nerve growth factor receptor binding(GO:0005163) |
| 1.1 | 3.3 | GO:0015204 | urea transmembrane transporter activity(GO:0015204) |
| 1.1 | 5.4 | GO:0045322 | unmethylated CpG binding(GO:0045322) |
| 1.1 | 4.3 | GO:0004740 | pyruvate dehydrogenase (acetyl-transferring) kinase activity(GO:0004740) |
| 1.0 | 9.4 | GO:0001730 | 2'-5'-oligoadenylate synthetase activity(GO:0001730) |
| 1.0 | 225.7 | GO:0004252 | serine-type endopeptidase activity(GO:0004252) |
| 1.0 | 21.6 | GO:0030676 | Rac guanyl-nucleotide exchange factor activity(GO:0030676) |
| 1.0 | 19.5 | GO:0005031 | tumor necrosis factor-activated receptor activity(GO:0005031) death receptor activity(GO:0005035) |
| 1.0 | 27.2 | GO:0043027 | cysteine-type endopeptidase inhibitor activity involved in apoptotic process(GO:0043027) |
| 1.0 | 2.9 | GO:0016941 | natriuretic peptide receptor activity(GO:0016941) |
| 1.0 | 5.8 | GO:0019788 | NEDD8 transferase activity(GO:0019788) |
| 1.0 | 8.6 | GO:0008494 | translation activator activity(GO:0008494) |
| 0.9 | 44.6 | GO:0005547 | phosphatidylinositol-3,4,5-trisphosphate binding(GO:0005547) |
| 0.9 | 16.6 | GO:0008009 | chemokine activity(GO:0008009) |
| 0.9 | 2.8 | GO:0004020 | adenylylsulfate kinase activity(GO:0004020) sulfate adenylyltransferase activity(GO:0004779) sulfate adenylyltransferase (ATP) activity(GO:0004781) |
| 0.9 | 3.6 | GO:0004963 | follicle-stimulating hormone receptor activity(GO:0004963) |
| 0.9 | 8.0 | GO:0035612 | AP-2 adaptor complex binding(GO:0035612) |
| 0.9 | 3.5 | GO:0050682 | AF-2 domain binding(GO:0050682) |
| 0.9 | 10.4 | GO:0003747 | translation release factor activity(GO:0003747) translation termination factor activity(GO:0008079) |
| 0.9 | 2.6 | GO:0008732 | threonine aldolase activity(GO:0004793) L-allo-threonine aldolase activity(GO:0008732) |
| 0.9 | 4.3 | GO:0004517 | nitric-oxide synthase activity(GO:0004517) |
| 0.8 | 14.8 | GO:0032794 | GTPase activating protein binding(GO:0032794) |
| 0.8 | 16.1 | GO:0005229 | intracellular calcium activated chloride channel activity(GO:0005229) |
| 0.8 | 4.8 | GO:0003917 | DNA topoisomerase type I activity(GO:0003917) |
| 0.8 | 2.3 | GO:0004735 | pyrroline-5-carboxylate reductase activity(GO:0004735) |
| 0.8 | 7.7 | GO:0015386 | potassium:proton antiporter activity(GO:0015386) |
| 0.7 | 3.0 | GO:0017077 | oxidative phosphorylation uncoupler activity(GO:0017077) |
| 0.7 | 2.9 | GO:0000293 | ferric-chelate reductase activity(GO:0000293) |
| 0.7 | 8.6 | GO:0008097 | 5S rRNA binding(GO:0008097) |
| 0.7 | 3.6 | GO:0052629 | phosphatidylinositol-3,5-bisphosphate 3-phosphatase activity(GO:0052629) |
| 0.7 | 29.8 | GO:0004869 | cysteine-type endopeptidase inhibitor activity(GO:0004869) |
| 0.7 | 2.8 | GO:0051431 | corticotropin-releasing hormone receptor 2 binding(GO:0051431) |
| 0.7 | 18.5 | GO:0008157 | protein phosphatase 1 binding(GO:0008157) |
| 0.7 | 2.7 | GO:0070891 | lipoteichoic acid binding(GO:0070891) |
| 0.7 | 3.4 | GO:0031404 | chloride ion binding(GO:0031404) |
| 0.7 | 2.7 | GO:0030942 | endoplasmic reticulum signal peptide binding(GO:0030942) |
| 0.7 | 3.3 | GO:0001007 | transcription factor activity, RNA polymerase III transcription factor binding(GO:0001007) RNA polymerase III type 3 promoter DNA binding(GO:0001032) |
| 0.7 | 7.4 | GO:0039706 | co-receptor binding(GO:0039706) |
| 0.7 | 3.3 | GO:0010997 | anaphase-promoting complex binding(GO:0010997) |
| 0.7 | 3.9 | GO:0046920 | alpha-(1->3)-fucosyltransferase activity(GO:0046920) |
| 0.7 | 4.6 | GO:0030160 | GKAP/Homer scaffold activity(GO:0030160) |
| 0.6 | 3.2 | GO:0005068 | transmembrane receptor protein tyrosine kinase adaptor activity(GO:0005068) |
| 0.6 | 15.5 | GO:0004298 | threonine-type endopeptidase activity(GO:0004298) threonine-type peptidase activity(GO:0070003) |
| 0.6 | 2.5 | GO:0015056 | corticotrophin-releasing factor receptor activity(GO:0015056) corticotropin-releasing hormone receptor activity(GO:0043404) |
| 0.6 | 31.5 | GO:0004715 | non-membrane spanning protein tyrosine kinase activity(GO:0004715) |
| 0.6 | 3.6 | GO:0034647 | histone demethylase activity (H3-trimethyl-K4 specific)(GO:0034647) |
| 0.6 | 3.0 | GO:0010853 | cyclase activator activity(GO:0010853) guanylate cyclase activator activity(GO:0030250) |
| 0.6 | 7.8 | GO:0050321 | tau-protein kinase activity(GO:0050321) |
| 0.6 | 7.7 | GO:0004954 | prostanoid receptor activity(GO:0004954) |
| 0.6 | 4.2 | GO:0003956 | NAD(P)+-protein-arginine ADP-ribosyltransferase activity(GO:0003956) |
| 0.6 | 2.9 | GO:0004849 | uridine kinase activity(GO:0004849) |
| 0.6 | 8.2 | GO:0019865 | immunoglobulin binding(GO:0019865) |
| 0.6 | 7.0 | GO:0015174 | basic amino acid transmembrane transporter activity(GO:0015174) |
| 0.6 | 11.1 | GO:0001614 | purinergic nucleotide receptor activity(GO:0001614) nucleotide receptor activity(GO:0016502) |
| 0.6 | 4.5 | GO:0015129 | lactate transmembrane transporter activity(GO:0015129) |
| 0.6 | 6.7 | GO:0042809 | vitamin D receptor binding(GO:0042809) |
| 0.6 | 3.3 | GO:0035368 | selenocysteine insertion sequence binding(GO:0035368) |
| 0.5 | 12.8 | GO:0001784 | phosphotyrosine binding(GO:0001784) |
| 0.5 | 17.6 | GO:0004114 | 3',5'-cyclic-nucleotide phosphodiesterase activity(GO:0004114) |
| 0.5 | 23.4 | GO:0004601 | peroxidase activity(GO:0004601) |
| 0.5 | 1.6 | GO:0005135 | interleukin-3 receptor binding(GO:0005135) |
| 0.5 | 2.1 | GO:0032190 | acrosin binding(GO:0032190) |
| 0.5 | 2.5 | GO:0008502 | melatonin receptor activity(GO:0008502) |
| 0.5 | 2.5 | GO:0043426 | MRF binding(GO:0043426) |
| 0.5 | 54.8 | GO:0004540 | ribonuclease activity(GO:0004540) |
| 0.5 | 2.9 | GO:0015016 | [heparan sulfate]-glucosamine N-sulfotransferase activity(GO:0015016) |
| 0.5 | 6.7 | GO:0001206 | transcriptional repressor activity, RNA polymerase II distal enhancer sequence-specific binding(GO:0001206) |
| 0.5 | 5.8 | GO:0004708 | MAP kinase kinase activity(GO:0004708) |
| 0.5 | 6.1 | GO:0043274 | phospholipase binding(GO:0043274) |
| 0.5 | 3.2 | GO:0005021 | vascular endothelial growth factor-activated receptor activity(GO:0005021) |
| 0.5 | 0.9 | GO:0005131 | growth hormone receptor binding(GO:0005131) |
| 0.4 | 1.3 | GO:0030984 | kininogen binding(GO:0030984) |
| 0.4 | 1.3 | GO:0050145 | uridylate kinase activity(GO:0009041) nucleoside phosphate kinase activity(GO:0050145) |
| 0.4 | 4.4 | GO:0030628 | pre-mRNA 3'-splice site binding(GO:0030628) |
| 0.4 | 1.3 | GO:0000991 | transcription factor activity, core RNA polymerase II binding(GO:0000991) |
| 0.4 | 2.2 | GO:0070513 | death domain binding(GO:0070513) |
| 0.4 | 2.6 | GO:0036374 | gamma-glutamyltransferase activity(GO:0003840) glutathione hydrolase activity(GO:0036374) |
| 0.4 | 6.8 | GO:0051428 | peptide hormone receptor binding(GO:0051428) |
| 0.4 | 2.9 | GO:0031014 | troponin T binding(GO:0031014) |
| 0.4 | 3.3 | GO:0030957 | Tat protein binding(GO:0030957) |
| 0.4 | 1.6 | GO:0047756 | chondroitin 4-sulfotransferase activity(GO:0047756) |
| 0.4 | 2.8 | GO:0004652 | polynucleotide adenylyltransferase activity(GO:0004652) |
| 0.4 | 8.3 | GO:0003950 | NAD+ ADP-ribosyltransferase activity(GO:0003950) |
| 0.4 | 5.1 | GO:0008408 | 3'-5' exonuclease activity(GO:0008408) |
| 0.4 | 3.5 | GO:0017128 | phospholipid scramblase activity(GO:0017128) |
| 0.4 | 3.9 | GO:0048027 | mRNA 5'-UTR binding(GO:0048027) |
| 0.4 | 1.9 | GO:0008420 | CTD phosphatase activity(GO:0008420) |
| 0.4 | 3.9 | GO:0051959 | dynein light intermediate chain binding(GO:0051959) |
| 0.4 | 4.4 | GO:0043024 | ribosomal small subunit binding(GO:0043024) |
| 0.4 | 11.6 | GO:0042974 | retinoic acid receptor binding(GO:0042974) |
| 0.4 | 1.4 | GO:0038132 | neuregulin binding(GO:0038132) |
| 0.3 | 10.1 | GO:0003785 | actin monomer binding(GO:0003785) |
| 0.3 | 1.0 | GO:0043398 | HLH domain binding(GO:0043398) |
| 0.3 | 7.8 | GO:0015288 | porin activity(GO:0015288) |
| 0.3 | 7.4 | GO:0050431 | transforming growth factor beta binding(GO:0050431) |
| 0.3 | 10.2 | GO:0042605 | peptide antigen binding(GO:0042605) |
| 0.3 | 1.3 | GO:0019002 | GMP binding(GO:0019002) |
| 0.3 | 9.3 | GO:0044183 | protein binding involved in protein folding(GO:0044183) |
| 0.3 | 4.1 | GO:0015187 | glycine transmembrane transporter activity(GO:0015187) |
| 0.3 | 0.6 | GO:0050659 | N-acetylgalactosamine 4-sulfate 6-O-sulfotransferase activity(GO:0050659) |
| 0.3 | 2.7 | GO:0008553 | hydrogen-exporting ATPase activity, phosphorylative mechanism(GO:0008553) |
| 0.3 | 4.1 | GO:0004596 | peptide alpha-N-acetyltransferase activity(GO:0004596) |
| 0.3 | 8.6 | GO:0003887 | DNA-directed DNA polymerase activity(GO:0003887) |
| 0.3 | 1.4 | GO:0004128 | cytochrome-b5 reductase activity, acting on NAD(P)H(GO:0004128) |
| 0.3 | 2.5 | GO:0043515 | kinetochore binding(GO:0043515) |
| 0.3 | 3.3 | GO:0004000 | adenosine deaminase activity(GO:0004000) |
| 0.3 | 8.8 | GO:0050699 | WW domain binding(GO:0050699) |
| 0.3 | 6.1 | GO:0019825 | oxygen binding(GO:0019825) |
| 0.3 | 2.4 | GO:0043522 | leucine zipper domain binding(GO:0043522) |
| 0.3 | 11.6 | GO:0015485 | cholesterol binding(GO:0015485) |
| 0.3 | 4.2 | GO:0015125 | bile acid transmembrane transporter activity(GO:0015125) |
| 0.3 | 2.3 | GO:0015217 | ATP transmembrane transporter activity(GO:0005347) ADP transmembrane transporter activity(GO:0015217) |
| 0.3 | 4.8 | GO:0031005 | filamin binding(GO:0031005) |
| 0.3 | 9.8 | GO:0005044 | scavenger receptor activity(GO:0005044) |
| 0.2 | 1.2 | GO:0005499 | vitamin D binding(GO:0005499) |
| 0.2 | 4.9 | GO:0004806 | triglyceride lipase activity(GO:0004806) |
| 0.2 | 2.9 | GO:0097200 | cysteine-type endopeptidase activity involved in execution phase of apoptosis(GO:0097200) |
| 0.2 | 8.5 | GO:0005504 | fatty acid binding(GO:0005504) |
| 0.2 | 2.2 | GO:0009881 | photoreceptor activity(GO:0009881) |
| 0.2 | 16.1 | GO:0003730 | mRNA 3'-UTR binding(GO:0003730) |
| 0.2 | 23.3 | GO:0001158 | enhancer sequence-specific DNA binding(GO:0001158) |
| 0.2 | 2.6 | GO:0017127 | cholesterol transporter activity(GO:0017127) |
| 0.2 | 4.5 | GO:0008199 | ferric iron binding(GO:0008199) |
| 0.2 | 0.7 | GO:0034483 | heparan sulfate sulfotransferase activity(GO:0034483) |
| 0.2 | 2.1 | GO:0047498 | calcium-dependent phospholipase A2 activity(GO:0047498) |
| 0.2 | 2.3 | GO:0016004 | phospholipase activator activity(GO:0016004) |
| 0.2 | 5.0 | GO:0070577 | lysine-acetylated histone binding(GO:0070577) |
| 0.2 | 4.5 | GO:0005520 | insulin-like growth factor binding(GO:0005520) |
| 0.2 | 5.1 | GO:0015035 | protein disulfide oxidoreductase activity(GO:0015035) |
| 0.2 | 8.9 | GO:0017112 | Rab guanyl-nucleotide exchange factor activity(GO:0017112) |
| 0.2 | 0.8 | GO:0004656 | procollagen-proline 4-dioxygenase activity(GO:0004656) |
| 0.2 | 1.5 | GO:0034513 | box H/ACA snoRNA binding(GO:0034513) |
| 0.2 | 4.4 | GO:0004864 | protein phosphatase inhibitor activity(GO:0004864) |
| 0.2 | 4.3 | GO:0070840 | dynein complex binding(GO:0070840) |
| 0.2 | 2.9 | GO:0004029 | aldehyde dehydrogenase (NAD) activity(GO:0004029) |
| 0.2 | 2.9 | GO:0005149 | interleukin-1 receptor binding(GO:0005149) |
| 0.2 | 2.5 | GO:0042043 | neurexin family protein binding(GO:0042043) |
| 0.2 | 6.4 | GO:0016667 | oxidoreductase activity, acting on a sulfur group of donors(GO:0016667) |
| 0.2 | 0.5 | GO:0004651 | polynucleotide 5'-phosphatase activity(GO:0004651) |
| 0.2 | 1.7 | GO:0097027 | ubiquitin-protein transferase activator activity(GO:0097027) |
| 0.2 | 1.2 | GO:0004111 | creatine kinase activity(GO:0004111) |
| 0.2 | 0.8 | GO:0001665 | alpha-N-acetylgalactosaminide alpha-2,6-sialyltransferase activity(GO:0001665) |
| 0.2 | 1.2 | GO:0035184 | histone threonine kinase activity(GO:0035184) |
| 0.2 | 3.6 | GO:0000030 | mannosyltransferase activity(GO:0000030) |
| 0.1 | 0.4 | GO:0016015 | morphogen activity(GO:0016015) |
| 0.1 | 0.5 | GO:0016492 | G-protein coupled neurotensin receptor activity(GO:0016492) |
| 0.1 | 1.8 | GO:0019789 | SUMO transferase activity(GO:0019789) |
| 0.1 | 4.6 | GO:0019888 | protein phosphatase regulator activity(GO:0019888) |
| 0.1 | 1.1 | GO:0070300 | phosphatidic acid binding(GO:0070300) |
| 0.1 | 0.5 | GO:0019166 | trans-2-enoyl-CoA reductase (NADPH) activity(GO:0019166) |
| 0.1 | 0.4 | GO:0003986 | acetyl-CoA hydrolase activity(GO:0003986) |
| 0.1 | 7.5 | GO:0019955 | cytokine binding(GO:0019955) |
| 0.1 | 7.1 | GO:0031490 | chromatin DNA binding(GO:0031490) |
| 0.1 | 2.6 | GO:0005355 | glucose transmembrane transporter activity(GO:0005355) hexose transmembrane transporter activity(GO:0015149) |
| 0.1 | 28.2 | GO:0030246 | carbohydrate binding(GO:0030246) |
| 0.1 | 1.1 | GO:0044548 | S100 protein binding(GO:0044548) |
| 0.1 | 1.3 | GO:0051371 | muscle alpha-actinin binding(GO:0051371) structural molecule activity conferring elasticity(GO:0097493) |
| 0.1 | 8.5 | GO:0003697 | single-stranded DNA binding(GO:0003697) |
| 0.1 | 1.2 | GO:0004579 | oligosaccharyl transferase activity(GO:0004576) dolichyl-diphosphooligosaccharide-protein glycotransferase activity(GO:0004579) |
| 0.1 | 0.3 | GO:0004903 | growth hormone receptor activity(GO:0004903) |
| 0.1 | 0.3 | GO:0016742 | hydroxymethyl-, formyl- and related transferase activity(GO:0016742) |
| 0.1 | 2.4 | GO:0008139 | nuclear localization sequence binding(GO:0008139) |
| 0.1 | 4.0 | GO:0000049 | tRNA binding(GO:0000049) |
| 0.1 | 3.0 | GO:0043022 | ribosome binding(GO:0043022) |
| 0.1 | 18.9 | GO:0003735 | structural constituent of ribosome(GO:0003735) |
| 0.1 | 3.3 | GO:0003727 | single-stranded RNA binding(GO:0003727) |
| 0.1 | 0.5 | GO:0070182 | DNA polymerase binding(GO:0070182) |
| 0.1 | 0.8 | GO:0004861 | cyclin-dependent protein serine/threonine kinase inhibitor activity(GO:0004861) |
| 0.1 | 0.7 | GO:0015379 | potassium:chloride symporter activity(GO:0015379) potassium ion symporter activity(GO:0022820) |
| 0.1 | 8.1 | GO:0019902 | phosphatase binding(GO:0019902) |
| 0.1 | 1.7 | GO:0048365 | Rac GTPase binding(GO:0048365) |
| 0.1 | 7.2 | GO:0004222 | metalloendopeptidase activity(GO:0004222) |
| 0.1 | 1.0 | GO:0001594 | trace-amine receptor activity(GO:0001594) |
| 0.1 | 0.2 | GO:0030350 | iron-responsive element binding(GO:0030350) |
| 0.1 | 2.0 | GO:0005109 | frizzled binding(GO:0005109) |
| 0.1 | 0.5 | GO:0043023 | ribosomal large subunit binding(GO:0043023) |
| 0.1 | 0.4 | GO:0019208 | phosphatase regulator activity(GO:0019208) |
| 0.1 | 12.9 | GO:0005096 | GTPase activator activity(GO:0005096) |
| 0.1 | 0.5 | GO:0008190 | eukaryotic initiation factor 4E binding(GO:0008190) |
| 0.1 | 0.2 | GO:0008254 | 3'-nucleotidase activity(GO:0008254) |
| 0.1 | 0.8 | GO:0070742 | C2H2 zinc finger domain binding(GO:0070742) |
| 0.0 | 0.8 | GO:0004012 | phospholipid-translocating ATPase activity(GO:0004012) |
| 0.0 | 2.7 | GO:0003705 | transcription factor activity, RNA polymerase II distal enhancer sequence-specific binding(GO:0003705) |
| 0.0 | 0.2 | GO:0070401 | NADP+ binding(GO:0070401) |
| 0.0 | 5.2 | GO:0005125 | cytokine activity(GO:0005125) |
| 0.0 | 1.6 | GO:0031624 | ubiquitin conjugating enzyme binding(GO:0031624) |
| 0.0 | 0.1 | GO:0008413 | 8-oxo-7,8-dihydroguanosine triphosphate pyrophosphatase activity(GO:0008413) 8-oxo-7,8-dihydrodeoxyguanosine triphosphate pyrophosphatase activity(GO:0035539) |
| 0.0 | 0.9 | GO:0017075 | syntaxin-1 binding(GO:0017075) |
| 0.0 | 0.6 | GO:0043531 | ADP binding(GO:0043531) |
| 0.0 | 0.2 | GO:0016857 | racemase and epimerase activity, acting on carbohydrates and derivatives(GO:0016857) |
| 0.0 | 0.1 | GO:0030619 | U1 snRNA binding(GO:0030619) |
| 0.0 | 0.1 | GO:0050252 | retinol O-fatty-acyltransferase activity(GO:0050252) |
| 0.0 | 1.0 | GO:0017022 | myosin binding(GO:0017022) |
| 0.0 | 2.0 | GO:0042393 | histone binding(GO:0042393) |
| 0.0 | 0.6 | GO:0070491 | repressing transcription factor binding(GO:0070491) |
Gene overrepresentation in curated gene sets: canonical pathways category:
| Log-likelihood per target | Total log-likelihood | Term | Description |
|---|---|---|---|
| 1.9 | 122.5 | PID PI3KCI PATHWAY | Class I PI3K signaling events |
| 1.7 | 66.4 | PID EPO PATHWAY | EPO signaling pathway |
| 1.4 | 21.9 | SA B CELL RECEPTOR COMPLEXES | Antigen binding to B cell receptors activates protein tyrosine kinases, such as the Src family, which ultimate activate MAP kinases. |
| 1.4 | 10.9 | PID NFKAPPAB ATYPICAL PATHWAY | Atypical NF-kappaB pathway |
| 1.3 | 54.2 | PID BCR 5PATHWAY | BCR signaling pathway |
| 1.0 | 28.2 | PID CXCR3 PATHWAY | CXCR3-mediated signaling events |
| 1.0 | 27.6 | PID CD40 PATHWAY | CD40/CD40L signaling |
| 1.0 | 18.3 | SA MMP CYTOKINE CONNECTION | Cytokines can induce activation of matrix metalloproteinases, which degrade extracellular matrix. |
| 0.8 | 36.1 | PID RAC1 REG PATHWAY | Regulation of RAC1 activity |
| 0.8 | 26.5 | PID AMB2 NEUTROPHILS PATHWAY | amb2 Integrin signaling |
| 0.8 | 30.0 | PID BARD1 PATHWAY | BARD1 signaling events |
| 0.8 | 19.8 | PID IL23 PATHWAY | IL23-mediated signaling events |
| 0.7 | 9.5 | PID TRAIL PATHWAY | TRAIL signaling pathway |
| 0.7 | 31.1 | PID AURORA B PATHWAY | Aurora B signaling |
| 0.7 | 30.4 | PID IL4 2PATHWAY | IL4-mediated signaling events |
| 0.7 | 11.2 | PID CD8 TCR PATHWAY | TCR signaling in naïve CD8+ T cells |
| 0.6 | 23.3 | PID CD8 TCR DOWNSTREAM PATHWAY | Downstream signaling in naïve CD8+ T cells |
| 0.6 | 12.8 | PID INTEGRIN2 PATHWAY | Beta2 integrin cell surface interactions |
| 0.5 | 4.8 | PID LYMPH ANGIOGENESIS PATHWAY | VEGFR3 signaling in lymphatic endothelium |
| 0.5 | 4.6 | PID FAS PATHWAY | FAS (CD95) signaling pathway |
| 0.5 | 20.7 | PID ATR PATHWAY | ATR signaling pathway |
| 0.5 | 5.0 | PID CERAMIDE PATHWAY | Ceramide signaling pathway |
| 0.5 | 9.5 | PID MAPK TRK PATHWAY | Trk receptor signaling mediated by the MAPK pathway |
| 0.5 | 13.2 | PID TCPTP PATHWAY | Signaling events mediated by TCPTP |
| 0.5 | 9.1 | PID TOLL ENDOGENOUS PATHWAY | Endogenous TLR signaling |
| 0.4 | 19.4 | PID ILK PATHWAY | Integrin-linked kinase signaling |
| 0.4 | 10.6 | ST WNT CA2 CYCLIC GMP PATHWAY | Wnt/Ca2+/cyclic GMP signaling. |
| 0.4 | 3.8 | ST GA12 PATHWAY | G alpha 12 Pathway |
| 0.4 | 6.5 | PID RETINOIC ACID PATHWAY | Retinoic acid receptors-mediated signaling |
| 0.4 | 15.0 | PID RXR VDR PATHWAY | RXR and RAR heterodimerization with other nuclear receptor |
| 0.4 | 3.3 | ST DIFFERENTIATION PATHWAY IN PC12 CELLS | Differentiation Pathway in PC12 Cells; this is a specific case of PAC1 Receptor Pathway. |
| 0.4 | 8.6 | PID FRA PATHWAY | Validated transcriptional targets of AP1 family members Fra1 and Fra2 |
| 0.3 | 12.3 | PID FGF PATHWAY | FGF signaling pathway |
| 0.3 | 11.9 | PID HEDGEHOG GLI PATHWAY | Hedgehog signaling events mediated by Gli proteins |
| 0.3 | 7.6 | ST GA13 PATHWAY | G alpha 13 Pathway |
| 0.3 | 1.7 | SA TRKA RECEPTOR | The TrkA receptor binds nerve growth factor to activate MAP kinase pathways and promote cell growth. |
| 0.3 | 5.3 | PID UPA UPAR PATHWAY | Urokinase-type plasminogen activator (uPA) and uPAR-mediated signaling |
| 0.2 | 4.8 | PID FANCONI PATHWAY | Fanconi anemia pathway |
| 0.2 | 28.6 | PID P53 DOWNSTREAM PATHWAY | Direct p53 effectors |
| 0.2 | 0.8 | PID IL8 CXCR1 PATHWAY | IL8- and CXCR1-mediated signaling events |
| 0.2 | 5.8 | PID PLK1 PATHWAY | PLK1 signaling events |
| 0.2 | 4.8 | SIG CHEMOTAXIS | Genes related to chemotaxis |
| 0.2 | 45.7 | NABA SECRETED FACTORS | Genes encoding secreted soluble factors |
| 0.1 | 1.3 | ST T CELL SIGNAL TRANSDUCTION | T Cell Signal Transduction |
| 0.1 | 2.6 | ST FAS SIGNALING PATHWAY | Fas Signaling Pathway |
| 0.1 | 0.9 | PID IFNG PATHWAY | IFN-gamma pathway |
| 0.1 | 4.3 | PID ARF6 TRAFFICKING PATHWAY | Arf6 trafficking events |
| 0.1 | 1.0 | PID SMAD2 3PATHWAY | Regulation of cytoplasmic and nuclear SMAD2/3 signaling |
| 0.1 | 10.2 | NABA ECM GLYCOPROTEINS | Genes encoding structural ECM glycoproteins |
| 0.0 | 2.3 | PID NOTCH PATHWAY | Notch signaling pathway |
| 0.0 | 1.4 | PID CASPASE PATHWAY | Caspase cascade in apoptosis |
| 0.0 | 0.4 | PID ERBB1 DOWNSTREAM PATHWAY | ErbB1 downstream signaling |
| 0.0 | 0.2 | ST GRANULE CELL SURVIVAL PATHWAY | Granule Cell Survival Pathway is a specific case of more general PAC1 Receptor Pathway. |
| 0.0 | 0.4 | PID VEGFR1 2 PATHWAY | Signaling events mediated by VEGFR1 and VEGFR2 |
| 0.0 | 0.4 | ST WNT BETA CATENIN PATHWAY | Wnt/beta-catenin Pathway |
| 0.0 | 0.5 | PID DELTA NP63 PATHWAY | Validated transcriptional targets of deltaNp63 isoforms |
| 0.0 | 0.3 | PID HES HEY PATHWAY | Notch-mediated HES/HEY network |
Gene overrepresentation in curated gene sets: REACTOME pathways category:
| Log-likelihood per target | Total log-likelihood | Term | Description |
|---|---|---|---|
| 4.9 | 73.4 | REACTOME PD1 SIGNALING | Genes involved in PD-1 signaling |
| 2.9 | 113.2 | REACTOME ANTIGEN ACTIVATES B CELL RECEPTOR LEADING TO GENERATION OF SECOND MESSENGERS | Genes involved in Antigen Activates B Cell Receptor Leading to Generation of Second Messengers |
| 2.1 | 21.5 | REACTOME PURINE CATABOLISM | Genes involved in Purine catabolism |
| 1.8 | 87.7 | REACTOME CHEMOKINE RECEPTORS BIND CHEMOKINES | Genes involved in Chemokine receptors bind chemokines |
| 1.6 | 27.0 | REACTOME GENERATION OF SECOND MESSENGER MOLECULES | Genes involved in Generation of second messenger molecules |
| 1.5 | 26.1 | REACTOME RIP MEDIATED NFKB ACTIVATION VIA DAI | Genes involved in RIP-mediated NFkB activation via DAI |
| 1.5 | 16.9 | REACTOME CREATION OF C4 AND C2 ACTIVATORS | Genes involved in Creation of C4 and C2 activators |
| 1.5 | 7.5 | REACTOME HEMOSTASIS | Genes involved in Hemostasis |
| 1.4 | 17.1 | REACTOME IL 6 SIGNALING | Genes involved in Interleukin-6 signaling |
| 1.4 | 15.1 | REACTOME THE NLRP3 INFLAMMASOME | Genes involved in The NLRP3 inflammasome |
| 1.3 | 12.7 | REACTOME APOPTOSIS INDUCED DNA FRAGMENTATION | Genes involved in Apoptosis induced DNA fragmentation |
| 1.2 | 10.8 | REACTOME P75NTR SIGNALS VIA NFKB | Genes involved in p75NTR signals via NF-kB |
| 1.2 | 14.3 | REACTOME P2Y RECEPTORS | Genes involved in P2Y receptors |
| 1.2 | 45.1 | REACTOME COSTIMULATION BY THE CD28 FAMILY | Genes involved in Costimulation by the CD28 family |
| 1.1 | 10.3 | REACTOME MEMBRANE BINDING AND TARGETTING OF GAG PROTEINS | Genes involved in Membrane binding and targetting of GAG proteins |
| 1.1 | 11.0 | REACTOME NRIF SIGNALS CELL DEATH FROM THE NUCLEUS | Genes involved in NRIF signals cell death from the nucleus |
| 1.1 | 48.4 | REACTOME IMMUNOREGULATORY INTERACTIONS BETWEEN A LYMPHOID AND A NON LYMPHOID CELL | Genes involved in Immunoregulatory interactions between a Lymphoid and a non-Lymphoid cell |
| 1.1 | 19.6 | REACTOME PLATELET SENSITIZATION BY LDL | Genes involved in Platelet sensitization by LDL |
| 1.0 | 13.6 | REACTOME EICOSANOID LIGAND BINDING RECEPTORS | Genes involved in Eicosanoid ligand-binding receptors |
| 1.0 | 20.7 | REACTOME APC C CDH1 MEDIATED DEGRADATION OF CDC20 AND OTHER APC C CDH1 TARGETED PROTEINS IN LATE MITOSIS EARLY G1 | Genes involved in APC/C:Cdh1 mediated degradation of Cdc20 and other APC/C:Cdh1 targeted proteins in late mitosis/early G1 |
| 0.9 | 68.3 | REACTOME ANTIGEN PROCESSING CROSS PRESENTATION | Genes involved in Antigen processing-Cross presentation |
| 0.9 | 12.8 | REACTOME GPVI MEDIATED ACTIVATION CASCADE | Genes involved in GPVI-mediated activation cascade |
| 0.9 | 2.7 | REACTOME IKK COMPLEX RECRUITMENT MEDIATED BY RIP1 | Genes involved in IKK complex recruitment mediated by RIP1 |
| 0.9 | 12.3 | REACTOME FGFR4 LIGAND BINDING AND ACTIVATION | Genes involved in FGFR4 ligand binding and activation |
| 0.9 | 7.8 | REACTOME REGULATION OF RHEB GTPASE ACTIVITY BY AMPK | Genes involved in Regulation of Rheb GTPase activity by AMPK |
| 0.8 | 5.7 | REACTOME INFLAMMASOMES | Genes involved in Inflammasomes |
| 0.8 | 5.5 | REACTOME REGULATION OF ORNITHINE DECARBOXYLASE ODC | Genes involved in Regulation of ornithine decarboxylase (ODC) |
| 0.8 | 12.8 | REACTOME REPAIR SYNTHESIS FOR GAP FILLING BY DNA POL IN TC NER | Genes involved in Repair synthesis for gap-filling by DNA polymerase in TC-NER |
| 0.7 | 4.2 | REACTOME DEFENSINS | Genes involved in Defensins |
| 0.7 | 17.9 | REACTOME INSULIN SYNTHESIS AND PROCESSING | Genes involved in Insulin Synthesis and Processing |
| 0.7 | 17.9 | REACTOME RNA POL I PROMOTER OPENING | Genes involved in RNA Polymerase I Promoter Opening |
| 0.7 | 9.5 | REACTOME EXTRINSIC PATHWAY FOR APOPTOSIS | Genes involved in Extrinsic Pathway for Apoptosis |
| 0.7 | 4.6 | REACTOME JNK C JUN KINASES PHOSPHORYLATION AND ACTIVATION MEDIATED BY ACTIVATED HUMAN TAK1 | Genes involved in JNK (c-Jun kinases) phosphorylation and activation mediated by activated human TAK1 |
| 0.6 | 7.2 | REACTOME COMMON PATHWAY | Genes involved in Common Pathway |
| 0.6 | 9.9 | REACTOME METABOLISM OF PORPHYRINS | Genes involved in Metabolism of porphyrins |
| 0.6 | 5.8 | REACTOME AKT PHOSPHORYLATES TARGETS IN THE CYTOSOL | Genes involved in AKT phosphorylates targets in the cytosol |
| 0.5 | 4.3 | REACTOME HORMONE SENSITIVE LIPASE HSL MEDIATED TRIACYLGLYCEROL HYDROLYSIS | Genes involved in Hormone-sensitive lipase (HSL)-mediated triacylglycerol hydrolysis |
| 0.5 | 21.1 | REACTOME STRIATED MUSCLE CONTRACTION | Genes involved in Striated Muscle Contraction |
| 0.5 | 12.8 | REACTOME NOD1 2 SIGNALING PATHWAY | Genes involved in NOD1/2 Signaling Pathway |
| 0.5 | 5.3 | REACTOME GRB2 SOS PROVIDES LINKAGE TO MAPK SIGNALING FOR INTERGRINS | Genes involved in GRB2:SOS provides linkage to MAPK signaling for Intergrins |
| 0.5 | 11.1 | REACTOME INTRINSIC PATHWAY | Genes involved in Intrinsic Pathway |
| 0.5 | 22.5 | REACTOME INTERFERON GAMMA SIGNALING | Genes involved in Interferon gamma signaling |
| 0.5 | 8.2 | REACTOME ACTIVATED AMPK STIMULATES FATTY ACID OXIDATION IN MUSCLE | Genes involved in Activated AMPK stimulates fatty-acid oxidation in muscle |
| 0.5 | 10.3 | REACTOME MEIOSIS | Genes involved in Meiosis |
| 0.5 | 48.4 | REACTOME PEPTIDE CHAIN ELONGATION | Genes involved in Peptide chain elongation |
| 0.5 | 1.8 | REACTOME TETRAHYDROBIOPTERIN BH4 SYNTHESIS RECYCLING SALVAGE AND REGULATION | Genes involved in Tetrahydrobiopterin (BH4) synthesis, recycling, salvage and regulation |
| 0.5 | 12.2 | REACTOME MEIOTIC RECOMBINATION | Genes involved in Meiotic Recombination |
| 0.4 | 4.9 | REACTOME HORMONE LIGAND BINDING RECEPTORS | Genes involved in Hormone ligand-binding receptors |
| 0.4 | 47.9 | REACTOME MITOTIC M M G1 PHASES | Genes involved in Mitotic M-M/G1 phases |
| 0.4 | 9.1 | REACTOME DEPOSITION OF NEW CENPA CONTAINING NUCLEOSOMES AT THE CENTROMERE | Genes involved in Deposition of New CENPA-containing Nucleosomes at the Centromere |
| 0.4 | 8.9 | REACTOME PYRUVATE METABOLISM | Genes involved in Pyruvate metabolism |
| 0.4 | 4.8 | REACTOME NOTCH HLH TRANSCRIPTION PATHWAY | Genes involved in Notch-HLH transcription pathway |
| 0.4 | 7.1 | REACTOME AMYLOIDS | Genes involved in Amyloids |
| 0.4 | 2.3 | REACTOME ELEVATION OF CYTOSOLIC CA2 LEVELS | Genes involved in Elevation of cytosolic Ca2+ levels |
| 0.4 | 15.6 | REACTOME IRON UPTAKE AND TRANSPORT | Genes involved in Iron uptake and transport |
| 0.4 | 11.3 | REACTOME TRANSPORT OF MATURE TRANSCRIPT TO CYTOPLASM | Genes involved in Transport of Mature Transcript to Cytoplasm |
| 0.4 | 5.5 | REACTOME ACYL CHAIN REMODELLING OF PS | Genes involved in Acyl chain remodelling of PS |
| 0.4 | 1.4 | REACTOME TRAF6 MEDIATED IRF7 ACTIVATION IN TLR7 8 OR 9 SIGNALING | Genes involved in TRAF6 mediated IRF7 activation in TLR7/8 or 9 signaling |
| 0.3 | 9.6 | REACTOME STEROID HORMONES | Genes involved in Steroid hormones |
| 0.3 | 3.5 | REACTOME PASSIVE TRANSPORT BY AQUAPORINS | Genes involved in Passive Transport by Aquaporins |
| 0.3 | 8.5 | REACTOME HS GAG BIOSYNTHESIS | Genes involved in HS-GAG biosynthesis |
| 0.3 | 5.2 | REACTOME DESTABILIZATION OF MRNA BY KSRP | Genes involved in Destabilization of mRNA by KSRP |
| 0.3 | 2.0 | REACTOME ACTIVATION OF ATR IN RESPONSE TO REPLICATION STRESS | Genes involved in Activation of ATR in response to replication stress |
| 0.3 | 2.2 | REACTOME OPSINS | Genes involved in Opsins |
| 0.3 | 3.2 | REACTOME VEGF LIGAND RECEPTOR INTERACTIONS | Genes involved in VEGF ligand-receptor interactions |
| 0.3 | 5.9 | REACTOME DEADENYLATION OF MRNA | Genes involved in Deadenylation of mRNA |
| 0.3 | 4.8 | REACTOME FORMATION OF TUBULIN FOLDING INTERMEDIATES BY CCT TRIC | Genes involved in Formation of tubulin folding intermediates by CCT/TriC |
| 0.3 | 13.1 | REACTOME ANTIVIRAL MECHANISM BY IFN STIMULATED GENES | Genes involved in Antiviral mechanism by IFN-stimulated genes |
| 0.2 | 6.7 | REACTOME SYNTHESIS OF PIPS AT THE PLASMA MEMBRANE | Genes involved in Synthesis of PIPs at the plasma membrane |
| 0.2 | 4.5 | REACTOME REGULATION OF INSULIN LIKE GROWTH FACTOR IGF ACTIVITY BY INSULIN LIKE GROWTH FACTOR BINDING PROTEINS IGFBPS | Genes involved in Regulation of Insulin-like Growth Factor (IGF) Activity by Insulin-like Growth Factor Binding Proteins (IGFBPs) |
| 0.2 | 2.8 | REACTOME CYTOSOLIC SULFONATION OF SMALL MOLECULES | Genes involved in Cytosolic sulfonation of small molecules |
| 0.2 | 4.2 | REACTOME SIGNALING BY BMP | Genes involved in Signaling by BMP |
| 0.2 | 10.1 | REACTOME LOSS OF NLP FROM MITOTIC CENTROSOMES | Genes involved in Loss of Nlp from mitotic centrosomes |
| 0.2 | 3.5 | REACTOME GLUCURONIDATION | Genes involved in Glucuronidation |
| 0.2 | 4.3 | REACTOME DOWNREGULATION OF TGF BETA RECEPTOR SIGNALING | Genes involved in Downregulation of TGF-beta receptor signaling |
| 0.2 | 24.9 | REACTOME SIGNALING BY RHO GTPASES | Genes involved in Signaling by Rho GTPases |
| 0.2 | 7.0 | REACTOME AMINO ACID TRANSPORT ACROSS THE PLASMA MEMBRANE | Genes involved in Amino acid transport across the plasma membrane |
| 0.2 | 5.1 | REACTOME BIOSYNTHESIS OF THE N GLYCAN PRECURSOR DOLICHOL LIPID LINKED OLIGOSACCHARIDE LLO AND TRANSFER TO A NASCENT PROTEIN | Genes involved in Biosynthesis of the N-glycan precursor (dolichol lipid-linked oligosaccharide, LLO) and transfer to a nascent protein |
| 0.2 | 3.3 | REACTOME NUCLEAR EVENTS KINASE AND TRANSCRIPTION FACTOR ACTIVATION | Genes involved in Nuclear Events (kinase and transcription factor activation) |
| 0.1 | 2.8 | REACTOME ABORTIVE ELONGATION OF HIV1 TRANSCRIPT IN THE ABSENCE OF TAT | Genes involved in Abortive elongation of HIV-1 transcript in the absence of Tat |
| 0.1 | 2.7 | REACTOME N GLYCAN ANTENNAE ELONGATION IN THE MEDIAL TRANS GOLGI | Genes involved in N-glycan antennae elongation in the medial/trans-Golgi |
| 0.1 | 5.3 | REACTOME LATE PHASE OF HIV LIFE CYCLE | Genes involved in Late Phase of HIV Life Cycle |
| 0.1 | 2.0 | REACTOME G ALPHA S SIGNALLING EVENTS | Genes involved in G alpha (s) signalling events |
| 0.1 | 2.7 | REACTOME SRP DEPENDENT COTRANSLATIONAL PROTEIN TARGETING TO MEMBRANE | Genes involved in SRP-dependent cotranslational protein targeting to membrane |
| 0.1 | 0.7 | REACTOME ADVANCED GLYCOSYLATION ENDPRODUCT RECEPTOR SIGNALING | Genes involved in Advanced glycosylation endproduct receptor signaling |
| 0.1 | 3.4 | REACTOME TRANSPORT OF VITAMINS NUCLEOSIDES AND RELATED MOLECULES | Genes involved in Transport of vitamins, nucleosides, and related molecules |
| 0.1 | 3.0 | REACTOME TIGHT JUNCTION INTERACTIONS | Genes involved in Tight junction interactions |
| 0.1 | 0.1 | REACTOME INSULIN RECEPTOR RECYCLING | Genes involved in Insulin receptor recycling |
| 0.1 | 1.7 | REACTOME SYNTHESIS AND INTERCONVERSION OF NUCLEOTIDE DI AND TRIPHOSPHATES | Genes involved in Synthesis and interconversion of nucleotide di- and triphosphates |
| 0.1 | 1.9 | REACTOME MYOGENESIS | Genes involved in Myogenesis |
| 0.1 | 1.9 | REACTOME RNA POL III TRANSCRIPTION | Genes involved in RNA Polymerase III Transcription |
| 0.1 | 0.3 | REACTOME MICRORNA MIRNA BIOGENESIS | Genes involved in MicroRNA (miRNA) Biogenesis |
| 0.0 | 0.7 | REACTOME SIGNALING BY ROBO RECEPTOR | Genes involved in Signaling by Robo receptor |
| 0.0 | 0.3 | REACTOME PURINE RIBONUCLEOSIDE MONOPHOSPHATE BIOSYNTHESIS | Genes involved in Purine ribonucleoside monophosphate biosynthesis |
| 0.0 | 2.8 | REACTOME PPARA ACTIVATES GENE EXPRESSION | Genes involved in PPARA Activates Gene Expression |
| 0.0 | 0.2 | REACTOME HOMOLOGOUS RECOMBINATION REPAIR OF REPLICATION INDEPENDENT DOUBLE STRAND BREAKS | Genes involved in Homologous recombination repair of replication-independent double-strand breaks |
| 0.0 | 0.1 | REACTOME TRAF3 DEPENDENT IRF ACTIVATION PATHWAY | Genes involved in TRAF3-dependent IRF activation pathway |