Project
GSE53960: rat RNA-Seq transcriptomic Bodymap
Navigation
Downloads
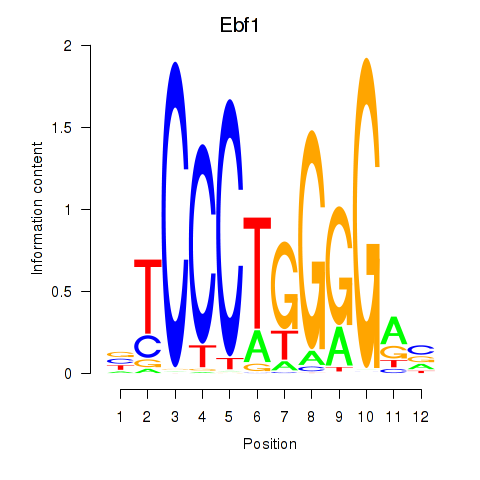
Results for Ebf1
Z-value: 2.22
Motif logo
Transcription factors associated with Ebf1
| Gene Symbol | Gene ID | Gene Info |
|---|---|---|
|
Ebf1
|
ENSRNOG00000028845 | early B-cell factor 1 |
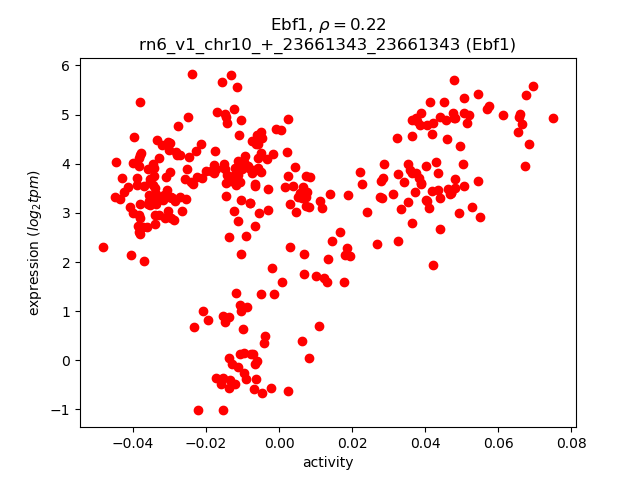
Activity-expression correlation:
| Gene | Promoter | Pearson corr. coef. | P-value | Plot |
|---|---|---|---|---|
| Ebf1 | rn6_v1_chr10_+_23661343_23661343 | 0.22 | 5.1e-05 | Click! |
Activity profile of Ebf1 motif
Sorted Z-values of Ebf1 motif
| Promoter | Log-likelihood | Transcript | Gene | Gene Info |
|---|---|---|---|---|
| chr6_-_139997537 | 77.63 |
ENSRNOT00000073207
|
AABR07065740.1
|
|
| chr6_-_140572023 | 54.32 |
ENSRNOT00000072338
|
AABR07065772.1
|
|
| chr7_-_119716238 | 51.72 |
ENSRNOT00000075678
|
Il2rb
|
interleukin 2 receptor subunit beta |
| chr16_+_10417185 | 51.59 |
ENSRNOT00000082186
|
Anxa8
|
annexin A8 |
| chr7_-_119712888 | 50.72 |
ENSRNOT00000077438
|
Il2rb
|
interleukin 2 receptor subunit beta |
| chr17_-_31780120 | 49.11 |
ENSRNOT00000058388
|
AABR07027450.1
|
|
| chr1_+_219403970 | 48.48 |
ENSRNOT00000029607
|
Ptprcap
|
protein tyrosine phosphatase, receptor type, C-associated protein |
| chr6_-_143195143 | 47.49 |
ENSRNOT00000081337
|
AABR07065837.1
|
|
| chr20_+_4043741 | 46.70 |
ENSRNOT00000000525
|
RT1-Bb
|
RT1 class II, locus Bb |
| chr10_+_84309430 | 44.77 |
ENSRNOT00000030159
|
Skap1
|
src kinase associated phosphoprotein 1 |
| chr14_+_91782354 | 44.15 |
ENSRNOT00000005902
|
Ikzf1
|
IKAROS family zinc finger 1 |
| chr4_+_69384145 | 42.70 |
ENSRNOT00000084834
|
Trbv13-2
|
T cell receptor beta, variable 13-2 |
| chr4_+_98371184 | 41.51 |
ENSRNOT00000086911
|
AABR07060872.1
|
|
| chr16_-_18757918 | 40.66 |
ENSRNOT00000084172
|
Sftpd
|
surfactant protein D |
| chr1_+_81230989 | 40.28 |
ENSRNOT00000077952
|
Kcnn4
|
potassium calcium-activated channel subfamily N member 4 |
| chr2_-_250981623 | 40.04 |
ENSRNOT00000018435
|
Clca2
|
chloride channel accessory 2 |
| chr9_-_19372673 | 39.90 |
ENSRNOT00000073667
ENSRNOT00000079517 |
Clic5
|
chloride intracellular channel 5 |
| chr10_-_87067456 | 39.54 |
ENSRNOT00000014163
|
Ccr7
|
C-C motif chemokine receptor 7 |
| chr8_-_117932518 | 39.22 |
ENSRNOT00000028130
|
Camp
|
cathelicidin antimicrobial peptide |
| chr1_+_199596024 | 37.59 |
ENSRNOT00000085336
|
Itgad
|
integrin subunit alpha D |
| chr4_+_98337367 | 37.51 |
ENSRNOT00000042165
|
AABR07060872.1
|
|
| chr2_-_241545250 | 36.59 |
ENSRNOT00000073875
|
Bank1
|
B-cell scaffold protein with ankyrin repeats 1 |
| chr7_-_119996824 | 36.42 |
ENSRNOT00000011079
|
Mfng
|
MFNG O-fucosylpeptide 3-beta-N-acetylglucosaminyltransferase |
| chr4_+_98370797 | 35.12 |
ENSRNOT00000031991
|
AABR07060872.1
|
|
| chr20_-_3397039 | 34.63 |
ENSRNOT00000001084
ENSRNOT00000085259 |
Ppp1r18
|
protein phosphatase 1, regulatory subunit 18 |
| chr2_+_187218851 | 33.79 |
ENSRNOT00000017798
|
Sh2d2a
|
SH2 domain containing 2A |
| chr18_-_77322690 | 33.71 |
ENSRNOT00000058382
|
Nfatc1
|
nuclear factor of activated T-cells 1 |
| chr1_+_81474553 | 33.61 |
ENSRNOT00000083493
|
Phldb3
|
pleckstrin homology-like domain, family B, member 3 |
| chr15_-_29548400 | 33.54 |
ENSRNOT00000078176
|
AABR07017639.2
|
|
| chrX_+_65226748 | 33.07 |
ENSRNOT00000076181
|
Msn
|
moesin |
| chr7_+_121841855 | 33.04 |
ENSRNOT00000024673
|
Grap2
|
GRB2-related adaptor protein 2 |
| chr4_+_102351036 | 32.56 |
ENSRNOT00000079277
|
AABR07060994.1
|
|
| chr20_+_46199981 | 32.12 |
ENSRNOT00000000337
|
Mical1
|
microtubule associated monooxygenase, calponin and LIM domain containing 1 |
| chr1_-_226791773 | 31.89 |
ENSRNOT00000082482
ENSRNOT00000065376 ENSRNOT00000054812 ENSRNOT00000086669 |
LOC100911215
|
T-cell surface glycoprotein CD5-like |
| chr4_+_162541751 | 31.42 |
ENSRNOT00000010312
|
Klrb1c
|
killer cell lectin-like receptor subfamily B member 1C |
| chr6_-_138565404 | 30.98 |
ENSRNOT00000079420
|
AABR07065645.2
|
|
| chr10_-_106976040 | 30.18 |
ENSRNOT00000003940
|
Socs3
|
suppressor of cytokine signaling 3 |
| chr7_-_119797098 | 30.03 |
ENSRNOT00000009994
|
Rac2
|
ras-related C3 botulinum toxin substrate 2 (rho family, small GTP binding protein Rac2) |
| chr1_-_197821936 | 29.92 |
ENSRNOT00000055027
|
Cd19
|
CD19 molecule |
| chr1_-_101236065 | 29.77 |
ENSRNOT00000066834
|
Cd37
|
CD37 molecule |
| chr3_-_172537877 | 29.74 |
ENSRNOT00000072069
|
Ctsz
|
cathepsin Z |
| chr2_-_202816562 | 29.38 |
ENSRNOT00000020401
|
Fam46c
|
family with sequence similarity 46, member C |
| chrX_-_71169038 | 29.17 |
ENSRNOT00000005343
|
Il2rg
|
interleukin 2 receptor subunit gamma |
| chr6_-_140102325 | 28.70 |
ENSRNOT00000072238
|
AABR07065750.2
|
|
| chr20_-_32139789 | 28.56 |
ENSRNOT00000078140
|
Srgn
|
serglycin |
| chr4_+_98481520 | 28.06 |
ENSRNOT00000078381
ENSRNOT00000048493 |
AABR07060886.1
|
|
| chr20_+_3148665 | 27.61 |
ENSRNOT00000086026
|
RT1-N2
|
RT1 class Ib, locus N2 |
| chr20_-_21689553 | 27.55 |
ENSRNOT00000038095
|
Tmem26
|
transmembrane protein 26 |
| chr6_-_143590448 | 27.33 |
ENSRNOT00000056771
|
Ighv8-4
|
immunoglobulin heavy variable V8-4 |
| chr1_-_198128857 | 27.28 |
ENSRNOT00000026496
|
Coro1a
|
coronin 1A |
| chr18_-_28438654 | 27.11 |
ENSRNOT00000036301
|
Mzb1
|
marginal zone B and B1 cell-specific protein |
| chr1_-_226887156 | 26.92 |
ENSRNOT00000054809
ENSRNOT00000028347 |
Cd6
|
Cd6 molecule |
| chr13_+_90301006 | 26.75 |
ENSRNOT00000029315
|
Slamf6
|
SLAM family member 6 |
| chr6_-_138565245 | 26.75 |
ENSRNOT00000070980
|
AABR07065645.2
|
|
| chr14_-_100217913 | 26.65 |
ENSRNOT00000079167
|
Plek
|
pleckstrin |
| chr5_+_149056078 | 26.51 |
ENSRNOT00000083028
|
Laptm5
|
lysosomal protein transmembrane 5 |
| chr4_+_99185885 | 26.43 |
ENSRNOT00000009392
|
Cd8b
|
CD8b molecule |
| chr12_+_1903165 | 26.36 |
ENSRNOT00000083947
|
AABR07034956.1
|
|
| chr12_-_39850567 | 26.13 |
ENSRNOT00000001712
|
Hvcn1
|
hydrogen voltage-gated channel 1 |
| chr13_+_89975267 | 25.96 |
ENSRNOT00000006266
ENSRNOT00000000053 |
Cd244
|
CD244 molecule |
| chr6_-_108596446 | 25.92 |
ENSRNOT00000031331
ENSRNOT00000077458 ENSRNOT00000082792 |
Ltbp2
|
latent transforming growth factor beta binding protein 2 |
| chr3_+_19690016 | 25.87 |
ENSRNOT00000085460
|
AABR07051707.1
|
|
| chr10_-_56506446 | 25.61 |
ENSRNOT00000021357
|
Acap1
|
ArfGAP with coiled-coil, ankyrin repeat and PH domains 1 |
| chr1_-_82279145 | 25.56 |
ENSRNOT00000057433
|
Cxcl17
|
C-X-C motif chemokine ligand 17 |
| chr8_-_23146689 | 25.53 |
ENSRNOT00000092200
|
Acp5
|
acid phosphatase 5, tartrate resistant |
| chr6_-_138772894 | 25.38 |
ENSRNOT00000080779
|
AABR07065651.1
|
|
| chr5_-_157199441 | 25.31 |
ENSRNOT00000022559
|
Pla2g2f
|
phospholipase A2, group IIF |
| chr2_+_190073815 | 25.21 |
ENSRNOT00000015473
|
S100a8
|
S100 calcium binding protein A8 |
| chr6_-_138744480 | 25.21 |
ENSRNOT00000089387
|
AABR07065651.5
|
|
| chr3_+_72385666 | 25.17 |
ENSRNOT00000011168
|
Prg2
|
proteoglycan 2 |
| chr17_-_9721542 | 25.17 |
ENSRNOT00000047958
ENSRNOT00000079063 |
Grk6
|
G protein-coupled receptor kinase 6 |
| chr6_-_138507294 | 25.12 |
ENSRNOT00000078516
|
AABR07065640.1
|
|
| chr1_-_133503194 | 25.10 |
ENSRNOT00000077049
|
Mctp2
|
multiple C2 and transmembrane domain containing 2 |
| chr6_-_138772736 | 25.01 |
ENSRNOT00000071492
|
AABR07065651.1
|
|
| chr6_-_138550576 | 24.98 |
ENSRNOT00000075284
|
AABR07065645.1
|
|
| chr12_-_21670269 | 24.97 |
ENSRNOT00000074863
|
LOC100910801
|
paired immunoglobulin-like type 2 receptor alpha-like |
| chr6_-_138507135 | 24.82 |
ENSRNOT00000071078
|
AABR07065640.1
|
|
| chr10_-_19574094 | 24.82 |
ENSRNOT00000059810
|
Dock2
|
dedicator of cytokinesis 2 |
| chr5_-_79691258 | 24.76 |
ENSRNOT00000072920
|
Tnfsf8
|
tumor necrosis factor superfamily member 8 |
| chr10_+_104997205 | 24.63 |
ENSRNOT00000074003
|
RGD1561778
|
similar to dendritic cell-derived immunoglobulin(Ig)-like receptor 1, DIgR1 - mouse |
| chr3_-_3700200 | 24.52 |
ENSRNOT00000036231
|
AC129824.1
|
|
| chr10_-_15590220 | 24.52 |
ENSRNOT00000048977
|
Hba-a2
|
hemoglobin alpha, adult chain 2 |
| chr20_+_9791171 | 24.45 |
ENSRNOT00000078031
|
Abcg1
|
ATP binding cassette subfamily G member 1 |
| chr12_+_19890749 | 24.37 |
ENSRNOT00000074970
|
RGD1559588
|
similar to cell surface receptor FDFACT |
| chr3_+_66193059 | 24.25 |
ENSRNOT00000006880
|
Itga4
|
integrin subunit alpha 4 |
| chr20_-_5212624 | 24.05 |
ENSRNOT00000074261
|
LOC103689996
|
antigen peptide transporter 2 |
| chr8_-_62410338 | 23.97 |
ENSRNOT00000026358
|
Csk
|
c-src tyrosine kinase |
| chr5_+_153507093 | 23.73 |
ENSRNOT00000086650
ENSRNOT00000083645 |
Runx3
|
runt-related transcription factor 3 |
| chr3_+_148579920 | 23.56 |
ENSRNOT00000012432
|
Hck
|
HCK proto-oncogene, Src family tyrosine kinase |
| chr1_+_216191886 | 23.50 |
ENSRNOT00000054863
|
Tspan32
|
tetraspanin 32 |
| chr10_-_47997097 | 23.43 |
ENSRNOT00000032092
|
Slc5a10
|
solute carrier family 5 member 10 |
| chr1_-_100537377 | 23.37 |
ENSRNOT00000026599
|
Spib
|
Spi-B transcription factor |
| chr10_+_56576428 | 23.20 |
ENSRNOT00000079237
ENSRNOT00000023291 |
Cldn7
|
claudin 7 |
| chr1_+_78710539 | 23.09 |
ENSRNOT00000021455
|
Slc1a5
|
solute carrier family 1 member 5 |
| chr13_+_89774764 | 23.08 |
ENSRNOT00000005619
|
Arhgap30
|
Rho GTPase activating protein 30 |
| chr10_-_5260608 | 23.03 |
ENSRNOT00000003572
|
Ciita
|
class II, major histocompatibility complex, transactivator |
| chr10_+_104952458 | 22.84 |
ENSRNOT00000074082
|
RGD1559482
|
similar to immunoglobulin superfamily, member 7 |
| chr3_+_123731539 | 22.77 |
ENSRNOT00000051064
|
Cdc25b
|
cell division cycle 25B |
| chr1_+_173252058 | 22.74 |
ENSRNOT00000073421
|
LOC499229
|
similar to very large inducible GTPase 1 isoform A |
| chr6_-_138536162 | 22.38 |
ENSRNOT00000083031
|
AABR07065643.1
|
|
| chr20_-_1339488 | 22.16 |
ENSRNOT00000041074
|
RT1-M2
|
RT1 class Ib, locus M2 |
| chr3_+_19045214 | 21.99 |
ENSRNOT00000070878
|
AABR07051670.1
|
|
| chr6_-_138900915 | 21.89 |
ENSRNOT00000075363
|
AABR07065656.3
|
|
| chr1_-_16687817 | 21.85 |
ENSRNOT00000091376
ENSRNOT00000081620 |
Myb
|
MYB proto-oncogene, transcription factor |
| chrX_+_122507374 | 21.80 |
ENSRNOT00000032275
ENSRNOT00000080517 |
Dock11
|
dedicator of cytokinesis 11 |
| chr11_-_38103290 | 21.57 |
ENSRNOT00000066413
|
Tmprss2
|
transmembrane protease, serine 2 |
| chr10_+_104952237 | 21.52 |
ENSRNOT00000085222
|
RGD1559482
|
similar to immunoglobulin superfamily, member 7 |
| chr1_+_78833157 | 21.46 |
ENSRNOT00000022461
|
Ptgir
|
prostaglandin I2 (prostacyclin) receptor (IP) |
| chr3_+_111049315 | 21.36 |
ENSRNOT00000017223
|
Spint1
|
serine peptidase inhibitor, Kunitz type 1 |
| chr1_-_220848153 | 21.26 |
ENSRNOT00000037404
|
Ctsw
|
cathepsin W |
| chr1_-_197770669 | 21.23 |
ENSRNOT00000023563
|
Lat
|
linker for activation of T cells |
| chr10_-_31419235 | 21.22 |
ENSRNOT00000059496
|
Cyfip2
|
cytoplasmic FMR1 interacting protein 2 |
| chr1_+_227240383 | 21.16 |
ENSRNOT00000074127
|
Ms4a6e
|
membrane spanning 4-domains A6E |
| chr3_+_161519743 | 20.95 |
ENSRNOT00000055148
|
Cd40
|
CD40 molecule |
| chr3_-_171286413 | 20.93 |
ENSRNOT00000008365
ENSRNOT00000081036 |
Zbp1
|
Z-DNA binding protein 1 |
| chr1_-_176079125 | 20.64 |
ENSRNOT00000047044
|
RGD1566189
|
similar to ferritin light chain |
| chr1_+_83003841 | 20.47 |
ENSRNOT00000057384
|
Ceacam4
|
carcinoembryonic antigen-related cell adhesion molecule 4 |
| chr3_-_148722710 | 20.47 |
ENSRNOT00000090919
ENSRNOT00000068592 |
Plagl2
|
PLAG1 like zinc finger 2 |
| chr6_-_138632159 | 20.41 |
ENSRNOT00000082921
ENSRNOT00000040702 |
Ighm
|
immunoglobulin heavy constant mu |
| chr3_+_161018511 | 20.38 |
ENSRNOT00000019804
ENSRNOT00000039664 |
Wfdc2
|
WAP four-disulfide core domain 2 |
| chr20_+_9743269 | 20.38 |
ENSRNOT00000001533
ENSRNOT00000083505 |
Abcg1
|
ATP binding cassette subfamily G member 1 |
| chr13_-_80775230 | 20.34 |
ENSRNOT00000091389
ENSRNOT00000004762 |
Fmo2
|
flavin containing monooxygenase 2 |
| chr10_+_57040267 | 20.33 |
ENSRNOT00000026207
|
Arrb2
|
arrestin, beta 2 |
| chr9_+_81656116 | 20.05 |
ENSRNOT00000083421
|
Slc11a1
|
solute carrier family 11 member 1 |
| chr10_-_15603649 | 20.04 |
ENSRNOT00000051483
|
Hba-a2
|
hemoglobin alpha, adult chain 2 |
| chr12_+_25498198 | 20.01 |
ENSRNOT00000076916
|
Ncf1
|
neutrophil cytosolic factor 1 |
| chr5_-_75319765 | 19.93 |
ENSRNOT00000085698
|
Svep1
|
sushi, von Willebrand factor type A, EGF and pentraxin domain containing 1 |
| chr7_-_107616038 | 19.87 |
ENSRNOT00000088752
|
Sla
|
src-like adaptor |
| chr19_+_3325893 | 19.87 |
ENSRNOT00000048879
|
RGD1565617
|
similar to Ig variable region, light chain |
| chr1_+_165506361 | 19.85 |
ENSRNOT00000024156
|
Ucp2
|
uncoupling protein 2 |
| chr5_+_133864798 | 19.13 |
ENSRNOT00000091977
|
Tal1
|
TAL bHLH transcription factor 1, erythroid differentiation factor |
| chr3_-_160730360 | 19.09 |
ENSRNOT00000075864
|
RGD1563818
|
similar to secretory leukocyte protease inhibitor |
| chr4_-_113866674 | 18.99 |
ENSRNOT00000010020
|
Dok1
|
docking protein 1 |
| chr10_-_110232843 | 18.99 |
ENSRNOT00000054934
|
Cd7
|
Cd7 molecule |
| chr1_+_87938042 | 18.79 |
ENSRNOT00000027837
|
Map4k1
|
mitogen activated protein kinase kinase kinase kinase 1 |
| chr12_+_24761210 | 18.79 |
ENSRNOT00000002003
|
Cldn4
|
claudin 4 |
| chr9_+_9970209 | 18.70 |
ENSRNOT00000075215
|
Dennd1c
|
DENN/MADD domain containing 1C |
| chr1_-_88881460 | 18.70 |
ENSRNOT00000028287
|
Hcst
|
hematopoietic cell signal transducer |
| chr20_-_2678141 | 18.59 |
ENSRNOT00000072377
ENSRNOT00000083833 |
C4a
|
complement component 4A (Rodgers blood group) |
| chr4_+_70828894 | 18.55 |
ENSRNOT00000064892
|
Trbc2
|
T cell receptor beta, constant 2 |
| chr12_-_46889082 | 18.53 |
ENSRNOT00000001525
|
Pla2g1b
|
phospholipase A2 group IB |
| chr1_+_81643816 | 18.50 |
ENSRNOT00000027214
|
LOC103689942
|
carcinoembryonic antigen-related cell adhesion molecule 1-like |
| chr10_-_104624757 | 18.36 |
ENSRNOT00000087759
|
Unc13d
|
unc-13 homolog D |
| chr10_-_47997796 | 18.33 |
ENSRNOT00000078422
|
Slc5a10
|
solute carrier family 5 member 10 |
| chr10_-_70871066 | 18.31 |
ENSRNOT00000015139
|
Ccl3
|
C-C motif chemokine ligand 3 |
| chr5_+_133865331 | 18.28 |
ENSRNOT00000035409
|
Tal1
|
TAL bHLH transcription factor 1, erythroid differentiation factor |
| chr18_+_56431820 | 18.27 |
ENSRNOT00000079360
ENSRNOT00000049357 |
Csf1r
|
colony stimulating factor 1 receptor |
| chr6_-_139102378 | 18.23 |
ENSRNOT00000086423
|
AABR07065656.5
|
|
| chr1_-_271275989 | 18.21 |
ENSRNOT00000075570
|
LOC100912218
|
inositol 1,4,5-trisphosphate receptor-interacting protein-like |
| chr4_+_101645731 | 18.21 |
ENSRNOT00000087901
|
AABR07060953.1
|
|
| chr12_-_22126350 | 18.21 |
ENSRNOT00000076328
|
Sap25
|
Sin3A-associated protein 25 |
| chr14_+_84306466 | 18.18 |
ENSRNOT00000006116
|
Sec14l4
|
SEC14-like lipid binding 4 |
| chr3_-_48372583 | 18.18 |
ENSRNOT00000040482
ENSRNOT00000077788 ENSRNOT00000085426 |
Dpp4
|
dipeptidylpeptidase 4 |
| chr6_+_139209936 | 18.15 |
ENSRNOT00000087620
|
AABR07065680.1
|
|
| chr19_+_50045020 | 18.12 |
ENSRNOT00000090165
|
Plcg2
|
phospholipase C, gamma 2 |
| chr12_-_21832813 | 18.08 |
ENSRNOT00000075280
|
Cldn3
|
claudin 3 |
| chr6_-_141321108 | 18.04 |
ENSRNOT00000040556
|
AABR07065789.3
|
|
| chr7_-_12899004 | 17.97 |
ENSRNOT00000011086
|
Gzmm
|
granzyme M |
| chr3_-_80012750 | 17.92 |
ENSRNOT00000018154
|
Nr1h3
|
nuclear receptor subfamily 1, group H, member 3 |
| chr1_+_221773254 | 17.89 |
ENSRNOT00000028646
|
Rasgrp2
|
RAS guanyl releasing protein 2 |
| chr12_+_16913312 | 17.88 |
ENSRNOT00000001718
|
Tmem184a
|
transmembrane protein 184A |
| chr10_-_56270640 | 17.87 |
ENSRNOT00000056918
|
Cd68
|
Cd68 molecule |
| chr19_-_25163957 | 17.87 |
ENSRNOT00000007726
ENSRNOT00000085630 |
Il27ra
|
interleukin 27 receptor subunit alpha |
| chr15_-_51168384 | 17.86 |
ENSRNOT00000021636
|
Slc25a37
|
solute carrier family 25 member 37 |
| chr7_+_119554354 | 17.81 |
ENSRNOT00000000203
|
Csf2rb
|
colony stimulating factor 2 receptor beta common subunit |
| chr9_+_92618352 | 17.73 |
ENSRNOT00000034603
|
Sp140
|
SP140 nuclear body protein |
| chr19_-_43911057 | 17.72 |
ENSRNOT00000026017
|
Ctrb1
|
chymotrypsinogen B1 |
| chr11_+_86094567 | 17.66 |
ENSRNOT00000086514
|
LOC100361706
|
lambda-chain C1-region-like |
| chr6_-_141291347 | 17.66 |
ENSRNOT00000008333
|
AABR07065789.1
|
|
| chr12_+_2180150 | 17.64 |
ENSRNOT00000001322
|
Stxbp2
|
syntaxin binding protein 2 |
| chr20_-_4935372 | 17.64 |
ENSRNOT00000050099
ENSRNOT00000047779 |
RT1-CE3
RT1-CE4
|
RT1 class I, locus CE3 RT1 class I, locus CE4 |
| chr17_-_86657473 | 17.63 |
ENSRNOT00000078827
|
AABR07028795.1
|
|
| chr7_-_118840634 | 17.62 |
ENSRNOT00000031568
|
Apol11a
|
apolipoprotein L 11a |
| chrX_+_70461718 | 17.56 |
ENSRNOT00000078233
ENSRNOT00000003789 |
Kif4a
|
kinesin family member 4A |
| chr9_-_9985358 | 17.52 |
ENSRNOT00000080856
|
Crb3
|
crumbs 3, cell polarity complex component |
| chr3_+_93920013 | 17.51 |
ENSRNOT00000083527
|
Lmo2
|
LIM domain only 2 |
| chr6_-_138909105 | 17.50 |
ENSRNOT00000087855
|
AABR07065656.9
|
|
| chr4_+_56805132 | 17.45 |
ENSRNOT00000010001
ENSRNOT00000085483 |
Irf5
|
interferon regulatory factor 5 |
| chr8_+_55603968 | 17.42 |
ENSRNOT00000066848
|
Pou2af1
|
POU class 2 associating factor 1 |
| chr6_-_138536321 | 17.41 |
ENSRNOT00000077743
|
AABR07065643.1
|
|
| chr6_-_142676432 | 17.34 |
ENSRNOT00000074947
|
AABR07065815.2
|
|
| chr13_-_91981432 | 17.30 |
ENSRNOT00000004637
|
AABR07021804.1
|
|
| chr19_-_10681145 | 17.28 |
ENSRNOT00000022167
|
Ccl22
|
C-C motif chemokine ligand 22 |
| chr20_-_4508197 | 17.23 |
ENSRNOT00000086027
ENSRNOT00000000514 |
C4a
|
complement component 4A (Rodgers blood group) |
| chr10_+_48903540 | 17.21 |
ENSRNOT00000004248
|
Trpv2
|
transient receptor potential cation channel, subfamily V, member 2 |
| chr3_-_16441030 | 17.19 |
ENSRNOT00000047784
|
AABR07051532.1
|
|
| chr13_-_111917587 | 17.18 |
ENSRNOT00000007649
|
Traf3ip3
|
TRAF3 interacting protein 3 |
| chr11_+_31560530 | 17.13 |
ENSRNOT00000061345
|
Il10rb
|
interleukin 10 receptor subunit beta |
| chr1_-_98521551 | 17.13 |
ENSRNOT00000081922
|
Siglec10
|
sialic acid binding Ig-like lectin 10 |
| chr4_+_102147211 | 17.12 |
ENSRNOT00000083239
|
AABR07060980.1
|
|
| chr2_+_232128235 | 17.09 |
ENSRNOT00000014533
|
Tifa
|
TRAF-interacting protein with forkhead-associated domain |
| chrX_+_15273933 | 17.05 |
ENSRNOT00000075082
|
LOC108348091
|
erythroid transcription factor |
| chr15_+_87722221 | 16.97 |
ENSRNOT00000082688
|
Scel
|
sciellin |
| chr3_+_20641664 | 16.93 |
ENSRNOT00000044699
|
AABR07051741.1
|
|
| chrX_-_139476206 | 16.92 |
ENSRNOT00000049856
|
Ftl1l1
|
ferritin light chain 1-like 1 |
| chr2_+_206342066 | 16.87 |
ENSRNOT00000026556
|
Ptpn22
|
protein tyrosine phosphatase, non-receptor type 22 |
| chr1_+_213766758 | 16.77 |
ENSRNOT00000005645
|
Ifitm1
|
interferon induced transmembrane protein 1 |
| chr7_-_11257977 | 16.77 |
ENSRNOT00000027932
|
Tbxa2r
|
thromboxane A2 receptor |
| chr6_-_143065639 | 16.75 |
ENSRNOT00000070923
|
AABR07065827.1
|
|
| chr12_-_21891105 | 16.68 |
ENSRNOT00000046100
|
LOC685048
|
similar to paired immunoglobin-like type 2 receptor beta |
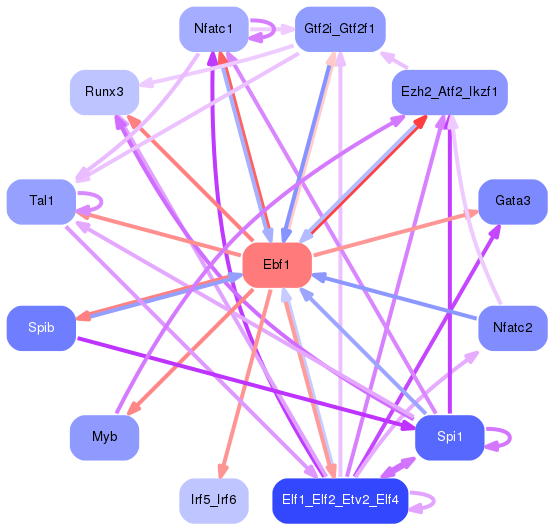
Network of associatons between targets according to the STRING database.

First level regulatory network of Ebf1
Gene Ontology Analysis
Gene overrepresentation in biological process category:
| Log-likelihood per target | Total log-likelihood | Term | Description |
|---|---|---|---|
| 22.8 | 114.2 | GO:0038110 | interleukin-2-mediated signaling pathway(GO:0038110) |
| 16.8 | 50.3 | GO:0071661 | granzyme B production(GO:0071613) regulation of granzyme B production(GO:0071661) positive regulation of granzyme B production(GO:0071663) |
| 15.4 | 61.5 | GO:0030221 | basophil differentiation(GO:0030221) |
| 14.2 | 56.7 | GO:0030886 | negative regulation of myeloid dendritic cell activation(GO:0030886) |
| 12.8 | 51.2 | GO:0002337 | B-1a B cell differentiation(GO:0002337) |
| 12.8 | 51.2 | GO:0045658 | regulation of neutrophil differentiation(GO:0045658) |
| 12.6 | 25.2 | GO:0002215 | defense response to nematode(GO:0002215) |
| 12.5 | 49.9 | GO:2000525 | regulation of T cell costimulation(GO:2000523) positive regulation of T cell costimulation(GO:2000525) |
| 11.7 | 46.7 | GO:0002343 | peripheral B cell selection(GO:0002343) B cell affinity maturation(GO:0002344) |
| 10.8 | 43.1 | GO:0070560 | protein secretion by platelet(GO:0070560) |
| 10.6 | 52.8 | GO:0050828 | regulation of liquid surface tension(GO:0050828) |
| 10.1 | 40.3 | GO:0034436 | glycoprotein transport(GO:0034436) |
| 9.5 | 28.6 | GO:0033364 | mast cell secretory granule organization(GO:0033364) |
| 8.9 | 26.7 | GO:0019417 | sulfur oxidation(GO:0019417) |
| 8.7 | 26.1 | GO:0014739 | positive regulation of muscle hyperplasia(GO:0014739) |
| 8.4 | 50.6 | GO:0071224 | cellular response to peptidoglycan(GO:0071224) |
| 8.4 | 25.2 | GO:0055073 | cadmium ion homeostasis(GO:0055073) |
| 8.4 | 33.5 | GO:0002032 | desensitization of G-protein coupled receptor protein signaling pathway by arrestin(GO:0002032) |
| 8.3 | 24.8 | GO:0002277 | myeloid dendritic cell activation involved in immune response(GO:0002277) |
| 8.2 | 57.7 | GO:0032429 | regulation of phospholipase A2 activity(GO:0032429) |
| 7.8 | 7.8 | GO:0002585 | positive regulation of antigen processing and presentation of peptide antigen(GO:0002585) |
| 7.8 | 23.3 | GO:0072714 | response to selenite ion(GO:0072714) negative regulation of connective tissue replacement(GO:1905204) |
| 7.5 | 37.4 | GO:0042997 | negative regulation of Golgi to plasma membrane protein transport(GO:0042997) |
| 7.4 | 29.4 | GO:2000196 | positive regulation of female gonad development(GO:2000196) |
| 7.3 | 65.9 | GO:0002315 | marginal zone B cell differentiation(GO:0002315) |
| 7.3 | 21.9 | GO:2000845 | positive regulation of testosterone secretion(GO:2000845) |
| 7.2 | 43.3 | GO:0001866 | NK T cell proliferation(GO:0001866) |
| 7.2 | 14.3 | GO:0035701 | hematopoietic stem cell migration(GO:0035701) |
| 7.1 | 42.7 | GO:0010360 | negative regulation of anion channel activity(GO:0010360) |
| 6.8 | 20.5 | GO:0030997 | regulation of centriole-centriole cohesion(GO:0030997) |
| 6.8 | 20.3 | GO:0072592 | oxygen metabolic process(GO:0072592) |
| 6.8 | 27.1 | GO:0002378 | immunoglobulin biosynthetic process(GO:0002378) |
| 6.7 | 20.0 | GO:0070946 | neutrophil mediated killing of gram-positive bacterium(GO:0070946) |
| 6.6 | 19.9 | GO:0008588 | release of cytoplasmic sequestered NF-kappaB(GO:0008588) |
| 6.6 | 19.7 | GO:0034154 | toll-like receptor 7 signaling pathway(GO:0034154) |
| 6.5 | 58.5 | GO:0010668 | ectodermal cell differentiation(GO:0010668) |
| 6.4 | 32.0 | GO:0060708 | spongiotrophoblast differentiation(GO:0060708) |
| 6.4 | 19.1 | GO:0002752 | cell surface pattern recognition receptor signaling pathway(GO:0002752) |
| 6.3 | 18.8 | GO:0002296 | T-helper 1 cell lineage commitment(GO:0002296) |
| 6.2 | 12.5 | GO:0002586 | regulation of antigen processing and presentation of peptide antigen via MHC class II(GO:0002586) |
| 6.2 | 12.5 | GO:0002693 | positive regulation of cellular extravasation(GO:0002693) |
| 6.2 | 12.5 | GO:0045608 | negative regulation of auditory receptor cell differentiation(GO:0045608) |
| 6.2 | 18.5 | GO:0044240 | multicellular organism lipid catabolic process(GO:0044240) |
| 6.1 | 18.4 | GO:0002432 | granuloma formation(GO:0002432) |
| 6.1 | 24.3 | GO:0050904 | diapedesis(GO:0050904) negative regulation of protein homodimerization activity(GO:0090074) |
| 6.0 | 60.3 | GO:0046642 | negative regulation of alpha-beta T cell proliferation(GO:0046642) |
| 6.0 | 23.8 | GO:0001806 | type IV hypersensitivity(GO:0001806) |
| 5.9 | 23.8 | GO:0018992 | germ-line sex determination(GO:0018992) |
| 5.8 | 11.5 | GO:0002856 | negative regulation of T cell mediated cytotoxicity(GO:0001915) negative regulation of response to tumor cell(GO:0002835) negative regulation of immune response to tumor cell(GO:0002838) negative regulation of natural killer cell mediated immune response to tumor cell(GO:0002856) negative regulation of natural killer cell mediated cytotoxicity directed against tumor cell target(GO:0002859) |
| 5.7 | 51.6 | GO:1900165 | negative regulation of interleukin-6 secretion(GO:1900165) |
| 5.7 | 5.7 | GO:0002025 | vasodilation by norepinephrine-epinephrine involved in regulation of systemic arterial blood pressure(GO:0002025) |
| 5.7 | 17.0 | GO:0061744 | motor behavior(GO:0061744) |
| 5.6 | 33.8 | GO:0006868 | glutamine transport(GO:0006868) |
| 5.6 | 33.5 | GO:0001787 | natural killer cell proliferation(GO:0001787) |
| 5.6 | 16.7 | GO:0036395 | pancreatic amylase secretion(GO:0036395) regulation of pancreatic amylase secretion(GO:1902276) |
| 5.5 | 33.1 | GO:1902965 | regulation of protein localization to early endosome(GO:1902965) positive regulation of protein localization to early endosome(GO:1902966) |
| 5.5 | 32.9 | GO:0032494 | response to peptidoglycan(GO:0032494) |
| 5.4 | 16.1 | GO:0007356 | thorax and anterior abdomen determination(GO:0007356) |
| 5.3 | 42.1 | GO:2000427 | positive regulation of apoptotic cell clearance(GO:2000427) |
| 5.3 | 26.3 | GO:0048550 | negative regulation of pinocytosis(GO:0048550) |
| 5.2 | 20.8 | GO:0038145 | macrophage colony-stimulating factor signaling pathway(GO:0038145) |
| 5.2 | 15.5 | GO:2001190 | positive regulation of T cell activation via T cell receptor contact with antigen bound to MHC molecule on antigen presenting cell(GO:2001190) |
| 5.1 | 35.4 | GO:0051126 | negative regulation of actin nucleation(GO:0051126) |
| 5.1 | 50.6 | GO:0006968 | cellular defense response(GO:0006968) |
| 5.0 | 10.1 | GO:0036216 | response to stem cell factor(GO:0036215) cellular response to stem cell factor stimulus(GO:0036216) |
| 5.0 | 15.1 | GO:1900114 | positive regulation of histone H3-K9 dimethylation(GO:1900111) positive regulation of histone H3-K9 trimethylation(GO:1900114) |
| 5.0 | 5.0 | GO:1901492 | positive regulation of lymphangiogenesis(GO:1901492) |
| 4.9 | 19.5 | GO:0097350 | neutrophil clearance(GO:0097350) negative regulation of dendritic cell apoptotic process(GO:2000669) |
| 4.9 | 14.6 | GO:0034124 | regulation of MyD88-dependent toll-like receptor signaling pathway(GO:0034124) |
| 4.8 | 48.3 | GO:0050862 | positive regulation of T cell receptor signaling pathway(GO:0050862) |
| 4.8 | 14.4 | GO:0033861 | negative regulation of NAD(P)H oxidase activity(GO:0033861) |
| 4.8 | 19.1 | GO:0046391 | 5-phosphoribose 1-diphosphate biosynthetic process(GO:0006015) 5-phosphoribose 1-diphosphate metabolic process(GO:0046391) |
| 4.8 | 14.3 | GO:0010986 | positive regulation of lipoprotein particle clearance(GO:0010986) |
| 4.8 | 23.8 | GO:0032713 | negative regulation of interleukin-4 production(GO:0032713) |
| 4.7 | 23.5 | GO:0015801 | aromatic amino acid transport(GO:0015801) |
| 4.7 | 56.4 | GO:0045647 | negative regulation of erythrocyte differentiation(GO:0045647) |
| 4.7 | 28.0 | GO:0060753 | regulation of mast cell chemotaxis(GO:0060753) |
| 4.6 | 13.8 | GO:0046061 | dATP catabolic process(GO:0046061) |
| 4.6 | 32.1 | GO:0051256 | mitotic spindle elongation(GO:0000022) mitotic spindle midzone assembly(GO:0051256) |
| 4.6 | 18.3 | GO:2000503 | positive regulation of natural killer cell chemotaxis(GO:2000503) |
| 4.5 | 40.9 | GO:0032831 | regulation of CD4-positive, CD25-positive, alpha-beta regulatory T cell differentiation(GO:0032829) positive regulation of CD4-positive, CD25-positive, alpha-beta regulatory T cell differentiation(GO:0032831) |
| 4.5 | 13.6 | GO:0072237 | cellular response to mercury ion(GO:0071288) metanephric proximal tubule development(GO:0072237) |
| 4.5 | 13.5 | GO:0044785 | metaphase/anaphase transition of meiotic cell cycle(GO:0044785) regulation of metaphase/anaphase transition of meiotic cell cycle(GO:1902102) negative regulation of metaphase/anaphase transition of meiotic cell cycle(GO:1902103) regulation of meiotic chromosome separation(GO:1905132) negative regulation of meiotic chromosome separation(GO:1905133) |
| 4.5 | 35.7 | GO:0010216 | maintenance of DNA methylation(GO:0010216) |
| 4.4 | 13.3 | GO:0001805 | antibody-dependent cellular cytotoxicity(GO:0001788) type III hypersensitivity(GO:0001802) regulation of type III hypersensitivity(GO:0001803) positive regulation of type III hypersensitivity(GO:0001805) |
| 4.4 | 8.8 | GO:0071640 | macrophage inflammatory protein-1 alpha production(GO:0071608) regulation of macrophage inflammatory protein 1 alpha production(GO:0071640) |
| 4.4 | 4.4 | GO:2000814 | positive regulation of barbed-end actin filament capping(GO:2000814) |
| 4.4 | 13.2 | GO:0032912 | negative regulation of transforming growth factor beta2 production(GO:0032912) |
| 4.3 | 12.9 | GO:0032747 | positive regulation of interleukin-23 production(GO:0032747) |
| 4.3 | 21.4 | GO:0070944 | neutrophil mediated killing of bacterium(GO:0070944) neutrophil mediated killing of gram-negative bacterium(GO:0070945) |
| 4.3 | 12.8 | GO:0014028 | notochord formation(GO:0014028) |
| 4.2 | 29.7 | GO:0010757 | negative regulation of plasminogen activation(GO:0010757) |
| 4.2 | 16.9 | GO:0072086 | specification of loop of Henle identity(GO:0072086) |
| 4.2 | 4.2 | GO:0048294 | negative regulation of isotype switching to IgE isotypes(GO:0048294) |
| 4.1 | 8.3 | GO:1902309 | negative regulation of peptidyl-serine dephosphorylation(GO:1902309) |
| 4.1 | 24.4 | GO:0032929 | negative regulation of superoxide anion generation(GO:0032929) |
| 4.0 | 12.1 | GO:0045347 | negative regulation of MHC class II biosynthetic process(GO:0045347) |
| 4.0 | 36.4 | GO:0045591 | positive regulation of regulatory T cell differentiation(GO:0045591) |
| 4.0 | 12.0 | GO:0042196 | chlorinated hydrocarbon metabolic process(GO:0042196) halogenated hydrocarbon metabolic process(GO:0042197) |
| 4.0 | 75.2 | GO:0002504 | antigen processing and presentation of peptide or polysaccharide antigen via MHC class II(GO:0002504) |
| 4.0 | 7.9 | GO:0070839 | divalent metal ion export(GO:0070839) |
| 4.0 | 4.0 | GO:0001923 | B-1 B cell differentiation(GO:0001923) |
| 3.9 | 38.8 | GO:0048302 | regulation of isotype switching to IgG isotypes(GO:0048302) |
| 3.8 | 3.8 | GO:0042631 | cellular response to water deprivation(GO:0042631) |
| 3.8 | 23.0 | GO:0045348 | regulation of MHC class II biosynthetic process(GO:0045346) positive regulation of MHC class II biosynthetic process(GO:0045348) |
| 3.8 | 7.6 | GO:2000422 | regulation of eosinophil chemotaxis(GO:2000422) positive regulation of eosinophil chemotaxis(GO:2000424) |
| 3.8 | 11.3 | GO:0090271 | positive regulation of fibroblast growth factor production(GO:0090271) |
| 3.8 | 11.3 | GO:0043366 | beta selection(GO:0043366) |
| 3.8 | 15.1 | GO:0045084 | positive regulation of interleukin-12 biosynthetic process(GO:0045084) |
| 3.7 | 44.6 | GO:0010759 | positive regulation of macrophage chemotaxis(GO:0010759) |
| 3.7 | 25.6 | GO:0008228 | opsonization(GO:0008228) |
| 3.7 | 40.2 | GO:0032495 | response to muramyl dipeptide(GO:0032495) |
| 3.6 | 53.7 | GO:0015671 | oxygen transport(GO:0015671) |
| 3.6 | 10.7 | GO:0034224 | cellular response to zinc ion starvation(GO:0034224) |
| 3.6 | 32.0 | GO:0046598 | positive regulation of viral entry into host cell(GO:0046598) |
| 3.5 | 31.9 | GO:1900017 | positive regulation of cytokine production involved in inflammatory response(GO:1900017) |
| 3.5 | 7.1 | GO:0034137 | positive regulation of toll-like receptor 2 signaling pathway(GO:0034137) |
| 3.5 | 14.0 | GO:0031666 | positive regulation of lipopolysaccharide-mediated signaling pathway(GO:0031666) |
| 3.5 | 13.9 | GO:2001199 | negative regulation of dendritic cell differentiation(GO:2001199) |
| 3.5 | 24.3 | GO:0035338 | long-chain fatty-acyl-CoA biosynthetic process(GO:0035338) |
| 3.5 | 3.5 | GO:0045210 | FasL biosynthetic process(GO:0045210) |
| 3.5 | 13.8 | GO:0033625 | positive regulation of integrin activation(GO:0033625) |
| 3.4 | 30.8 | GO:0002467 | germinal center formation(GO:0002467) |
| 3.4 | 3.4 | GO:0045819 | positive regulation of glycogen catabolic process(GO:0045819) |
| 3.4 | 16.9 | GO:0010032 | meiotic chromosome condensation(GO:0010032) |
| 3.4 | 40.6 | GO:0016338 | calcium-independent cell-cell adhesion via plasma membrane cell-adhesion molecules(GO:0016338) |
| 3.4 | 10.1 | GO:0061198 | fungiform papilla formation(GO:0061198) |
| 3.4 | 10.1 | GO:0060821 | inactivation of X chromosome by DNA methylation(GO:0060821) |
| 3.4 | 6.7 | GO:0035772 | interleukin-13-mediated signaling pathway(GO:0035772) |
| 3.3 | 23.3 | GO:0032074 | negative regulation of nuclease activity(GO:0032074) |
| 3.3 | 13.2 | GO:1901490 | regulation of lymphangiogenesis(GO:1901490) negative regulation of lymphangiogenesis(GO:1901491) |
| 3.3 | 13.2 | GO:0044339 | canonical Wnt signaling pathway involved in osteoblast differentiation(GO:0044339) |
| 3.3 | 6.6 | GO:0010725 | regulation of primitive erythrocyte differentiation(GO:0010725) primitive erythrocyte differentiation(GO:0060319) |
| 3.3 | 6.5 | GO:0061470 | T follicular helper cell differentiation(GO:0061470) |
| 3.2 | 9.7 | GO:1904380 | endoplasmic reticulum mannose trimming(GO:1904380) |
| 3.2 | 13.0 | GO:0032627 | interleukin-23 production(GO:0032627) regulation of interleukin-23 production(GO:0032667) negative regulation of interleukin-23 production(GO:0032707) |
| 3.2 | 51.7 | GO:1990845 | adaptive thermogenesis(GO:1990845) |
| 3.2 | 16.1 | GO:0010037 | response to carbon dioxide(GO:0010037) |
| 3.2 | 9.5 | GO:2000661 | positive regulation of interleukin-1-mediated signaling pathway(GO:2000661) |
| 3.2 | 3.2 | GO:0043060 | meiotic metaphase I plate congression(GO:0043060) |
| 3.2 | 12.6 | GO:1903575 | cornified envelope assembly(GO:1903575) |
| 3.2 | 25.2 | GO:0002335 | mature B cell differentiation(GO:0002335) |
| 3.2 | 9.5 | GO:0030505 | inorganic diphosphate transport(GO:0030505) |
| 3.1 | 12.6 | GO:0019371 | cyclooxygenase pathway(GO:0019371) |
| 3.1 | 6.3 | GO:0038189 | neuropilin signaling pathway(GO:0038189) VEGF-activated neuropilin signaling pathway(GO:0038190) |
| 3.1 | 9.2 | GO:0061010 | gall bladder development(GO:0061010) |
| 3.0 | 9.1 | GO:0006227 | dUDP biosynthetic process(GO:0006227) pyrimidine nucleoside diphosphate biosynthetic process(GO:0009139) deoxyribonucleoside diphosphate biosynthetic process(GO:0009189) pyrimidine deoxyribonucleoside diphosphate metabolic process(GO:0009196) pyrimidine deoxyribonucleoside diphosphate biosynthetic process(GO:0009197) dUDP metabolic process(GO:0046077) |
| 3.0 | 15.1 | GO:0031659 | positive regulation of cyclin-dependent protein serine/threonine kinase activity involved in G1/S transition of mitotic cell cycle(GO:0031659) |
| 3.0 | 9.0 | GO:0015793 | glycerol transport(GO:0015793) |
| 3.0 | 14.8 | GO:0002457 | T cell antigen processing and presentation(GO:0002457) |
| 2.9 | 8.8 | GO:1902304 | positive regulation of potassium ion export(GO:1902304) |
| 2.9 | 14.6 | GO:0002291 | T cell activation via T cell receptor contact with antigen bound to MHC molecule on antigen presenting cell(GO:0002291) |
| 2.9 | 2.9 | GO:0061073 | ciliary body morphogenesis(GO:0061073) |
| 2.9 | 14.6 | GO:1903223 | positive regulation of oxidative stress-induced neuron death(GO:1903223) |
| 2.9 | 2.9 | GO:1901536 | regulation of DNA demethylation(GO:1901535) negative regulation of DNA demethylation(GO:1901536) |
| 2.9 | 8.6 | GO:0021943 | formation of radial glial scaffolds(GO:0021943) |
| 2.8 | 8.5 | GO:0070120 | ciliary neurotrophic factor-mediated signaling pathway(GO:0070120) |
| 2.8 | 53.9 | GO:0046597 | negative regulation of viral entry into host cell(GO:0046597) |
| 2.8 | 8.5 | GO:0038172 | interleukin-33-mediated signaling pathway(GO:0038172) |
| 2.8 | 11.3 | GO:0060355 | positive regulation of cell adhesion molecule production(GO:0060355) |
| 2.8 | 14.1 | GO:1904717 | regulation of AMPA glutamate receptor clustering(GO:1904717) |
| 2.8 | 16.9 | GO:0070673 | response to interleukin-18(GO:0070673) |
| 2.8 | 120.9 | GO:0048002 | antigen processing and presentation of peptide antigen(GO:0048002) |
| 2.8 | 5.6 | GO:0038030 | non-canonical Wnt signaling pathway via MAPK cascade(GO:0038030) non-canonical Wnt signaling pathway via JNK cascade(GO:0038031) |
| 2.8 | 11.1 | GO:1900158 | negative regulation of bone mineralization involved in bone maturation(GO:1900158) |
| 2.8 | 11.1 | GO:0002326 | B cell lineage commitment(GO:0002326) |
| 2.7 | 10.9 | GO:0030578 | PML body organization(GO:0030578) |
| 2.7 | 8.2 | GO:0036378 | calcitriol biosynthetic process from calciol(GO:0036378) |
| 2.7 | 8.1 | GO:0018199 | peptidyl-glutamine modification(GO:0018199) |
| 2.7 | 10.7 | GO:0032825 | positive regulation of natural killer cell differentiation(GO:0032825) |
| 2.7 | 8.0 | GO:0006529 | asparagine biosynthetic process(GO:0006529) |
| 2.6 | 21.0 | GO:0034242 | negative regulation of syncytium formation by plasma membrane fusion(GO:0034242) |
| 2.6 | 5.2 | GO:1903774 | positive regulation of viral budding via host ESCRT complex(GO:1903774) |
| 2.6 | 10.4 | GO:0009223 | pyrimidine deoxyribonucleotide catabolic process(GO:0009223) |
| 2.6 | 10.3 | GO:0019262 | N-acetylneuraminate catabolic process(GO:0019262) |
| 2.6 | 10.3 | GO:0038165 | oncostatin-M-mediated signaling pathway(GO:0038165) |
| 2.6 | 5.2 | GO:0021776 | smoothened signaling pathway involved in ventral spinal cord interneuron specification(GO:0021775) smoothened signaling pathway involved in spinal cord motor neuron cell fate specification(GO:0021776) |
| 2.6 | 5.1 | GO:0061346 | non-canonical Wnt signaling pathway involved in heart development(GO:0061341) planar cell polarity pathway involved in heart morphogenesis(GO:0061346) |
| 2.6 | 17.9 | GO:0007144 | female meiosis I(GO:0007144) |
| 2.5 | 7.6 | GO:0010751 | negative regulation of nitric oxide mediated signal transduction(GO:0010751) positive regulation of pancreatic juice secretion(GO:0090187) |
| 2.5 | 5.0 | GO:0060282 | positive regulation of oocyte development(GO:0060282) |
| 2.5 | 7.5 | GO:0017143 | insecticide metabolic process(GO:0017143) |
| 2.5 | 7.4 | GO:1900086 | regulation of peptidyl-tyrosine autophosphorylation(GO:1900084) positive regulation of peptidyl-tyrosine autophosphorylation(GO:1900086) |
| 2.5 | 9.9 | GO:0032919 | spermine acetylation(GO:0032919) |
| 2.5 | 22.2 | GO:0030644 | cellular chloride ion homeostasis(GO:0030644) |
| 2.5 | 2.5 | GO:0014718 | positive regulation of satellite cell activation involved in skeletal muscle regeneration(GO:0014718) |
| 2.5 | 9.8 | GO:1904158 | axonemal central apparatus assembly(GO:1904158) |
| 2.5 | 14.7 | GO:0030263 | apoptotic chromosome condensation(GO:0030263) |
| 2.4 | 7.2 | GO:0008594 | photoreceptor cell morphogenesis(GO:0008594) |
| 2.4 | 19.2 | GO:0071223 | response to lipoteichoic acid(GO:0070391) cellular response to lipoteichoic acid(GO:0071223) |
| 2.4 | 9.6 | GO:2000491 | positive regulation of hepatic stellate cell activation(GO:2000491) |
| 2.4 | 11.9 | GO:1901552 | positive regulation of endothelial cell development(GO:1901552) positive regulation of establishment of endothelial barrier(GO:1903142) |
| 2.4 | 9.5 | GO:0002361 | CD4-positive, CD25-positive, alpha-beta regulatory T cell differentiation(GO:0002361) |
| 2.4 | 47.1 | GO:2000251 | positive regulation of actin cytoskeleton reorganization(GO:2000251) |
| 2.3 | 7.0 | GO:0032298 | positive regulation of DNA-dependent DNA replication initiation(GO:0032298) |
| 2.3 | 4.7 | GO:0014900 | regulation of muscle hyperplasia(GO:0014738) muscle hyperplasia(GO:0014900) |
| 2.3 | 7.0 | GO:0009227 | nucleotide-sugar catabolic process(GO:0009227) |
| 2.3 | 16.3 | GO:0043031 | negative regulation of macrophage activation(GO:0043031) |
| 2.3 | 6.9 | GO:1904694 | negative regulation of vascular smooth muscle contraction(GO:1904694) |
| 2.3 | 6.9 | GO:0071283 | cellular response to iron(III) ion(GO:0071283) |
| 2.3 | 2.3 | GO:2001181 | positive regulation of interleukin-10 secretion(GO:2001181) |
| 2.3 | 11.5 | GO:0001992 | regulation of systemic arterial blood pressure by vasopressin(GO:0001992) |
| 2.3 | 15.9 | GO:1904627 | response to phorbol 13-acetate 12-myristate(GO:1904627) cellular response to phorbol 13-acetate 12-myristate(GO:1904628) |
| 2.3 | 9.1 | GO:0044725 | chromatin reprogramming in the zygote(GO:0044725) |
| 2.3 | 33.9 | GO:0060670 | branching involved in labyrinthine layer morphogenesis(GO:0060670) |
| 2.3 | 6.8 | GO:1901219 | regulation of cardiac chamber morphogenesis(GO:1901219) negative regulation of cardiac chamber morphogenesis(GO:1901220) |
| 2.2 | 9.0 | GO:0034421 | post-translational protein acetylation(GO:0034421) |
| 2.2 | 11.2 | GO:0002726 | positive regulation of T cell cytokine production(GO:0002726) |
| 2.2 | 6.7 | GO:0042891 | antibiotic transport(GO:0042891) |
| 2.2 | 4.4 | GO:0045402 | interleukin-4 biosynthetic process(GO:0042097) regulation of interleukin-4 biosynthetic process(GO:0045402) positive regulation of interleukin-4 biosynthetic process(GO:0045404) |
| 2.2 | 15.4 | GO:0044341 | sodium-dependent phosphate transport(GO:0044341) |
| 2.2 | 2.2 | GO:0010999 | regulation of eIF2 alpha phosphorylation by heme(GO:0010999) |
| 2.2 | 4.4 | GO:0099545 | trans-synaptic signaling by trans-synaptic complex(GO:0099545) |
| 2.2 | 10.9 | GO:0035627 | ceramide transport(GO:0035627) |
| 2.2 | 6.5 | GO:0072139 | glomerular parietal epithelial cell differentiation(GO:0072139) |
| 2.2 | 6.5 | GO:0070634 | transepithelial ammonium transport(GO:0070634) |
| 2.2 | 10.8 | GO:0033184 | positive regulation of histone ubiquitination(GO:0033184) |
| 2.2 | 6.5 | GO:0071031 | nuclear mRNA surveillance of mRNA 3'-end processing(GO:0071031) nuclear polyadenylation-dependent tRNA catabolic process(GO:0071038) nuclear retention of pre-mRNA with aberrant 3'-ends at the site of transcription(GO:0071049) |
| 2.2 | 8.6 | GO:0051958 | methotrexate transport(GO:0051958) |
| 2.1 | 6.4 | GO:0042695 | thelarche(GO:0042695) mammary gland branching involved in thelarche(GO:0060744) |
| 2.1 | 12.8 | GO:0070245 | positive regulation of thymocyte apoptotic process(GO:0070245) |
| 2.1 | 10.7 | GO:0009052 | pentose-phosphate shunt, non-oxidative branch(GO:0009052) |
| 2.1 | 2.1 | GO:1903393 | positive regulation of adherens junction organization(GO:1903393) |
| 2.1 | 2.1 | GO:0010446 | response to alkaline pH(GO:0010446) |
| 2.1 | 4.2 | GO:0061009 | common bile duct development(GO:0061009) |
| 2.1 | 21.2 | GO:0060340 | positive regulation of type I interferon-mediated signaling pathway(GO:0060340) |
| 2.1 | 25.2 | GO:0002523 | leukocyte migration involved in inflammatory response(GO:0002523) |
| 2.1 | 10.5 | GO:2000980 | regulation of auditory receptor cell differentiation(GO:0045607) regulation of mechanoreceptor differentiation(GO:0045631) regulation of inner ear receptor cell differentiation(GO:2000980) |
| 2.1 | 14.7 | GO:0030321 | transepithelial chloride transport(GO:0030321) |
| 2.1 | 6.2 | GO:0006014 | D-ribose metabolic process(GO:0006014) D-ribose catabolic process(GO:0019303) |
| 2.1 | 27.0 | GO:0043312 | neutrophil degranulation(GO:0043312) |
| 2.1 | 8.3 | GO:0060857 | establishment of glial blood-brain barrier(GO:0060857) |
| 2.1 | 12.5 | GO:0010940 | positive regulation of necrotic cell death(GO:0010940) |
| 2.1 | 6.2 | GO:0048210 | Golgi vesicle fusion to target membrane(GO:0048210) |
| 2.1 | 22.7 | GO:0007250 | activation of NF-kappaB-inducing kinase activity(GO:0007250) |
| 2.1 | 6.2 | GO:0072733 | response to staurosporine(GO:0072733) cellular response to staurosporine(GO:0072734) |
| 2.1 | 24.8 | GO:0043374 | CD8-positive, alpha-beta T cell differentiation(GO:0043374) |
| 2.1 | 14.4 | GO:0061418 | regulation of transcription from RNA polymerase II promoter in response to hypoxia(GO:0061418) |
| 2.1 | 12.3 | GO:0038095 | Fc-epsilon receptor signaling pathway(GO:0038095) |
| 2.0 | 12.3 | GO:0035331 | negative regulation of hippo signaling(GO:0035331) |
| 2.0 | 6.1 | GO:0010424 | DNA methylation on cytosine within a CG sequence(GO:0010424) |
| 2.0 | 4.1 | GO:1902037 | negative regulation of hematopoietic stem cell differentiation(GO:1902037) |
| 2.0 | 16.3 | GO:0045351 | type I interferon biosynthetic process(GO:0045351) |
| 2.0 | 16.3 | GO:0051388 | positive regulation of neurotrophin TRK receptor signaling pathway(GO:0051388) |
| 2.0 | 8.1 | GO:0060155 | platelet dense granule organization(GO:0060155) |
| 2.0 | 2.0 | GO:0036037 | CD8-positive, alpha-beta T cell activation(GO:0036037) |
| 2.0 | 7.9 | GO:0070827 | chromatin maintenance(GO:0070827) |
| 2.0 | 27.7 | GO:0042832 | defense response to protozoan(GO:0042832) |
| 2.0 | 5.9 | GO:0002149 | hypochlorous acid metabolic process(GO:0002148) hypochlorous acid biosynthetic process(GO:0002149) |
| 2.0 | 3.9 | GO:2000053 | regulation of Wnt signaling pathway involved in dorsal/ventral axis specification(GO:2000053) negative regulation of Wnt signaling pathway involved in dorsal/ventral axis specification(GO:2000054) |
| 2.0 | 62.7 | GO:0002548 | monocyte chemotaxis(GO:0002548) |
| 2.0 | 3.9 | GO:0071500 | cellular response to nitrosative stress(GO:0071500) |
| 1.9 | 1.9 | GO:0051708 | intracellular transport of viral protein in host cell(GO:0019060) symbiont intracellular protein transport in host(GO:0030581) intracellular protein transport in other organism involved in symbiotic interaction(GO:0051708) |
| 1.9 | 5.8 | GO:0035519 | protein K29-linked ubiquitination(GO:0035519) |
| 1.9 | 7.8 | GO:0070309 | lens fiber cell morphogenesis(GO:0070309) |
| 1.9 | 3.9 | GO:1990009 | retinal cell apoptotic process(GO:1990009) |
| 1.9 | 1.9 | GO:0060263 | regulation of respiratory burst(GO:0060263) |
| 1.9 | 5.8 | GO:0046947 | hydroxylysine metabolic process(GO:0046946) hydroxylysine biosynthetic process(GO:0046947) |
| 1.9 | 19.2 | GO:0044364 | killing of cells of other organism(GO:0031640) disruption of cells of other organism(GO:0044364) |
| 1.9 | 5.7 | GO:0033634 | positive regulation of cell-cell adhesion mediated by integrin(GO:0033634) |
| 1.9 | 3.8 | GO:1990743 | protein sialylation(GO:1990743) |
| 1.9 | 7.5 | GO:1900147 | Schwann cell migration(GO:0036135) regulation of Schwann cell migration(GO:1900147) |
| 1.9 | 15.0 | GO:0010838 | positive regulation of keratinocyte proliferation(GO:0010838) |
| 1.9 | 13.2 | GO:0050718 | positive regulation of interleukin-1 secretion(GO:0050716) positive regulation of interleukin-1 beta secretion(GO:0050718) |
| 1.9 | 9.4 | GO:0060741 | prostate gland stromal morphogenesis(GO:0060741) |
| 1.9 | 9.4 | GO:0060298 | positive regulation of sarcomere organization(GO:0060298) |
| 1.9 | 3.7 | GO:0045630 | positive regulation of T-helper 2 cell differentiation(GO:0045630) |
| 1.9 | 7.4 | GO:0006272 | leading strand elongation(GO:0006272) |
| 1.9 | 3.7 | GO:0048341 | paraxial mesoderm formation(GO:0048341) |
| 1.8 | 7.4 | GO:0034351 | negative regulation of glial cell apoptotic process(GO:0034351) |
| 1.8 | 5.5 | GO:0014707 | branchiomeric skeletal muscle development(GO:0014707) |
| 1.8 | 7.3 | GO:0000389 | mRNA 3'-splice site recognition(GO:0000389) |
| 1.8 | 22.0 | GO:0006337 | nucleosome disassembly(GO:0006337) |
| 1.8 | 9.1 | GO:0043587 | tongue morphogenesis(GO:0043587) |
| 1.8 | 5.5 | GO:1904178 | sterol regulatory element binding protein import into nucleus(GO:0035105) negative regulation of adipose tissue development(GO:1904178) |
| 1.8 | 10.9 | GO:0060235 | lens induction in camera-type eye(GO:0060235) |
| 1.8 | 3.6 | GO:1903936 | cellular response to sodium arsenite(GO:1903936) |
| 1.8 | 10.9 | GO:0061304 | retinal blood vessel morphogenesis(GO:0061304) |
| 1.8 | 9.0 | GO:1904668 | positive regulation of ubiquitin protein ligase activity(GO:1904668) |
| 1.8 | 3.6 | GO:0002248 | wound healing involved in inflammatory response(GO:0002246) connective tissue replacement involved in inflammatory response wound healing(GO:0002248) inflammatory response to wounding(GO:0090594) |
| 1.8 | 16.2 | GO:0032633 | interleukin-4 production(GO:0032633) |
| 1.8 | 23.3 | GO:0006880 | intracellular sequestering of iron ion(GO:0006880) sequestering of iron ion(GO:0097577) |
| 1.8 | 7.1 | GO:0071499 | cellular response to laminar fluid shear stress(GO:0071499) |
| 1.8 | 5.4 | GO:2000468 | regulation of peroxidase activity(GO:2000468) |
| 1.8 | 12.5 | GO:0002553 | histamine production involved in inflammatory response(GO:0002349) histamine secretion involved in inflammatory response(GO:0002441) histamine secretion by mast cell(GO:0002553) |
| 1.8 | 7.1 | GO:0060398 | regulation of growth hormone receptor signaling pathway(GO:0060398) |
| 1.8 | 16.0 | GO:0045063 | T-helper 1 cell differentiation(GO:0045063) |
| 1.8 | 7.0 | GO:0071557 | histone H3-K27 demethylation(GO:0071557) |
| 1.7 | 8.7 | GO:0002903 | negative regulation of B cell apoptotic process(GO:0002903) |
| 1.7 | 1.7 | GO:0072053 | renal inner medulla development(GO:0072053) |
| 1.7 | 7.0 | GO:0015781 | pyrimidine nucleotide-sugar transport(GO:0015781) |
| 1.7 | 17.4 | GO:0043129 | surfactant homeostasis(GO:0043129) |
| 1.7 | 3.4 | GO:1901979 | regulation of inward rectifier potassium channel activity(GO:1901979) |
| 1.7 | 23.7 | GO:0042789 | mRNA transcription from RNA polymerase II promoter(GO:0042789) |
| 1.7 | 38.9 | GO:0061436 | establishment of skin barrier(GO:0061436) |
| 1.7 | 11.7 | GO:0090527 | actin filament reorganization(GO:0090527) |
| 1.7 | 3.3 | GO:2000346 | negative regulation of hepatocyte proliferation(GO:2000346) |
| 1.7 | 6.7 | GO:0014053 | negative regulation of gamma-aminobutyric acid secretion(GO:0014053) |
| 1.6 | 31.3 | GO:0001833 | inner cell mass cell proliferation(GO:0001833) |
| 1.6 | 3.3 | GO:0034769 | basement membrane disassembly(GO:0034769) |
| 1.6 | 3.3 | GO:0051454 | pH elevation(GO:0045852) intracellular pH elevation(GO:0051454) |
| 1.6 | 34.5 | GO:0030225 | macrophage differentiation(GO:0030225) |
| 1.6 | 6.5 | GO:0070650 | actin filament bundle distribution(GO:0070650) |
| 1.6 | 6.5 | GO:1990414 | replication-born double-strand break repair via sister chromatid exchange(GO:1990414) |
| 1.6 | 6.5 | GO:0090526 | regulation of gluconeogenesis involved in cellular glucose homeostasis(GO:0090526) |
| 1.6 | 6.5 | GO:0060178 | regulation of exocyst localization(GO:0060178) |
| 1.6 | 3.2 | GO:1905225 | response to thyrotropin-releasing hormone(GO:1905225) |
| 1.6 | 30.7 | GO:0050869 | negative regulation of B cell activation(GO:0050869) |
| 1.6 | 4.8 | GO:0071461 | cellular response to redox state(GO:0071461) |
| 1.6 | 9.7 | GO:0072675 | osteoclast fusion(GO:0072675) |
| 1.6 | 6.4 | GO:1904401 | response to Thyroid stimulating hormone(GO:1904400) cellular response to Thyroid stimulating hormone(GO:1904401) |
| 1.6 | 3.2 | GO:1903849 | regulation of aorta morphogenesis(GO:1903847) positive regulation of aorta morphogenesis(GO:1903849) |
| 1.6 | 4.8 | GO:1901097 | negative regulation of autophagosome maturation(GO:1901097) |
| 1.6 | 14.4 | GO:0033004 | negative regulation of mast cell activation(GO:0033004) |
| 1.6 | 17.6 | GO:2000480 | negative regulation of cAMP-dependent protein kinase activity(GO:2000480) |
| 1.6 | 12.7 | GO:0043249 | erythrocyte maturation(GO:0043249) |
| 1.6 | 3.2 | GO:0046066 | purine deoxyribonucleoside diphosphate metabolic process(GO:0009182) deoxyribonucleoside diphosphate metabolic process(GO:0009186) dGDP metabolic process(GO:0046066) |
| 1.6 | 20.4 | GO:0097284 | hepatocyte apoptotic process(GO:0097284) |
| 1.6 | 14.0 | GO:0060158 | phospholipase C-activating dopamine receptor signaling pathway(GO:0060158) |
| 1.6 | 15.5 | GO:0050855 | regulation of B cell receptor signaling pathway(GO:0050855) |
| 1.5 | 4.6 | GO:2000659 | regulation of interleukin-1-mediated signaling pathway(GO:2000659) |
| 1.5 | 7.7 | GO:0001574 | ganglioside biosynthetic process(GO:0001574) |
| 1.5 | 12.3 | GO:0090267 | positive regulation of spindle checkpoint(GO:0090232) positive regulation of mitotic cell cycle spindle assembly checkpoint(GO:0090267) |
| 1.5 | 3.1 | GO:1901187 | regulation of ephrin receptor signaling pathway(GO:1901187) |
| 1.5 | 12.2 | GO:0018377 | protein myristoylation(GO:0018377) |
| 1.5 | 12.2 | GO:0043383 | negative T cell selection(GO:0043383) |
| 1.5 | 3.0 | GO:2000611 | positive regulation of thyroid hormone generation(GO:2000611) |
| 1.5 | 12.2 | GO:0031848 | protection from non-homologous end joining at telomere(GO:0031848) |
| 1.5 | 1.5 | GO:0072344 | rescue of stalled ribosome(GO:0072344) |
| 1.5 | 16.6 | GO:0071624 | positive regulation of granulocyte chemotaxis(GO:0071624) positive regulation of neutrophil chemotaxis(GO:0090023) |
| 1.5 | 1.5 | GO:0038026 | reelin-mediated signaling pathway(GO:0038026) |
| 1.5 | 17.9 | GO:0006750 | glutathione biosynthetic process(GO:0006750) |
| 1.5 | 3.0 | GO:1905206 | positive regulation of hydrogen peroxide-induced cell death(GO:1905206) |
| 1.5 | 4.5 | GO:0007089 | traversing start control point of mitotic cell cycle(GO:0007089) |
| 1.5 | 7.4 | GO:0007039 | protein catabolic process in the vacuole(GO:0007039) |
| 1.5 | 4.4 | GO:0070384 | growth plate cartilage chondrocyte growth(GO:0003430) Harderian gland development(GO:0070384) |
| 1.5 | 14.8 | GO:0007175 | negative regulation of epidermal growth factor-activated receptor activity(GO:0007175) |
| 1.5 | 35.4 | GO:0006958 | complement activation, classical pathway(GO:0006958) |
| 1.5 | 11.7 | GO:0045602 | negative regulation of endothelial cell differentiation(GO:0045602) |
| 1.5 | 4.4 | GO:0071409 | cellular response to cycloheximide(GO:0071409) |
| 1.5 | 2.9 | GO:0034134 | toll-like receptor 2 signaling pathway(GO:0034134) |
| 1.4 | 1.4 | GO:0032079 | positive regulation of endodeoxyribonuclease activity(GO:0032079) |
| 1.4 | 5.8 | GO:0030210 | heparin biosynthetic process(GO:0030210) |
| 1.4 | 5.8 | GO:1902035 | positive regulation of hematopoietic stem cell proliferation(GO:1902035) |
| 1.4 | 15.8 | GO:0060056 | mammary gland involution(GO:0060056) |
| 1.4 | 5.7 | GO:0070315 | G1 to G0 transition involved in cell differentiation(GO:0070315) |
| 1.4 | 11.4 | GO:0070244 | negative regulation of thymocyte apoptotic process(GO:0070244) |
| 1.4 | 1.4 | GO:0061153 | trachea submucosa development(GO:0061152) trachea gland development(GO:0061153) |
| 1.4 | 5.6 | GO:0002934 | desmosome organization(GO:0002934) |
| 1.4 | 16.6 | GO:0051382 | kinetochore assembly(GO:0051382) |
| 1.4 | 31.8 | GO:0019835 | cytolysis(GO:0019835) |
| 1.4 | 5.5 | GO:0034144 | negative regulation of toll-like receptor 4 signaling pathway(GO:0034144) |
| 1.4 | 8.2 | GO:0070966 | nuclear-transcribed mRNA catabolic process, no-go decay(GO:0070966) |
| 1.4 | 11.0 | GO:0086073 | bundle of His cell-Purkinje myocyte adhesion involved in cell communication(GO:0086073) |
| 1.4 | 16.4 | GO:0060706 | cell differentiation involved in embryonic placenta development(GO:0060706) |
| 1.4 | 9.5 | GO:1900029 | positive regulation of ruffle assembly(GO:1900029) |
| 1.4 | 6.8 | GO:0006297 | nucleotide-excision repair, DNA gap filling(GO:0006297) |
| 1.4 | 1.4 | GO:0002084 | protein depalmitoylation(GO:0002084) |
| 1.4 | 5.4 | GO:0050930 | induction of positive chemotaxis(GO:0050930) |
| 1.4 | 12.2 | GO:0006309 | apoptotic DNA fragmentation(GO:0006309) |
| 1.3 | 6.7 | GO:0014043 | negative regulation of neuron maturation(GO:0014043) |
| 1.3 | 5.4 | GO:0098734 | macromolecule depalmitoylation(GO:0098734) |
| 1.3 | 9.4 | GO:0060312 | regulation of blood vessel remodeling(GO:0060312) |
| 1.3 | 13.3 | GO:0051014 | actin filament severing(GO:0051014) |
| 1.3 | 35.7 | GO:0030033 | microvillus assembly(GO:0030033) |
| 1.3 | 5.3 | GO:0090666 | scaRNA localization to Cajal body(GO:0090666) |
| 1.3 | 7.9 | GO:0061087 | positive regulation of histone H3-K27 methylation(GO:0061087) |
| 1.3 | 9.2 | GO:0006776 | vitamin A metabolic process(GO:0006776) |
| 1.3 | 1.3 | GO:1902809 | regulation of skeletal muscle fiber differentiation(GO:1902809) |
| 1.3 | 31.4 | GO:0042130 | negative regulation of T cell proliferation(GO:0042130) |
| 1.3 | 3.9 | GO:0010626 | negative regulation of Schwann cell proliferation(GO:0010626) |
| 1.3 | 7.8 | GO:0009157 | deoxyribonucleoside monophosphate biosynthetic process(GO:0009157) |
| 1.3 | 3.9 | GO:0038183 | bile acid signaling pathway(GO:0038183) |
| 1.3 | 12.9 | GO:0032287 | peripheral nervous system myelin maintenance(GO:0032287) |
| 1.3 | 16.8 | GO:0034508 | centromere complex assembly(GO:0034508) |
| 1.3 | 2.6 | GO:0021678 | third ventricle development(GO:0021678) |
| 1.3 | 2.6 | GO:0048865 | stem cell fate commitment(GO:0048865) |
| 1.3 | 5.1 | GO:0042346 | positive regulation of NF-kappaB import into nucleus(GO:0042346) |
| 1.3 | 8.9 | GO:0060732 | regulation of inositol phosphate biosynthetic process(GO:0010919) positive regulation of inositol phosphate biosynthetic process(GO:0060732) |
| 1.3 | 55.7 | GO:0050852 | T cell receptor signaling pathway(GO:0050852) |
| 1.3 | 3.8 | GO:0051891 | positive regulation of cardioblast differentiation(GO:0051891) |
| 1.2 | 26.2 | GO:0002279 | mast cell activation involved in immune response(GO:0002279) mast cell degranulation(GO:0043303) |
| 1.2 | 3.7 | GO:2000297 | negative regulation of synapse maturation(GO:2000297) |
| 1.2 | 7.4 | GO:0038203 | TORC2 signaling(GO:0038203) |
| 1.2 | 4.9 | GO:0090009 | primitive streak formation(GO:0090009) |
| 1.2 | 9.8 | GO:0043030 | regulation of macrophage activation(GO:0043030) |
| 1.2 | 10.9 | GO:0045019 | negative regulation of nitric oxide biosynthetic process(GO:0045019) negative regulation of nitric oxide metabolic process(GO:1904406) |
| 1.2 | 2.4 | GO:1903463 | regulation of mitotic cell cycle DNA replication(GO:1903463) |
| 1.2 | 34.0 | GO:0048536 | spleen development(GO:0048536) |
| 1.2 | 4.8 | GO:1903576 | response to L-arginine(GO:1903576) |
| 1.2 | 3.6 | GO:2000857 | positive regulation of mineralocorticoid secretion(GO:2000857) positive regulation of aldosterone secretion(GO:2000860) |
| 1.2 | 3.6 | GO:0010643 | cell communication by chemical coupling(GO:0010643) |
| 1.2 | 22.8 | GO:0060445 | branching involved in salivary gland morphogenesis(GO:0060445) |
| 1.2 | 6.0 | GO:0071918 | urea transmembrane transport(GO:0071918) |
| 1.2 | 4.8 | GO:0046338 | phosphatidylethanolamine catabolic process(GO:0046338) |
| 1.2 | 2.4 | GO:1903984 | positive regulation of TRAIL-activated apoptotic signaling pathway(GO:1903984) |
| 1.2 | 8.2 | GO:0035855 | megakaryocyte development(GO:0035855) |
| 1.2 | 10.6 | GO:0043950 | positive regulation of cAMP-mediated signaling(GO:0043950) |
| 1.2 | 2.3 | GO:1901164 | negative regulation of trophoblast cell migration(GO:1901164) |
| 1.2 | 10.5 | GO:0016576 | histone dephosphorylation(GO:0016576) |
| 1.2 | 2.3 | GO:0075509 | receptor-mediated endocytosis of virus by host cell(GO:0019065) endocytosis involved in viral entry into host cell(GO:0075509) |
| 1.2 | 3.5 | GO:0044209 | AMP salvage(GO:0044209) |
| 1.2 | 1.2 | GO:1900747 | negative regulation of vascular endothelial growth factor signaling pathway(GO:1900747) |
| 1.1 | 17.2 | GO:0048242 | epinephrine secretion(GO:0048242) |
| 1.1 | 13.8 | GO:0050853 | B cell receptor signaling pathway(GO:0050853) |
| 1.1 | 2.3 | GO:0032733 | positive regulation of interleukin-10 production(GO:0032733) |
| 1.1 | 2.3 | GO:0060066 | oviduct development(GO:0060066) |
| 1.1 | 3.4 | GO:0002072 | optic cup morphogenesis involved in camera-type eye development(GO:0002072) |
| 1.1 | 7.9 | GO:0046600 | negative regulation of centriole replication(GO:0046600) |
| 1.1 | 5.6 | GO:0000066 | mitochondrial ornithine transport(GO:0000066) |
| 1.1 | 2.2 | GO:0060856 | establishment of blood-brain barrier(GO:0060856) |
| 1.1 | 6.7 | GO:0061737 | leukotriene signaling pathway(GO:0061737) |
| 1.1 | 2.2 | GO:0006680 | glucosylceramide catabolic process(GO:0006680) |
| 1.1 | 1.1 | GO:0018307 | enzyme active site formation(GO:0018307) |
| 1.1 | 2.2 | GO:2000609 | regulation of thyroid hormone generation(GO:2000609) |
| 1.1 | 2.2 | GO:0060447 | bud outgrowth involved in lung branching(GO:0060447) |
| 1.1 | 4.3 | GO:0090382 | phagosome maturation(GO:0090382) |
| 1.1 | 6.5 | GO:0060480 | lung goblet cell differentiation(GO:0060480) |
| 1.1 | 6.4 | GO:0001842 | neural fold formation(GO:0001842) |
| 1.1 | 2.1 | GO:0061081 | positive regulation of macrophage cytokine production(GO:0060907) positive regulation of myeloid leukocyte cytokine production involved in immune response(GO:0061081) |
| 1.1 | 10.7 | GO:0031274 | positive regulation of pseudopodium assembly(GO:0031274) |
| 1.1 | 2.1 | GO:0070837 | dehydroascorbic acid transport(GO:0070837) |
| 1.1 | 2.1 | GO:0097026 | dendritic cell dendrite assembly(GO:0097026) |
| 1.1 | 4.2 | GO:1900194 | negative regulation of oocyte development(GO:0060283) negative regulation of oocyte maturation(GO:1900194) |
| 1.1 | 4.2 | GO:0007084 | mitotic nuclear envelope reassembly(GO:0007084) |
| 1.1 | 5.3 | GO:0097411 | hypoxia-inducible factor-1alpha signaling pathway(GO:0097411) |
| 1.0 | 4.2 | GO:0046208 | spermine catabolic process(GO:0046208) |
| 1.0 | 16.7 | GO:0006491 | N-glycan processing(GO:0006491) |
| 1.0 | 5.2 | GO:0016095 | polyprenol catabolic process(GO:0016095) |
| 1.0 | 6.2 | GO:0010571 | positive regulation of nuclear cell cycle DNA replication(GO:0010571) |
| 1.0 | 3.1 | GO:0006296 | nucleotide-excision repair, DNA incision, 5'-to lesion(GO:0006296) |
| 1.0 | 4.1 | GO:0071494 | cellular response to UV-C(GO:0071494) |
| 1.0 | 7.1 | GO:1900113 | regulation of histone H3-K9 trimethylation(GO:1900112) negative regulation of histone H3-K9 trimethylation(GO:1900113) |
| 1.0 | 2.0 | GO:0060022 | hard palate development(GO:0060022) |
| 1.0 | 2.0 | GO:0048007 | antigen processing and presentation of lipid antigen via MHC class Ib(GO:0048003) antigen processing and presentation, exogenous lipid antigen via MHC class Ib(GO:0048007) |
| 1.0 | 4.0 | GO:0039689 | negative stranded viral RNA replication(GO:0039689) multi-organism biosynthetic process(GO:0044034) |
| 1.0 | 2.0 | GO:0006701 | progesterone biosynthetic process(GO:0006701) |
| 1.0 | 2.0 | GO:0019884 | antigen processing and presentation of exogenous antigen(GO:0019884) |
| 1.0 | 5.9 | GO:1904117 | cellular response to vasopressin(GO:1904117) |
| 1.0 | 7.9 | GO:0006021 | inositol biosynthetic process(GO:0006021) |
| 1.0 | 1.9 | GO:0097498 | endothelial tube lumen extension(GO:0097498) |
| 1.0 | 2.9 | GO:0070366 | regulation of hepatocyte differentiation(GO:0070366) |
| 1.0 | 5.8 | GO:0071763 | nuclear membrane organization(GO:0071763) |
| 1.0 | 1.9 | GO:0032066 | nucleolus to nucleoplasm transport(GO:0032066) |
| 1.0 | 8.6 | GO:0010040 | response to iron(II) ion(GO:0010040) |
| 1.0 | 6.7 | GO:0042059 | negative regulation of epidermal growth factor receptor signaling pathway(GO:0042059) |
| 0.9 | 3.8 | GO:0010735 | positive regulation of transcription via serum response element binding(GO:0010735) |
| 0.9 | 1.9 | GO:0003431 | growth plate cartilage chondrocyte development(GO:0003431) |
| 0.9 | 3.8 | GO:0045901 | positive regulation of translational elongation(GO:0045901) |
| 0.9 | 1.9 | GO:1904580 | regulation of intracellular mRNA localization(GO:1904580) |
| 0.9 | 5.6 | GO:0042904 | 9-cis-retinoic acid biosynthetic process(GO:0042904) 9-cis-retinoic acid metabolic process(GO:0042905) |
| 0.9 | 6.5 | GO:0010528 | regulation of transposition(GO:0010528) negative regulation of transposition(GO:0010529) |
| 0.9 | 1.9 | GO:0000973 | posttranscriptional tethering of RNA polymerase II gene DNA at nuclear periphery(GO:0000973) |
| 0.9 | 3.7 | GO:0042126 | nitrate metabolic process(GO:0042126) |
| 0.9 | 3.7 | GO:0090403 | oxidative stress-induced premature senescence(GO:0090403) |
| 0.9 | 9.2 | GO:0032509 | endosome transport via multivesicular body sorting pathway(GO:0032509) |
| 0.9 | 4.6 | GO:1904684 | negative regulation of metalloendopeptidase activity(GO:1904684) |
| 0.9 | 2.7 | GO:0006116 | NADH oxidation(GO:0006116) |
| 0.9 | 3.6 | GO:0031017 | exocrine pancreas development(GO:0031017) |
| 0.9 | 2.7 | GO:0046477 | glycosylceramide catabolic process(GO:0046477) |
| 0.9 | 5.4 | GO:0032957 | inositol trisphosphate metabolic process(GO:0032957) |
| 0.9 | 14.5 | GO:0090162 | establishment of epithelial cell polarity(GO:0090162) |
| 0.9 | 2.7 | GO:0097491 | trunk segmentation(GO:0035290) trunk neural crest cell migration(GO:0036484) ventral trunk neural crest cell migration(GO:0036486) sympathetic neuron projection extension(GO:0097490) sympathetic neuron projection guidance(GO:0097491) |
| 0.9 | 8.9 | GO:0007076 | mitotic chromosome condensation(GO:0007076) |
| 0.9 | 4.4 | GO:2000232 | regulation of rRNA processing(GO:2000232) |
| 0.9 | 14.2 | GO:0000185 | activation of MAPKKK activity(GO:0000185) |
| 0.9 | 1.8 | GO:1904994 | regulation of leukocyte adhesion to vascular endothelial cell(GO:1904994) |
| 0.9 | 2.6 | GO:1903225 | negative regulation of endodermal cell differentiation(GO:1903225) |
| 0.9 | 5.2 | GO:0002755 | MyD88-dependent toll-like receptor signaling pathway(GO:0002755) |
| 0.9 | 6.1 | GO:0043686 | co-translational protein modification(GO:0043686) |
| 0.9 | 1.7 | GO:0034444 | plasma lipoprotein particle oxidation(GO:0034441) regulation of plasma lipoprotein particle oxidation(GO:0034444) negative regulation of plasma lipoprotein particle oxidation(GO:0034445) |
| 0.9 | 3.5 | GO:0006369 | termination of RNA polymerase II transcription(GO:0006369) |
| 0.9 | 2.6 | GO:1902748 | melanocyte migration(GO:0097324) positive regulation of lens fiber cell differentiation(GO:1902748) |
| 0.9 | 2.6 | GO:0021571 | rhombomere 4 development(GO:0021570) rhombomere 5 development(GO:0021571) |
| 0.9 | 2.6 | GO:0001880 | Mullerian duct regression(GO:0001880) |
| 0.9 | 1.7 | GO:0003419 | growth plate cartilage chondrocyte proliferation(GO:0003419) |
| 0.9 | 8.5 | GO:0006012 | galactose metabolic process(GO:0006012) |
| 0.8 | 2.5 | GO:0030422 | production of siRNA involved in RNA interference(GO:0030422) |
| 0.8 | 6.8 | GO:0070253 | somatostatin secretion(GO:0070253) |
| 0.8 | 0.8 | GO:0060789 | hair follicle placode formation(GO:0060789) |
| 0.8 | 0.8 | GO:0045629 | negative regulation of T-helper 2 cell differentiation(GO:0045629) |
| 0.8 | 22.6 | GO:1902042 | negative regulation of extrinsic apoptotic signaling pathway via death domain receptors(GO:1902042) |
| 0.8 | 5.0 | GO:0090080 | positive regulation of MAPKKK cascade by fibroblast growth factor receptor signaling pathway(GO:0090080) |
| 0.8 | 26.7 | GO:0035428 | hexose transmembrane transport(GO:0035428) glucose transmembrane transport(GO:1904659) |
| 0.8 | 3.3 | GO:0070493 | thrombin receptor signaling pathway(GO:0070493) |
| 0.8 | 1.7 | GO:0006824 | cobalt ion transport(GO:0006824) |
| 0.8 | 5.8 | GO:0071481 | cellular response to X-ray(GO:0071481) |
| 0.8 | 4.1 | GO:0016557 | peroxisome membrane biogenesis(GO:0016557) |
| 0.8 | 2.5 | GO:0097010 | eukaryotic translation initiation factor 4F complex assembly(GO:0097010) |
| 0.8 | 7.4 | GO:0042347 | negative regulation of NF-kappaB import into nucleus(GO:0042347) |
| 0.8 | 2.5 | GO:2000813 | actin filament uncapping(GO:0051695) negative regulation of barbed-end actin filament capping(GO:2000813) |
| 0.8 | 31.8 | GO:0050715 | positive regulation of cytokine secretion(GO:0050715) |
| 0.8 | 5.7 | GO:0071377 | cellular response to glucagon stimulus(GO:0071377) |
| 0.8 | 13.7 | GO:0048333 | mesodermal cell differentiation(GO:0048333) |
| 0.8 | 3.2 | GO:0021769 | orbitofrontal cortex development(GO:0021769) |
| 0.8 | 5.6 | GO:0036297 | interstrand cross-link repair(GO:0036297) |
| 0.8 | 6.4 | GO:1900264 | regulation of DNA-directed DNA polymerase activity(GO:1900262) positive regulation of DNA-directed DNA polymerase activity(GO:1900264) |
| 0.8 | 3.2 | GO:0043137 | DNA replication, removal of RNA primer(GO:0043137) |
| 0.8 | 12.0 | GO:2000772 | regulation of cellular senescence(GO:2000772) |
| 0.8 | 11.1 | GO:1902041 | regulation of extrinsic apoptotic signaling pathway via death domain receptors(GO:1902041) |
| 0.8 | 4.7 | GO:0006449 | regulation of translational termination(GO:0006449) |
| 0.8 | 11.8 | GO:0008272 | sulfate transport(GO:0008272) sulfate transmembrane transport(GO:1902358) |
| 0.8 | 3.9 | GO:0031580 | membrane raft polarization(GO:0001766) membrane raft distribution(GO:0031580) |
| 0.8 | 3.1 | GO:0070317 | negative regulation of G0 to G1 transition(GO:0070317) |
| 0.8 | 1.6 | GO:0071034 | CUT catabolic process(GO:0071034) CUT metabolic process(GO:0071043) |
| 0.8 | 2.3 | GO:0030208 | dermatan sulfate biosynthetic process(GO:0030208) |
| 0.8 | 1.5 | GO:1904098 | regulation of protein O-linked glycosylation(GO:1904098) positive regulation of protein O-linked glycosylation(GO:1904100) |
| 0.8 | 3.1 | GO:0032571 | response to vitamin K(GO:0032571) |
| 0.8 | 15.3 | GO:0071467 | cellular response to pH(GO:0071467) |
| 0.8 | 1.5 | GO:0050651 | dermatan sulfate proteoglycan biosynthetic process(GO:0050651) |
| 0.8 | 4.5 | GO:1902410 | mitotic cytokinetic process(GO:1902410) |
| 0.8 | 20.3 | GO:0001954 | positive regulation of cell-matrix adhesion(GO:0001954) |
| 0.8 | 8.3 | GO:0010663 | positive regulation of striated muscle cell apoptotic process(GO:0010663) positive regulation of cardiac muscle cell apoptotic process(GO:0010666) |
| 0.7 | 6.7 | GO:0043518 | negative regulation of DNA damage response, signal transduction by p53 class mediator(GO:0043518) |
| 0.7 | 12.7 | GO:0006884 | cell volume homeostasis(GO:0006884) |
| 0.7 | 25.3 | GO:0070527 | platelet aggregation(GO:0070527) |
| 0.7 | 8.1 | GO:0006003 | fructose 2,6-bisphosphate metabolic process(GO:0006003) |
| 0.7 | 5.8 | GO:0006620 | posttranslational protein targeting to membrane(GO:0006620) |
| 0.7 | 2.9 | GO:0032466 | negative regulation of cytokinesis(GO:0032466) |
| 0.7 | 3.6 | GO:0015889 | cobalamin transport(GO:0015889) |
| 0.7 | 2.9 | GO:0060391 | positive regulation of SMAD protein import into nucleus(GO:0060391) |
| 0.7 | 2.2 | GO:0035964 | COPI-coated vesicle budding(GO:0035964) |
| 0.7 | 10.8 | GO:0035590 | purinergic nucleotide receptor signaling pathway(GO:0035590) |
| 0.7 | 4.3 | GO:1905216 | positive regulation of RNA binding(GO:1905216) |
| 0.7 | 3.6 | GO:0070973 | protein localization to endoplasmic reticulum exit site(GO:0070973) |
| 0.7 | 3.5 | GO:0045110 | intermediate filament bundle assembly(GO:0045110) |
| 0.7 | 16.9 | GO:0006879 | cellular iron ion homeostasis(GO:0006879) |
| 0.7 | 7.0 | GO:0048733 | sebaceous gland development(GO:0048733) |
| 0.7 | 4.9 | GO:1902414 | protein localization to cell junction(GO:1902414) |
| 0.7 | 2.8 | GO:0042148 | strand invasion(GO:0042148) |
| 0.7 | 2.8 | GO:0032823 | regulation of natural killer cell differentiation(GO:0032823) |
| 0.7 | 8.2 | GO:0034063 | stress granule assembly(GO:0034063) |
| 0.7 | 3.4 | GO:2000696 | regulation of epithelial cell differentiation involved in kidney development(GO:2000696) |
| 0.7 | 4.0 | GO:0010138 | pyrimidine ribonucleotide salvage(GO:0010138) pyrimidine nucleotide salvage(GO:0032262) UMP salvage(GO:0044206) |
| 0.7 | 7.4 | GO:0030947 | regulation of vascular endothelial growth factor receptor signaling pathway(GO:0030947) |
| 0.7 | 6.7 | GO:0032060 | bleb assembly(GO:0032060) |
| 0.7 | 2.0 | GO:0036066 | protein O-linked fucosylation(GO:0036066) |
| 0.7 | 7.3 | GO:0051292 | nuclear pore complex assembly(GO:0051292) |
| 0.7 | 6.0 | GO:0052697 | xenobiotic glucuronidation(GO:0052697) |
| 0.7 | 2.0 | GO:0032532 | regulation of microvillus organization(GO:0032530) regulation of microvillus length(GO:0032532) |
| 0.7 | 3.3 | GO:1903427 | negative regulation of reactive oxygen species biosynthetic process(GO:1903427) |
| 0.7 | 4.6 | GO:0051661 | maintenance of centrosome location(GO:0051661) |
| 0.7 | 2.0 | GO:0030824 | negative regulation of cGMP metabolic process(GO:0030824) |
| 0.7 | 4.6 | GO:0033523 | histone H2B ubiquitination(GO:0033523) |
| 0.7 | 7.2 | GO:0034720 | histone H3-K4 demethylation(GO:0034720) |
| 0.7 | 3.3 | GO:0043970 | histone H3-K9 acetylation(GO:0043970) |
| 0.6 | 7.1 | GO:0006911 | phagocytosis, engulfment(GO:0006911) |
| 0.6 | 4.5 | GO:0045048 | protein insertion into ER membrane(GO:0045048) |
| 0.6 | 4.5 | GO:2000352 | negative regulation of endothelial cell apoptotic process(GO:2000352) |
| 0.6 | 0.6 | GO:1903764 | regulation of potassium ion export across plasma membrane(GO:1903764) |
| 0.6 | 0.6 | GO:0042369 | vitamin D catabolic process(GO:0042369) |
| 0.6 | 5.7 | GO:0006283 | transcription-coupled nucleotide-excision repair(GO:0006283) |
| 0.6 | 1.3 | GO:1903406 | regulation of sodium:potassium-exchanging ATPase activity(GO:1903406) |
| 0.6 | 1.3 | GO:0033133 | positive regulation of glucokinase activity(GO:0033133) positive regulation of hexokinase activity(GO:1903301) |
| 0.6 | 5.7 | GO:0046501 | protoporphyrinogen IX metabolic process(GO:0046501) |
| 0.6 | 5.5 | GO:0007023 | post-chaperonin tubulin folding pathway(GO:0007023) |
| 0.6 | 2.5 | GO:0072553 | terminal button organization(GO:0072553) |
| 0.6 | 3.7 | GO:0072718 | response to cisplatin(GO:0072718) |
| 0.6 | 8.5 | GO:0000076 | DNA replication checkpoint(GO:0000076) |
| 0.6 | 1.8 | GO:1902856 | negative regulation of nonmotile primary cilium assembly(GO:1902856) |
| 0.6 | 12.5 | GO:0045332 | phospholipid translocation(GO:0045332) |
| 0.6 | 2.4 | GO:2000404 | regulation of T cell migration(GO:2000404) |
| 0.6 | 2.4 | GO:0070940 | dephosphorylation of RNA polymerase II C-terminal domain(GO:0070940) |
| 0.6 | 4.7 | GO:0019800 | peptide cross-linking via chondroitin 4-sulfate glycosaminoglycan(GO:0019800) |
| 0.6 | 8.2 | GO:0051307 | meiotic chromosome separation(GO:0051307) |
| 0.6 | 6.4 | GO:1900048 | positive regulation of blood coagulation(GO:0030194) positive regulation of hemostasis(GO:1900048) |
| 0.6 | 1.7 | GO:0071529 | cementum mineralization(GO:0071529) |
| 0.6 | 1.7 | GO:0010825 | positive regulation of centrosome duplication(GO:0010825) |
| 0.6 | 1.7 | GO:0019805 | quinolinate biosynthetic process(GO:0019805) |
| 0.6 | 2.3 | GO:0045059 | positive thymic T cell selection(GO:0045059) |
| 0.6 | 7.9 | GO:0050732 | negative regulation of peptidyl-tyrosine phosphorylation(GO:0050732) |
| 0.6 | 1.1 | GO:0072071 | kidney interstitial fibroblast differentiation(GO:0072071) renal interstitial fibroblast development(GO:0072141) |
| 0.6 | 2.8 | GO:0071684 | blastocyst hatching(GO:0001835) hatching(GO:0035188) organism emergence from protective structure(GO:0071684) |
| 0.6 | 6.6 | GO:1990118 | sodium ion import across plasma membrane(GO:0098719) sodium ion import into cell(GO:1990118) |
| 0.6 | 4.4 | GO:1900424 | regulation of defense response to bacterium(GO:1900424) |
| 0.6 | 1.7 | GO:0034427 | nuclear-transcribed mRNA catabolic process, exonucleolytic, 3'-5'(GO:0034427) |
| 0.5 | 2.2 | GO:0030262 | apoptotic nuclear changes(GO:0030262) |
| 0.5 | 4.9 | GO:0046485 | ether lipid metabolic process(GO:0046485) |
| 0.5 | 1.6 | GO:0019046 | viral latency(GO:0019042) release from viral latency(GO:0019046) |
| 0.5 | 1.6 | GO:0071027 | RNA surveillance(GO:0071025) nuclear RNA surveillance(GO:0071027) nuclear mRNA surveillance(GO:0071028) |
| 0.5 | 7.1 | GO:0010761 | fibroblast migration(GO:0010761) |
| 0.5 | 2.2 | GO:0002101 | tRNA wobble cytosine modification(GO:0002101) |
| 0.5 | 0.5 | GO:1904908 | negative regulation of maintenance of sister chromatid cohesion(GO:0034092) negative regulation of maintenance of mitotic sister chromatid cohesion(GO:0034183) maintenance of mitotic sister chromatid cohesion, telomeric(GO:0099403) mitotic sister chromatid cohesion, telomeric(GO:0099404) regulation of maintenance of mitotic sister chromatid cohesion, telomeric(GO:1904907) negative regulation of maintenance of mitotic sister chromatid cohesion, telomeric(GO:1904908) |
| 0.5 | 3.8 | GO:0010891 | negative regulation of sequestering of triglyceride(GO:0010891) |
| 0.5 | 6.5 | GO:0001913 | T cell mediated cytotoxicity(GO:0001913) |
| 0.5 | 4.8 | GO:0035909 | aorta morphogenesis(GO:0035909) |
| 0.5 | 5.4 | GO:0046784 | viral mRNA export from host cell nucleus(GO:0046784) |
| 0.5 | 3.8 | GO:0048757 | endosome to melanosome transport(GO:0035646) pigment accumulation(GO:0043476) cellular pigment accumulation(GO:0043482) endosome to pigment granule transport(GO:0043485) pigment granule maturation(GO:0048757) |
| 0.5 | 3.2 | GO:0034724 | DNA replication-independent nucleosome organization(GO:0034724) |
| 0.5 | 3.7 | GO:0019511 | peptidyl-proline hydroxylation(GO:0019511) |
| 0.5 | 4.8 | GO:0033003 | regulation of mast cell activation(GO:0033003) |
| 0.5 | 4.2 | GO:0000395 | mRNA 5'-splice site recognition(GO:0000395) |
| 0.5 | 3.7 | GO:0035879 | plasma membrane lactate transport(GO:0035879) |
| 0.5 | 23.2 | GO:0014065 | phosphatidylinositol 3-kinase signaling(GO:0014065) |
| 0.5 | 7.8 | GO:0015701 | bicarbonate transport(GO:0015701) |
| 0.5 | 1.6 | GO:0002803 | positive regulation of antimicrobial peptide production(GO:0002225) positive regulation of antimicrobial humoral response(GO:0002760) positive regulation of antibacterial peptide production(GO:0002803) |
| 0.5 | 3.6 | GO:0072364 | regulation of cellular ketone metabolic process by regulation of transcription from RNA polymerase II promoter(GO:0072364) |
| 0.5 | 4.1 | GO:0070831 | basement membrane assembly(GO:0070831) |
| 0.5 | 1.0 | GO:1990823 | response to leukemia inhibitory factor(GO:1990823) cellular response to leukemia inhibitory factor(GO:1990830) |
| 0.5 | 2.0 | GO:0048845 | venous blood vessel morphogenesis(GO:0048845) |
| 0.5 | 1.5 | GO:0002360 | T cell lineage commitment(GO:0002360) |
| 0.5 | 8.1 | GO:0097503 | sialylation(GO:0097503) |
| 0.5 | 2.5 | GO:0070886 | positive regulation of calcineurin-NFAT signaling cascade(GO:0070886) |
| 0.5 | 5.0 | GO:0000920 | cell separation after cytokinesis(GO:0000920) |
| 0.5 | 2.0 | GO:0010990 | regulation of SMAD protein complex assembly(GO:0010990) negative regulation of SMAD protein complex assembly(GO:0010991) |
| 0.5 | 3.5 | GO:0006621 | protein retention in ER lumen(GO:0006621) |
| 0.5 | 1.5 | GO:0042732 | D-xylose metabolic process(GO:0042732) |
| 0.5 | 2.0 | GO:0033227 | dsRNA transport(GO:0033227) |
| 0.5 | 4.5 | GO:1901739 | regulation of myoblast fusion(GO:1901739) positive regulation of myoblast fusion(GO:1901741) |
| 0.5 | 1.0 | GO:1904502 | lipophagy(GO:0061724) regulation of lipophagy(GO:1904502) positive regulation of lipophagy(GO:1904504) |
| 0.5 | 1.9 | GO:0051988 | regulation of attachment of spindle microtubules to kinetochore(GO:0051988) |
| 0.5 | 12.5 | GO:0006356 | regulation of transcription from RNA polymerase I promoter(GO:0006356) |
| 0.5 | 3.8 | GO:0001778 | plasma membrane repair(GO:0001778) |
| 0.5 | 1.0 | GO:0001828 | inner cell mass cellular morphogenesis(GO:0001828) |
| 0.5 | 10.0 | GO:0035458 | cellular response to interferon-beta(GO:0035458) |
| 0.5 | 6.7 | GO:0030851 | granulocyte differentiation(GO:0030851) |
| 0.5 | 2.8 | GO:0098535 | de novo centriole assembly(GO:0098535) |
| 0.5 | 3.7 | GO:0051085 | chaperone mediated protein folding requiring cofactor(GO:0051085) |
| 0.5 | 1.9 | GO:0031584 | activation of phospholipase D activity(GO:0031584) |
| 0.5 | 2.8 | GO:0042758 | long-chain fatty acid catabolic process(GO:0042758) |
| 0.5 | 8.8 | GO:0033077 | T cell differentiation in thymus(GO:0033077) thymocyte aggregation(GO:0071594) |
| 0.5 | 1.4 | GO:0030576 | Cajal body organization(GO:0030576) |
| 0.5 | 2.8 | GO:1990928 | response to amino acid starvation(GO:1990928) |
| 0.5 | 3.2 | GO:0001554 | luteolysis(GO:0001554) |
| 0.5 | 0.9 | GO:2001038 | regulation of cellular response to drug(GO:2001038) |
| 0.5 | 1.8 | GO:0002230 | positive regulation of defense response to virus by host(GO:0002230) |
| 0.5 | 21.2 | GO:0006909 | phagocytosis(GO:0006909) |
| 0.4 | 0.9 | GO:0034349 | glial cell apoptotic process(GO:0034349) |
| 0.4 | 5.8 | GO:0002377 | immunoglobulin production(GO:0002377) |
| 0.4 | 1.3 | GO:0035521 | monoubiquitinated histone deubiquitination(GO:0035521) monoubiquitinated histone H2A deubiquitination(GO:0035522) |
| 0.4 | 5.7 | GO:0006895 | Golgi to endosome transport(GO:0006895) |
| 0.4 | 1.3 | GO:0038128 | ERBB2 signaling pathway(GO:0038128) |
| 0.4 | 2.2 | GO:2000323 | negative regulation of glucocorticoid receptor signaling pathway(GO:2000323) |
| 0.4 | 1.7 | GO:1990416 | cellular response to brain-derived neurotrophic factor stimulus(GO:1990416) |
| 0.4 | 2.2 | GO:0060914 | heart formation(GO:0060914) |
| 0.4 | 5.2 | GO:0006308 | DNA catabolic process(GO:0006308) |
| 0.4 | 1.3 | GO:0039534 | negative regulation of MDA-5 signaling pathway(GO:0039534) |
| 0.4 | 15.1 | GO:0048260 | positive regulation of receptor-mediated endocytosis(GO:0048260) |
| 0.4 | 3.9 | GO:0006654 | phosphatidic acid biosynthetic process(GO:0006654) |
| 0.4 | 11.5 | GO:0034723 | DNA replication-dependent nucleosome assembly(GO:0006335) DNA replication-dependent nucleosome organization(GO:0034723) |
| 0.4 | 2.5 | GO:0046541 | saliva secretion(GO:0046541) |
| 0.4 | 1.3 | GO:0046333 | octopamine biosynthetic process(GO:0006589) octopamine metabolic process(GO:0046333) |
| 0.4 | 5.8 | GO:0001953 | negative regulation of cell-matrix adhesion(GO:0001953) |
| 0.4 | 3.7 | GO:0071459 | protein localization to chromosome, centromeric region(GO:0071459) |
| 0.4 | 22.9 | GO:0002250 | adaptive immune response(GO:0002250) |
| 0.4 | 1.6 | GO:1904751 | positive regulation of protein localization to nucleolus(GO:1904751) |
| 0.4 | 6.9 | GO:0008631 | intrinsic apoptotic signaling pathway in response to oxidative stress(GO:0008631) |
| 0.4 | 2.8 | GO:0002675 | positive regulation of acute inflammatory response(GO:0002675) |
| 0.4 | 0.4 | GO:0034204 | lipid translocation(GO:0034204) |
| 0.4 | 0.8 | GO:0021797 | forebrain anterior/posterior pattern specification(GO:0021797) |
| 0.4 | 3.9 | GO:0050434 | positive regulation of viral transcription(GO:0050434) |
| 0.4 | 2.7 | GO:0035520 | monoubiquitinated protein deubiquitination(GO:0035520) |
| 0.4 | 7.3 | GO:0016180 | snRNA processing(GO:0016180) |
| 0.4 | 1.5 | GO:0006999 | nuclear pore organization(GO:0006999) |
| 0.4 | 9.6 | GO:0055072 | iron ion homeostasis(GO:0055072) |
| 0.4 | 1.5 | GO:1903525 | regulation of membrane tubulation(GO:1903525) positive regulation of membrane tubulation(GO:1903527) |
| 0.4 | 2.7 | GO:0014886 | transition between slow and fast fiber(GO:0014886) |
| 0.4 | 2.6 | GO:0035542 | regulation of SNARE complex assembly(GO:0035542) |
| 0.4 | 2.6 | GO:0050427 | purine ribonucleoside bisphosphate metabolic process(GO:0034035) 3'-phosphoadenosine 5'-phosphosulfate metabolic process(GO:0050427) |
| 0.4 | 4.5 | GO:0060037 | pharyngeal system development(GO:0060037) |
| 0.4 | 1.1 | GO:0001832 | blastocyst growth(GO:0001832) |
| 0.4 | 0.4 | GO:0090091 | positive regulation of extracellular matrix disassembly(GO:0090091) |
| 0.4 | 9.3 | GO:0009395 | phospholipid catabolic process(GO:0009395) |
| 0.4 | 3.0 | GO:0019471 | 4-hydroxyproline metabolic process(GO:0019471) |
| 0.4 | 5.9 | GO:0070830 | bicellular tight junction assembly(GO:0070830) |
| 0.4 | 1.1 | GO:0006532 | aspartate biosynthetic process(GO:0006532) |
| 0.4 | 16.2 | GO:0006611 | protein export from nucleus(GO:0006611) |
| 0.4 | 2.2 | GO:2000249 | regulation of actin cytoskeleton reorganization(GO:2000249) |
| 0.4 | 1.8 | GO:1904424 | regulation of GTP binding(GO:1904424) |
| 0.4 | 1.4 | GO:0072709 | cellular response to sorbitol(GO:0072709) |
| 0.4 | 3.6 | GO:0030259 | lipid glycosylation(GO:0030259) |
| 0.4 | 0.7 | GO:0016078 | tRNA catabolic process(GO:0016078) |
| 0.4 | 2.1 | GO:0051418 | interphase microtubule nucleation by interphase microtubule organizing center(GO:0051415) microtubule nucleation by microtubule organizing center(GO:0051418) |
| 0.3 | 1.7 | GO:0050729 | positive regulation of inflammatory response(GO:0050729) |
| 0.3 | 0.3 | GO:0032058 | positive regulation of translational initiation in response to stress(GO:0032058) |
| 0.3 | 1.0 | GO:0090158 | endoplasmic reticulum membrane organization(GO:0090158) |
| 0.3 | 1.0 | GO:0016240 | autophagosome docking(GO:0016240) |
| 0.3 | 2.0 | GO:0071374 | cellular response to parathyroid hormone stimulus(GO:0071374) |
| 0.3 | 3.3 | GO:0033235 | positive regulation of protein sumoylation(GO:0033235) |
| 0.3 | 1.7 | GO:0042023 | regulation of DNA endoreduplication(GO:0032875) negative regulation of DNA endoreduplication(GO:0032876) DNA endoreduplication(GO:0042023) |
| 0.3 | 1.7 | GO:0042487 | regulation of odontogenesis of dentin-containing tooth(GO:0042487) |
| 0.3 | 2.0 | GO:0045648 | positive regulation of erythrocyte differentiation(GO:0045648) |
| 0.3 | 7.2 | GO:0090280 | positive regulation of calcium ion import(GO:0090280) |
| 0.3 | 2.9 | GO:0031936 | negative regulation of chromatin silencing(GO:0031936) |
| 0.3 | 2.0 | GO:0033601 | positive regulation of mammary gland epithelial cell proliferation(GO:0033601) |
| 0.3 | 1.3 | GO:0008355 | olfactory learning(GO:0008355) |
| 0.3 | 1.6 | GO:0090129 | positive regulation of synapse maturation(GO:0090129) |
| 0.3 | 10.7 | GO:0000387 | spliceosomal snRNP assembly(GO:0000387) |
| 0.3 | 1.6 | GO:0038170 | somatostatin receptor signaling pathway(GO:0038169) somatostatin signaling pathway(GO:0038170) |
| 0.3 | 3.5 | GO:0016339 | calcium-dependent cell-cell adhesion via plasma membrane cell adhesion molecules(GO:0016339) |
| 0.3 | 1.9 | GO:1903361 | protein localization to basolateral plasma membrane(GO:1903361) |
| 0.3 | 1.3 | GO:0060454 | positive regulation of gastric acid secretion(GO:0060454) |
| 0.3 | 3.5 | GO:0034340 | response to type I interferon(GO:0034340) |
| 0.3 | 0.9 | GO:0036367 | adaptation of rhodopsin mediated signaling(GO:0016062) light adaption(GO:0036367) |
| 0.3 | 1.9 | GO:0043456 | regulation of pentose-phosphate shunt(GO:0043456) |
| 0.3 | 4.9 | GO:0060294 | cilium movement involved in cell motility(GO:0060294) |
| 0.3 | 0.9 | GO:0006346 | methylation-dependent chromatin silencing(GO:0006346) |
| 0.3 | 2.7 | GO:0070266 | necroptotic process(GO:0070266) |
| 0.3 | 0.6 | GO:2000078 | positive regulation of type B pancreatic cell development(GO:2000078) |
| 0.3 | 0.9 | GO:1901550 | regulation of endothelial cell development(GO:1901550) regulation of establishment of endothelial barrier(GO:1903140) |
| 0.3 | 0.9 | GO:0090038 | negative regulation of protein kinase C signaling(GO:0090038) |
| 0.3 | 5.3 | GO:0002260 | lymphocyte homeostasis(GO:0002260) |
| 0.3 | 2.9 | GO:0097435 | fibril organization(GO:0097435) |
| 0.3 | 6.1 | GO:0000281 | mitotic cytokinesis(GO:0000281) |
| 0.3 | 2.0 | GO:0002430 | complement receptor mediated signaling pathway(GO:0002430) |
| 0.3 | 9.5 | GO:0001706 | endoderm formation(GO:0001706) |
| 0.3 | 1.4 | GO:0009299 | mRNA transcription(GO:0009299) |
| 0.3 | 4.8 | GO:2000273 | positive regulation of receptor activity(GO:2000273) |
| 0.3 | 2.5 | GO:0043402 | glucocorticoid mediated signaling pathway(GO:0043402) |
| 0.3 | 0.8 | GO:0046167 | glycerol-3-phosphate biosynthetic process(GO:0046167) |
| 0.3 | 7.2 | GO:0007032 | endosome organization(GO:0007032) |
| 0.3 | 2.5 | GO:0072531 | pyrimidine-containing compound transmembrane transport(GO:0072531) |
| 0.3 | 4.0 | GO:0061098 | positive regulation of protein tyrosine kinase activity(GO:0061098) |
| 0.3 | 7.5 | GO:0042771 | intrinsic apoptotic signaling pathway in response to DNA damage by p53 class mediator(GO:0042771) |
| 0.3 | 0.8 | GO:0097298 | regulation of nucleus size(GO:0097298) |
| 0.3 | 5.3 | GO:0034453 | microtubule anchoring(GO:0034453) |
| 0.3 | 5.3 | GO:0019882 | antigen processing and presentation(GO:0019882) |
| 0.3 | 0.8 | GO:0046060 | dATP metabolic process(GO:0046060) |
| 0.3 | 1.9 | GO:0003376 | sphingosine-1-phosphate signaling pathway(GO:0003376) |
| 0.3 | 1.8 | GO:0050868 | negative regulation of T cell activation(GO:0050868) |
| 0.3 | 2.1 | GO:0021957 | corticospinal tract morphogenesis(GO:0021957) |
| 0.3 | 0.5 | GO:0042938 | dipeptide transport(GO:0042938) |
| 0.3 | 0.8 | GO:1902109 | negative regulation of mitochondrial membrane permeability involved in apoptotic process(GO:1902109) |
| 0.3 | 2.3 | GO:0051151 | negative regulation of smooth muscle cell differentiation(GO:0051151) |
| 0.3 | 2.0 | GO:0043516 | regulation of DNA damage response, signal transduction by p53 class mediator(GO:0043516) |
| 0.3 | 1.3 | GO:0033353 | S-adenosylmethionine cycle(GO:0033353) |
| 0.3 | 0.5 | GO:0002407 | dendritic cell chemotaxis(GO:0002407) |
| 0.3 | 1.0 | GO:0070874 | glucagon secretion(GO:0070091) regulation of glucagon secretion(GO:0070092) negative regulation of glycogen metabolic process(GO:0070874) |
| 0.2 | 2.4 | GO:0006777 | Mo-molybdopterin cofactor biosynthetic process(GO:0006777) Mo-molybdopterin cofactor metabolic process(GO:0019720) |
| 0.2 | 2.0 | GO:0030206 | chondroitin sulfate biosynthetic process(GO:0030206) |
| 0.2 | 0.7 | GO:0031053 | primary miRNA processing(GO:0031053) |
| 0.2 | 0.7 | GO:0032516 | positive regulation of phosphoprotein phosphatase activity(GO:0032516) |
| 0.2 | 1.6 | GO:0008608 | attachment of spindle microtubules to kinetochore(GO:0008608) |
| 0.2 | 3.0 | GO:0048026 | positive regulation of mRNA splicing, via spliceosome(GO:0048026) |
| 0.2 | 0.7 | GO:0098749 | cerebellar neuron development(GO:0098749) |
| 0.2 | 3.2 | GO:0044786 | cell cycle DNA replication(GO:0044786) |
| 0.2 | 8.6 | GO:0000381 | regulation of alternative mRNA splicing, via spliceosome(GO:0000381) |
| 0.2 | 0.4 | GO:0030214 | hyaluronan catabolic process(GO:0030214) |
| 0.2 | 3.6 | GO:0006303 | double-strand break repair via nonhomologous end joining(GO:0006303) |
| 0.2 | 0.2 | GO:0071360 | cellular response to exogenous dsRNA(GO:0071360) |
| 0.2 | 2.9 | GO:0001958 | endochondral ossification(GO:0001958) replacement ossification(GO:0036075) |
| 0.2 | 1.7 | GO:0005981 | regulation of glycogen catabolic process(GO:0005981) |
| 0.2 | 1.7 | GO:0006068 | ethanol catabolic process(GO:0006068) |
| 0.2 | 8.8 | GO:0030032 | lamellipodium assembly(GO:0030032) |
| 0.2 | 1.3 | GO:0016255 | attachment of GPI anchor to protein(GO:0016255) |
| 0.2 | 2.5 | GO:0032400 | melanosome localization(GO:0032400) |
| 0.2 | 3.4 | GO:0061003 | positive regulation of dendritic spine morphogenesis(GO:0061003) |
| 0.2 | 7.4 | GO:0030838 | positive regulation of actin filament polymerization(GO:0030838) |
| 0.2 | 0.6 | GO:1903966 | monounsaturated fatty acid metabolic process(GO:1903964) monounsaturated fatty acid biosynthetic process(GO:1903966) |
| 0.2 | 1.0 | GO:0072015 | glomerular visceral epithelial cell development(GO:0072015) glomerular epithelial cell development(GO:0072310) |
| 0.2 | 4.6 | GO:0060046 | regulation of acrosome reaction(GO:0060046) |
| 0.2 | 1.0 | GO:0009298 | GDP-mannose biosynthetic process(GO:0009298) |
| 0.2 | 1.8 | GO:0006783 | heme biosynthetic process(GO:0006783) |
| 0.2 | 6.1 | GO:0032094 | response to food(GO:0032094) |
| 0.2 | 2.2 | GO:0006388 | tRNA splicing, via endonucleolytic cleavage and ligation(GO:0006388) |
| 0.2 | 0.4 | GO:0034145 | positive regulation of toll-like receptor 4 signaling pathway(GO:0034145) |
| 0.2 | 9.0 | GO:0002181 | cytoplasmic translation(GO:0002181) |
| 0.2 | 1.4 | GO:0010165 | response to X-ray(GO:0010165) |
| 0.2 | 6.4 | GO:0043966 | histone H3 acetylation(GO:0043966) |
| 0.2 | 2.1 | GO:0007406 | negative regulation of neuroblast proliferation(GO:0007406) |
| 0.2 | 0.8 | GO:0006662 | glycerol ether metabolic process(GO:0006662) |
| 0.2 | 1.1 | GO:0098789 | pre-mRNA cleavage required for polyadenylation(GO:0098789) |
| 0.2 | 1.9 | GO:0000447 | endonucleolytic cleavage in ITS1 to separate SSU-rRNA from 5.8S rRNA and LSU-rRNA from tricistronic rRNA transcript (SSU-rRNA, 5.8S rRNA, LSU-rRNA)(GO:0000447) |
| 0.2 | 0.8 | GO:0030579 | ubiquitin-dependent SMAD protein catabolic process(GO:0030579) |
| 0.2 | 2.2 | GO:0010390 | histone monoubiquitination(GO:0010390) |
| 0.2 | 0.6 | GO:0046380 | N-acetylglucosamine biosynthetic process(GO:0006045) N-acetylneuraminate biosynthetic process(GO:0046380) glucosamine-containing compound biosynthetic process(GO:1901073) |
| 0.2 | 0.9 | GO:0090367 | regulation of mRNA modification(GO:0090365) negative regulation of mRNA modification(GO:0090367) |
| 0.2 | 3.0 | GO:1902235 | regulation of endoplasmic reticulum stress-induced intrinsic apoptotic signaling pathway(GO:1902235) |
| 0.2 | 0.7 | GO:0060050 | positive regulation of protein glycosylation(GO:0060050) |
| 0.2 | 2.3 | GO:0050667 | homocysteine metabolic process(GO:0050667) |
| 0.2 | 2.7 | GO:0006301 | postreplication repair(GO:0006301) |
| 0.2 | 1.0 | GO:0038166 | angiotensin-activated signaling pathway(GO:0038166) |
| 0.2 | 0.5 | GO:0031642 | negative regulation of myelination(GO:0031642) |
| 0.2 | 1.8 | GO:0006027 | glycosaminoglycan catabolic process(GO:0006027) |
| 0.2 | 0.7 | GO:0030382 | sperm mitochondrion organization(GO:0030382) |
| 0.2 | 4.3 | GO:0018149 | peptide cross-linking(GO:0018149) |
| 0.2 | 1.3 | GO:0018298 | protein-chromophore linkage(GO:0018298) |
| 0.2 | 4.8 | GO:0018345 | protein palmitoylation(GO:0018345) |
| 0.2 | 1.8 | GO:0010718 | positive regulation of epithelial to mesenchymal transition(GO:0010718) |
| 0.2 | 1.1 | GO:1900028 | negative regulation of ruffle assembly(GO:1900028) |
| 0.2 | 3.2 | GO:0031146 | SCF-dependent proteasomal ubiquitin-dependent protein catabolic process(GO:0031146) |
| 0.2 | 2.7 | GO:0007099 | centriole replication(GO:0007099) |
| 0.2 | 1.9 | GO:0002042 | cell migration involved in sprouting angiogenesis(GO:0002042) |
| 0.2 | 1.1 | GO:0007190 | activation of adenylate cyclase activity(GO:0007190) |
| 0.2 | 0.9 | GO:0010835 | regulation of protein ADP-ribosylation(GO:0010835) |
| 0.2 | 0.5 | GO:0021564 | vagus nerve development(GO:0021564) |
| 0.2 | 0.6 | GO:0046110 | xanthine catabolic process(GO:0009115) xanthine metabolic process(GO:0046110) |
| 0.2 | 0.5 | GO:0090166 | Golgi disassembly(GO:0090166) |
| 0.2 | 0.9 | GO:0070933 | histone H4 deacetylation(GO:0070933) |
| 0.2 | 2.7 | GO:0043984 | histone H4-K16 acetylation(GO:0043984) |
| 0.1 | 1.0 | GO:2000001 | regulation of DNA damage checkpoint(GO:2000001) |
| 0.1 | 1.5 | GO:0046415 | urate metabolic process(GO:0046415) |
| 0.1 | 0.6 | GO:0033504 | floor plate development(GO:0033504) |
| 0.1 | 0.4 | GO:0033129 | positive regulation of histone phosphorylation(GO:0033129) |
| 0.1 | 0.1 | GO:0072710 | response to hydroxyurea(GO:0072710) cellular response to hydroxyurea(GO:0072711) |
| 0.1 | 1.0 | GO:0006384 | transcription initiation from RNA polymerase III promoter(GO:0006384) |
| 0.1 | 0.7 | GO:0070208 | protein heterotrimerization(GO:0070208) |
| 0.1 | 0.8 | GO:0017196 | N-terminal peptidyl-methionine acetylation(GO:0017196) |
| 0.1 | 2.5 | GO:2001244 | positive regulation of intrinsic apoptotic signaling pathway(GO:2001244) |
| 0.1 | 3.7 | GO:0038083 | peptidyl-tyrosine autophosphorylation(GO:0038083) |
| 0.1 | 1.5 | GO:0010960 | magnesium ion homeostasis(GO:0010960) |
| 0.1 | 0.7 | GO:0015074 | DNA integration(GO:0015074) |
| 0.1 | 2.8 | GO:0000184 | nuclear-transcribed mRNA catabolic process, nonsense-mediated decay(GO:0000184) |
| 0.1 | 2.9 | GO:0006284 | base-excision repair(GO:0006284) |
| 0.1 | 3.0 | GO:0000028 | ribosomal small subunit assembly(GO:0000028) |
| 0.1 | 0.4 | GO:0051697 | protein delipidation(GO:0051697) |
| 0.1 | 0.9 | GO:0051016 | barbed-end actin filament capping(GO:0051016) |
| 0.1 | 5.0 | GO:0006661 | phosphatidylinositol biosynthetic process(GO:0006661) |
| 0.1 | 1.4 | GO:0045671 | negative regulation of osteoclast differentiation(GO:0045671) |
| 0.1 | 2.7 | GO:0000027 | ribosomal large subunit assembly(GO:0000027) |
| 0.1 | 1.1 | GO:0043537 | negative regulation of blood vessel endothelial cell migration(GO:0043537) |
| 0.1 | 5.2 | GO:0051028 | mRNA transport(GO:0051028) |
| 0.1 | 0.5 | GO:0048149 | behavioral response to ethanol(GO:0048149) |
| 0.1 | 0.3 | GO:0032383 | regulation of intracellular lipid transport(GO:0032377) regulation of intracellular sterol transport(GO:0032380) regulation of intracellular cholesterol transport(GO:0032383) |
| 0.1 | 1.0 | GO:0035634 | response to stilbenoid(GO:0035634) |
| 0.1 | 1.4 | GO:0046326 | positive regulation of glucose import(GO:0046326) |
| 0.1 | 0.7 | GO:0097345 | mitochondrial outer membrane permeabilization(GO:0097345) |
| 0.1 | 1.8 | GO:0036158 | outer dynein arm assembly(GO:0036158) |
| 0.1 | 0.9 | GO:0071447 | cellular response to hydroperoxide(GO:0071447) |
| 0.1 | 0.9 | GO:0045056 | transcytosis(GO:0045056) |
| 0.1 | 0.6 | GO:0060438 | trachea development(GO:0060438) |
| 0.1 | 0.7 | GO:0006729 | tetrahydrobiopterin biosynthetic process(GO:0006729) |
| 0.1 | 0.1 | GO:0035425 | autocrine signaling(GO:0035425) |
| 0.1 | 2.9 | GO:0051092 | positive regulation of NF-kappaB transcription factor activity(GO:0051092) |
| 0.1 | 0.2 | GO:0008343 | adult feeding behavior(GO:0008343) |
| 0.1 | 0.8 | GO:1903358 | regulation of Golgi organization(GO:1903358) |
| 0.1 | 2.0 | GO:0033209 | tumor necrosis factor-mediated signaling pathway(GO:0033209) |
| 0.1 | 0.2 | GO:0006311 | meiotic gene conversion(GO:0006311) gene conversion(GO:0035822) |
| 0.1 | 0.2 | GO:2000048 | negative regulation of cell-cell adhesion mediated by cadherin(GO:2000048) |
| 0.1 | 2.3 | GO:0006893 | Golgi to plasma membrane transport(GO:0006893) |
| 0.1 | 1.6 | GO:0060325 | face morphogenesis(GO:0060325) |
| 0.1 | 1.7 | GO:0000470 | maturation of LSU-rRNA(GO:0000470) |
| 0.1 | 0.6 | GO:0019430 | removal of superoxide radicals(GO:0019430) |
| 0.1 | 0.3 | GO:1902570 | protein localization to nucleolus(GO:1902570) |
| 0.1 | 2.3 | GO:0030490 | maturation of SSU-rRNA(GO:0030490) |
| 0.1 | 0.1 | GO:0009202 | dTTP biosynthetic process(GO:0006235) deoxyribonucleoside triphosphate biosynthetic process(GO:0009202) pyrimidine deoxyribonucleoside triphosphate metabolic process(GO:0009211) pyrimidine deoxyribonucleoside triphosphate biosynthetic process(GO:0009212) pyrimidine deoxyribonucleotide biosynthetic process(GO:0009221) 2'-deoxyribonucleotide biosynthetic process(GO:0009265) dTTP metabolic process(GO:0046075) deoxyribose phosphate biosynthetic process(GO:0046385) |
| 0.1 | 0.9 | GO:0001887 | selenium compound metabolic process(GO:0001887) |
| 0.1 | 2.9 | GO:0043484 | regulation of RNA splicing(GO:0043484) |
| 0.1 | 0.7 | GO:0071353 | cellular response to interleukin-4(GO:0071353) |
| 0.1 | 1.2 | GO:2001022 | positive regulation of response to DNA damage stimulus(GO:2001022) |
| 0.1 | 0.3 | GO:0040015 | negative regulation of multicellular organism growth(GO:0040015) |
| 0.1 | 0.6 | GO:0006490 | oligosaccharide-lipid intermediate biosynthetic process(GO:0006490) |
| 0.0 | 0.9 | GO:0032088 | negative regulation of NF-kappaB transcription factor activity(GO:0032088) |
| 0.0 | 0.2 | GO:1901029 | negative regulation of mitochondrial outer membrane permeabilization involved in apoptotic signaling pathway(GO:1901029) |
| 0.0 | 0.4 | GO:0008630 | intrinsic apoptotic signaling pathway in response to DNA damage(GO:0008630) |
| 0.0 | 1.7 | GO:0043488 | regulation of mRNA stability(GO:0043488) |
| 0.0 | 0.9 | GO:0006368 | transcription elongation from RNA polymerase II promoter(GO:0006368) |
| 0.0 | 0.4 | GO:0071044 | histone mRNA catabolic process(GO:0071044) |
| 0.0 | 0.3 | GO:0009744 | response to sucrose(GO:0009744) response to disaccharide(GO:0034285) |
| 0.0 | 1.7 | GO:0007596 | blood coagulation(GO:0007596) |
| 0.0 | 0.9 | GO:0001580 | detection of chemical stimulus involved in sensory perception of bitter taste(GO:0001580) |
| 0.0 | 1.5 | GO:0051607 | defense response to virus(GO:0051607) |
| 0.0 | 0.2 | GO:0000290 | deadenylation-dependent decapping of nuclear-transcribed mRNA(GO:0000290) |
| 0.0 | 1.7 | GO:0071593 | lymphocyte aggregation(GO:0071593) |
| 0.0 | 0.2 | GO:0006348 | chromatin silencing at telomere(GO:0006348) |
| 0.0 | 0.5 | GO:1901998 | toxin transport(GO:1901998) |
| 0.0 | 0.3 | GO:0051567 | histone H3-K9 methylation(GO:0051567) |
| 0.0 | 0.4 | GO:0042113 | B cell activation(GO:0042113) |
| 0.0 | 0.3 | GO:0051351 | positive regulation of ligase activity(GO:0051351) |
| 0.0 | 0.1 | GO:0032793 | positive regulation of CREB transcription factor activity(GO:0032793) |
| 0.0 | 0.1 | GO:0031167 | rRNA methylation(GO:0031167) |
| 0.0 | 0.1 | GO:0034058 | endosomal vesicle fusion(GO:0034058) |
Gene overrepresentation in cellular component category:
| Log-likelihood per target | Total log-likelihood | Term | Description |
|---|---|---|---|
| 10.5 | 41.8 | GO:0031838 | haptoglobin-hemoglobin complex(GO:0031838) |
| 9.6 | 28.9 | GO:0044214 | spanning component of plasma membrane(GO:0044214) spanning component of membrane(GO:0089717) |
| 8.4 | 25.2 | GO:0070821 | tertiary granule membrane(GO:0070821) |
| 7.5 | 119.6 | GO:0042613 | MHC class II protein complex(GO:0042613) |
| 6.9 | 20.8 | GO:1990682 | CSF1-CSF1R complex(GO:1990682) |
| 6.1 | 18.2 | GO:0071438 | invadopodium membrane(GO:0071438) |
| 6.0 | 30.1 | GO:0072558 | NLRP1 inflammasome complex(GO:0072558) |
| 4.9 | 14.6 | GO:0032173 | septin collar(GO:0032173) |
| 4.8 | 82.2 | GO:0042101 | T cell receptor complex(GO:0042101) |
| 4.8 | 19.2 | GO:0020005 | symbiont-containing vacuole membrane(GO:0020005) |
| 4.6 | 31.9 | GO:0042825 | TAP complex(GO:0042825) |
| 4.5 | 18.1 | GO:0005607 | laminin-2 complex(GO:0005607) |
| 4.5 | 13.4 | GO:0005944 | phosphatidylinositol 3-kinase complex, class IB(GO:0005944) |
| 4.4 | 43.6 | GO:0043020 | NADPH oxidase complex(GO:0043020) |
| 4.0 | 142.5 | GO:0008305 | integrin complex(GO:0008305) |
| 3.9 | 31.0 | GO:0000796 | condensin complex(GO:0000796) |
| 3.8 | 15.2 | GO:0044215 | other organism(GO:0044215) other organism cell(GO:0044216) other organism part(GO:0044217) |
| 3.7 | 60.0 | GO:0042581 | specific granule(GO:0042581) |
| 3.7 | 14.9 | GO:0071914 | prominosome(GO:0071914) |
| 3.7 | 14.7 | GO:0000444 | MIS12/MIND type complex(GO:0000444) |
| 3.6 | 3.6 | GO:0097427 | microtubule bundle(GO:0097427) |
| 3.4 | 10.1 | GO:0097232 | lamellar body membrane(GO:0097232) alveolar lamellar body membrane(GO:0097233) |
| 3.3 | 19.8 | GO:1990357 | terminal web(GO:1990357) |
| 3.3 | 39.3 | GO:0035631 | CD40 receptor complex(GO:0035631) |
| 3.2 | 51.2 | GO:0042612 | MHC class I protein complex(GO:0042612) |
| 3.1 | 43.9 | GO:0031618 | nuclear pericentric heterochromatin(GO:0031618) |
| 3.1 | 12.4 | GO:0009330 | DNA topoisomerase complex (ATP-hydrolyzing)(GO:0009330) |
| 3.1 | 95.5 | GO:0001772 | immunological synapse(GO:0001772) |
| 3.1 | 18.4 | GO:0033093 | Weibel-Palade body(GO:0033093) |
| 3.0 | 14.9 | GO:0048237 | rough endoplasmic reticulum lumen(GO:0048237) |
| 3.0 | 17.7 | GO:0032133 | chromosome passenger complex(GO:0032133) |
| 2.9 | 58.9 | GO:0031528 | microvillus membrane(GO:0031528) |
| 2.8 | 14.2 | GO:1990716 | axonemal central apparatus(GO:1990716) |
| 2.7 | 5.4 | GO:0097487 | multivesicular body, internal vesicle(GO:0097487) |
| 2.4 | 7.3 | GO:0070110 | interleukin-6 receptor complex(GO:0005896) ciliary neurotrophic factor receptor complex(GO:0070110) |
| 2.4 | 7.2 | GO:0031680 | G-protein beta/gamma-subunit complex(GO:0031680) |
| 2.4 | 19.1 | GO:0032584 | growth cone membrane(GO:0032584) |
| 2.4 | 19.1 | GO:0005638 | lamin filament(GO:0005638) |
| 2.3 | 9.3 | GO:0072559 | NLRP3 inflammasome complex(GO:0072559) |
| 2.3 | 25.4 | GO:0034663 | endoplasmic reticulum chaperone complex(GO:0034663) |
| 2.3 | 6.9 | GO:0097125 | cyclin B1-CDK1 complex(GO:0097125) |
| 2.2 | 13.3 | GO:0005610 | laminin-5 complex(GO:0005610) |
| 2.2 | 19.5 | GO:0033643 | host cell part(GO:0033643) |
| 2.1 | 10.7 | GO:0031904 | endosome lumen(GO:0031904) |
| 2.1 | 6.3 | GO:0097124 | cyclin A2-CDK2 complex(GO:0097124) |
| 2.1 | 6.3 | GO:0097651 | phosphatidylinositol 3-kinase complex, class IA(GO:0005943) phosphatidylinositol 3-kinase complex, class I(GO:0097651) |
| 2.0 | 4.1 | GO:0043219 | lateral loop(GO:0043219) |
| 1.9 | 1.9 | GO:0018995 | host(GO:0018995) host cell(GO:0043657) |
| 1.9 | 5.7 | GO:0032798 | Swi5-Sfr1 complex(GO:0032798) |
| 1.9 | 5.7 | GO:0030690 | Noc1p-Noc2p complex(GO:0030690) |
| 1.9 | 16.9 | GO:0031390 | Ctf18 RFC-like complex(GO:0031390) |
| 1.9 | 13.0 | GO:0042406 | extrinsic component of endoplasmic reticulum membrane(GO:0042406) |
| 1.9 | 48.3 | GO:0042629 | mast cell granule(GO:0042629) |
| 1.8 | 9.2 | GO:0000220 | vacuolar proton-transporting V-type ATPase, V0 domain(GO:0000220) |
| 1.8 | 21.8 | GO:0042622 | photoreceptor outer segment membrane(GO:0042622) |
| 1.8 | 17.8 | GO:0014731 | spectrin-associated cytoskeleton(GO:0014731) |
| 1.8 | 46.3 | GO:0001891 | phagocytic cup(GO:0001891) |
| 1.8 | 530.9 | GO:0009897 | external side of plasma membrane(GO:0009897) |
| 1.8 | 8.8 | GO:0044614 | nuclear pore cytoplasmic filaments(GO:0044614) |
| 1.7 | 6.9 | GO:0097149 | centralspindlin complex(GO:0097149) |
| 1.7 | 12.0 | GO:0016602 | CCAAT-binding factor complex(GO:0016602) |
| 1.7 | 42.4 | GO:0005771 | multivesicular body(GO:0005771) |
| 1.7 | 10.0 | GO:1990111 | spermatoproteasome complex(GO:1990111) |
| 1.6 | 72.6 | GO:0000791 | euchromatin(GO:0000791) |
| 1.6 | 4.9 | GO:0033186 | CAF-1 complex(GO:0033186) |
| 1.6 | 20.8 | GO:0016514 | SWI/SNF complex(GO:0016514) |
| 1.6 | 20.4 | GO:0031091 | platelet alpha granule(GO:0031091) |
| 1.5 | 9.1 | GO:0001940 | male pronucleus(GO:0001940) |
| 1.5 | 6.0 | GO:0045098 | type III intermediate filament(GO:0045098) |
| 1.5 | 13.2 | GO:0008024 | cyclin/CDK positive transcription elongation factor complex(GO:0008024) |
| 1.4 | 4.2 | GO:0005657 | replication fork(GO:0005657) |
| 1.4 | 7.0 | GO:0071547 | piP-body(GO:0071547) |
| 1.4 | 19.3 | GO:0001741 | XY body(GO:0001741) |
| 1.3 | 6.7 | GO:0033061 | DNA recombinase mediator complex(GO:0033061) |
| 1.3 | 11.7 | GO:0016461 | unconventional myosin complex(GO:0016461) |
| 1.3 | 10.2 | GO:0070578 | RISC-loading complex(GO:0070578) |
| 1.3 | 5.1 | GO:0036156 | inner dynein arm(GO:0036156) |
| 1.3 | 10.1 | GO:0005833 | hemoglobin complex(GO:0005833) |
| 1.3 | 5.1 | GO:0031264 | death-inducing signaling complex(GO:0031264) ripoptosome(GO:0097342) |
| 1.3 | 16.3 | GO:0016580 | Sin3 complex(GO:0016580) |
| 1.3 | 6.3 | GO:0097443 | sorting endosome(GO:0097443) |
| 1.2 | 9.7 | GO:0044322 | endoplasmic reticulum quality control compartment(GO:0044322) |
| 1.2 | 1.2 | GO:0019815 | B cell receptor complex(GO:0019815) |
| 1.2 | 6.0 | GO:0030478 | actin cap(GO:0030478) |
| 1.2 | 6.0 | GO:0008622 | epsilon DNA polymerase complex(GO:0008622) |
| 1.2 | 3.5 | GO:0000811 | GINS complex(GO:0000811) |
| 1.2 | 15.3 | GO:0005885 | Arp2/3 protein complex(GO:0005885) |
| 1.2 | 4.6 | GO:0097208 | alveolar lamellar body(GO:0097208) |
| 1.2 | 42.8 | GO:0009925 | basal plasma membrane(GO:0009925) |
| 1.1 | 9.1 | GO:0005818 | astral microtubule(GO:0000235) aster(GO:0005818) |
| 1.1 | 7.9 | GO:0000813 | ESCRT I complex(GO:0000813) |
| 1.1 | 5.6 | GO:0061689 | tricellular tight junction(GO:0061689) |
| 1.1 | 10.1 | GO:0008290 | F-actin capping protein complex(GO:0008290) |
| 1.1 | 10.0 | GO:0033256 | I-kappaB/NF-kappaB complex(GO:0033256) |
| 1.1 | 13.3 | GO:0000177 | cytoplasmic exosome (RNase complex)(GO:0000177) |
| 1.1 | 5.5 | GO:0016471 | vacuolar proton-transporting V-type ATPase complex(GO:0016471) |
| 1.1 | 3.3 | GO:1990826 | nucleoplasmic periphery of the nuclear pore complex(GO:1990826) |
| 1.1 | 8.8 | GO:0044615 | nuclear pore nuclear basket(GO:0044615) |
| 1.1 | 18.7 | GO:0005639 | integral component of nuclear inner membrane(GO:0005639) intrinsic component of nuclear inner membrane(GO:0031229) |
| 1.1 | 9.8 | GO:0070419 | nonhomologous end joining complex(GO:0070419) |
| 1.1 | 4.3 | GO:0005846 | nuclear cap binding complex(GO:0005846) |
| 1.1 | 3.2 | GO:0044611 | nuclear pore inner ring(GO:0044611) |
| 1.1 | 2.1 | GO:0071664 | catenin-TCF7L2 complex(GO:0071664) |
| 1.1 | 3.2 | GO:0035101 | FACT complex(GO:0035101) |
| 1.1 | 17.0 | GO:0005721 | pericentric heterochromatin(GO:0005721) |
| 1.0 | 3.1 | GO:0000110 | nucleotide-excision repair factor 1 complex(GO:0000110) |
| 1.0 | 2.0 | GO:0071564 | npBAF complex(GO:0071564) |
| 0.9 | 10.4 | GO:0044754 | autolysosome(GO:0044754) |
| 0.9 | 11.2 | GO:0044232 | organelle membrane contact site(GO:0044232) |
| 0.9 | 1.9 | GO:0035838 | growing cell tip(GO:0035838) |
| 0.9 | 12.9 | GO:0031932 | TORC2 complex(GO:0031932) |
| 0.9 | 2.8 | GO:0070022 | transforming growth factor beta receptor homodimeric complex(GO:0070022) |
| 0.9 | 2.7 | GO:0044299 | C-fiber(GO:0044299) |
| 0.9 | 4.4 | GO:0002189 | ribose phosphate diphosphokinase complex(GO:0002189) |
| 0.9 | 7.0 | GO:0071439 | clathrin complex(GO:0071439) |
| 0.9 | 52.7 | GO:0031902 | late endosome membrane(GO:0031902) |
| 0.9 | 11.2 | GO:0031258 | lamellipodium membrane(GO:0031258) |
| 0.9 | 2.6 | GO:0065010 | extracellular membrane-bounded organelle(GO:0065010) |
| 0.8 | 5.9 | GO:0000127 | transcription factor TFIIIC complex(GO:0000127) |
| 0.8 | 8.2 | GO:0000778 | condensed nuclear chromosome kinetochore(GO:0000778) |
| 0.8 | 67.8 | GO:0016605 | PML body(GO:0016605) |
| 0.8 | 4.9 | GO:0070822 | Sin3-type complex(GO:0070822) |
| 0.8 | 12.2 | GO:0035098 | ESC/E(Z) complex(GO:0035098) |
| 0.8 | 240.5 | GO:0000790 | nuclear chromatin(GO:0000790) |
| 0.8 | 3.2 | GO:0098536 | deuterosome(GO:0098536) |
| 0.8 | 1.6 | GO:0070765 | gamma-secretase complex(GO:0070765) |
| 0.8 | 4.8 | GO:0034715 | pICln-Sm protein complex(GO:0034715) |
| 0.8 | 4.7 | GO:0030896 | checkpoint clamp complex(GO:0030896) |
| 0.8 | 2.4 | GO:1990622 | CHOP-ATF3 complex(GO:1990622) |
| 0.8 | 12.5 | GO:0005751 | mitochondrial respiratory chain complex IV(GO:0005751) |
| 0.8 | 6.1 | GO:0005952 | cAMP-dependent protein kinase complex(GO:0005952) |
| 0.8 | 2.3 | GO:0000835 | ER ubiquitin ligase complex(GO:0000835) Hrd1p ubiquitin ligase complex(GO:0000836) |
| 0.8 | 6.1 | GO:0005587 | collagen type IV trimer(GO:0005587) network-forming collagen trimer(GO:0098642) collagen network(GO:0098645) |
| 0.8 | 19.0 | GO:0002102 | podosome(GO:0002102) |
| 0.8 | 12.9 | GO:0005686 | U2 snRNP(GO:0005686) |
| 0.8 | 6.0 | GO:0031332 | RISC complex(GO:0016442) RNAi effector complex(GO:0031332) |
| 0.8 | 12.1 | GO:0042589 | zymogen granule membrane(GO:0042589) |
| 0.8 | 4.5 | GO:0035102 | PRC1 complex(GO:0035102) |
| 0.7 | 13.5 | GO:0030057 | desmosome(GO:0030057) |
| 0.7 | 2.9 | GO:0032299 | ribonuclease H2 complex(GO:0032299) |
| 0.7 | 2.9 | GO:0071203 | WASH complex(GO:0071203) |
| 0.7 | 18.2 | GO:0008180 | COP9 signalosome(GO:0008180) |
| 0.7 | 1.4 | GO:0071141 | SMAD protein complex(GO:0071141) |
| 0.7 | 4.3 | GO:0033263 | CORVET complex(GO:0033263) |
| 0.7 | 12.1 | GO:0090665 | dystrophin-associated glycoprotein complex(GO:0016010) glycoprotein complex(GO:0090665) |
| 0.7 | 4.8 | GO:0042588 | zymogen granule(GO:0042588) |
| 0.7 | 90.5 | GO:0031234 | extrinsic component of cytoplasmic side of plasma membrane(GO:0031234) |
| 0.7 | 2.7 | GO:0002193 | MAML1-RBP-Jkappa- ICN1 complex(GO:0002193) |
| 0.6 | 103.4 | GO:0030027 | lamellipodium(GO:0030027) |
| 0.6 | 7.0 | GO:1990124 | messenger ribonucleoprotein complex(GO:1990124) |
| 0.6 | 65.0 | GO:0000776 | kinetochore(GO:0000776) |
| 0.6 | 2.5 | GO:0016281 | eukaryotic translation initiation factor 4F complex(GO:0016281) |
| 0.6 | 11.0 | GO:0005614 | interstitial matrix(GO:0005614) |
| 0.6 | 2.4 | GO:0097433 | dense body(GO:0097433) |
| 0.6 | 4.8 | GO:0005845 | mRNA cap binding complex(GO:0005845) RNA cap binding complex(GO:0034518) |
| 0.6 | 70.1 | GO:0070160 | occluding junction(GO:0070160) |
| 0.6 | 3.5 | GO:0097209 | epidermal lamellar body(GO:0097209) |
| 0.6 | 1.2 | GO:0008275 | gamma-tubulin small complex(GO:0008275) |
| 0.6 | 5.3 | GO:0042788 | polysomal ribosome(GO:0042788) |
| 0.6 | 3.5 | GO:0030123 | AP-3 adaptor complex(GO:0030123) |
| 0.6 | 5.7 | GO:0070652 | HAUS complex(GO:0070652) |
| 0.6 | 9.1 | GO:0032039 | integrator complex(GO:0032039) |
| 0.6 | 9.5 | GO:0031235 | intrinsic component of the cytoplasmic side of the plasma membrane(GO:0031235) |
| 0.6 | 206.1 | GO:0000323 | lytic vacuole(GO:0000323) lysosome(GO:0005764) |
| 0.6 | 5.0 | GO:0031616 | spindle pole centrosome(GO:0031616) |
| 0.6 | 37.1 | GO:0005913 | cell-cell adherens junction(GO:0005913) |
| 0.5 | 17.0 | GO:0045335 | phagocytic vesicle(GO:0045335) |
| 0.5 | 5.4 | GO:0000347 | THO complex(GO:0000347) THO complex part of transcription export complex(GO:0000445) |
| 0.5 | 5.8 | GO:0097431 | mitotic spindle pole(GO:0097431) |
| 0.5 | 19.2 | GO:0072686 | mitotic spindle(GO:0072686) |
| 0.5 | 0.5 | GO:0005683 | U7 snRNP(GO:0005683) |
| 0.5 | 2.0 | GO:0043296 | apical junction complex(GO:0043296) |
| 0.5 | 10.4 | GO:0005732 | small nucleolar ribonucleoprotein complex(GO:0005732) |
| 0.5 | 1.9 | GO:0070876 | SOSS complex(GO:0070876) |
| 0.5 | 0.5 | GO:0010009 | cytoplasmic side of endosome membrane(GO:0010009) |
| 0.4 | 4.9 | GO:0043205 | microfibril(GO:0001527) fibril(GO:0043205) |
| 0.4 | 8.4 | GO:0097610 | cleavage furrow(GO:0032154) cell surface furrow(GO:0097610) |
| 0.4 | 1.3 | GO:0033165 | interphotoreceptor matrix(GO:0033165) |
| 0.4 | 0.9 | GO:0090543 | Flemming body(GO:0090543) |
| 0.4 | 18.5 | GO:0010494 | cytoplasmic stress granule(GO:0010494) |
| 0.4 | 3.5 | GO:0072669 | tRNA-splicing ligase complex(GO:0072669) |
| 0.4 | 5.7 | GO:0030131 | clathrin adaptor complex(GO:0030131) |
| 0.4 | 7.8 | GO:0071011 | precatalytic spliceosome(GO:0071011) |
| 0.4 | 1.7 | GO:0090571 | RNA polymerase II transcription repressor complex(GO:0090571) |
| 0.4 | 2.1 | GO:0071204 | histone pre-mRNA 3'end processing complex(GO:0071204) |
| 0.4 | 2.1 | GO:0034455 | t-UTP complex(GO:0034455) |
| 0.4 | 0.8 | GO:0030689 | Noc complex(GO:0030689) |
| 0.4 | 5.3 | GO:0005697 | telomerase holoenzyme complex(GO:0005697) |
| 0.4 | 4.8 | GO:0030132 | clathrin coat of coated pit(GO:0030132) |
| 0.4 | 5.0 | GO:0005671 | Ada2/Gcn5/Ada3 transcription activator complex(GO:0005671) |
| 0.4 | 0.8 | GO:0005642 | annulate lamellae(GO:0005642) |
| 0.4 | 1.1 | GO:0005945 | 6-phosphofructokinase complex(GO:0005945) |
| 0.4 | 1.1 | GO:0072487 | MSL complex(GO:0072487) |
| 0.4 | 1.4 | GO:0034993 | microtubule organizing center attachment site(GO:0034992) LINC complex(GO:0034993) |
| 0.3 | 8.7 | GO:0055038 | recycling endosome membrane(GO:0055038) |
| 0.3 | 0.3 | GO:0031205 | endoplasmic reticulum Sec complex(GO:0031205) |
| 0.3 | 5.4 | GO:0043240 | Fanconi anaemia nuclear complex(GO:0043240) |
| 0.3 | 2.3 | GO:0070449 | elongin complex(GO:0070449) |
| 0.3 | 3.6 | GO:0044666 | MLL3/4 complex(GO:0044666) |
| 0.3 | 3.5 | GO:0002177 | manchette(GO:0002177) |
| 0.3 | 18.9 | GO:0005798 | Golgi-associated vesicle(GO:0005798) |
| 0.3 | 27.9 | GO:0022625 | cytosolic large ribosomal subunit(GO:0022625) |
| 0.3 | 1.0 | GO:0000923 | equatorial microtubule organizing center(GO:0000923) |
| 0.3 | 6.0 | GO:0005680 | anaphase-promoting complex(GO:0005680) |
| 0.3 | 1.6 | GO:0000176 | nuclear exosome (RNase complex)(GO:0000176) |
| 0.3 | 2.5 | GO:0042587 | glycogen granule(GO:0042587) |
| 0.3 | 13.4 | GO:0032587 | ruffle membrane(GO:0032587) |
| 0.3 | 6.4 | GO:0030864 | cortical actin cytoskeleton(GO:0030864) |
| 0.3 | 32.1 | GO:0001650 | fibrillar center(GO:0001650) |
| 0.3 | 14.8 | GO:0031526 | brush border membrane(GO:0031526) |
| 0.3 | 3.7 | GO:0019013 | viral nucleocapsid(GO:0019013) |
| 0.3 | 0.8 | GO:0060187 | cell pole(GO:0060187) |
| 0.2 | 1.0 | GO:0035339 | SPOTS complex(GO:0035339) |
| 0.2 | 7.9 | GO:0005643 | nuclear pore(GO:0005643) |
| 0.2 | 1.7 | GO:0000178 | exosome (RNase complex)(GO:0000178) |
| 0.2 | 0.7 | GO:0005760 | gamma DNA polymerase complex(GO:0005760) |
| 0.2 | 5.1 | GO:0008074 | guanylate cyclase complex, soluble(GO:0008074) |
| 0.2 | 2.3 | GO:0030914 | STAGA complex(GO:0030914) |
| 0.2 | 47.0 | GO:0005925 | focal adhesion(GO:0005925) |
| 0.2 | 31.4 | GO:0045111 | intermediate filament cytoskeleton(GO:0045111) |
| 0.2 | 1.6 | GO:0030688 | preribosome, small subunit precursor(GO:0030688) |
| 0.2 | 0.9 | GO:0005971 | ribonucleoside-diphosphate reductase complex(GO:0005971) |
| 0.2 | 0.6 | GO:0071006 | U2-type catalytic step 1 spliceosome(GO:0071006) |
| 0.2 | 0.6 | GO:0071001 | U4/U6 snRNP(GO:0071001) |
| 0.2 | 1.3 | GO:0042765 | GPI-anchor transamidase complex(GO:0042765) |
| 0.2 | 0.6 | GO:0070421 | DNA ligase III-XRCC1 complex(GO:0070421) |
| 0.2 | 2.9 | GO:0031519 | PcG protein complex(GO:0031519) |
| 0.2 | 1.0 | GO:0071256 | Sec61 translocon complex(GO:0005784) translocon complex(GO:0071256) |
| 0.2 | 2.2 | GO:0005847 | mRNA cleavage and polyadenylation specificity factor complex(GO:0005847) |
| 0.2 | 5.0 | GO:0035145 | exon-exon junction complex(GO:0035145) |
| 0.2 | 1.9 | GO:0071339 | MLL1/2 complex(GO:0044665) MLL1 complex(GO:0071339) |
| 0.2 | 6.1 | GO:0031901 | early endosome membrane(GO:0031901) |
| 0.2 | 3.8 | GO:0001533 | cornified envelope(GO:0001533) |
| 0.2 | 16.8 | GO:0005814 | centriole(GO:0005814) |
| 0.2 | 1.1 | GO:0016593 | Cdc73/Paf1 complex(GO:0016593) |
| 0.2 | 0.9 | GO:0043293 | apoptosome(GO:0043293) |
| 0.2 | 8.7 | GO:0031228 | intrinsic component of Golgi membrane(GO:0031228) |
| 0.2 | 0.9 | GO:0009331 | glycerol-3-phosphate dehydrogenase complex(GO:0009331) |
| 0.2 | 1.4 | GO:0005658 | alpha DNA polymerase:primase complex(GO:0005658) |
| 0.2 | 2.8 | GO:0030867 | rough endoplasmic reticulum membrane(GO:0030867) |
| 0.2 | 8.9 | GO:0000922 | spindle pole(GO:0000922) |
| 0.2 | 1.2 | GO:0000930 | gamma-tubulin complex(GO:0000930) |
| 0.1 | 10.2 | GO:0090575 | RNA polymerase II transcription factor complex(GO:0090575) |
| 0.1 | 6.6 | GO:0016592 | mediator complex(GO:0016592) |
| 0.1 | 9.8 | GO:0019005 | SCF ubiquitin ligase complex(GO:0019005) |
| 0.1 | 4.0 | GO:0008023 | transcription elongation factor complex(GO:0008023) |
| 0.1 | 0.7 | GO:0043625 | delta DNA polymerase complex(GO:0043625) |
| 0.1 | 7.4 | GO:0000781 | chromosome, telomeric region(GO:0000781) |
| 0.1 | 0.6 | GO:0000243 | commitment complex(GO:0000243) |
| 0.1 | 0.7 | GO:0048179 | activin receptor complex(GO:0048179) |
| 0.1 | 11.3 | GO:0032993 | protein-DNA complex(GO:0032993) |
| 0.1 | 3.5 | GO:0015030 | Cajal body(GO:0015030) |
| 0.1 | 6.1 | GO:0032580 | Golgi cisterna membrane(GO:0032580) |
| 0.1 | 1.7 | GO:0005689 | U12-type spliceosomal complex(GO:0005689) |
| 0.1 | 0.9 | GO:0043596 | nuclear replication fork(GO:0043596) |
| 0.1 | 1.1 | GO:0017119 | Golgi transport complex(GO:0017119) |
| 0.1 | 0.3 | GO:0031094 | platelet dense granule membrane(GO:0031088) platelet dense tubular network(GO:0031094) platelet dense granule(GO:0042827) |
| 0.1 | 18.4 | GO:0005667 | transcription factor complex(GO:0005667) |
| 0.1 | 0.7 | GO:0071541 | eukaryotic translation initiation factor 3 complex, eIF3m(GO:0071541) |
| 0.1 | 2.8 | GO:0032420 | stereocilium(GO:0032420) |
| 0.1 | 0.3 | GO:1990604 | IRE1-TRAF2-ASK1 complex(GO:1990604) |
| 0.1 | 5.7 | GO:0000785 | chromatin(GO:0000785) |
| 0.1 | 1.0 | GO:0097038 | perinuclear endoplasmic reticulum(GO:0097038) |
| 0.1 | 4.3 | GO:0005788 | endoplasmic reticulum lumen(GO:0005788) |
| 0.1 | 1.1 | GO:0005868 | cytoplasmic dynein complex(GO:0005868) |
| 0.1 | 0.1 | GO:0030915 | Smc5-Smc6 complex(GO:0030915) |
| 0.1 | 0.4 | GO:0030289 | protein phosphatase 4 complex(GO:0030289) |
| 0.0 | 0.8 | GO:0080008 | Cul4-RING E3 ubiquitin ligase complex(GO:0080008) |
| 0.0 | 9.0 | GO:0016607 | nuclear speck(GO:0016607) |
| 0.0 | 0.2 | GO:0005796 | Golgi lumen(GO:0005796) |
| 0.0 | 0.6 | GO:0016591 | DNA-directed RNA polymerase II, holoenzyme(GO:0016591) |
| 0.0 | 0.1 | GO:1990635 | proximal dendrite(GO:1990635) |
| 0.0 | 0.3 | GO:0031414 | N-terminal protein acetyltransferase complex(GO:0031414) |
| 0.0 | 0.1 | GO:0070552 | BRISC complex(GO:0070552) |
| 0.0 | 0.3 | GO:0030014 | CCR4-NOT complex(GO:0030014) |
| 0.0 | 0.2 | GO:0030687 | preribosome, large subunit precursor(GO:0030687) |
Gene overrepresentation in molecular function category:
| Log-likelihood per target | Total log-likelihood | Term | Description |
|---|---|---|---|
| 36.9 | 110.7 | GO:0004911 | interleukin-2 receptor activity(GO:0004911) |
| 14.9 | 44.6 | GO:0031720 | haptoglobin binding(GO:0031720) |
| 13.6 | 40.9 | GO:0019976 | interleukin-2 binding(GO:0019976) |
| 13.6 | 40.7 | GO:0034041 | sterol-transporting ATPase activity(GO:0034041) |
| 11.1 | 44.5 | GO:0001225 | RNA polymerase II transcription coactivator binding(GO:0001225) |
| 7.2 | 28.6 | GO:0044729 | hemi-methylated DNA-binding(GO:0044729) |
| 7.0 | 21.0 | GO:0004698 | calcium-dependent protein kinase C activity(GO:0004698) |
| 7.0 | 34.8 | GO:0015252 | hydrogen ion channel activity(GO:0015252) |
| 6.8 | 20.3 | GO:0031826 | follicle-stimulating hormone receptor binding(GO:0031762) type 2A serotonin receptor binding(GO:0031826) |
| 6.7 | 67.3 | GO:0019957 | C-C chemokine binding(GO:0019957) |
| 6.7 | 20.1 | GO:0034988 | Fc-gamma receptor I complex binding(GO:0034988) |
| 6.6 | 19.8 | GO:0001847 | opsonin receptor activity(GO:0001847) |
| 6.3 | 18.9 | GO:0004939 | beta-adrenergic receptor activity(GO:0004939) |
| 6.2 | 31.0 | GO:0043120 | tumor necrosis factor binding(GO:0043120) |
| 6.1 | 18.2 | GO:0002060 | purine nucleobase binding(GO:0002060) |
| 6.0 | 150.6 | GO:0042288 | MHC class I protein binding(GO:0042288) |
| 6.0 | 17.9 | GO:0032810 | sterol response element binding(GO:0032810) |
| 5.5 | 27.7 | GO:0070891 | lipoteichoic acid binding(GO:0070891) |
| 5.2 | 25.8 | GO:0015093 | ferrous iron transmembrane transporter activity(GO:0015093) |
| 5.1 | 15.4 | GO:0034211 | GTP-dependent protein kinase activity(GO:0034211) |
| 5.0 | 19.8 | GO:0017077 | oxidative phosphorylation uncoupler activity(GO:0017077) |
| 4.9 | 19.7 | GO:0003726 | double-stranded RNA adenosine deaminase activity(GO:0003726) |
| 4.9 | 63.2 | GO:0004954 | prostanoid receptor activity(GO:0004954) |
| 4.7 | 60.6 | GO:1990405 | protein antigen binding(GO:1990405) |
| 4.7 | 23.3 | GO:0050785 | advanced glycation end-product receptor activity(GO:0050785) |
| 4.6 | 116.2 | GO:0043325 | phosphatidylinositol-3,4-bisphosphate binding(GO:0043325) |
| 4.6 | 23.1 | GO:0004920 | interleukin-10 receptor activity(GO:0004920) |
| 4.6 | 36.5 | GO:0042608 | T cell receptor binding(GO:0042608) |
| 4.5 | 22.6 | GO:0015166 | polyol transmembrane transporter activity(GO:0015166) glycerol transmembrane transporter activity(GO:0015168) |
| 4.5 | 120.9 | GO:0005070 | SH3/SH2 adaptor activity(GO:0005070) |
| 4.4 | 22.2 | GO:0019770 | IgG receptor activity(GO:0019770) |
| 4.4 | 21.9 | GO:0071987 | WD40-repeat domain binding(GO:0071987) |
| 4.3 | 13.0 | GO:0035851 | Krueppel-associated box domain binding(GO:0035851) |
| 4.3 | 17.1 | GO:0045159 | myosin II binding(GO:0045159) |
| 4.2 | 25.2 | GO:0047696 | beta-adrenergic receptor kinase activity(GO:0047696) |
| 4.1 | 12.4 | GO:0070573 | metallodipeptidase activity(GO:0070573) |
| 4.1 | 41.0 | GO:0005412 | glucose:sodium symporter activity(GO:0005412) |
| 3.9 | 39.5 | GO:0042287 | MHC protein binding(GO:0042287) |
| 3.9 | 42.8 | GO:0032036 | myosin heavy chain binding(GO:0032036) |
| 3.9 | 3.9 | GO:0038181 | bile acid receptor activity(GO:0038181) |
| 3.8 | 11.4 | GO:0042834 | peptidoglycan binding(GO:0042834) |
| 3.8 | 37.9 | GO:0005384 | manganese ion transmembrane transporter activity(GO:0005384) |
| 3.8 | 18.9 | GO:0005134 | interleukin-2 receptor binding(GO:0005134) |
| 3.6 | 14.4 | GO:0004949 | cannabinoid receptor activity(GO:0004949) |
| 3.5 | 17.3 | GO:0048248 | CXCR3 chemokine receptor binding(GO:0048248) |
| 3.4 | 27.6 | GO:0030368 | interleukin-17 receptor activity(GO:0030368) |
| 3.4 | 10.3 | GO:0004924 | oncostatin-M receptor activity(GO:0004924) |
| 3.4 | 20.3 | GO:0035662 | Toll-like receptor 4 binding(GO:0035662) |
| 3.4 | 10.1 | GO:0004918 | interleukin-8 receptor activity(GO:0004918) interleukin-8 binding(GO:0019959) |
| 3.3 | 6.6 | GO:0004897 | ciliary neurotrophic factor receptor activity(GO:0004897) |
| 3.3 | 9.9 | GO:0019809 | spermidine binding(GO:0019809) |
| 3.3 | 3.3 | GO:0004771 | sterol esterase activity(GO:0004771) |
| 3.2 | 3.2 | GO:0001637 | G-protein coupled chemoattractant receptor activity(GO:0001637) |
| 3.2 | 19.1 | GO:0046935 | 1-phosphatidylinositol-3-kinase regulator activity(GO:0046935) |
| 3.2 | 19.0 | GO:0008349 | MAP kinase kinase kinase kinase activity(GO:0008349) |
| 3.2 | 9.5 | GO:0004909 | interleukin-1, Type I, activating receptor activity(GO:0004909) |
| 3.2 | 3.2 | GO:0050145 | nucleoside phosphate kinase activity(GO:0050145) |
| 3.2 | 9.5 | GO:0004528 | phosphodiesterase I activity(GO:0004528) |
| 3.1 | 9.4 | GO:0004999 | vasoactive intestinal polypeptide receptor activity(GO:0004999) |
| 3.1 | 3.1 | GO:0008271 | secondary active sulfate transmembrane transporter activity(GO:0008271) |
| 3.1 | 12.4 | GO:0003918 | DNA topoisomerase type II (ATP-hydrolyzing) activity(GO:0003918) DNA topoisomerase II activity(GO:0061505) |
| 3.1 | 9.2 | GO:0035651 | AP-3 adaptor complex binding(GO:0035651) |
| 3.1 | 15.4 | GO:0015321 | sodium-dependent phosphate transmembrane transporter activity(GO:0015321) |
| 3.0 | 9.1 | GO:0009041 | uridylate kinase activity(GO:0009041) |
| 3.0 | 161.1 | GO:0004715 | non-membrane spanning protein tyrosine kinase activity(GO:0004715) |
| 3.0 | 24.3 | GO:0008329 | signaling pattern recognition receptor activity(GO:0008329) pattern recognition receptor activity(GO:0038187) |
| 3.0 | 57.6 | GO:0005031 | tumor necrosis factor-activated receptor activity(GO:0005031) death receptor activity(GO:0005035) |
| 3.0 | 15.0 | GO:0046790 | virion binding(GO:0046790) |
| 3.0 | 59.8 | GO:0001530 | lipopolysaccharide binding(GO:0001530) |
| 3.0 | 23.8 | GO:0070053 | thrombospondin receptor activity(GO:0070053) |
| 3.0 | 23.7 | GO:0016176 | superoxide-generating NADPH oxidase activator activity(GO:0016176) |
| 2.9 | 14.4 | GO:0044547 | DNA topoisomerase binding(GO:0044547) |
| 2.9 | 8.6 | GO:0050656 | 3'-phosphoadenosine 5'-phosphosulfate binding(GO:0050656) |
| 2.8 | 8.5 | GO:0002114 | interleukin-33 receptor activity(GO:0002114) |
| 2.8 | 8.4 | GO:0035014 | phosphatidylinositol 3-kinase regulator activity(GO:0035014) |
| 2.8 | 16.7 | GO:0015173 | aromatic amino acid transmembrane transporter activity(GO:0015173) |
| 2.8 | 11.1 | GO:0070644 | vitamin D response element binding(GO:0070644) |
| 2.8 | 25.0 | GO:0008239 | dipeptidyl-peptidase activity(GO:0008239) |
| 2.7 | 13.7 | GO:0003886 | DNA (cytosine-5-)-methyltransferase activity(GO:0003886) |
| 2.7 | 8.2 | GO:0001605 | adrenomedullin receptor activity(GO:0001605) |
| 2.7 | 8.0 | GO:0004066 | asparagine synthase (glutamine-hydrolyzing) activity(GO:0004066) |
| 2.6 | 7.8 | GO:0031727 | CCR2 chemokine receptor binding(GO:0031727) |
| 2.6 | 7.8 | GO:0004046 | aminoacylase activity(GO:0004046) |
| 2.6 | 18.0 | GO:0001849 | complement component C1q binding(GO:0001849) |
| 2.6 | 30.9 | GO:0022889 | L-serine transmembrane transporter activity(GO:0015194) serine transmembrane transporter activity(GO:0022889) |
| 2.6 | 7.7 | GO:0003828 | alpha-N-acetylneuraminate alpha-2,8-sialyltransferase activity(GO:0003828) |
| 2.5 | 10.2 | GO:0031726 | CCR1 chemokine receptor binding(GO:0031726) |
| 2.5 | 9.9 | GO:0004052 | arachidonate 12-lipoxygenase activity(GO:0004052) |
| 2.5 | 2.5 | GO:0015116 | sulfate transmembrane transporter activity(GO:0015116) |
| 2.4 | 201.2 | GO:0000980 | RNA polymerase II distal enhancer sequence-specific DNA binding(GO:0000980) |
| 2.4 | 12.1 | GO:0019834 | phospholipase A2 inhibitor activity(GO:0019834) |
| 2.3 | 25.7 | GO:0004653 | polypeptide N-acetylgalactosaminyltransferase activity(GO:0004653) |
| 2.3 | 44.4 | GO:0008009 | chemokine activity(GO:0008009) |
| 2.3 | 7.0 | GO:0019807 | aspartoacylase activity(GO:0019807) |
| 2.3 | 20.8 | GO:0045236 | CXCR chemokine receptor binding(GO:0045236) |
| 2.3 | 13.8 | GO:0008889 | glycerophosphodiester phosphodiesterase activity(GO:0008889) |
| 2.3 | 18.2 | GO:0005021 | vascular endothelial growth factor-activated receptor activity(GO:0005021) |
| 2.3 | 9.1 | GO:0070579 | methylcytosine dioxygenase activity(GO:0070579) |
| 2.3 | 13.6 | GO:0004568 | chitinase activity(GO:0004568) |
| 2.2 | 6.7 | GO:0042895 | antibiotic transporter activity(GO:0042895) |
| 2.2 | 22.1 | GO:0102336 | fatty acid elongase activity(GO:0009922) 3-oxo-arachidoyl-CoA synthase activity(GO:0102336) 3-oxo-cerotoyl-CoA synthase activity(GO:0102337) 3-oxo-lignoceronyl-CoA synthase activity(GO:0102338) |
| 2.2 | 8.6 | GO:0015350 | methotrexate transporter activity(GO:0015350) |
| 2.1 | 73.1 | GO:0042605 | peptide antigen binding(GO:0042605) |
| 2.1 | 87.1 | GO:0005164 | tumor necrosis factor receptor binding(GO:0005164) |
| 2.1 | 18.6 | GO:0043515 | kinetochore binding(GO:0043515) |
| 2.1 | 26.9 | GO:0015924 | mannosyl-oligosaccharide mannosidase activity(GO:0015924) |
| 2.1 | 16.4 | GO:0030274 | LIM domain binding(GO:0030274) |
| 2.0 | 19.9 | GO:0038036 | sphingosine-1-phosphate receptor activity(GO:0038036) |
| 2.0 | 37.4 | GO:0098641 | cadherin binding involved in cell-cell adhesion(GO:0098641) |
| 2.0 | 39.4 | GO:0008199 | ferric iron binding(GO:0008199) |
| 2.0 | 19.6 | GO:0003810 | protein-glutamine gamma-glutamyltransferase activity(GO:0003810) |
| 2.0 | 5.9 | GO:0044715 | 8-oxo-dGDP phosphatase activity(GO:0044715) |
| 2.0 | 2.0 | GO:1903924 | estradiol binding(GO:1903924) |
| 2.0 | 7.8 | GO:0019136 | deoxynucleoside kinase activity(GO:0019136) |
| 1.9 | 5.8 | GO:0030158 | protein xylosyltransferase activity(GO:0030158) |
| 1.9 | 5.8 | GO:0033823 | procollagen-lysine 5-dioxygenase activity(GO:0008475) procollagen glucosyltransferase activity(GO:0033823) |
| 1.9 | 19.2 | GO:0033170 | DNA clamp loader activity(GO:0003689) protein-DNA loading ATPase activity(GO:0033170) |
| 1.9 | 9.3 | GO:0016505 | cysteine-type endopeptidase activator activity involved in apoptotic process(GO:0008656) peptidase activator activity involved in apoptotic process(GO:0016505) |
| 1.8 | 7.4 | GO:0004699 | calcium-independent protein kinase C activity(GO:0004699) |
| 1.8 | 5.5 | GO:0004704 | NF-kappaB-inducing kinase activity(GO:0004704) |
| 1.8 | 7.2 | GO:0004687 | myosin light chain kinase activity(GO:0004687) |
| 1.8 | 82.9 | GO:0005044 | scavenger receptor activity(GO:0005044) |
| 1.8 | 9.0 | GO:0010997 | anaphase-promoting complex binding(GO:0010997) |
| 1.8 | 3.6 | GO:0005157 | macrophage colony-stimulating factor receptor binding(GO:0005157) |
| 1.8 | 16.1 | GO:0008525 | phosphatidylcholine transporter activity(GO:0008525) |
| 1.8 | 3.6 | GO:0015265 | urea channel activity(GO:0015265) |
| 1.8 | 5.4 | GO:0004335 | galactokinase activity(GO:0004335) |
| 1.8 | 10.6 | GO:0003840 | gamma-glutamyltransferase activity(GO:0003840) glutathione hydrolase activity(GO:0036374) |
| 1.8 | 7.0 | GO:0016312 | inositol bisphosphate phosphatase activity(GO:0016312) |
| 1.8 | 7.0 | GO:0071558 | histone demethylase activity (H3-K27 specific)(GO:0071558) |
| 1.7 | 12.2 | GO:0035312 | 5'-3' exodeoxyribonuclease activity(GO:0035312) |
| 1.7 | 6.9 | GO:0061575 | cyclin-dependent protein serine/threonine kinase activator activity(GO:0061575) |
| 1.7 | 5.1 | GO:0004809 | tRNA (guanine-N2-)-methyltransferase activity(GO:0004809) |
| 1.7 | 13.6 | GO:0004749 | ribose phosphate diphosphokinase activity(GO:0004749) |
| 1.7 | 5.1 | GO:0004464 | leukotriene-C4 synthase activity(GO:0004464) |
| 1.7 | 20.3 | GO:0004499 | N,N-dimethylaniline monooxygenase activity(GO:0004499) |
| 1.7 | 11.8 | GO:0098599 | palmitoyl-(protein) hydrolase activity(GO:0008474) palmitoyl hydrolase activity(GO:0098599) |
| 1.7 | 15.1 | GO:0017034 | Rap guanyl-nucleotide exchange factor activity(GO:0017034) |
| 1.7 | 3.3 | GO:0033592 | RNA strand annealing activity(GO:0033592) |
| 1.6 | 6.5 | GO:0034584 | piRNA binding(GO:0034584) |
| 1.6 | 8.1 | GO:0045322 | unmethylated CpG binding(GO:0045322) |
| 1.6 | 9.7 | GO:0032552 | deoxyribonucleotide binding(GO:0032552) purine deoxyribonucleotide binding(GO:0032554) |
| 1.6 | 1.6 | GO:0010385 | double-stranded methylated DNA binding(GO:0010385) |
| 1.6 | 18.9 | GO:0035925 | mRNA 3'-UTR AU-rich region binding(GO:0035925) |
| 1.6 | 10.9 | GO:0097001 | ceramide binding(GO:0097001) |
| 1.5 | 44.5 | GO:0050699 | WW domain binding(GO:0050699) |
| 1.5 | 5.9 | GO:0005138 | interleukin-6 receptor binding(GO:0005138) |
| 1.5 | 17.8 | GO:0004862 | cAMP-dependent protein kinase inhibitor activity(GO:0004862) |
| 1.5 | 7.4 | GO:0008503 | benzodiazepine receptor activity(GO:0008503) |
| 1.5 | 4.4 | GO:0003976 | UDP-N-acetylglucosamine-lysosomal-enzyme N-acetylglucosaminephosphotransferase activity(GO:0003976) |
| 1.5 | 29.1 | GO:0005229 | intracellular calcium activated chloride channel activity(GO:0005229) |
| 1.4 | 7.2 | GO:0035197 | siRNA binding(GO:0035197) |
| 1.4 | 5.7 | GO:0030144 | alpha-1,6-mannosylglycoprotein 6-beta-N-acetylglucosaminyltransferase activity(GO:0030144) |
| 1.4 | 8.6 | GO:0070051 | fibrinogen binding(GO:0070051) |
| 1.4 | 5.7 | GO:0030350 | iron-responsive element binding(GO:0030350) |
| 1.4 | 12.8 | GO:0050897 | cobalt ion binding(GO:0050897) |
| 1.4 | 5.7 | GO:0004967 | glucagon receptor activity(GO:0004967) |
| 1.4 | 7.1 | GO:0051032 | nucleic acid transmembrane transporter activity(GO:0051032) RNA transmembrane transporter activity(GO:0051033) |
| 1.4 | 8.4 | GO:0016493 | C-C chemokine receptor activity(GO:0016493) |
| 1.4 | 4.2 | GO:0046592 | polyamine oxidase activity(GO:0046592) |
| 1.4 | 7.0 | GO:0032052 | bile acid binding(GO:0032052) |
| 1.4 | 9.7 | GO:0016286 | small conductance calcium-activated potassium channel activity(GO:0016286) |
| 1.3 | 4.0 | GO:0004677 | DNA-dependent protein kinase activity(GO:0004677) |
| 1.3 | 6.7 | GO:0098639 | collagen binding involved in cell-matrix adhesion(GO:0098639) |
| 1.3 | 5.4 | GO:0016724 | ferroxidase activity(GO:0004322) oxidoreductase activity, oxidizing metal ions, oxygen as acceptor(GO:0016724) |
| 1.3 | 6.7 | GO:0004974 | leukotriene receptor activity(GO:0004974) |
| 1.3 | 6.7 | GO:0004969 | histamine receptor activity(GO:0004969) |
| 1.3 | 34.6 | GO:0001784 | phosphotyrosine binding(GO:0001784) |
| 1.3 | 3.9 | GO:0003876 | AMP deaminase activity(GO:0003876) adenosine-phosphate deaminase activity(GO:0047623) |
| 1.3 | 11.8 | GO:0035612 | AP-2 adaptor complex binding(GO:0035612) |
| 1.3 | 2.6 | GO:0042015 | interleukin-20 binding(GO:0042015) |
| 1.3 | 7.7 | GO:0004931 | extracellular ATP-gated cation channel activity(GO:0004931) ATP-gated ion channel activity(GO:0035381) |
| 1.3 | 3.8 | GO:0030977 | taurine binding(GO:0030977) |
| 1.2 | 17.5 | GO:0008574 | ATP-dependent microtubule motor activity, plus-end-directed(GO:0008574) |
| 1.2 | 7.5 | GO:0005005 | transmembrane-ephrin receptor activity(GO:0005005) |
| 1.2 | 18.5 | GO:0003906 | DNA-(apurinic or apyrimidinic site) lyase activity(GO:0003906) |
| 1.2 | 60.5 | GO:0004896 | cytokine receptor activity(GO:0004896) |
| 1.2 | 8.6 | GO:0008432 | JUN kinase binding(GO:0008432) |
| 1.2 | 4.9 | GO:0005166 | neurotrophin p75 receptor binding(GO:0005166) |
| 1.2 | 6.1 | GO:0046912 | transferase activity, transferring acyl groups, acyl groups converted into alkyl on transfer(GO:0046912) |
| 1.2 | 17.1 | GO:0031996 | thioesterase binding(GO:0031996) |
| 1.2 | 54.4 | GO:0017112 | Rab guanyl-nucleotide exchange factor activity(GO:0017112) |
| 1.2 | 6.0 | GO:0008310 | single-stranded DNA 3'-5' exodeoxyribonuclease activity(GO:0008310) |
| 1.2 | 7.2 | GO:0034647 | histone demethylase activity (H3-trimethyl-K4 specific)(GO:0034647) |
| 1.2 | 14.4 | GO:0022820 | potassium:chloride symporter activity(GO:0015379) potassium ion symporter activity(GO:0022820) |
| 1.2 | 15.5 | GO:0003796 | lysozyme activity(GO:0003796) |
| 1.2 | 4.7 | GO:0000822 | inositol hexakisphosphate binding(GO:0000822) |
| 1.2 | 7.1 | GO:0016175 | superoxide-generating NADPH oxidase activity(GO:0016175) |
| 1.2 | 3.5 | GO:0005220 | inositol 1,4,5-trisphosphate-sensitive calcium-release channel activity(GO:0005220) |
| 1.2 | 3.5 | GO:0004566 | beta-glucuronidase activity(GO:0004566) |
| 1.2 | 18.5 | GO:0023023 | MHC protein complex binding(GO:0023023) MHC class II protein complex binding(GO:0023026) |
| 1.2 | 10.4 | GO:0005000 | vasopressin receptor activity(GO:0005000) |
| 1.2 | 8.1 | GO:0035184 | histone threonine kinase activity(GO:0035184) |
| 1.1 | 2.3 | GO:0005136 | interleukin-4 receptor binding(GO:0005136) |
| 1.1 | 5.7 | GO:1990254 | keratin filament binding(GO:1990254) |
| 1.1 | 3.4 | GO:0017168 | 5-oxoprolinase (ATP-hydrolyzing) activity(GO:0017168) |
| 1.1 | 20.5 | GO:0008301 | DNA binding, bending(GO:0008301) |
| 1.1 | 22.7 | GO:0017056 | structural constituent of nuclear pore(GO:0017056) |
| 1.1 | 3.4 | GO:0004691 | cAMP-dependent protein kinase activity(GO:0004691) |
| 1.1 | 4.5 | GO:0004430 | 1-phosphatidylinositol 4-kinase activity(GO:0004430) |
| 1.1 | 10.1 | GO:0001730 | 2'-5'-oligoadenylate synthetase activity(GO:0001730) |
| 1.1 | 6.7 | GO:0000150 | recombinase activity(GO:0000150) |
| 1.1 | 5.5 | GO:0043184 | vascular endothelial growth factor receptor 2 binding(GO:0043184) |
| 1.1 | 33.0 | GO:0016676 | cytochrome-c oxidase activity(GO:0004129) heme-copper terminal oxidase activity(GO:0015002) oxidoreductase activity, acting on a heme group of donors, oxygen as acceptor(GO:0016676) |
| 1.1 | 38.4 | GO:0001102 | RNA polymerase II activating transcription factor binding(GO:0001102) |
| 1.1 | 2.2 | GO:0045545 | syndecan binding(GO:0045545) |
| 1.1 | 9.7 | GO:0048407 | platelet-derived growth factor binding(GO:0048407) |
| 1.1 | 21.6 | GO:0004806 | triglyceride lipase activity(GO:0004806) |
| 1.1 | 4.3 | GO:0008265 | Mo-molybdopterin cofactor sulfurase activity(GO:0008265) |
| 1.1 | 7.5 | GO:0048495 | Roundabout binding(GO:0048495) |
| 1.1 | 18.1 | GO:0030676 | Rac guanyl-nucleotide exchange factor activity(GO:0030676) |
| 1.1 | 21.2 | GO:0015106 | bicarbonate transmembrane transporter activity(GO:0015106) |
| 1.1 | 6.3 | GO:0046920 | alpha-(1->3)-fucosyltransferase activity(GO:0046920) |
| 1.1 | 3.2 | GO:0010484 | H3 histone acetyltransferase activity(GO:0010484) |
| 1.0 | 2.1 | GO:0030284 | estrogen receptor activity(GO:0030284) |
| 1.0 | 4.1 | GO:0035614 | snRNA stem-loop binding(GO:0035614) |
| 1.0 | 28.9 | GO:0043548 | phosphatidylinositol 3-kinase binding(GO:0043548) |
| 1.0 | 4.1 | GO:0016492 | nerve growth factor receptor activity(GO:0010465) G-protein coupled neurotensin receptor activity(GO:0016492) |
| 1.0 | 15.3 | GO:0035591 | signaling adaptor activity(GO:0035591) |
| 1.0 | 11.2 | GO:0097200 | cysteine-type endopeptidase activity involved in apoptotic process(GO:0097153) cysteine-type endopeptidase activity involved in execution phase of apoptosis(GO:0097200) |
| 1.0 | 9.0 | GO:0022833 | mechanically-gated ion channel activity(GO:0008381) mechanically gated channel activity(GO:0022833) |
| 1.0 | 4.0 | GO:0004711 | ribosomal protein S6 kinase activity(GO:0004711) |
| 1.0 | 12.7 | GO:0043024 | ribosomal small subunit binding(GO:0043024) |
| 1.0 | 6.8 | GO:0046976 | histone methyltransferase activity (H3-K27 specific)(GO:0046976) |
| 1.0 | 3.9 | GO:0016833 | oxo-acid-lyase activity(GO:0016833) |
| 1.0 | 2.9 | GO:0030229 | very-low-density lipoprotein particle receptor activity(GO:0030229) |
| 1.0 | 77.9 | GO:0004197 | cysteine-type endopeptidase activity(GO:0004197) |
| 0.9 | 3.8 | GO:0003835 | beta-galactoside alpha-2,6-sialyltransferase activity(GO:0003835) |
| 0.9 | 15.1 | GO:0004012 | phospholipid-translocating ATPase activity(GO:0004012) |
| 0.9 | 3.7 | GO:0008940 | nitrate reductase activity(GO:0008940) |
| 0.9 | 3.7 | GO:0071936 | coreceptor activity involved in Wnt signaling pathway(GO:0071936) |
| 0.9 | 3.7 | GO:0003836 | beta-galactoside (CMP) alpha-2,3-sialyltransferase activity(GO:0003836) |
| 0.9 | 3.7 | GO:0005415 | nucleoside:sodium symporter activity(GO:0005415) |
| 0.9 | 3.6 | GO:0055077 | gap junction hemi-channel activity(GO:0055077) |
| 0.9 | 25.9 | GO:0003887 | DNA-directed DNA polymerase activity(GO:0003887) |
| 0.9 | 53.4 | GO:0000979 | RNA polymerase II core promoter sequence-specific DNA binding(GO:0000979) |
| 0.9 | 5.3 | GO:0016634 | oxidoreductase activity, acting on the CH-CH group of donors, oxygen as acceptor(GO:0016634) |
| 0.9 | 2.7 | GO:0003945 | N-acetyllactosamine synthase activity(GO:0003945) |
| 0.9 | 2.6 | GO:0042296 | ISG15 transferase activity(GO:0042296) |
| 0.9 | 2.6 | GO:0004020 | adenylylsulfate kinase activity(GO:0004020) sulfate adenylyltransferase activity(GO:0004779) sulfate adenylyltransferase (ATP) activity(GO:0004781) |
| 0.9 | 1.7 | GO:0033142 | progesterone receptor binding(GO:0033142) |
| 0.9 | 15.6 | GO:0032266 | phosphatidylinositol-3-phosphate binding(GO:0032266) |
| 0.8 | 2.5 | GO:0004852 | uroporphyrinogen-III synthase activity(GO:0004852) |
| 0.8 | 5.8 | GO:0052832 | inositol monophosphate 1-phosphatase activity(GO:0008934) inositol monophosphate 3-phosphatase activity(GO:0052832) |
| 0.8 | 3.3 | GO:0072542 | protein phosphatase activator activity(GO:0072542) |
| 0.8 | 3.3 | GO:0015057 | thrombin receptor activity(GO:0015057) |
| 0.8 | 6.6 | GO:0019103 | pyrimidine nucleotide binding(GO:0019103) |
| 0.8 | 5.8 | GO:0005173 | stem cell factor receptor binding(GO:0005173) |
| 0.8 | 7.4 | GO:0000340 | RNA 7-methylguanosine cap binding(GO:0000340) |
| 0.8 | 18.9 | GO:0019825 | oxygen binding(GO:0019825) |
| 0.8 | 21.8 | GO:0031683 | G-protein beta/gamma-subunit complex binding(GO:0031683) |
| 0.8 | 8.9 | GO:0043995 | histone acetyltransferase activity (H4-K5 specific)(GO:0043995) histone acetyltransferase activity (H4-K8 specific)(GO:0043996) histone acetyltransferase activity (H4-K16 specific)(GO:0046972) |
| 0.8 | 20.2 | GO:0071949 | FAD binding(GO:0071949) |
| 0.8 | 2.4 | GO:0015204 | urea transmembrane transporter activity(GO:0015204) |
| 0.8 | 11.9 | GO:0005092 | GDP-dissociation inhibitor activity(GO:0005092) |
| 0.8 | 12.7 | GO:0005522 | profilin binding(GO:0005522) |
| 0.8 | 14.9 | GO:0000993 | RNA polymerase II core binding(GO:0000993) |
| 0.8 | 9.3 | GO:0008097 | 5S rRNA binding(GO:0008097) |
| 0.8 | 3.1 | GO:0004719 | protein-L-isoaspartate (D-aspartate) O-methyltransferase activity(GO:0004719) |
| 0.8 | 4.6 | GO:0030976 | thiamine pyrophosphate binding(GO:0030976) |
| 0.8 | 3.1 | GO:1990599 | 3' overhang single-stranded DNA endodeoxyribonuclease activity(GO:1990599) |
| 0.8 | 2.3 | GO:0048030 | disaccharide binding(GO:0048030) |
| 0.8 | 5.4 | GO:0042030 | ATPase inhibitor activity(GO:0042030) |
| 0.8 | 5.4 | GO:0004630 | phospholipase D activity(GO:0004630) |
| 0.8 | 9.1 | GO:0016868 | intramolecular transferase activity, phosphotransferases(GO:0016868) |
| 0.8 | 5.3 | GO:0048185 | activin binding(GO:0048185) |
| 0.8 | 9.0 | GO:0016857 | racemase and epimerase activity, acting on carbohydrates and derivatives(GO:0016857) |
| 0.7 | 4.4 | GO:0008420 | CTD phosphatase activity(GO:0008420) |
| 0.7 | 8.1 | GO:0003873 | 6-phosphofructo-2-kinase activity(GO:0003873) |
| 0.7 | 7.3 | GO:1904264 | ubiquitin protein ligase activity involved in ERAD pathway(GO:1904264) |
| 0.7 | 13.9 | GO:0046965 | retinoid X receptor binding(GO:0046965) |
| 0.7 | 2.2 | GO:0008107 | galactoside 2-alpha-L-fucosyltransferase activity(GO:0008107) alpha-(1,2)-fucosyltransferase activity(GO:0031127) |
| 0.7 | 1.4 | GO:0051880 | G-quadruplex DNA binding(GO:0051880) |
| 0.7 | 23.0 | GO:0033613 | activating transcription factor binding(GO:0033613) |
| 0.7 | 2.2 | GO:0070878 | primary miRNA binding(GO:0070878) |
| 0.7 | 2.1 | GO:0008520 | L-ascorbate:sodium symporter activity(GO:0008520) L-ascorbic acid transporter activity(GO:0015229) sodium-dependent L-ascorbate transmembrane transporter activity(GO:0070890) |
| 0.7 | 5.6 | GO:0000064 | L-ornithine transmembrane transporter activity(GO:0000064) |
| 0.7 | 14.0 | GO:1990841 | promoter-specific chromatin binding(GO:1990841) |
| 0.7 | 4.9 | GO:0070087 | chromo shadow domain binding(GO:0070087) |
| 0.7 | 19.2 | GO:0004520 | endodeoxyribonuclease activity(GO:0004520) |
| 0.7 | 9.6 | GO:0043522 | leucine zipper domain binding(GO:0043522) |
| 0.7 | 4.8 | GO:0034452 | dynactin binding(GO:0034452) |
| 0.7 | 2.0 | GO:0008417 | fucosyltransferase activity(GO:0008417) |
| 0.7 | 33.9 | GO:0003725 | double-stranded RNA binding(GO:0003725) |
| 0.7 | 6.6 | GO:0015386 | potassium:proton antiporter activity(GO:0015386) |
| 0.7 | 3.9 | GO:0016803 | ether hydrolase activity(GO:0016803) |
| 0.7 | 3.3 | GO:0008140 | cAMP response element binding protein binding(GO:0008140) |
| 0.6 | 6.5 | GO:0004697 | protein kinase C activity(GO:0004697) |
| 0.6 | 19.3 | GO:0005547 | phosphatidylinositol-3,4,5-trisphosphate binding(GO:0005547) |
| 0.6 | 7.0 | GO:0045295 | gamma-catenin binding(GO:0045295) |
| 0.6 | 2.5 | GO:0043423 | 3-phosphoinositide-dependent protein kinase binding(GO:0043423) |
| 0.6 | 5.7 | GO:0071933 | Arp2/3 complex binding(GO:0071933) |
| 0.6 | 3.8 | GO:0070180 | large ribosomal subunit rRNA binding(GO:0070180) |
| 0.6 | 1.8 | GO:0070012 | oligopeptidase activity(GO:0070012) |
| 0.6 | 7.8 | GO:0042975 | peroxisome proliferator activated receptor binding(GO:0042975) |
| 0.6 | 3.6 | GO:0042954 | lipoprotein transporter activity(GO:0042954) |
| 0.6 | 4.2 | GO:0030160 | GKAP/Homer scaffold activity(GO:0030160) |
| 0.6 | 1.8 | GO:0031714 | C5a anaphylatoxin chemotactic receptor binding(GO:0031714) |
| 0.6 | 2.3 | GO:0016428 | tRNA (cytosine-5-)-methyltransferase activity(GO:0016428) |
| 0.6 | 2.3 | GO:0047756 | chondroitin 4-sulfotransferase activity(GO:0047756) |
| 0.6 | 1.7 | GO:0016015 | morphogen activity(GO:0016015) |
| 0.6 | 1.1 | GO:1990269 | RNA polymerase II C-terminal domain phosphoserine binding(GO:1990269) |
| 0.6 | 4.5 | GO:0017169 | CDP-alcohol phosphatidyltransferase activity(GO:0017169) |
| 0.6 | 3.3 | GO:0015016 | [heparan sulfate]-glucosamine N-sulfotransferase activity(GO:0015016) |
| 0.6 | 1.1 | GO:0004331 | fructose-2,6-bisphosphate 2-phosphatase activity(GO:0004331) |
| 0.6 | 1.7 | GO:0036033 | mediator complex binding(GO:0036033) |
| 0.6 | 2.2 | GO:0015165 | pyrimidine nucleotide-sugar transmembrane transporter activity(GO:0015165) |
| 0.6 | 1.1 | GO:0004792 | thiosulfate sulfurtransferase activity(GO:0004792) |
| 0.5 | 2.7 | GO:0001042 | RNA polymerase I core binding(GO:0001042) |
| 0.5 | 5.5 | GO:0015925 | galactosidase activity(GO:0015925) |
| 0.5 | 8.1 | GO:0005247 | voltage-gated chloride channel activity(GO:0005247) |
| 0.5 | 8.4 | GO:0071889 | 14-3-3 protein binding(GO:0071889) |
| 0.5 | 7.9 | GO:0015643 | toxic substance binding(GO:0015643) |
| 0.5 | 5.2 | GO:1901702 | urate transmembrane transporter activity(GO:0015143) salt transmembrane transporter activity(GO:1901702) |
| 0.5 | 6.7 | GO:0004861 | cyclin-dependent protein serine/threonine kinase inhibitor activity(GO:0004861) |
| 0.5 | 10.3 | GO:0050431 | transforming growth factor beta binding(GO:0050431) |
| 0.5 | 1.0 | GO:0043175 | RNA polymerase core enzyme binding(GO:0043175) |
| 0.5 | 2.6 | GO:0008321 | Ral guanyl-nucleotide exchange factor activity(GO:0008321) |
| 0.5 | 2.0 | GO:0070492 | oligosaccharide binding(GO:0070492) |
| 0.5 | 1.5 | GO:0008241 | peptidyl-dipeptidase activity(GO:0008241) |
| 0.5 | 0.5 | GO:0071208 | histone pre-mRNA DCP binding(GO:0071208) |
| 0.5 | 3.0 | GO:0003847 | 1-alkyl-2-acetylglycerophosphocholine esterase activity(GO:0003847) |
| 0.5 | 1.4 | GO:0008142 | oxysterol binding(GO:0008142) |
| 0.5 | 1.0 | GO:0047179 | platelet-activating factor acetyltransferase activity(GO:0047179) |
| 0.5 | 12.9 | GO:0005158 | insulin receptor binding(GO:0005158) |
| 0.5 | 9.6 | GO:0030506 | ankyrin binding(GO:0030506) |
| 0.5 | 4.3 | GO:0045309 | protein phosphorylated amino acid binding(GO:0045309) |
| 0.5 | 1.4 | GO:0043812 | phosphatidylinositol-4-phosphate phosphatase activity(GO:0043812) |
| 0.5 | 2.3 | GO:0008430 | selenium binding(GO:0008430) |
| 0.5 | 3.7 | GO:0015129 | lactate transmembrane transporter activity(GO:0015129) |
| 0.5 | 10.5 | GO:0050681 | androgen receptor binding(GO:0050681) |
| 0.5 | 4.1 | GO:0035497 | cAMP response element binding(GO:0035497) |
| 0.4 | 6.7 | GO:0043274 | phospholipase binding(GO:0043274) |
| 0.4 | 0.4 | GO:0033906 | hyaluronoglucuronidase activity(GO:0033906) |
| 0.4 | 7.2 | GO:0016918 | retinal binding(GO:0016918) |
| 0.4 | 3.1 | GO:0050291 | sphingosine N-acyltransferase activity(GO:0050291) |
| 0.4 | 15.5 | GO:0030374 | ligand-dependent nuclear receptor transcription coactivator activity(GO:0030374) |
| 0.4 | 0.9 | GO:0004127 | cytidylate kinase activity(GO:0004127) |
| 0.4 | 45.4 | GO:0004725 | protein tyrosine phosphatase activity(GO:0004725) |
| 0.4 | 1.7 | GO:0002046 | opsin binding(GO:0002046) |
| 0.4 | 6.8 | GO:0070034 | telomerase RNA binding(GO:0070034) |
| 0.4 | 3.8 | GO:0008553 | hydrogen-exporting ATPase activity, phosphorylative mechanism(GO:0008553) |
| 0.4 | 11.0 | GO:0004712 | protein serine/threonine/tyrosine kinase activity(GO:0004712) |
| 0.4 | 1.3 | GO:0004645 | phosphorylase activity(GO:0004645) |
| 0.4 | 1.3 | GO:0004500 | dopamine beta-monooxygenase activity(GO:0004500) |
| 0.4 | 2.1 | GO:0030620 | U2 snRNA binding(GO:0030620) |
| 0.4 | 2.9 | GO:0016018 | cyclosporin A binding(GO:0016018) |
| 0.4 | 1.2 | GO:0004609 | phosphatidylserine decarboxylase activity(GO:0004609) |
| 0.4 | 4.4 | GO:0008179 | adenylate cyclase binding(GO:0008179) |
| 0.4 | 6.4 | GO:0050840 | extracellular matrix binding(GO:0050840) |
| 0.4 | 22.6 | GO:0005089 | Rho guanyl-nucleotide exchange factor activity(GO:0005089) |
| 0.4 | 22.7 | GO:0031490 | chromatin DNA binding(GO:0031490) |
| 0.4 | 2.3 | GO:1990446 | U1 snRNP binding(GO:1990446) |
| 0.4 | 7.0 | GO:0070577 | lysine-acetylated histone binding(GO:0070577) |
| 0.4 | 1.5 | GO:0051377 | mannose-ethanolamine phosphotransferase activity(GO:0051377) |
| 0.4 | 6.9 | GO:0004115 | 3',5'-cyclic-AMP phosphodiesterase activity(GO:0004115) |
| 0.4 | 11.8 | GO:0051059 | NF-kappaB binding(GO:0051059) |
| 0.4 | 14.9 | GO:0004714 | transmembrane receptor protein tyrosine kinase activity(GO:0004714) |
| 0.4 | 1.1 | GO:0004069 | L-aspartate:2-oxoglutarate aminotransferase activity(GO:0004069) |
| 0.4 | 4.4 | GO:0008373 | sialyltransferase activity(GO:0008373) |
| 0.4 | 0.7 | GO:0004948 | calcitonin receptor activity(GO:0004948) |
| 0.4 | 1.1 | GO:0030297 | transmembrane receptor protein tyrosine kinase activator activity(GO:0030297) |
| 0.4 | 3.6 | GO:1990380 | Lys48-specific deubiquitinase activity(GO:1990380) |
| 0.4 | 3.2 | GO:0047498 | calcium-dependent phospholipase A2 activity(GO:0047498) |
| 0.3 | 3.8 | GO:0008327 | methyl-CpG binding(GO:0008327) |
| 0.3 | 0.7 | GO:0004743 | pyruvate kinase activity(GO:0004743) |
| 0.3 | 3.1 | GO:1902282 | voltage-gated potassium channel activity involved in ventricular cardiac muscle cell action potential repolarization(GO:1902282) |
| 0.3 | 7.5 | GO:0005521 | lamin binding(GO:0005521) |
| 0.3 | 7.1 | GO:0031491 | nucleosome binding(GO:0031491) |
| 0.3 | 3.4 | GO:0070700 | BMP receptor binding(GO:0070700) |
| 0.3 | 2.0 | GO:0004982 | N-formyl peptide receptor activity(GO:0004982) |
| 0.3 | 3.7 | GO:0001205 | transcriptional activator activity, RNA polymerase II distal enhancer sequence-specific binding(GO:0001205) |
| 0.3 | 1.6 | GO:0048273 | mitogen-activated protein kinase p38 binding(GO:0048273) |
| 0.3 | 3.6 | GO:0001047 | core promoter binding(GO:0001047) |
| 0.3 | 1.3 | GO:0016801 | hydrolase activity, acting on ether bonds(GO:0016801) |
| 0.3 | 2.5 | GO:0005123 | death receptor binding(GO:0005123) |
| 0.3 | 4.7 | GO:0017160 | Ral GTPase binding(GO:0017160) |
| 0.3 | 5.7 | GO:0032451 | demethylase activity(GO:0032451) |
| 0.3 | 4.0 | GO:0070063 | RNA polymerase binding(GO:0070063) |
| 0.3 | 1.5 | GO:1990226 | histone methyltransferase binding(GO:1990226) |
| 0.3 | 1.8 | GO:0008046 | axon guidance receptor activity(GO:0008046) |
| 0.3 | 16.5 | GO:0004527 | exonuclease activity(GO:0004527) |
| 0.3 | 38.9 | GO:0042393 | histone binding(GO:0042393) |
| 0.3 | 3.4 | GO:0004622 | lysophospholipase activity(GO:0004622) |
| 0.3 | 3.1 | GO:0045028 | G-protein coupled nucleotide receptor activity(GO:0001608) G-protein coupled purinergic nucleotide receptor activity(GO:0045028) |
| 0.3 | 25.9 | GO:0008201 | heparin binding(GO:0008201) |
| 0.3 | 1.4 | GO:0004849 | uridine kinase activity(GO:0004849) |
| 0.3 | 3.3 | GO:0070008 | serine-type exopeptidase activity(GO:0070008) |
| 0.3 | 0.8 | GO:0042974 | retinoic acid receptor binding(GO:0042974) |
| 0.3 | 1.9 | GO:1990430 | extracellular matrix protein binding(GO:1990430) |
| 0.3 | 2.1 | GO:0045294 | alpha-catenin binding(GO:0045294) |
| 0.3 | 2.9 | GO:0043138 | 3'-5' DNA helicase activity(GO:0043138) |
| 0.3 | 0.8 | GO:0060698 | endoribonuclease inhibitor activity(GO:0060698) |
| 0.3 | 6.1 | GO:0043236 | laminin binding(GO:0043236) |
| 0.3 | 50.6 | GO:0004252 | serine-type endopeptidase activity(GO:0004252) |
| 0.3 | 61.1 | GO:0005096 | GTPase activator activity(GO:0005096) |
| 0.3 | 5.4 | GO:0070003 | threonine-type endopeptidase activity(GO:0004298) threonine-type peptidase activity(GO:0070003) |
| 0.3 | 7.3 | GO:0004402 | histone acetyltransferase activity(GO:0004402) |
| 0.3 | 2.3 | GO:0000983 | transcription factor activity, RNA polymerase II core promoter sequence-specific(GO:0000983) |
| 0.2 | 8.5 | GO:0004601 | peroxidase activity(GO:0004601) |
| 0.2 | 0.7 | GO:0000171 | ribonuclease MRP activity(GO:0000171) |
| 0.2 | 0.9 | GO:0052795 | exo-alpha-(2->3)-sialidase activity(GO:0052794) exo-alpha-(2->6)-sialidase activity(GO:0052795) exo-alpha-(2->8)-sialidase activity(GO:0052796) |
| 0.2 | 1.2 | GO:0004536 | deoxyribonuclease activity(GO:0004536) |
| 0.2 | 1.6 | GO:0045505 | dynein intermediate chain binding(GO:0045505) |
| 0.2 | 7.6 | GO:0003690 | double-stranded DNA binding(GO:0003690) |
| 0.2 | 6.8 | GO:0005160 | transforming growth factor beta receptor binding(GO:0005160) |
| 0.2 | 3.6 | GO:0005149 | interleukin-1 receptor binding(GO:0005149) |
| 0.2 | 1.3 | GO:0003923 | GPI-anchor transamidase activity(GO:0003923) |
| 0.2 | 5.3 | GO:0005385 | zinc ion transmembrane transporter activity(GO:0005385) |
| 0.2 | 2.2 | GO:0016500 | protein-hormone receptor activity(GO:0016500) |
| 0.2 | 3.4 | GO:0046332 | SMAD binding(GO:0046332) |
| 0.2 | 1.0 | GO:0016454 | serine C-palmitoyltransferase activity(GO:0004758) C-palmitoyltransferase activity(GO:0016454) |
| 0.2 | 2.1 | GO:0051011 | microtubule minus-end binding(GO:0051011) |
| 0.2 | 0.4 | GO:0055105 | ubiquitin-protein transferase inhibitor activity(GO:0055105) |
| 0.2 | 2.9 | GO:0051010 | microtubule plus-end binding(GO:0051010) |
| 0.2 | 12.2 | GO:0004869 | cysteine-type endopeptidase inhibitor activity(GO:0004869) |
| 0.2 | 2.8 | GO:0003993 | acid phosphatase activity(GO:0003993) |
| 0.2 | 1.3 | GO:0045504 | dynein heavy chain binding(GO:0045504) |
| 0.2 | 2.4 | GO:0004713 | protein tyrosine kinase activity(GO:0004713) |
| 0.2 | 0.9 | GO:0004367 | glycerol-3-phosphate dehydrogenase [NAD+] activity(GO:0004367) |
| 0.2 | 1.9 | GO:0046527 | glucosyltransferase activity(GO:0046527) |
| 0.2 | 0.7 | GO:0034987 | immunoglobulin receptor binding(GO:0034987) |
| 0.2 | 5.1 | GO:0061631 | ubiquitin conjugating enzyme activity(GO:0061631) |
| 0.2 | 0.8 | GO:0070696 | receptor serine/threonine kinase binding(GO:0033612) transmembrane receptor protein serine/threonine kinase binding(GO:0070696) |
| 0.2 | 0.5 | GO:0031208 | POZ domain binding(GO:0031208) |
| 0.2 | 0.6 | GO:0032896 | palmitoyl-CoA 9-desaturase activity(GO:0032896) |
| 0.2 | 1.1 | GO:0032794 | GTPase activating protein binding(GO:0032794) |
| 0.2 | 3.4 | GO:0003950 | NAD+ ADP-ribosyltransferase activity(GO:0003950) |
| 0.2 | 17.9 | GO:0005057 | receptor signaling protein activity(GO:0005057) |
| 0.1 | 0.9 | GO:0001602 | pancreatic polypeptide receptor activity(GO:0001602) |
| 0.1 | 1.5 | GO:0070064 | proline-rich region binding(GO:0070064) |
| 0.1 | 7.4 | GO:0005518 | collagen binding(GO:0005518) |
| 0.1 | 7.8 | GO:0001948 | glycoprotein binding(GO:0001948) |
| 0.1 | 3.8 | GO:0004693 | cyclin-dependent protein serine/threonine kinase activity(GO:0004693) |
| 0.1 | 18.1 | GO:0004866 | endopeptidase inhibitor activity(GO:0004866) |
| 0.1 | 2.2 | GO:0070530 | K63-linked polyubiquitin binding(GO:0070530) |
| 0.1 | 1.9 | GO:0005537 | mannose binding(GO:0005537) |
| 0.1 | 0.4 | GO:0004793 | threonine aldolase activity(GO:0004793) L-allo-threonine aldolase activity(GO:0008732) |
| 0.1 | 0.6 | GO:0004854 | aldehyde oxidase activity(GO:0004031) xanthine dehydrogenase activity(GO:0004854) oxidoreductase activity, acting on the aldehyde or oxo group of donors, oxygen as acceptor(GO:0016623) oxidoreductase activity, acting on CH or CH2 groups, NAD or NADP as acceptor(GO:0016726) |
| 0.1 | 0.5 | GO:0042731 | PH domain binding(GO:0042731) |
| 0.1 | 30.0 | GO:0045296 | cadherin binding(GO:0045296) |
| 0.1 | 1.3 | GO:0030695 | GTPase regulator activity(GO:0030695) |
| 0.1 | 1.7 | GO:0005351 | sugar:proton symporter activity(GO:0005351) |
| 0.1 | 23.1 | GO:0001077 | transcriptional activator activity, RNA polymerase II core promoter proximal region sequence-specific binding(GO:0001077) |
| 0.1 | 0.8 | GO:0003988 | acetyl-CoA C-acyltransferase activity(GO:0003988) |
| 0.1 | 0.5 | GO:0004169 | dolichyl-phosphate-mannose-protein mannosyltransferase activity(GO:0004169) |
| 0.1 | 0.8 | GO:0047134 | protein-disulfide reductase activity(GO:0047134) |
| 0.1 | 1.1 | GO:0015187 | glycine transmembrane transporter activity(GO:0015187) |
| 0.1 | 0.6 | GO:0003910 | DNA ligase activity(GO:0003909) DNA ligase (ATP) activity(GO:0003910) |
| 0.1 | 7.0 | GO:0043021 | ribonucleoprotein complex binding(GO:0043021) |
| 0.1 | 0.3 | GO:0015222 | serotonin transmembrane transporter activity(GO:0015222) |
| 0.1 | 3.2 | GO:0019894 | kinesin binding(GO:0019894) |
| 0.1 | 4.9 | GO:0003743 | translation initiation factor activity(GO:0003743) |
| 0.1 | 0.9 | GO:0008143 | poly(A) binding(GO:0008143) |
| 0.1 | 0.3 | GO:0015234 | thiamine transmembrane transporter activity(GO:0015234) |
| 0.1 | 7.8 | GO:0019887 | protein kinase regulator activity(GO:0019887) |
| 0.1 | 2.5 | GO:0008094 | DNA-dependent ATPase activity(GO:0008094) |
| 0.1 | 1.7 | GO:0042826 | histone deacetylase binding(GO:0042826) |
| 0.1 | 0.5 | GO:0001098 | basal transcription machinery binding(GO:0001098) basal RNA polymerase II transcription machinery binding(GO:0001099) |
| 0.1 | 0.7 | GO:0046875 | ephrin receptor binding(GO:0046875) |
| 0.1 | 0.5 | GO:0070273 | phosphatidylinositol-4-phosphate binding(GO:0070273) |
| 0.0 | 0.4 | GO:0008236 | serine-type peptidase activity(GO:0008236) |
| 0.0 | 0.3 | GO:0004596 | peptide alpha-N-acetyltransferase activity(GO:0004596) |
| 0.0 | 0.3 | GO:0008318 | protein prenyltransferase activity(GO:0008318) |
| 0.0 | 5.3 | GO:0001078 | transcriptional repressor activity, RNA polymerase II core promoter proximal region sequence-specific binding(GO:0001078) |
| 0.0 | 0.3 | GO:0008273 | calcium, potassium:sodium antiporter activity(GO:0008273) |
| 0.0 | 0.5 | GO:0050072 | m7G(5')pppN diphosphatase activity(GO:0050072) |
| 0.0 | 8.6 | GO:0003682 | chromatin binding(GO:0003682) |
| 0.0 | 0.1 | GO:0004839 | ubiquitin activating enzyme activity(GO:0004839) |
| 0.0 | 1.1 | GO:0031624 | ubiquitin conjugating enzyme binding(GO:0031624) |
| 0.0 | 0.2 | GO:0070300 | phosphatidic acid binding(GO:0070300) |
| 0.0 | 0.1 | GO:0016433 | rRNA (adenine) methyltransferase activity(GO:0016433) |
| 0.0 | 0.4 | GO:0004143 | diacylglycerol kinase activity(GO:0004143) |
| 0.0 | 0.3 | GO:0001054 | RNA polymerase I activity(GO:0001054) |
| 0.0 | 10.2 | GO:0043565 | sequence-specific DNA binding(GO:0043565) |
| 0.0 | 1.3 | GO:0004540 | ribonuclease activity(GO:0004540) |
| 0.0 | 0.2 | GO:0008172 | S-methyltransferase activity(GO:0008172) |
| 0.0 | 0.1 | GO:0004452 | isopentenyl-diphosphate delta-isomerase activity(GO:0004452) |
| 0.0 | 0.2 | GO:0042800 | histone methyltransferase activity (H3-K4 specific)(GO:0042800) |
| 0.0 | 0.2 | GO:0042169 | SH2 domain binding(GO:0042169) |
Gene overrepresentation in curated gene sets: canonical pathways category:
| Log-likelihood per target | Total log-likelihood | Term | Description |
|---|---|---|---|
| 5.3 | 74.0 | PID TCR JNK PATHWAY | JNK signaling in the CD4+ TCR pathway |
| 4.7 | 32.7 | ST PAC1 RECEPTOR PATHWAY | PAC1 Receptor Pathway |
| 4.5 | 31.6 | PID IL5 PATHWAY | IL5-mediated signaling events |
| 4.2 | 194.1 | PID IL2 STAT5 PATHWAY | IL2 signaling events mediated by STAT5 |
| 4.1 | 119.0 | PID INTEGRIN CS PATHWAY | Integrin family cell surface interactions |
| 4.0 | 139.3 | PID IL8 CXCR2 PATHWAY | IL8- and CXCR2-mediated signaling events |
| 3.2 | 92.6 | PID EPO PATHWAY | EPO signaling pathway |
| 3.1 | 159.4 | PID BCR 5PATHWAY | BCR signaling pathway |
| 2.8 | 50.9 | SA MMP CYTOKINE CONNECTION | Cytokines can induce activation of matrix metalloproteinases, which degrade extracellular matrix. |
| 2.6 | 13.1 | PID TCR RAS PATHWAY | Ras signaling in the CD4+ TCR pathway |
| 2.5 | 5.0 | PID ANTHRAX PATHWAY | Cellular roles of Anthrax toxin |
| 2.3 | 70.5 | PID CD8 TCR PATHWAY | TCR signaling in naïve CD8+ T cells |
| 2.3 | 70.0 | PID IL12 2PATHWAY | IL12-mediated signaling events |
| 2.3 | 40.6 | PID IL27 PATHWAY | IL27-mediated signaling events |
| 2.0 | 19.9 | SA G2 AND M PHASES | Cdc25 activates the cdc2/cyclin B complex to induce the G2/M transition. |
| 1.9 | 11.3 | PID S1P S1P4 PATHWAY | S1P4 pathway |
| 1.9 | 14.8 | PID LYMPH ANGIOGENESIS PATHWAY | VEGFR3 signaling in lymphatic endothelium |
| 1.8 | 11.1 | ST TYPE I INTERFERON PATHWAY | Type I Interferon (alpha/beta IFN) Pathway |
| 1.8 | 54.0 | PID TXA2PATHWAY | Thromboxane A2 receptor signaling |
| 1.7 | 25.2 | PID CXCR4 PATHWAY | CXCR4-mediated signaling events |
| 1.7 | 61.7 | PID ARF6 PATHWAY | Arf6 signaling events |
| 1.7 | 28.3 | PID EPHRINB REV PATHWAY | Ephrin B reverse signaling |
| 1.7 | 23.3 | PID CD40 PATHWAY | CD40/CD40L signaling |
| 1.6 | 9.4 | PID GMCSF PATHWAY | GMCSF-mediated signaling events |
| 1.5 | 78.3 | PID RAC1 PATHWAY | RAC1 signaling pathway |
| 1.5 | 59.5 | PID VEGFR1 2 PATHWAY | Signaling events mediated by VEGFR1 and VEGFR2 |
| 1.5 | 11.7 | PID S1P S1P3 PATHWAY | S1P3 pathway |
| 1.4 | 55.1 | PID TAP63 PATHWAY | Validated transcriptional targets of TAp63 isoforms |
| 1.4 | 25.1 | PID DNA PK PATHWAY | DNA-PK pathway in nonhomologous end joining |
| 1.4 | 27.9 | PID TOLL ENDOGENOUS PATHWAY | Endogenous TLR signaling |
| 1.4 | 18.0 | PID TCPTP PATHWAY | Signaling events mediated by TCPTP |
| 1.4 | 33.2 | PID RETINOIC ACID PATHWAY | Retinoic acid receptors-mediated signaling |
| 1.4 | 19.4 | PID CXCR3 PATHWAY | CXCR3-mediated signaling events |
| 1.4 | 6.9 | PID ERBB1 RECEPTOR PROXIMAL PATHWAY | EGF receptor (ErbB1) signaling pathway |
| 1.4 | 85.8 | PID DELTA NP63 PATHWAY | Validated transcriptional targets of deltaNp63 isoforms |
| 1.3 | 71.3 | PID CASPASE PATHWAY | Caspase cascade in apoptosis |
| 1.3 | 9.2 | PID TCR PATHWAY | TCR signaling in naïve CD4+ T cells |
| 1.3 | 19.5 | PID INTEGRIN4 PATHWAY | Alpha6 beta4 integrin-ligand interactions |
| 1.3 | 23.0 | ST GA12 PATHWAY | G alpha 12 Pathway |
| 1.3 | 2.5 | PID IL8 CXCR1 PATHWAY | IL8- and CXCR1-mediated signaling events |
| 1.2 | 24.9 | PID CDC42 REG PATHWAY | Regulation of CDC42 activity |
| 1.2 | 39.6 | PID IL4 2PATHWAY | IL4-mediated signaling events |
| 1.2 | 38.9 | PID RHOA PATHWAY | RhoA signaling pathway |
| 1.2 | 39.7 | PID FOXM1 PATHWAY | FOXM1 transcription factor network |
| 1.2 | 17.8 | PID PI3KCI PATHWAY | Class I PI3K signaling events |
| 1.2 | 16.3 | PID INTEGRIN A9B1 PATHWAY | Alpha9 beta1 integrin signaling events |
| 1.2 | 18.5 | PID FCER1 PATHWAY | Fc-epsilon receptor I signaling in mast cells |
| 1.1 | 14.8 | PID HNF3A PATHWAY | FOXA1 transcription factor network |
| 1.1 | 5.6 | PID HIV NEF PATHWAY | HIV-1 Nef: Negative effector of Fas and TNF-alpha |
| 1.1 | 63.6 | PID MYC REPRESS PATHWAY | Validated targets of C-MYC transcriptional repression |
| 1.1 | 168.1 | NABA ECM AFFILIATED | Genes encoding proteins affiliated structurally or functionally to extracellular matrix proteins |
| 1.1 | 35.2 | PID NFAT TFPATHWAY | Calcineurin-regulated NFAT-dependent transcription in lymphocytes |
| 1.1 | 11.9 | PID NFKAPPAB CANONICAL PATHWAY | Canonical NF-kappaB pathway |
| 1.1 | 3.2 | SA B CELL RECEPTOR COMPLEXES | Antigen binding to B cell receptors activates protein tyrosine kinases, such as the Src family, which ultimate activate MAP kinases. |
| 1.1 | 10.6 | PID INTEGRIN2 PATHWAY | Beta2 integrin cell surface interactions |
| 1.0 | 34.8 | PID AR TF PATHWAY | Regulation of Androgen receptor activity |
| 0.9 | 47.4 | PID RHOA REG PATHWAY | Regulation of RhoA activity |
| 0.8 | 19.9 | PID ECADHERIN STABILIZATION PATHWAY | Stabilization and expansion of the E-cadherin adherens junction |
| 0.8 | 9.0 | PID SMAD2 3PATHWAY | Regulation of cytoplasmic and nuclear SMAD2/3 signaling |
| 0.7 | 38.7 | PID HDAC CLASSI PATHWAY | Signaling events mediated by HDAC Class I |
| 0.7 | 4.4 | SA G1 AND S PHASES | Cdk2, 4, and 6 bind cyclin D in G1, while cdk2/cyclin E promotes the G1/S transition. |
| 0.7 | 13.7 | PID INTEGRIN3 PATHWAY | Beta3 integrin cell surface interactions |
| 0.7 | 4.1 | PID NEPHRIN NEPH1 PATHWAY | Nephrin/Neph1 signaling in the kidney podocyte |
| 0.7 | 26.8 | PID SMAD2 3NUCLEAR PATHWAY | Regulation of nuclear SMAD2/3 signaling |
| 0.6 | 10.1 | PID ERBB4 PATHWAY | ErbB4 signaling events |
| 0.6 | 23.7 | PID AR PATHWAY | Coregulation of Androgen receptor activity |
| 0.6 | 7.4 | PID WNT CANONICAL PATHWAY | Canonical Wnt signaling pathway |
| 0.6 | 4.9 | PID AJDISS 2PATHWAY | Posttranslational regulation of adherens junction stability and dissassembly |
| 0.6 | 6.0 | PID IL23 PATHWAY | IL23-mediated signaling events |
| 0.6 | 18.0 | PID PS1 PATHWAY | Presenilin action in Notch and Wnt signaling |
| 0.6 | 21.6 | PID AURORA B PATHWAY | Aurora B signaling |
| 0.6 | 9.0 | PID AMB2 NEUTROPHILS PATHWAY | amb2 Integrin signaling |
| 0.6 | 7.1 | PID IL6 7 PATHWAY | IL6-mediated signaling events |
| 0.6 | 7.7 | PID UPA UPAR PATHWAY | Urokinase-type plasminogen activator (uPA) and uPAR-mediated signaling |
| 0.6 | 5.9 | PID SYNDECAN 2 PATHWAY | Syndecan-2-mediated signaling events |
| 0.5 | 7.0 | PID ECADHERIN NASCENT AJ PATHWAY | E-cadherin signaling in the nascent adherens junction |
| 0.5 | 2.6 | PID VEGF VEGFR PATHWAY | VEGF and VEGFR signaling network |
| 0.5 | 22.4 | PID FANCONI PATHWAY | Fanconi anemia pathway |
| 0.5 | 6.0 | PID EPHB FWD PATHWAY | EPHB forward signaling |
| 0.5 | 5.0 | PID INTEGRIN1 PATHWAY | Beta1 integrin cell surface interactions |
| 0.4 | 9.9 | PID P38 ALPHA BETA DOWNSTREAM PATHWAY | Signaling mediated by p38-alpha and p38-beta |
| 0.4 | 5.8 | PID NCADHERIN PATHWAY | N-cadherin signaling events |
| 0.4 | 4.0 | PID ANGIOPOIETIN RECEPTOR PATHWAY | Angiopoietin receptor Tie2-mediated signaling |
| 0.4 | 2.4 | SIG PIP3 SIGNALING IN B LYMPHOCYTES | Genes related to PIP3 signaling in B lymphocytes |
| 0.4 | 3.1 | PID WNT NONCANONICAL PATHWAY | Noncanonical Wnt signaling pathway |
| 0.4 | 10.2 | PID ILK PATHWAY | Integrin-linked kinase signaling |
| 0.3 | 7.9 | NABA BASEMENT MEMBRANES | Genes encoding structural components of basement membranes |
| 0.3 | 2.3 | PID CD8 TCR DOWNSTREAM PATHWAY | Downstream signaling in naïve CD8+ T cells |
| 0.3 | 8.5 | PID BMP PATHWAY | BMP receptor signaling |
| 0.3 | 1.9 | PID BARD1 PATHWAY | BARD1 signaling events |
| 0.3 | 4.5 | PID ARF 3PATHWAY | Arf1 pathway |
| 0.3 | 2.9 | PID PTP1B PATHWAY | Signaling events mediated by PTP1B |
| 0.3 | 20.5 | PID P53 DOWNSTREAM PATHWAY | Direct p53 effectors |
| 0.2 | 1.0 | PID FAK PATHWAY | Signaling events mediated by focal adhesion kinase |
| 0.2 | 3.3 | PID INSULIN PATHWAY | Insulin Pathway |
| 0.2 | 4.0 | PID ATM PATHWAY | ATM pathway |
| 0.2 | 2.1 | PID MAPK TRK PATHWAY | Trk receptor signaling mediated by the MAPK pathway |
| 0.2 | 3.0 | PID MET PATHWAY | Signaling events mediated by Hepatocyte Growth Factor Receptor (c-Met) |
| 0.2 | 3.0 | PID KIT PATHWAY | Signaling events mediated by Stem cell factor receptor (c-Kit) |
| 0.2 | 2.5 | PID RET PATHWAY | Signaling events regulated by Ret tyrosine kinase |
| 0.2 | 4.7 | PID ENDOTHELIN PATHWAY | Endothelins |
| 0.2 | 2.7 | PID ARF6 TRAFFICKING PATHWAY | Arf6 trafficking events |
| 0.2 | 4.2 | PID TGFBR PATHWAY | TGF-beta receptor signaling |
| 0.2 | 3.0 | ST WNT CA2 CYCLIC GMP PATHWAY | Wnt/Ca2+/cyclic GMP signaling. |
| 0.1 | 3.5 | PID TELOMERASE PATHWAY | Regulation of Telomerase |
| 0.1 | 1.2 | PID IL1 PATHWAY | IL1-mediated signaling events |
| 0.1 | 2.6 | PID REG GR PATHWAY | Glucocorticoid receptor regulatory network |
| 0.1 | 17.8 | NABA ECM GLYCOPROTEINS | Genes encoding structural ECM glycoproteins |
| 0.1 | 1.6 | PID SHP2 PATHWAY | SHP2 signaling |
| 0.1 | 1.8 | PID NOTCH PATHWAY | Notch signaling pathway |
| 0.0 | 0.5 | PID AURORA A PATHWAY | Aurora A signaling |
| 0.0 | 0.8 | PID ERBB1 DOWNSTREAM PATHWAY | ErbB1 downstream signaling |
| 0.0 | 1.1 | PID E2F PATHWAY | E2F transcription factor network |
| 0.0 | 0.1 | PID RHODOPSIN PATHWAY | Visual signal transduction: Rods |
| 0.0 | 0.1 | PID P38 MKK3 6PATHWAY | p38 MAPK signaling pathway |
Gene overrepresentation in curated gene sets: REACTOME pathways category:
| Log-likelihood per target | Total log-likelihood | Term | Description |
|---|---|---|---|
| 11.3 | 11.3 | REACTOME TRANSLOCATION OF ZAP 70 TO IMMUNOLOGICAL SYNAPSE | Genes involved in Translocation of ZAP-70 to Immunological synapse |
| 7.9 | 63.2 | REACTOME PROSTANOID LIGAND RECEPTORS | Genes involved in Prostanoid ligand receptors |
| 4.9 | 187.6 | REACTOME IL RECEPTOR SHC SIGNALING | Genes involved in Interleukin receptor SHC signaling |
| 4.5 | 13.5 | REACTOME CYCLIN E ASSOCIATED EVENTS DURING G1 S TRANSITION | Genes involved in Cyclin E associated events during G1/S transition |
| 4.0 | 43.5 | REACTOME IL 6 SIGNALING | Genes involved in Interleukin-6 signaling |
| 3.7 | 37.3 | REACTOME PHOSPHORYLATION OF CD3 AND TCR ZETA CHAINS | Genes involved in Phosphorylation of CD3 and TCR zeta chains |
| 3.6 | 17.9 | REACTOME BINDING AND ENTRY OF HIV VIRION | Genes involved in Binding and entry of HIV virion |
| 3.6 | 50.0 | REACTOME REGULATION OF COMPLEMENT CASCADE | Genes involved in Regulation of Complement cascade |
| 3.4 | 147.6 | REACTOME IMMUNOREGULATORY INTERACTIONS BETWEEN A LYMPHOID AND A NON LYMPHOID CELL | Genes involved in Immunoregulatory interactions between a Lymphoid and a non-Lymphoid cell |
| 3.3 | 63.4 | REACTOME GENERATION OF SECOND MESSENGER MOLECULES | Genes involved in Generation of second messenger molecules |
| 3.3 | 109.4 | REACTOME TIGHT JUNCTION INTERACTIONS | Genes involved in Tight junction interactions |
| 3.2 | 9.5 | REACTOME XENOBIOTICS | Genes involved in Xenobiotics |
| 3.1 | 147.0 | REACTOME CHEMOKINE RECEPTORS BIND CHEMOKINES | Genes involved in Chemokine receptors bind chemokines |
| 3.0 | 26.6 | REACTOME TRAF6 MEDIATED IRF7 ACTIVATION IN TLR7 8 OR 9 SIGNALING | Genes involved in TRAF6 mediated IRF7 activation in TLR7/8 or 9 signaling |
| 3.0 | 56.2 | REACTOME PRE NOTCH PROCESSING IN GOLGI | Genes involved in Pre-NOTCH Processing in Golgi |
| 2.9 | 71.8 | REACTOME GPVI MEDIATED ACTIVATION CASCADE | Genes involved in GPVI-mediated activation cascade |
| 2.8 | 5.7 | REACTOME GLUCAGON SIGNALING IN METABOLIC REGULATION | Genes involved in Glucagon signaling in metabolic regulation |
| 2.6 | 41.6 | REACTOME ACYL CHAIN REMODELLING OF PS | Genes involved in Acyl chain remodelling of PS |
| 2.6 | 43.5 | REACTOME RIP MEDIATED NFKB ACTIVATION VIA DAI | Genes involved in RIP-mediated NFkB activation via DAI |
| 2.5 | 30.6 | REACTOME REGULATION OF SIGNALING BY CBL | Genes involved in Regulation of signaling by CBL |
| 2.5 | 20.3 | REACTOME IL 3 5 AND GM CSF SIGNALING | Genes involved in Interleukin-3, 5 and GM-CSF signaling |
| 2.4 | 24.1 | REACTOME REGULATION OF INSULIN SECRETION BY ACETYLCHOLINE | Genes involved in Regulation of Insulin Secretion by Acetylcholine |
| 2.3 | 32.9 | REACTOME RAP1 SIGNALLING | Genes involved in Rap1 signalling |
| 2.3 | 4.7 | REACTOME ENDOSOMAL VACUOLAR PATHWAY | Genes involved in Endosomal/Vacuolar pathway |
| 2.3 | 25.6 | REACTOME THE ROLE OF NEF IN HIV1 REPLICATION AND DISEASE PATHOGENESIS | Genes involved in The role of Nef in HIV-1 replication and disease pathogenesis |
| 2.3 | 6.9 | REACTOME APC C CDC20 MEDIATED DEGRADATION OF CYCLIN B | Genes involved in APC/C:Cdc20 mediated degradation of Cyclin B |
| 2.3 | 29.6 | REACTOME LYSOSOME VESICLE BIOGENESIS | Genes involved in Lysosome Vesicle Biogenesis |
| 2.2 | 78.2 | REACTOME LATENT INFECTION OF HOMO SAPIENS WITH MYCOBACTERIUM TUBERCULOSIS | Genes involved in Latent infection of Homo sapiens with Mycobacterium tuberculosis |
| 2.1 | 19.0 | REACTOME SIGNAL REGULATORY PROTEIN SIRP FAMILY INTERACTIONS | Genes involved in Signal regulatory protein (SIRP) family interactions |
| 1.9 | 13.0 | REACTOME NFKB ACTIVATION THROUGH FADD RIP1 PATHWAY MEDIATED BY CASPASE 8 AND10 | Genes involved in NF-kB activation through FADD/RIP-1 pathway mediated by caspase-8 and -10 |
| 1.8 | 25.4 | REACTOME TERMINATION OF O GLYCAN BIOSYNTHESIS | Genes involved in Termination of O-glycan biosynthesis |
| 1.8 | 21.7 | REACTOME VEGF LIGAND RECEPTOR INTERACTIONS | Genes involved in VEGF ligand-receptor interactions |
| 1.7 | 32.0 | REACTOME ABCA TRANSPORTERS IN LIPID HOMEOSTASIS | Genes involved in ABCA transporters in lipid homeostasis |
| 1.7 | 10.0 | REACTOME DEFENSINS | Genes involved in Defensins |
| 1.7 | 16.6 | REACTOME APOPTOSIS INDUCED DNA FRAGMENTATION | Genes involved in Apoptosis induced DNA fragmentation |
| 1.7 | 18.3 | REACTOME GRB2 SOS PROVIDES LINKAGE TO MAPK SIGNALING FOR INTERGRINS | Genes involved in GRB2:SOS provides linkage to MAPK signaling for Intergrins |
| 1.6 | 45.7 | REACTOME RECYCLING PATHWAY OF L1 | Genes involved in Recycling pathway of L1 |
| 1.6 | 69.0 | REACTOME INTERFERON GAMMA SIGNALING | Genes involved in Interferon gamma signaling |
| 1.6 | 31.1 | REACTOME APC CDC20 MEDIATED DEGRADATION OF NEK2A | Genes involved in APC-Cdc20 mediated degradation of Nek2A |
| 1.5 | 18.4 | REACTOME APOPTOTIC CLEAVAGE OF CELL ADHESION PROTEINS | Genes involved in Apoptotic cleavage of cell adhesion proteins |
| 1.5 | 15.1 | REACTOME REGULATION OF THE FANCONI ANEMIA PATHWAY | Genes involved in Regulation of the Fanconi anemia pathway |
| 1.5 | 57.3 | REACTOME AMINO ACID TRANSPORT ACROSS THE PLASMA MEMBRANE | Genes involved in Amino acid transport across the plasma membrane |
| 1.4 | 17.3 | REACTOME PASSIVE TRANSPORT BY AQUAPORINS | Genes involved in Passive Transport by Aquaporins |
| 1.3 | 16.5 | REACTOME CYCLIN A B1 ASSOCIATED EVENTS DURING G2 M TRANSITION | Genes involved in Cyclin A/B1 associated events during G2/M transition |
| 1.2 | 8.5 | REACTOME REGULATION OF WATER BALANCE BY RENAL AQUAPORINS | Genes involved in Regulation of Water Balance by Renal Aquaporins |
| 1.2 | 18.2 | REACTOME ANTIGEN ACTIVATES B CELL RECEPTOR LEADING TO GENERATION OF SECOND MESSENGERS | Genes involved in Antigen Activates B Cell Receptor Leading to Generation of Second Messengers |
| 1.2 | 9.5 | REACTOME SYNTHESIS SECRETION AND DEACYLATION OF GHRELIN | Genes involved in Synthesis, Secretion, and Deacylation of Ghrelin |
| 1.2 | 6.9 | REACTOME TRANSCRIPTION COUPLED NER TC NER | Genes involved in Transcription-coupled NER (TC-NER) |
| 1.1 | 38.8 | REACTOME COSTIMULATION BY THE CD28 FAMILY | Genes involved in Costimulation by the CD28 family |
| 1.1 | 22.8 | REACTOME TRANSPORT OF RIBONUCLEOPROTEINS INTO THE HOST NUCLEUS | Genes involved in Transport of Ribonucleoproteins into the Host Nucleus |
| 1.1 | 21.4 | REACTOME DESTABILIZATION OF MRNA BY TRISTETRAPROLIN TTP | Genes involved in Destabilization of mRNA by Tristetraprolin (TTP) |
| 1.1 | 6.7 | REACTOME EICOSANOID LIGAND BINDING RECEPTORS | Genes involved in Eicosanoid ligand-binding receptors |
| 1.1 | 3.3 | REACTOME THROMBIN SIGNALLING THROUGH PROTEINASE ACTIVATED RECEPTORS PARS | Genes involved in Thrombin signalling through proteinase activated receptors (PARs) |
| 1.1 | 29.7 | REACTOME METAL ION SLC TRANSPORTERS | Genes involved in Metal ion SLC transporters |
| 1.1 | 8.5 | REACTOME G ALPHA1213 SIGNALLING EVENTS | Genes involved in G alpha (12/13) signalling events |
| 1.0 | 6.3 | REACTOME OXYGEN DEPENDENT PROLINE HYDROXYLATION OF HYPOXIA INDUCIBLE FACTOR ALPHA | Genes involved in Oxygen-dependent Proline Hydroxylation of Hypoxia-inducible Factor Alpha |
| 1.0 | 11.4 | REACTOME TAK1 ACTIVATES NFKB BY PHOSPHORYLATION AND ACTIVATION OF IKKS COMPLEX | Genes involved in TAK1 activates NFkB by phosphorylation and activation of IKKs complex |
| 1.0 | 25.1 | REACTOME ADHERENS JUNCTIONS INTERACTIONS | Genes involved in Adherens junctions interactions |
| 1.0 | 6.0 | REACTOME MEMBRANE BINDING AND TARGETTING OF GAG PROTEINS | Genes involved in Membrane binding and targetting of GAG proteins |
| 1.0 | 14.9 | REACTOME SYNTHESIS SECRETION AND INACTIVATION OF GIP | Genes involved in Synthesis, Secretion, and Inactivation of Glucose-dependent Insulinotropic Polypeptide (GIP) |
| 1.0 | 5.8 | REACTOME REGULATION OF KIT SIGNALING | Genes involved in Regulation of KIT signaling |
| 0.9 | 8.5 | REACTOME TGF BETA RECEPTOR SIGNALING IN EMT EPITHELIAL TO MESENCHYMAL TRANSITION | Genes involved in TGF-beta receptor signaling in EMT (epithelial to mesenchymal transition) |
| 0.9 | 0.9 | REACTOME MRNA DECAY BY 3 TO 5 EXORIBONUCLEASE | Genes involved in mRNA Decay by 3' to 5' Exoribonuclease |
| 0.9 | 14.9 | REACTOME OTHER SEMAPHORIN INTERACTIONS | Genes involved in Other semaphorin interactions |
| 0.9 | 10.2 | REACTOME SLBP DEPENDENT PROCESSING OF REPLICATION DEPENDENT HISTONE PRE MRNAS | Genes involved in SLBP Dependent Processing of Replication-Dependent Histone Pre-mRNAs |
| 0.9 | 70.2 | REACTOME MITOTIC PROMETAPHASE | Genes involved in Mitotic Prometaphase |
| 0.9 | 24.1 | REACTOME SMAD2 SMAD3 SMAD4 HETEROTRIMER REGULATES TRANSCRIPTION | Genes involved in SMAD2/SMAD3:SMAD4 heterotrimer regulates transcription |
| 0.9 | 27.5 | REACTOME INTERFERON ALPHA BETA SIGNALING | Genes involved in Interferon alpha/beta signaling |
| 0.9 | 89.6 | REACTOME FACTORS INVOLVED IN MEGAKARYOCYTE DEVELOPMENT AND PLATELET PRODUCTION | Genes involved in Factors involved in megakaryocyte development and platelet production |
| 0.9 | 9.6 | REACTOME EXTRINSIC PATHWAY FOR APOPTOSIS | Genes involved in Extrinsic Pathway for Apoptosis |
| 0.9 | 15.7 | REACTOME METABOLISM OF POLYAMINES | Genes involved in Metabolism of polyamines |
| 0.8 | 0.8 | REACTOME TRIGLYCERIDE BIOSYNTHESIS | Genes involved in Triglyceride Biosynthesis |
| 0.8 | 5.0 | REACTOME PLATELET SENSITIZATION BY LDL | Genes involved in Platelet sensitization by LDL |
| 0.8 | 2.4 | REACTOME G2 M DNA DAMAGE CHECKPOINT | Genes involved in G2/M DNA damage checkpoint |
| 0.8 | 4.0 | REACTOME DOWNSTREAM TCR SIGNALING | Genes involved in Downstream TCR signaling |
| 0.8 | 11.3 | REACTOME ACTIVATION OF GENES BY ATF4 | Genes involved in Activation of Genes by ATF4 |
| 0.7 | 7.4 | REACTOME DCC MEDIATED ATTRACTIVE SIGNALING | Genes involved in DCC mediated attractive signaling |
| 0.7 | 17.1 | REACTOME DOWNSTREAM SIGNAL TRANSDUCTION | Genes involved in Downstream signal transduction |
| 0.7 | 7.1 | REACTOME N GLYCAN TRIMMING IN THE ER AND CALNEXIN CALRETICULIN CYCLE | Genes involved in N-glycan trimming in the ER and Calnexin/Calreticulin cycle |
| 0.7 | 28.9 | REACTOME INTEGRIN CELL SURFACE INTERACTIONS | Genes involved in Integrin cell surface interactions |
| 0.7 | 4.0 | REACTOME RECEPTOR LIGAND BINDING INITIATES THE SECOND PROTEOLYTIC CLEAVAGE OF NOTCH RECEPTOR | Genes involved in Receptor-ligand binding initiates the second proteolytic cleavage of Notch receptor |
| 0.6 | 5.0 | REACTOME ERKS ARE INACTIVATED | Genes involved in ERKs are inactivated |
| 0.6 | 10.4 | REACTOME FANCONI ANEMIA PATHWAY | Genes involved in Fanconi Anemia pathway |
| 0.6 | 2.8 | REACTOME TRAF6 MEDIATED IRF7 ACTIVATION | Genes involved in TRAF6 mediated IRF7 activation |
| 0.6 | 2.3 | REACTOME APOBEC3G MEDIATED RESISTANCE TO HIV1 INFECTION | Genes involved in APOBEC3G mediated resistance to HIV-1 infection |
| 0.5 | 14.9 | REACTOME DEPOSITION OF NEW CENPA CONTAINING NUCLEOSOMES AT THE CENTROMERE | Genes involved in Deposition of New CENPA-containing Nucleosomes at the Centromere |
| 0.5 | 9.5 | REACTOME SYNTHESIS OF GLYCOSYLPHOSPHATIDYLINOSITOL GPI | Genes involved in Synthesis of glycosylphosphatidylinositol (GPI) |
| 0.5 | 42.4 | REACTOME RESPONSE TO ELEVATED PLATELET CYTOSOLIC CA2 | Genes involved in Response to elevated platelet cytosolic Ca2+ |
| 0.5 | 16.9 | REACTOME EXTENSION OF TELOMERES | Genes involved in Extension of Telomeres |
| 0.5 | 11.2 | REACTOME IL1 SIGNALING | Genes involved in Interleukin-1 signaling |
| 0.5 | 5.6 | REACTOME PLATELET AGGREGATION PLUG FORMATION | Genes involved in Platelet Aggregation (Plug Formation) |
| 0.5 | 15.1 | REACTOME GLUTATHIONE CONJUGATION | Genes involved in Glutathione conjugation |
| 0.5 | 2.9 | REACTOME ACTIVATION OF CHAPERONES BY ATF6 ALPHA | Genes involved in Activation of Chaperones by ATF6-alpha |
| 0.5 | 63.6 | REACTOME SIGNALING BY RHO GTPASES | Genes involved in Signaling by Rho GTPases |
| 0.5 | 10.7 | REACTOME DEGRADATION OF THE EXTRACELLULAR MATRIX | Genes involved in Degradation of the extracellular matrix |
| 0.5 | 27.4 | REACTOME METABOLISM OF VITAMINS AND COFACTORS | Genes involved in Metabolism of vitamins and cofactors |
| 0.5 | 7.8 | REACTOME METABOLISM OF PORPHYRINS | Genes involved in Metabolism of porphyrins |
| 0.5 | 20.6 | REACTOME NOTCH1 INTRACELLULAR DOMAIN REGULATES TRANSCRIPTION | Genes involved in NOTCH1 Intracellular Domain Regulates Transcription |
| 0.5 | 5.0 | REACTOME THE NLRP3 INFLAMMASOME | Genes involved in The NLRP3 inflammasome |
| 0.5 | 7.3 | REACTOME G2 M CHECKPOINTS | Genes involved in G2/M Checkpoints |
| 0.4 | 2.7 | REACTOME TETRAHYDROBIOPTERIN BH4 SYNTHESIS RECYCLING SALVAGE AND REGULATION | Genes involved in Tetrahydrobiopterin (BH4) synthesis, recycling, salvage and regulation |
| 0.4 | 9.8 | REACTOME FATTY ACYL COA BIOSYNTHESIS | Genes involved in Fatty Acyl-CoA Biosynthesis |
| 0.4 | 8.0 | REACTOME PROCESSING OF CAPPED INTRONLESS PRE MRNA | Genes involved in Processing of Capped Intronless Pre-mRNA |
| 0.4 | 7.4 | REACTOME GLUCAGON TYPE LIGAND RECEPTORS | Genes involved in Glucagon-type ligand receptors |
| 0.4 | 9.2 | REACTOME G1 PHASE | Genes involved in G1 Phase |
| 0.4 | 6.1 | REACTOME AMYLOIDS | Genes involved in Amyloids |
| 0.4 | 7.6 | REACTOME N GLYCAN ANTENNAE ELONGATION IN THE MEDIAL TRANS GOLGI | Genes involved in N-glycan antennae elongation in the medial/trans-Golgi |
| 0.4 | 7.3 | REACTOME CIRCADIAN REPRESSION OF EXPRESSION BY REV ERBA | Genes involved in Circadian Repression of Expression by REV-ERBA |
| 0.4 | 28.9 | REACTOME TRANSPORT OF INORGANIC CATIONS ANIONS AND AMINO ACIDS OLIGOPEPTIDES | Genes involved in Transport of inorganic cations/anions and amino acids/oligopeptides |
| 0.4 | 4.1 | REACTOME HORMONE SENSITIVE LIPASE HSL MEDIATED TRIACYLGLYCEROL HYDROLYSIS | Genes involved in Hormone-sensitive lipase (HSL)-mediated triacylglycerol hydrolysis |
| 0.4 | 12.1 | REACTOME SIGNALING BY SCF KIT | Genes involved in Signaling by SCF-KIT |
| 0.3 | 3.5 | REACTOME DNA STRAND ELONGATION | Genes involved in DNA strand elongation |
| 0.3 | 3.2 | REACTOME ELONGATION ARREST AND RECOVERY | Genes involved in Elongation arrest and recovery |
| 0.3 | 0.6 | REACTOME INTERACTIONS OF VPR WITH HOST CELLULAR PROTEINS | Genes involved in Interactions of Vpr with host cellular proteins |
| 0.3 | 1.5 | REACTOME G1 S SPECIFIC TRANSCRIPTION | Genes involved in G1/S-Specific Transcription |
| 0.3 | 2.9 | REACTOME DOWNREGULATION OF ERBB2 ERBB3 SIGNALING | Genes involved in Downregulation of ERBB2:ERBB3 signaling |
| 0.3 | 1.7 | REACTOME MICRORNA MIRNA BIOGENESIS | Genes involved in MicroRNA (miRNA) Biogenesis |
| 0.3 | 2.0 | REACTOME PRE NOTCH EXPRESSION AND PROCESSING | Genes involved in Pre-NOTCH Expression and Processing |
| 0.3 | 3.1 | REACTOME P2Y RECEPTORS | Genes involved in P2Y receptors |
| 0.3 | 2.7 | REACTOME ROLE OF DCC IN REGULATING APOPTOSIS | Genes involved in Role of DCC in regulating apoptosis |
| 0.3 | 4.5 | REACTOME METABOLISM OF NON CODING RNA | Genes involved in Metabolism of non-coding RNA |
| 0.3 | 6.6 | REACTOME RNA POL I TRANSCRIPTION | Genes involved in RNA Polymerase I Transcription |
| 0.3 | 2.1 | REACTOME HYALURONAN UPTAKE AND DEGRADATION | Genes involved in Hyaluronan uptake and degradation |
| 0.3 | 5.1 | REACTOME SYNTHESIS AND INTERCONVERSION OF NUCLEOTIDE DI AND TRIPHOSPHATES | Genes involved in Synthesis and interconversion of nucleotide di- and triphosphates |
| 0.3 | 0.8 | REACTOME TRAF6 MEDIATED INDUCTION OF TAK1 COMPLEX | Genes involved in TRAF6 mediated induction of TAK1 complex |
| 0.3 | 15.6 | REACTOME PI3K CASCADE | Genes involved in PI3K Cascade |
| 0.3 | 1.3 | REACTOME INTEGRATION OF ENERGY METABOLISM | Genes involved in Integration of energy metabolism |
| 0.2 | 23.6 | REACTOME MRNA SPLICING | Genes involved in mRNA Splicing |
| 0.2 | 23.5 | REACTOME PEPTIDE CHAIN ELONGATION | Genes involved in Peptide chain elongation |
| 0.2 | 3.0 | REACTOME KERATAN SULFATE DEGRADATION | Genes involved in Keratan sulfate degradation |
| 0.2 | 2.5 | REACTOME RECYCLING OF BILE ACIDS AND SALTS | Genes involved in Recycling of bile acids and salts |
| 0.2 | 4.5 | REACTOME EFFECTS OF PIP2 HYDROLYSIS | Genes involved in Effects of PIP2 hydrolysis |
| 0.2 | 2.2 | REACTOME HORMONE LIGAND BINDING RECEPTORS | Genes involved in Hormone ligand-binding receptors |
| 0.2 | 1.7 | REACTOME TRYPTOPHAN CATABOLISM | Genes involved in Tryptophan catabolism |
| 0.2 | 2.8 | REACTOME SYNTHESIS OF PIPS AT THE GOLGI MEMBRANE | Genes involved in Synthesis of PIPs at the Golgi membrane |
| 0.2 | 2.7 | REACTOME DEADENYLATION OF MRNA | Genes involved in Deadenylation of mRNA |
| 0.2 | 1.1 | REACTOME TIE2 SIGNALING | Genes involved in Tie2 Signaling |
| 0.2 | 5.5 | REACTOME AMINE COMPOUND SLC TRANSPORTERS | Genes involved in Amine compound SLC transporters |
| 0.2 | 1.7 | REACTOME TGF BETA RECEPTOR SIGNALING ACTIVATES SMADS | Genes involved in TGF-beta receptor signaling activates SMADs |
| 0.2 | 1.3 | REACTOME OPSINS | Genes involved in Opsins |
| 0.2 | 1.1 | REACTOME GAMMA CARBOXYLATION TRANSPORT AND AMINO TERMINAL CLEAVAGE OF PROTEINS | Genes involved in Gamma-carboxylation, transport, and amino-terminal cleavage of proteins |
| 0.2 | 4.6 | REACTOME INTERFERON SIGNALING | Genes involved in Interferon Signaling |
| 0.2 | 8.9 | REACTOME TRANSCRIPTIONAL REGULATION OF WHITE ADIPOCYTE DIFFERENTIATION | Genes involved in Transcriptional Regulation of White Adipocyte Differentiation |
| 0.2 | 0.8 | REACTOME ACTIVATION OF BH3 ONLY PROTEINS | Genes involved in Activation of BH3-only proteins |
| 0.2 | 1.3 | REACTOME POST TRANSLATIONAL MODIFICATION SYNTHESIS OF GPI ANCHORED PROTEINS | Genes involved in Post-translational modification: synthesis of GPI-anchored proteins |
| 0.2 | 3.0 | REACTOME GLUCURONIDATION | Genes involved in Glucuronidation |
| 0.1 | 5.1 | REACTOME TRANS GOLGI NETWORK VESICLE BUDDING | Genes involved in trans-Golgi Network Vesicle Budding |
| 0.1 | 1.5 | REACTOME FACILITATIVE NA INDEPENDENT GLUCOSE TRANSPORTERS | Genes involved in Facilitative Na+-independent glucose transporters |
| 0.1 | 2.4 | REACTOME DOUBLE STRAND BREAK REPAIR | Genes involved in Double-Strand Break Repair |
| 0.1 | 7.0 | REACTOME ANTIGEN PROCESSING CROSS PRESENTATION | Genes involved in Antigen processing-Cross presentation |
| 0.1 | 1.6 | REACTOME NONSENSE MEDIATED DECAY ENHANCED BY THE EXON JUNCTION COMPLEX | Genes involved in Nonsense Mediated Decay Enhanced by the Exon Junction Complex |
| 0.1 | 1.6 | REACTOME SYNTHESIS OF PE | Genes involved in Synthesis of PE |
| 0.1 | 0.3 | REACTOME INFLUENZA VIRAL RNA TRANSCRIPTION AND REPLICATION | Genes involved in Influenza Viral RNA Transcription and Replication |
| 0.1 | 0.3 | REACTOME SIGNALING BY WNT | Genes involved in Signaling by Wnt |
| 0.1 | 2.4 | REACTOME SPHINGOLIPID DE NOVO BIOSYNTHESIS | Genes involved in Sphingolipid de novo biosynthesis |
| 0.1 | 0.5 | REACTOME APOPTOSIS | Genes involved in Apoptosis |
| 0.1 | 1.1 | REACTOME NEGATIVE REGULATORS OF RIG I MDA5 SIGNALING | Genes involved in Negative regulators of RIG-I/MDA5 signaling |
| 0.1 | 1.1 | REACTOME NETRIN1 SIGNALING | Genes involved in Netrin-1 signaling |
| 0.0 | 0.9 | REACTOME SIGNALING BY NOTCH | Genes involved in Signaling by NOTCH |
| 0.0 | 0.8 | REACTOME MYOGENESIS | Genes involved in Myogenesis |
| 0.0 | 0.4 | REACTOME YAP1 AND WWTR1 TAZ STIMULATED GENE EXPRESSION | Genes involved in YAP1- and WWTR1 (TAZ)-stimulated gene expression |
| 0.0 | 0.8 | REACTOME 3 UTR MEDIATED TRANSLATIONAL REGULATION | Genes involved in 3' -UTR-mediated translational regulation |
| 0.0 | 0.6 | REACTOME BASE EXCISION REPAIR | Genes involved in Base Excision Repair |
| 0.0 | 0.1 | REACTOME INHIBITION OF INSULIN SECRETION BY ADRENALINE NORADRENALINE | Genes involved in Inhibition of Insulin Secretion by Adrenaline/Noradrenaline |
| 0.0 | 0.7 | REACTOME ACTIVATION OF CHAPERONE GENES BY XBP1S | Genes involved in Activation of Chaperone Genes by XBP1(S) |
| 0.0 | 0.2 | REACTOME DNA REPAIR | Genes involved in DNA Repair |
| 0.0 | 0.1 | REACTOME ENOS ACTIVATION AND REGULATION | Genes involved in eNOS activation and regulation |
| 0.0 | 0.3 | REACTOME ASSOCIATION OF TRIC CCT WITH TARGET PROTEINS DURING BIOSYNTHESIS | Genes involved in Association of TriC/CCT with target proteins during biosynthesis |