Project
GSE53960: rat RNA-Seq transcriptomic Bodymap
Navigation
Downloads
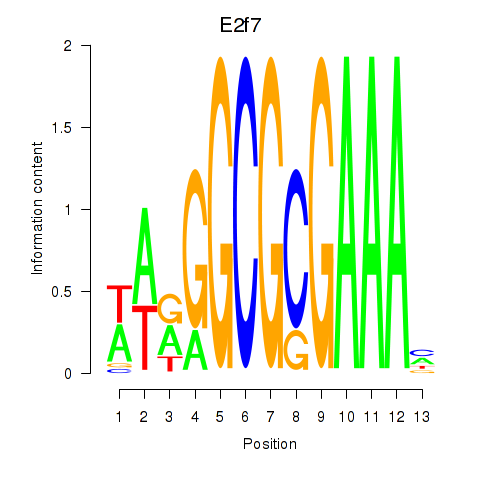
Results for E2f7
Z-value: 1.46
Motif logo
Transcription factors associated with E2f7
| Gene Symbol | Gene ID | Gene Info |
|---|---|---|
|
E2f7
|
ENSRNOG00000026252 | E2F transcription factor 7 |
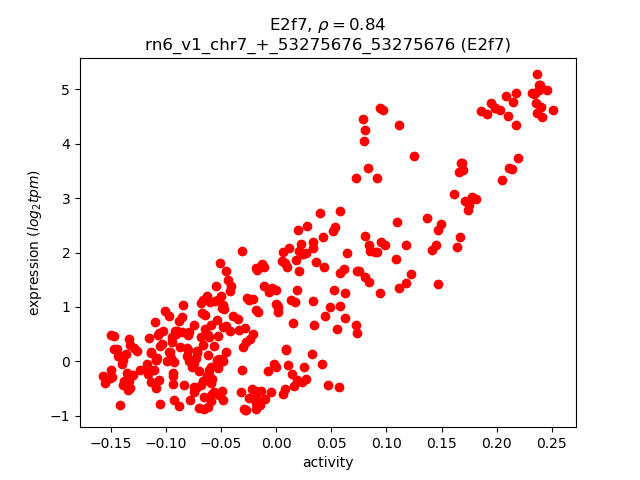
Activity-expression correlation:
| Gene | Promoter | Pearson corr. coef. | P-value | Plot |
|---|---|---|---|---|
| E2f7 | rn6_v1_chr7_+_53275676_53275676 | 0.84 | 6.1e-87 | Click! |
Activity profile of E2f7 motif
Sorted Z-values of E2f7 motif
| Promoter | Log-likelihood | Transcript | Gene | Gene Info |
|---|---|---|---|---|
| chr17_-_44841382 | 92.22 |
ENSRNOT00000080119
|
Hist1h2ak
|
histone cluster 1, H2ak |
| chr17_+_44738643 | 88.60 |
ENSRNOT00000087643
|
LOC100910554
|
histone H2A type 1-like |
| chr17_+_44763598 | 77.51 |
ENSRNOT00000079880
|
Hist1h3b
|
histone cluster 1, H3b |
| chr17_-_44738330 | 75.81 |
ENSRNOT00000072195
|
LOC100364835
|
histone cluster 1, H2bd-like |
| chr17_-_44793927 | 71.82 |
ENSRNOT00000086309
|
Hist1h2bo
|
histone cluster 1 H2B family member o |
| chr17_+_44520537 | 65.37 |
ENSRNOT00000077985
|
hist1h2ail2
|
histone cluster 1, H2ai-like2 |
| chr17_+_44528125 | 64.96 |
ENSRNOT00000084538
|
LOC680322
|
similar to Histone H2A type 1 |
| chr6_+_43884678 | 64.59 |
ENSRNOT00000091551
|
Rrm2
|
ribonucleotide reductase regulatory subunit M2 |
| chr19_+_14523554 | 63.54 |
ENSRNOT00000084271
ENSRNOT00000064731 |
Mcm5
|
minichromosome maintenance complex component 5 |
| chr17_+_44794130 | 62.40 |
ENSRNOT00000077571
|
Hist1h2ac
|
histone cluster 1, H2ac |
| chr3_+_59153280 | 60.11 |
ENSRNOT00000002066
|
Cdca7
|
cell division cycle associated 7 |
| chr17_-_43798383 | 59.16 |
ENSRNOT00000075069
|
LOC684828
|
similar to Histone H1.2 (H1 VAR.1) (H1c) |
| chr17_-_44520240 | 57.21 |
ENSRNOT00000086538
|
Hist1h2bh
|
histone cluster 1 H2B family member h |
| chr20_+_20576377 | 56.74 |
ENSRNOT00000000783
ENSRNOT00000086806 |
Cdk1
|
cyclin-dependent kinase 1 |
| chr3_-_91217491 | 54.86 |
ENSRNOT00000006115
|
Rag1
|
recombination activating 1 |
| chr4_-_69268336 | 53.82 |
ENSRNOT00000018042
|
Prss3b
|
protease, serine, 3B |
| chr17_-_44527801 | 52.58 |
ENSRNOT00000089643
|
Hist1h2bk
|
histone cluster 1 H2B family member k |
| chr13_-_45068077 | 46.12 |
ENSRNOT00000004969
|
Mcm6
|
minichromosome maintenance complex component 6 |
| chr17_-_44815995 | 45.85 |
ENSRNOT00000091201
|
RGD1562378
|
histone H4 variant H4-v.1 |
| chr15_-_42518855 | 44.48 |
ENSRNOT00000076451
|
Esco2
|
establishment of sister chromatid cohesion N-acetyltransferase 2 |
| chr6_+_144291974 | 37.23 |
ENSRNOT00000035255
|
Ncapg2
|
non-SMC condensin II complex, subunit G2 |
| chr4_-_120840111 | 32.19 |
ENSRNOT00000022231
|
Mcm2
|
minichromosome maintenance complex component 2 |
| chr6_-_36940868 | 31.96 |
ENSRNOT00000006470
|
Gen1
|
GEN1 Holliday junction 5' flap endonuclease |
| chr10_+_67427066 | 30.97 |
ENSRNOT00000035642
|
Atad5
|
ATPase family, AAA domain containing 5 |
| chr10_-_25890639 | 27.05 |
ENSRNOT00000085499
|
Hmmr
|
hyaluronan-mediated motility receptor |
| chr17_-_43770561 | 26.81 |
ENSRNOT00000088408
|
RGD1562378
|
histone H4 variant H4-v.1 |
| chr5_+_144581427 | 26.16 |
ENSRNOT00000015227
|
Clspn
|
claspin |
| chr8_-_39201588 | 22.05 |
ENSRNOT00000011226
|
Stt3a
|
STT3A, catalytic subunit of the oligosaccharyltransferase complex |
| chrX_+_29157470 | 21.50 |
ENSRNOT00000081986
|
LOC100910245
|
ribose-phosphate pyrophosphokinase 2-like |
| chr2_-_250778269 | 21.12 |
ENSRNOT00000085670
ENSRNOT00000083535 ENSRNOT00000017824 |
Clca5
|
chloride channel accessory 5 |
| chr11_+_82373870 | 15.67 |
ENSRNOT00000002429
|
Tra2b
|
transformer 2 beta homolog (Drosophila) |
| chr1_+_80056755 | 15.15 |
ENSRNOT00000021221
|
Snrpd2
|
small nuclear ribonucleoprotein D2 polypeptide |
| chr9_-_53732858 | 12.98 |
ENSRNOT00000029204
|
Nemp2
|
nuclear envelope integral membrane protein 2 |
| chr14_+_82356916 | 12.32 |
ENSRNOT00000040229
|
Slbp
|
stem-loop binding protein |
| chr2_+_187893368 | 12.27 |
ENSRNOT00000092031
|
Mex3a
|
mex-3 RNA binding family member A |
| chr6_+_11644578 | 11.49 |
ENSRNOT00000021923
ENSRNOT00000093689 |
Msh6
|
mutS homolog 6 |
| chr10_-_78993045 | 11.46 |
ENSRNOT00000043005
|
LOC100363469
|
ribosomal protein S24-like |
| chr9_+_81783349 | 11.23 |
ENSRNOT00000021548
|
Cnot9
|
CCR4-NOT transcription complex subunit 9 |
| chr11_+_86852711 | 9.71 |
ENSRNOT00000002581
|
Dgcr8
|
DGCR8 microprocessor complex subunit |
| chr10_-_103736973 | 9.57 |
ENSRNOT00000004372
|
Nat9
|
N-acetyltransferase 9 |
| chr1_-_92119951 | 9.49 |
ENSRNOT00000018153
ENSRNOT00000092121 |
Zfp507
|
zinc finger protein 507 |
| chr1_+_100811755 | 8.60 |
ENSRNOT00000074847
|
Nup62
|
nucleoporin 62 |
| chr3_+_114129589 | 8.59 |
ENSRNOT00000056119
|
Terb2
|
telomere repeat binding bouquet formation protein 2 |
| chr1_+_80000165 | 8.35 |
ENSRNOT00000084912
|
Six5
|
SIX homeobox 5 |
| chr1_-_82546937 | 8.24 |
ENSRNOT00000028100
|
Hnrnpul1
|
heterogeneous nuclear ribonucleoprotein U-like 1 |
| chr1_-_80056574 | 7.60 |
ENSRNOT00000021200
|
Qpctl
|
glutaminyl-peptide cyclotransferase-like |
| chr4_-_144318580 | 7.34 |
ENSRNOT00000007591
|
Ssuh2
|
ssu-2 homolog |
| chr15_+_4356261 | 7.11 |
ENSRNOT00000009009
|
Dnajc9
|
DnaJ heat shock protein family (Hsp40) member C9 |
| chr8_+_119135013 | 7.09 |
ENSRNOT00000056114
|
Prss50
|
protease, serine, 50 |
| chr1_+_145770135 | 6.85 |
ENSRNOT00000015320
|
Stard5
|
StAR-related lipid transfer domain containing 5 |
| chr6_-_99783047 | 6.82 |
ENSRNOT00000009028
|
Sptb
|
spectrin, beta, erythrocytic |
| chr8_-_63533546 | 6.70 |
ENSRNOT00000012381
|
Rec114
|
REC114 meiotic recombination protein |
| chr10_+_3218466 | 6.20 |
ENSRNOT00000093629
ENSRNOT00000093338 ENSRNOT00000077695 |
Ntan1
|
N-terminal asparagine amidase |
| chr6_+_10912383 | 5.91 |
ENSRNOT00000061747
ENSRNOT00000086247 |
Ttc7a
|
tetratricopeptide repeat domain 7A |
| chr10_-_57005272 | 5.66 |
ENSRNOT00000026102
|
Pelp1
|
proline, glutamate and leucine rich protein 1 |
| chr3_-_5975734 | 5.41 |
ENSRNOT00000081376
|
Vav2
|
vav guanine nucleotide exchange factor 2 |
| chr12_-_30501860 | 5.40 |
ENSRNOT00000001227
|
Cct6a
|
chaperonin containing TCP1 subunit 6A |
| chr13_+_98857177 | 5.25 |
ENSRNOT00000004232
|
Parp1
|
poly (ADP-ribose) polymerase 1 |
| chr8_+_39960542 | 4.82 |
ENSRNOT00000013370
|
Msantd2
|
Myb/SANT-like DNA-binding domain containing 2 |
| chr3_+_162357356 | 4.36 |
ENSRNOT00000030119
|
Eya2
|
EYA transcriptional coactivator and phosphatase 2 |
| chr17_-_30865419 | 4.33 |
ENSRNOT00000022929
|
Fam50b
|
family with sequence similarity 50, member B |
| chr1_+_226091774 | 4.25 |
ENSRNOT00000027693
|
Fads3
|
fatty acid desaturase 3 |
| chr14_-_86706626 | 4.10 |
ENSRNOT00000082893
|
H2afv
|
H2A histone family, member V |
| chr11_-_89260297 | 4.05 |
ENSRNOT00000057502
|
Spidr
|
scaffolding protein involved in DNA repair |
| chr19_-_44211208 | 3.84 |
ENSRNOT00000026309
|
Adat1
|
adenosine deaminase, tRNA-specific 1 |
| chr4_-_57823283 | 3.59 |
ENSRNOT00000032772
ENSRNOT00000091255 |
Tmem209
|
transmembrane protein 209 |
| chrX_+_54734385 | 3.45 |
ENSRNOT00000005023
|
Nr0b1
|
nuclear receptor subfamily 0, group B, member 1 |
| chr6_+_36941596 | 3.43 |
ENSRNOT00000083383
|
Smc6
|
structural maintenance of chromosomes 6 |
| chr6_+_36941233 | 3.12 |
ENSRNOT00000007073
|
Smc6
|
structural maintenance of chromosomes 6 |
| chrX_+_156812064 | 2.99 |
ENSRNOT00000077142
|
Hcfc1
|
host cell factor C1 |
| chr3_-_176431423 | 2.86 |
ENSRNOT00000037271
|
Ythdf1
|
YTH N(6)-methyladenosine RNA binding protein 1 |
| chr10_+_101288489 | 2.31 |
ENSRNOT00000003511
|
Sox9
|
SRY box 9 |
| chr1_-_72674271 | 1.87 |
ENSRNOT00000023744
|
Kmt5c
|
lysine methyltransferase 5C |
| chr16_-_74072541 | 1.09 |
ENSRNOT00000089722
|
AABR07026361.2
|
|
| chr18_-_72649915 | 0.97 |
ENSRNOT00000072205
|
AABR07032582.1
|
|
| chr2_+_21931493 | 0.66 |
ENSRNOT00000018259
|
Dhfr
|
dihydrofolate reductase |
| chr1_-_200163106 | 0.64 |
ENSRNOT00000027644
|
Mcmbp
|
minichromosome maintenance complex binding protein |
| chr10_+_62650719 | 0.41 |
ENSRNOT00000010691
|
Tp53i13
|
tumor protein p53 inducible protein 13 |
| chr2_-_21931720 | 0.34 |
ENSRNOT00000018449
|
Msh3
|
mutS homolog 3 |
| chr1_+_193335645 | 0.04 |
ENSRNOT00000019640
|
Lcmt1
|
leucine carboxyl methyltransferase 1 |
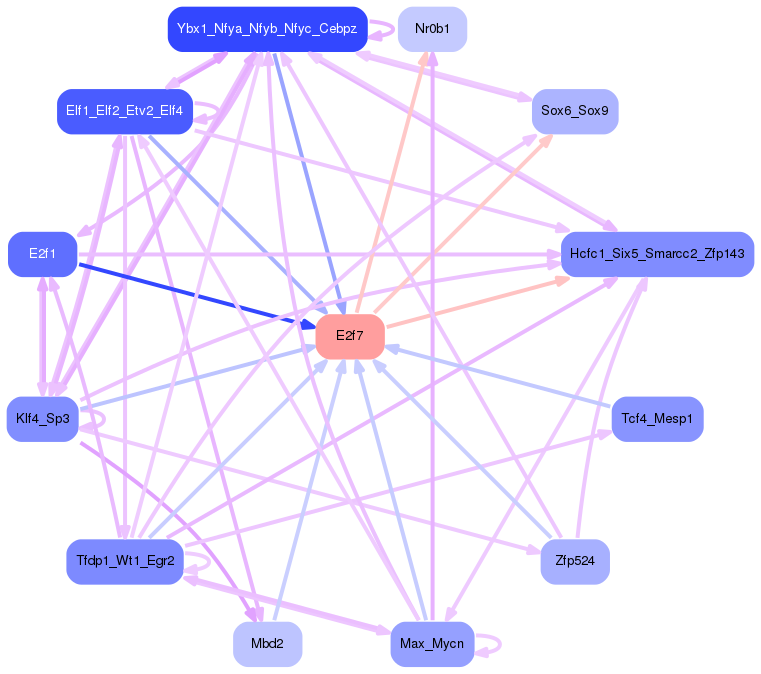
Network of associatons between targets according to the STRING database.

First level regulatory network of E2f7
Gene Ontology Analysis
Gene overrepresentation in biological process category:
| Log-likelihood per target | Total log-likelihood | Term | Description |
|---|---|---|---|
| 13.7 | 54.9 | GO:0002331 | pre-B cell allelic exclusion(GO:0002331) |
| 11.2 | 78.3 | GO:0006268 | DNA unwinding involved in DNA replication(GO:0006268) |
| 11.1 | 44.5 | GO:0034421 | post-translational protein acetylation(GO:0034421) |
| 8.1 | 56.7 | GO:0090166 | Golgi disassembly(GO:0090166) |
| 7.4 | 59.2 | GO:0016584 | nucleosome positioning(GO:0016584) |
| 4.3 | 72.7 | GO:0045653 | negative regulation of megakaryocyte differentiation(GO:0045653) |
| 4.0 | 64.6 | GO:0009263 | deoxyribonucleotide biosynthetic process(GO:0009263) |
| 4.0 | 32.0 | GO:0090267 | positive regulation of spindle checkpoint(GO:0090232) positive regulation of mitotic cell cycle spindle assembly checkpoint(GO:0090267) |
| 3.3 | 312.7 | GO:0006342 | chromatin silencing(GO:0006342) |
| 3.2 | 259.7 | GO:0006334 | nucleosome assembly(GO:0006334) |
| 3.2 | 22.1 | GO:0043686 | co-translational protein modification(GO:0043686) |
| 3.0 | 11.8 | GO:0043570 | maintenance of DNA repeat elements(GO:0043570) |
| 2.9 | 26.2 | GO:0033314 | mitotic DNA replication checkpoint(GO:0033314) |
| 2.9 | 8.6 | GO:0046601 | positive regulation of centriole replication(GO:0046601) regulation of mitotic cytokinesis(GO:1902412) |
| 2.5 | 63.5 | GO:0006270 | DNA replication initiation(GO:0006270) |
| 2.5 | 7.6 | GO:0018199 | peptidyl-glutamine modification(GO:0018199) |
| 2.4 | 31.0 | GO:0048304 | positive regulation of isotype switching to IgG isotypes(GO:0048304) |
| 2.2 | 11.2 | GO:2000327 | positive regulation of ligand-dependent nuclear receptor transcription coactivator activity(GO:2000327) |
| 2.2 | 37.2 | GO:0001833 | inner cell mass cell proliferation(GO:0001833) |
| 2.1 | 12.3 | GO:0006398 | mRNA 3'-end processing by stem-loop binding and cleavage(GO:0006398) |
| 1.9 | 9.7 | GO:0031053 | primary miRNA processing(GO:0031053) |
| 1.7 | 5.2 | GO:0018312 | peptidyl-serine ADP-ribosylation(GO:0018312) myofibroblast differentiation(GO:0036446) protein poly-ADP-ribosylation(GO:0070212) regulation of myofibroblast differentiation(GO:1904760) regulation of interleukin-17 secretion(GO:1905076) negative regulation of interleukin-17 secretion(GO:1905077) |
| 1.2 | 15.7 | GO:0021796 | cerebral cortex regionalization(GO:0021796) |
| 0.8 | 8.6 | GO:0070197 | meiotic telomere tethering at nuclear periphery(GO:0044821) meiotic attachment of telomere to nuclear envelope(GO:0070197) chromosome attachment to the nuclear envelope(GO:0097240) |
| 0.7 | 3.0 | GO:0019042 | viral latency(GO:0019042) release from viral latency(GO:0019046) |
| 0.7 | 6.6 | GO:0000722 | telomere maintenance via recombination(GO:0000722) |
| 0.7 | 8.4 | GO:0014842 | regulation of skeletal muscle satellite cell proliferation(GO:0014842) |
| 0.7 | 4.0 | GO:0072757 | cellular response to camptothecin(GO:0072757) |
| 0.5 | 4.4 | GO:0016576 | histone dephosphorylation(GO:0016576) |
| 0.4 | 15.2 | GO:0000387 | spliceosomal snRNP assembly(GO:0000387) |
| 0.4 | 6.8 | GO:0070508 | sterol import(GO:0035376) cholesterol import(GO:0070508) |
| 0.4 | 53.8 | GO:0007586 | digestion(GO:0007586) |
| 0.3 | 1.9 | GO:0034773 | histone H4-K20 trimethylation(GO:0034773) |
| 0.3 | 11.5 | GO:0000462 | maturation of SSU-rRNA from tricistronic rRNA transcript (SSU-rRNA, 5.8S rRNA, LSU-rRNA)(GO:0000462) |
| 0.2 | 3.5 | GO:0030238 | male sex determination(GO:0030238) |
| 0.2 | 6.8 | GO:0006779 | porphyrin-containing compound biosynthetic process(GO:0006779) |
| 0.2 | 21.5 | GO:0009156 | ribonucleoside monophosphate biosynthetic process(GO:0009156) |
| 0.2 | 21.1 | GO:1902476 | chloride transmembrane transport(GO:1902476) |
| 0.1 | 5.4 | GO:0043552 | positive regulation of phosphatidylinositol 3-kinase activity(GO:0043552) |
| 0.1 | 2.9 | GO:0045948 | positive regulation of translational initiation(GO:0045948) |
| 0.1 | 7.1 | GO:0032781 | positive regulation of ATPase activity(GO:0032781) |
| 0.1 | 0.7 | GO:0046654 | tetrahydrofolate biosynthetic process(GO:0046654) |
| 0.1 | 5.9 | GO:0006879 | cellular iron ion homeostasis(GO:0006879) |
| 0.1 | 5.7 | GO:0071391 | cellular response to estrogen stimulus(GO:0071391) |
| 0.0 | 3.8 | GO:0008033 | tRNA processing(GO:0008033) |
| 0.0 | 4.3 | GO:0009615 | response to virus(GO:0009615) |
| 0.0 | 0.6 | GO:0007062 | sister chromatid cohesion(GO:0007062) |
| 0.0 | 16.0 | GO:0007267 | cell-cell signaling(GO:0007267) |
Gene overrepresentation in cellular component category:
| Log-likelihood per target | Total log-likelihood | Term | Description |
|---|---|---|---|
| 18.9 | 56.7 | GO:0097125 | cyclin B1-CDK1 complex(GO:0097125) |
| 16.1 | 64.6 | GO:0005971 | ribonucleoside-diphosphate reductase complex(GO:0005971) |
| 13.0 | 142.5 | GO:0042555 | MCM complex(GO:0042555) |
| 8.0 | 779.4 | GO:0000786 | nucleosome(GO:0000786) |
| 4.7 | 37.2 | GO:0000796 | condensin complex(GO:0000796) |
| 3.8 | 11.5 | GO:0032301 | MutSalpha complex(GO:0032301) |
| 3.4 | 44.5 | GO:0031618 | nuclear pericentric heterochromatin(GO:0031618) |
| 2.5 | 15.2 | GO:0034715 | pICln-Sm protein complex(GO:0034715) |
| 2.2 | 11.2 | GO:0030015 | CCR4-NOT core complex(GO:0030015) |
| 1.4 | 8.6 | GO:0005642 | annulate lamellae(GO:0005642) |
| 1.4 | 12.3 | GO:0071204 | histone pre-mRNA 3'end processing complex(GO:0071204) |
| 1.3 | 6.6 | GO:0035061 | interchromatin granule(GO:0035061) |
| 1.3 | 22.1 | GO:0008250 | oligosaccharyltransferase complex(GO:0008250) |
| 0.7 | 6.8 | GO:0014731 | spectrin(GO:0008091) spectrin-associated cytoskeleton(GO:0014731) |
| 0.6 | 37.2 | GO:0005637 | nuclear inner membrane(GO:0005637) |
| 0.6 | 5.4 | GO:0002199 | zona pellucida receptor complex(GO:0002199) |
| 0.5 | 9.7 | GO:1902555 | endoribonuclease complex(GO:1902555) |
| 0.4 | 8.2 | GO:0019013 | viral nucleocapsid(GO:0019013) |
| 0.3 | 3.5 | GO:0042788 | polysomal ribosome(GO:0042788) |
| 0.3 | 8.7 | GO:0044665 | MLL1/2 complex(GO:0044665) MLL1 complex(GO:0071339) |
| 0.2 | 11.5 | GO:0022627 | cytosolic small ribosomal subunit(GO:0022627) |
| 0.1 | 1.9 | GO:0005721 | pericentric heterochromatin(GO:0005721) |
| 0.1 | 4.3 | GO:0045171 | intercellular bridge(GO:0045171) |
| 0.1 | 5.2 | GO:0000784 | nuclear chromosome, telomeric region(GO:0000784) |
| 0.0 | 0.3 | GO:0032300 | mismatch repair complex(GO:0032300) |
| 0.0 | 10.0 | GO:0005813 | centrosome(GO:0005813) |
| 0.0 | 29.5 | GO:0005615 | extracellular space(GO:0005615) |
| 0.0 | 11.4 | GO:0009986 | cell surface(GO:0009986) |
| 0.0 | 20.4 | GO:0005794 | Golgi apparatus(GO:0005794) |
| 0.0 | 2.3 | GO:0044798 | nuclear transcription factor complex(GO:0044798) |
Gene overrepresentation in molecular function category:
| Log-likelihood per target | Total log-likelihood | Term | Description |
|---|---|---|---|
| 10.8 | 64.6 | GO:0004748 | ribonucleoside-diphosphate reductase activity, thioredoxin disulfide as acceptor(GO:0004748) oxidoreductase activity, acting on CH or CH2 groups, disulfide as acceptor(GO:0016728) ribonucleoside-diphosphate reductase activity(GO:0061731) |
| 6.8 | 95.7 | GO:0003688 | DNA replication origin binding(GO:0003688) |
| 6.4 | 44.5 | GO:0004468 | lysine N-acetyltransferase activity, acting on acetyl phosphate as donor(GO:0004468) |
| 5.2 | 26.2 | GO:0010997 | anaphase-promoting complex binding(GO:0010997) |
| 3.9 | 11.8 | GO:0032142 | single guanine insertion binding(GO:0032142) |
| 2.9 | 32.0 | GO:0008821 | crossover junction endodeoxyribonuclease activity(GO:0008821) |
| 2.8 | 56.7 | GO:0008353 | RNA polymerase II carboxy-terminal domain kinase activity(GO:0008353) |
| 2.7 | 21.5 | GO:0004749 | ribose phosphate diphosphokinase activity(GO:0004749) |
| 2.4 | 9.7 | GO:0004525 | ribonuclease III activity(GO:0004525) double-stranded RNA-specific ribonuclease activity(GO:0032296) |
| 2.1 | 8.6 | GO:0051425 | PTB domain binding(GO:0051425) |
| 1.9 | 37.2 | GO:0043425 | bHLH transcription factor binding(GO:0043425) |
| 1.7 | 15.2 | GO:1990446 | U1 snRNP binding(GO:1990446) |
| 1.6 | 46.1 | GO:0004003 | ATP-dependent DNA helicase activity(GO:0004003) |
| 1.6 | 22.1 | GO:0004576 | oligosaccharyl transferase activity(GO:0004576) dolichyl-diphosphooligosaccharide-protein glycotransferase activity(GO:0004579) |
| 1.1 | 5.4 | GO:0071987 | WD40-repeat domain binding(GO:0071987) |
| 1.1 | 21.1 | GO:0005229 | intracellular calcium activated chloride channel activity(GO:0005229) |
| 1.0 | 709.6 | GO:0046982 | protein heterodimerization activity(GO:0046982) |
| 1.0 | 27.1 | GO:0005540 | hyaluronic acid binding(GO:0005540) |
| 0.9 | 3.5 | GO:0050682 | AF-2 domain binding(GO:0050682) |
| 0.8 | 28.0 | GO:0036002 | pre-mRNA binding(GO:0036002) |
| 0.8 | 6.8 | GO:0032052 | bile acid binding(GO:0032052) |
| 0.6 | 59.2 | GO:0031490 | chromatin DNA binding(GO:0031490) |
| 0.6 | 1.9 | GO:0042799 | histone methyltransferase activity (H4-K20 specific)(GO:0042799) |
| 0.6 | 5.2 | GO:0003910 | DNA ligase activity(GO:0003909) DNA ligase (ATP) activity(GO:0003910) |
| 0.6 | 2.9 | GO:1990247 | N6-methyladenosine-containing RNA binding(GO:1990247) |
| 0.5 | 54.9 | GO:0004519 | endonuclease activity(GO:0004519) |
| 0.3 | 3.8 | GO:0004000 | adenosine deaminase activity(GO:0004000) |
| 0.3 | 7.6 | GO:0016755 | transferase activity, transferring amino-acyl groups(GO:0016755) |
| 0.3 | 3.0 | GO:0043996 | histone acetyltransferase activity (H4-K5 specific)(GO:0043995) histone acetyltransferase activity (H4-K8 specific)(GO:0043996) histone acetyltransferase activity (H4-K16 specific)(GO:0046972) |
| 0.3 | 7.1 | GO:0070003 | threonine-type endopeptidase activity(GO:0004298) threonine-type peptidase activity(GO:0070003) |
| 0.2 | 40.7 | GO:0004252 | serine-type endopeptidase activity(GO:0004252) |
| 0.2 | 0.7 | GO:0051870 | methotrexate binding(GO:0051870) |
| 0.1 | 14.4 | GO:0031072 | heat shock protein binding(GO:0031072) |
| 0.1 | 9.6 | GO:0008080 | N-acetyltransferase activity(GO:0008080) |
| 0.1 | 5.4 | GO:0005154 | phosphotyrosine binding(GO:0001784) epidermal growth factor receptor binding(GO:0005154) |
| 0.0 | 8.4 | GO:0000978 | RNA polymerase II core promoter proximal region sequence-specific DNA binding(GO:0000978) |
| 0.0 | 3.3 | GO:0000287 | magnesium ion binding(GO:0000287) |
| 0.0 | 9.2 | GO:0042803 | protein homodimerization activity(GO:0042803) |
Gene overrepresentation in curated gene sets: canonical pathways category:
| Log-likelihood per target | Total log-likelihood | Term | Description |
|---|---|---|---|
| 5.6 | 55.7 | SA G2 AND M PHASES | Cdc25 activates the cdc2/cyclin B complex to induce the G2/M transition. |
| 1.2 | 58.4 | PID ATR PATHWAY | ATR signaling pathway |
| 0.8 | 59.3 | PID E2F PATHWAY | E2F transcription factor network |
| 0.2 | 5.2 | SA CASPASE CASCADE | Apoptosis is mediated by caspases, cysteine proteases arranged in a proteolytic cascade. |
| 0.2 | 3.5 | PID ERB GENOMIC PATHWAY | Validated nuclear estrogen receptor beta network |
| 0.2 | 5.7 | PID AR NONGENOMIC PATHWAY | Nongenotropic Androgen signaling |
| 0.2 | 5.4 | PID EPHA2 FWD PATHWAY | EPHA2 forward signaling |
| 0.1 | 8.6 | PID MYC ACTIV PATHWAY | Validated targets of C-MYC transcriptional activation |
| 0.0 | 2.4 | PID P53 DOWNSTREAM PATHWAY | Direct p53 effectors |
Gene overrepresentation in curated gene sets: REACTOME pathways category:
| Log-likelihood per target | Total log-likelihood | Term | Description |
|---|---|---|---|
| 12.9 | 141.8 | REACTOME UNWINDING OF DNA | Genes involved in Unwinding of DNA |
| 12.4 | 321.5 | REACTOME RNA POL I PROMOTER OPENING | Genes involved in RNA Polymerase I Promoter Opening |
| 5.5 | 122.0 | REACTOME G1 S SPECIFIC TRANSCRIPTION | Genes involved in G1/S-Specific Transcription |
| 2.1 | 27.1 | REACTOME HYALURONAN UPTAKE AND DEGRADATION | Genes involved in Hyaluronan uptake and degradation |
| 1.1 | 12.3 | REACTOME SLBP DEPENDENT PROCESSING OF REPLICATION DEPENDENT HISTONE PRE MRNAS | Genes involved in SLBP Dependent Processing of Replication-Dependent Histone Pre-mRNAs |
| 0.5 | 23.8 | REACTOME METABOLISM OF NON CODING RNA | Genes involved in Metabolism of non-coding RNA |
| 0.5 | 9.7 | REACTOME MICRORNA MIRNA BIOGENESIS | Genes involved in MicroRNA (miRNA) Biogenesis |
| 0.2 | 22.1 | REACTOME ASPARAGINE N LINKED GLYCOSYLATION | Genes involved in Asparagine N-linked glycosylation |
| 0.2 | 5.2 | REACTOME DOWNREGULATION OF SMAD2 3 SMAD4 TRANSCRIPTIONAL ACTIVITY | Genes involved in Downregulation of SMAD2/3:SMAD4 transcriptional activity |
| 0.2 | 6.8 | REACTOME STEROID HORMONES | Genes involved in Steroid hormones |
| 0.2 | 6.8 | REACTOME INTERACTION BETWEEN L1 AND ANKYRINS | Genes involved in Interaction between L1 and Ankyrins |
| 0.0 | 3.5 | REACTOME NUCLEAR RECEPTOR TRANSCRIPTION PATHWAY | Genes involved in Nuclear Receptor transcription pathway |
| 0.0 | 4.4 | REACTOME MRNA SPLICING | Genes involved in mRNA Splicing |