Project
GSE53960: rat RNA-Seq transcriptomic Bodymap
Navigation
Downloads
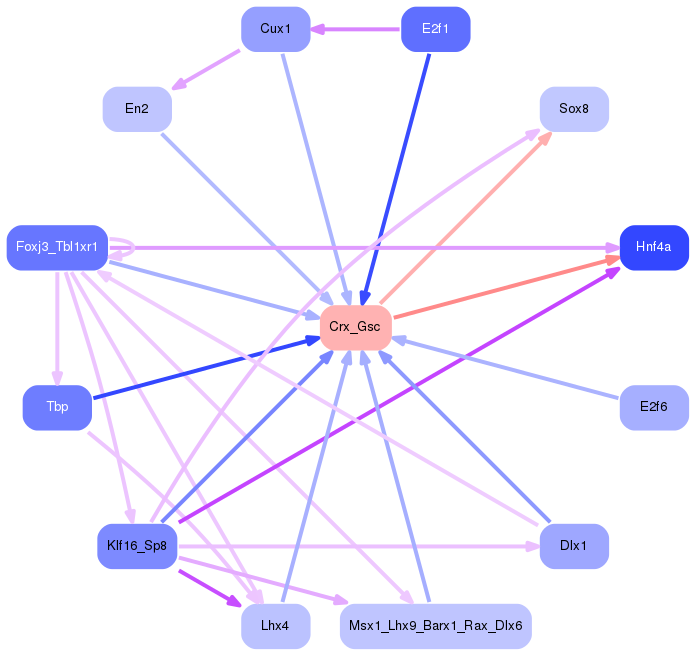
Results for Crx_Gsc
Z-value: 0.83
Motif logo
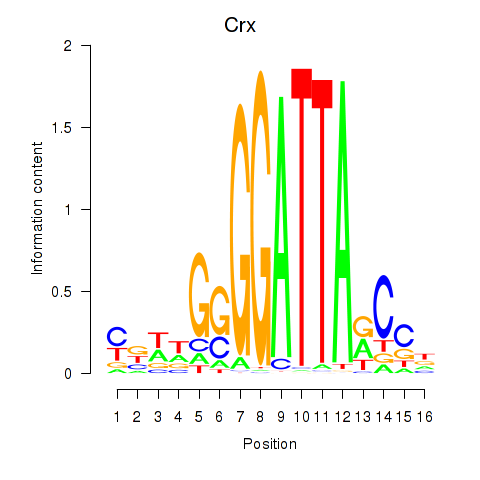
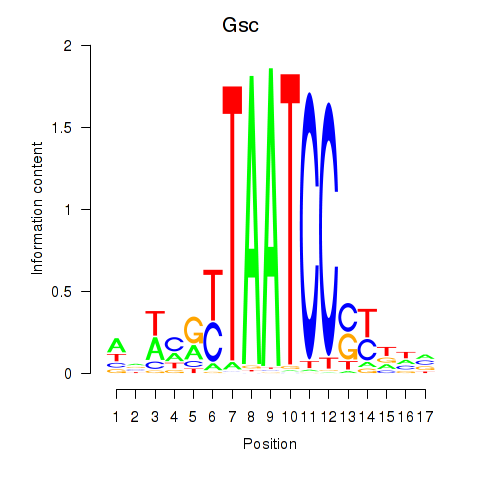
Transcription factors associated with Crx_Gsc
| Gene Symbol | Gene ID | Gene Info |
|---|---|---|
|
Crx
|
ENSRNOG00000013890 | cone-rod homeobox |
|
Gsc
|
ENSRNOG00000010605 | goosecoid homeobox |
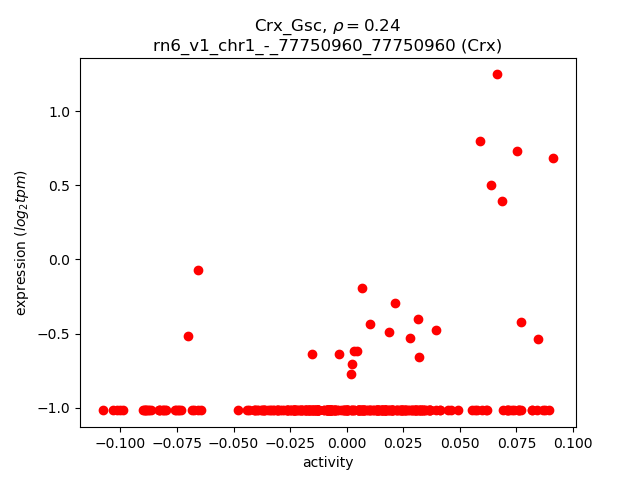
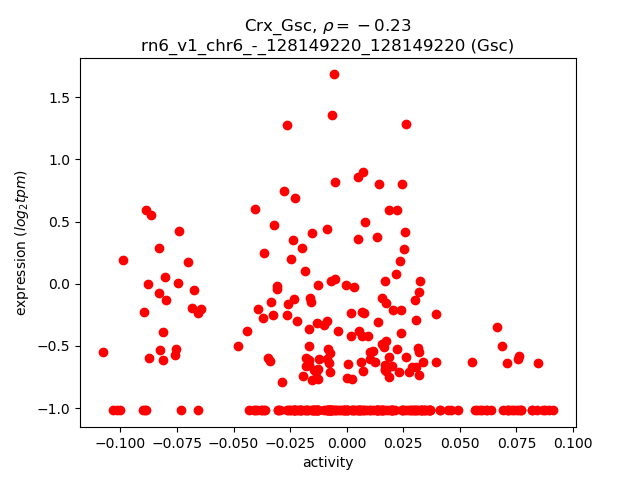
Activity-expression correlation:
| Gene | Promoter | Pearson corr. coef. | P-value | Plot |
|---|---|---|---|---|
| Crx | rn6_v1_chr1_-_77750960_77750960 | 0.24 | 1.1e-05 | Click! |
| Gsc | rn6_v1_chr6_-_128149220_128149220 | -0.23 | 3.4e-05 | Click! |
Activity profile of Crx_Gsc motif
Sorted Z-values of Crx_Gsc motif
| Promoter | Log-likelihood | Transcript | Gene | Gene Info |
|---|---|---|---|---|
| chr11_+_57207656 | 31.89 |
ENSRNOT00000038207
ENSRNOT00000085754 |
Plcxd2
|
phosphatidylinositol-specific phospholipase C, X domain containing 2 |
| chr1_+_266781617 | 22.58 |
ENSRNOT00000027417
|
Ina
|
internexin neuronal intermediate filament protein, alpha |
| chr1_-_266074181 | 21.28 |
ENSRNOT00000026378
|
Psd
|
pleckstrin and Sec7 domain containing |
| chr4_+_94696965 | 18.93 |
ENSRNOT00000064696
|
Grid2
|
glutamate ionotropic receptor delta type subunit 2 |
| chr8_-_85645718 | 18.63 |
ENSRNOT00000032185
|
Gsta2
|
glutathione S-transferase alpha 2 |
| chr19_+_10731855 | 18.60 |
ENSRNOT00000022277
|
Pllp
|
plasmolipin |
| chr1_+_100393303 | 18.35 |
ENSRNOT00000026251
|
Syt3
|
synaptotagmin 3 |
| chr10_-_27366665 | 18.27 |
ENSRNOT00000004725
|
Gabra1
|
gamma-aminobutyric acid type A receptor alpha1 subunit |
| chr10_-_58693754 | 16.17 |
ENSRNOT00000071764
|
Pitpnm3
|
PITPNM family member 3 |
| chr17_+_81455955 | 15.50 |
ENSRNOT00000044313
|
Slc39a12
|
solute carrier family 39 member 12 |
| chr3_+_113318563 | 15.38 |
ENSRNOT00000089230
|
Ckmt1
|
creatine kinase, mitochondrial 1 |
| chr10_+_5930298 | 14.05 |
ENSRNOT00000044626
|
Grin2a
|
glutamate ionotropic receptor NMDA type subunit 2A |
| chr12_-_8418966 | 14.01 |
ENSRNOT00000085869
|
Mtus2
|
microtubule associated tumor suppressor candidate 2 |
| chr4_+_84423653 | 13.97 |
ENSRNOT00000012655
|
Chn2
|
chimerin 2 |
| chr4_+_22445414 | 13.91 |
ENSRNOT00000087657
ENSRNOT00000030224 |
Rundc3b
|
RUN domain containing 3B |
| chr10_+_65586504 | 13.82 |
ENSRNOT00000015535
ENSRNOT00000046388 |
Aldoc
|
aldolase, fructose-bisphosphate C |
| chr5_+_139783951 | 13.44 |
ENSRNOT00000081333
|
Rims3
|
regulating synaptic membrane exocytosis 3 |
| chr4_-_108717309 | 13.23 |
ENSRNOT00000085062
|
AABR07061178.1
|
|
| chr12_-_41448668 | 13.19 |
ENSRNOT00000001856
|
Rasal1
|
RAS protein activator like 1 (GAP1 like) |
| chrX_-_19134869 | 13.12 |
ENSRNOT00000004235
|
RragB
|
Ras-related GTP binding B |
| chrX_-_19369746 | 13.10 |
ENSRNOT00000075249
|
LOC108348096
|
ras-related GTP-binding protein B |
| chr4_+_150133590 | 12.79 |
ENSRNOT00000051804
|
Rasgef1a
|
RasGEF domain family, member 1A |
| chr7_-_13751271 | 12.33 |
ENSRNOT00000009931
|
Slc1a6
|
solute carrier family 1 member 6 |
| chr3_+_159936856 | 12.22 |
ENSRNOT00000078703
|
Hnf4a
|
hepatocyte nuclear factor 4, alpha |
| chr10_+_86303727 | 11.62 |
ENSRNOT00000037752
|
Ppp1r1b
|
protein phosphatase 1, regulatory (inhibitor) subunit 1B |
| chr7_+_133457255 | 11.50 |
ENSRNOT00000080621
|
Cntn1
|
contactin 1 |
| chr7_-_117732339 | 11.46 |
ENSRNOT00000092917
ENSRNOT00000020696 |
Foxh1
|
forkhead box H1 |
| chr13_-_72367980 | 11.40 |
ENSRNOT00000003928
|
Cacna1e
|
calcium voltage-gated channel subunit alpha1 E |
| chr18_+_59748444 | 11.38 |
ENSRNOT00000024752
|
St8sia3
|
ST8 alpha-N-acetyl-neuraminide alpha-2,8-sialyltransferase 3 |
| chr12_-_10307265 | 11.29 |
ENSRNOT00000092627
|
Wasf3
|
WAS protein family, member 3 |
| chr13_+_63526486 | 10.45 |
ENSRNOT00000003788
|
Brinp3
|
BMP/retinoic acid inducible neural specific 3 |
| chr2_-_115836846 | 10.34 |
ENSRNOT00000014359
|
Cldn11
|
claudin 11 |
| chr1_-_248376750 | 10.25 |
ENSRNOT00000089073
|
Gldc
|
glycine decarboxylase |
| chr14_+_8182383 | 9.55 |
ENSRNOT00000092719
|
Mapk10
|
mitogen activated protein kinase 10 |
| chr13_+_77485113 | 9.30 |
ENSRNOT00000080254
|
Tnr
|
tenascin R |
| chr5_-_9094616 | 9.28 |
ENSRNOT00000072210
|
Sgk3
|
serum/glucocorticoid regulated kinase family, member 3 |
| chr10_+_92288910 | 9.17 |
ENSRNOT00000006947
ENSRNOT00000045127 |
Mapt
|
microtubule-associated protein tau |
| chr20_+_28572242 | 9.04 |
ENSRNOT00000072485
|
Sh3rf3
|
SH3 domain containing ring finger 3 |
| chrX_-_115764217 | 8.78 |
ENSRNOT00000009400
|
Trpc5
|
transient receptor potential cation channel, subfamily C, member 5 |
| chr10_+_54512983 | 8.75 |
ENSRNOT00000005204
|
Stx8
|
syntaxin 8 |
| chr18_+_25749098 | 8.60 |
ENSRNOT00000027771
|
Camk4
|
calcium/calmodulin-dependent protein kinase IV |
| chr7_+_123482255 | 8.34 |
ENSRNOT00000064487
|
LOC688613
|
hypothetical protein LOC688613 |
| chr11_-_59110562 | 8.25 |
ENSRNOT00000047907
ENSRNOT00000042024 |
Lsamp
|
limbic system-associated membrane protein |
| chr2_+_127489771 | 7.99 |
ENSRNOT00000093581
|
Intu
|
inturned planar cell polarity protein |
| chrX_+_122808605 | 7.88 |
ENSRNOT00000017567
|
Zcchc12
|
zinc finger CCHC-type containing 12 |
| chr7_+_11582984 | 7.87 |
ENSRNOT00000026893
|
Gng7
|
G protein subunit gamma 7 |
| chr2_+_115337439 | 7.69 |
ENSRNOT00000015779
|
Eif5a2
|
eukaryotic translation initiation factor 5A2 |
| chr6_-_107325345 | 7.65 |
ENSRNOT00000049481
ENSRNOT00000042594 ENSRNOT00000013026 |
Numb
|
NUMB, endocytic adaptor protein |
| chr19_+_59186673 | 7.62 |
ENSRNOT00000071655
|
Slc35f3
|
solute carrier family 35, member F3 |
| chr1_-_189199376 | 7.59 |
ENSRNOT00000021027
|
Umod
|
uromodulin |
| chr17_+_31493107 | 7.59 |
ENSRNOT00000023611
ENSRNOT00000086264 |
Tubb2a
|
tubulin, beta 2A class IIa |
| chr5_-_135025084 | 7.50 |
ENSRNOT00000018766
|
Tspan1
|
tetraspanin 1 |
| chr5_+_64326733 | 7.50 |
ENSRNOT00000065775
|
Tmeff1
|
transmembrane protein with EGF-like and two follistatin-like domains 1 |
| chr4_+_117962319 | 7.45 |
ENSRNOT00000057441
|
Tgfa
|
transforming growth factor alpha |
| chr1_-_214844858 | 7.22 |
ENSRNOT00000046344
|
Tollip
|
toll interacting protein |
| chr19_+_6046665 | 7.18 |
ENSRNOT00000084126
|
Cdh8
|
cadherin 8 |
| chr19_+_51985170 | 7.14 |
ENSRNOT00000019443
|
Hsbp1
|
heat shock factor binding protein 1 |
| chr18_-_37096132 | 7.14 |
ENSRNOT00000041188
|
Ppp2r2b
|
protein phosphatase 2, regulatory subunit B, beta |
| chr4_-_51199570 | 7.10 |
ENSRNOT00000010788
|
Slc13a1
|
solute carrier family 13 member 1 |
| chrX_+_76083549 | 7.07 |
ENSRNOT00000003573
|
Magee1
|
MAGE family member E1 |
| chr15_+_48674380 | 6.98 |
ENSRNOT00000018762
|
Fbxo16
|
F-box protein 16 |
| chrX_-_15620841 | 6.85 |
ENSRNOT00000085397
|
Praf2
|
PRA1 domain family, member 2 |
| chr4_-_16669368 | 6.81 |
ENSRNOT00000007608
|
Pclo
|
piccolo (presynaptic cytomatrix protein) |
| chr9_+_95256627 | 6.70 |
ENSRNOT00000025291
|
Ugt1a5
|
UDP glucuronosyltransferase family 1 member A5 |
| chr6_-_114476723 | 6.67 |
ENSRNOT00000005162
|
Dio2
|
deiodinase, iodothyronine, type II |
| chr8_+_39848448 | 6.64 |
ENSRNOT00000012248
|
Hepacam
|
hepatocyte cell adhesion molecule |
| chr15_+_19547871 | 6.56 |
ENSRNOT00000036235
|
Gpr137c
|
G protein-coupled receptor 137C |
| chr10_+_69737328 | 6.54 |
ENSRNOT00000055999
ENSRNOT00000076773 |
Tmem132e
|
transmembrane protein 132E |
| chr12_-_19167015 | 6.50 |
ENSRNOT00000001797
|
Gjc3
|
gap junction protein, gamma 3 |
| chr8_+_33514042 | 6.49 |
ENSRNOT00000081614
ENSRNOT00000081525 |
Kcnj1
|
potassium voltage-gated channel subfamily J member 1 |
| chr2_+_66940057 | 6.45 |
ENSRNOT00000043050
|
Cdh9
|
cadherin 9 |
| chr13_+_31081804 | 6.23 |
ENSRNOT00000041413
|
Cdh7
|
cadherin 7 |
| chr19_-_9931930 | 6.22 |
ENSRNOT00000085144
|
Ccdc113
|
coiled-coil domain containing 113 |
| chr13_-_70625842 | 6.11 |
ENSRNOT00000092499
|
Lamc2
|
laminin subunit gamma 2 |
| chr18_+_30010918 | 6.10 |
ENSRNOT00000084132
|
Pcdha4
|
protocadherin alpha 4 |
| chr7_-_142352382 | 5.91 |
ENSRNOT00000048488
|
Galnt6
|
polypeptide N-acetylgalactosaminyltransferase 6 |
| chr11_-_80981415 | 5.90 |
ENSRNOT00000002499
ENSRNOT00000002496 |
St6gal1
|
ST6 beta-galactoside alpha-2,6-sialyltransferase 1 |
| chr14_-_92495894 | 5.85 |
ENSRNOT00000064483
|
Cobl
|
cordon-bleu WH2 repeat protein |
| chr1_+_65851060 | 5.63 |
ENSRNOT00000036880
|
Zscan18
|
zinc finger and SCAN domain containing 18 |
| chr1_+_256955652 | 5.59 |
ENSRNOT00000020411
|
Lgi1
|
leucine-rich, glioma inactivated 1 |
| chrX_-_115175299 | 5.53 |
ENSRNOT00000074322
|
Dcx
|
doublecortin |
| chr9_+_6966908 | 5.50 |
ENSRNOT00000072796
|
St6gal2
|
ST6 beta-galactoside alpha-2,6-sialyltransferase 2 |
| chr3_-_105470475 | 5.50 |
ENSRNOT00000011078
|
Gjd2
|
gap junction protein, delta 2 |
| chr10_-_14937336 | 5.39 |
ENSRNOT00000025494
|
Sox8
|
SRY box 8 |
| chrX_+_110789269 | 5.36 |
ENSRNOT00000086014
|
Rnf128
|
ring finger protein 128, E3 ubiquitin protein ligase |
| chr5_-_79008363 | 5.36 |
ENSRNOT00000010040
|
Kif12
|
kinesin family member 12 |
| chr1_-_67206713 | 5.35 |
ENSRNOT00000048195
|
Vom1r43
|
vomeronasal 1 receptor 43 |
| chr2_-_259382765 | 5.35 |
ENSRNOT00000091407
|
St6galnac3
|
ST6 N-acetylgalactosaminide alpha-2,6-sialyltransferase 3 |
| chr19_-_56311991 | 5.33 |
ENSRNOT00000014090
|
Dbndd1
|
dysbindin domain containing 1 |
| chr7_+_70452579 | 5.30 |
ENSRNOT00000046099
|
B4galnt1
|
beta-1,4-N-acetyl-galactosaminyl transferase 1 |
| chr8_+_129201669 | 5.25 |
ENSRNOT00000025663
|
Entpd3
|
ectonucleoside triphosphate diphosphohydrolase 3 |
| chr7_+_29435444 | 5.23 |
ENSRNOT00000008613
|
Slc5a8
|
solute carrier family 5 member 8 |
| chr6_+_27328406 | 5.19 |
ENSRNOT00000091159
ENSRNOT00000044278 |
Otof
|
otoferlin |
| chr9_+_81615251 | 5.15 |
ENSRNOT00000081106
ENSRNOT00000020049 |
Pnkd
|
paroxysmal nonkinesigenic dyskinesia |
| chr11_+_86715981 | 5.12 |
ENSRNOT00000050269
|
Comt
|
catechol-O-methyltransferase |
| chr2_+_58724855 | 5.05 |
ENSRNOT00000089609
|
Capsl
|
calcyphosine-like |
| chr7_-_116063078 | 5.02 |
ENSRNOT00000076932
ENSRNOT00000035496 |
Gml
|
glycosylphosphatidylinositol anchored molecule like |
| chr9_-_14618013 | 4.96 |
ENSRNOT00000018351
|
Trem2
|
triggering receptor expressed on myeloid cells 2 |
| chr1_+_261158261 | 4.90 |
ENSRNOT00000071965
|
Pgam1
|
phosphoglycerate mutase 1 |
| chr10_+_89459650 | 4.88 |
ENSRNOT00000028149
ENSRNOT00000077942 |
Nbr1
|
NBR1, autophagy cargo receptor |
| chr16_+_39144972 | 4.84 |
ENSRNOT00000086728
|
Adam21
|
ADAM metallopeptidase domain 21 |
| chr3_+_97723901 | 4.84 |
ENSRNOT00000080416
|
Mpped2
|
metallophosphoesterase domain containing 2 |
| chr1_-_72335855 | 4.82 |
ENSRNOT00000021613
|
Ccdc106
|
coiled-coil domain containing 106 |
| chr9_-_45558993 | 4.76 |
ENSRNOT00000087866
ENSRNOT00000017714 |
Chst10
|
carbohydrate sulfotransferase 10 |
| chr14_-_3288017 | 4.72 |
ENSRNOT00000080452
|
LOC689986
|
hypothetical protein LOC689986 |
| chr6_-_111295917 | 4.71 |
ENSRNOT00000073428
ENSRNOT00000079373 |
Vipas39
|
VPS33B interacting protein, apical-basolateral polarity regulator, spe-39 homolog |
| chr3_+_35271786 | 4.68 |
ENSRNOT00000065989
|
Lypd6b
|
LY6/PLAUR domain containing 6B |
| chr1_+_164502389 | 4.67 |
ENSRNOT00000043554
|
Arrb1
|
arrestin, beta 1 |
| chr2_-_186606172 | 4.60 |
ENSRNOT00000021938
|
Fcrl2
|
Fc receptor-like 2 |
| chr4_+_91373942 | 4.48 |
ENSRNOT00000043827
|
Ccser1
|
coiled-coil serine-rich protein 1 |
| chr7_-_82687130 | 4.45 |
ENSRNOT00000006791
|
Tmem74
|
transmembrane protein 74 |
| chr1_-_222734184 | 4.44 |
ENSRNOT00000049812
ENSRNOT00000028785 |
Rtn3
|
reticulon 3 |
| chr18_-_32207749 | 4.42 |
ENSRNOT00000090882
ENSRNOT00000018843 |
Arhgap26
|
Rho GTPase activating protein 26 |
| chr1_-_174119815 | 4.41 |
ENSRNOT00000019368
|
Trim66
|
tripartite motif-containing 66 |
| chr10_-_109909646 | 4.40 |
ENSRNOT00000074362
ENSRNOT00000088907 |
Dcxr
|
dicarbonyl and L-xylulose reductase |
| chr20_+_9791171 | 4.40 |
ENSRNOT00000078031
|
Abcg1
|
ATP binding cassette subfamily G member 1 |
| chr14_-_44767120 | 4.39 |
ENSRNOT00000003991
|
Wdr19
|
WD repeat domain 19 |
| chr8_+_107499262 | 4.34 |
ENSRNOT00000081029
|
Cep70
|
centrosomal protein 70 |
| chr6_+_106084815 | 4.34 |
ENSRNOT00000058195
|
Sipa1l1
|
signal-induced proliferation-associated 1 like 1 |
| chr19_-_10826895 | 4.30 |
ENSRNOT00000090217
|
Rspry1
|
ring finger and SPRY domain containing 1 |
| chr1_-_101741441 | 4.27 |
ENSRNOT00000028570
|
Sult2b1
|
sulfotransferase family 2B member 1 |
| chr2_-_154542557 | 4.25 |
ENSRNOT00000013392
|
Slc33a1
|
solute carrier family 33 member 1 |
| chr1_+_53874860 | 4.25 |
ENSRNOT00000090486
|
Tcte2
|
t-complex-associated testis expressed 2 |
| chr1_+_221801524 | 4.21 |
ENSRNOT00000031227
|
Nrxn2
|
neurexin 2 |
| chr13_+_25656983 | 4.20 |
ENSRNOT00000020892
|
RGD1307235
|
similar to RIKEN cDNA 2310035C23 |
| chr1_+_219764001 | 4.19 |
ENSRNOT00000082388
|
Pc
|
pyruvate carboxylase |
| chr3_-_60765645 | 4.19 |
ENSRNOT00000050513
|
Atf2
|
activating transcription factor 2 |
| chr16_+_39145230 | 4.16 |
ENSRNOT00000092942
|
Adam21
|
ADAM metallopeptidase domain 21 |
| chr20_+_13817795 | 4.08 |
ENSRNOT00000036518
|
Gstt3
|
glutathione S-transferase, theta 3 |
| chr14_+_44479614 | 4.08 |
ENSRNOT00000003691
|
Ugdh
|
UDP-glucose 6-dehydrogenase |
| chr17_+_43458553 | 4.07 |
ENSRNOT00000088939
|
Slc17a4
|
solute carrier family 17, member 4 |
| chr14_+_84231639 | 4.06 |
ENSRNOT00000066362
|
Gal3st1
|
galactose-3-O-sulfotransferase 1 |
| chr3_+_80833272 | 4.06 |
ENSRNOT00000023583
|
Chrm4
|
cholinergic receptor, muscarinic 4 |
| chrX_+_15225645 | 4.05 |
ENSRNOT00000008648
|
Glod5
|
glyoxalase domain containing 5 |
| chr10_+_72272248 | 4.03 |
ENSRNOT00000003908
|
Car4
|
carbonic anhydrase 4 |
| chr3_-_52664209 | 3.99 |
ENSRNOT00000065126
ENSRNOT00000079020 |
Scn9a
|
sodium voltage-gated channel alpha subunit 9 |
| chr4_-_128266082 | 3.98 |
ENSRNOT00000039549
|
Nup50
|
nucleoporin 50 |
| chr1_-_67065797 | 3.91 |
ENSRNOT00000048152
|
Vom1r46
|
vomeronasal 1 receptor 46 |
| chr8_-_114853103 | 3.88 |
ENSRNOT00000074595
|
Glyctk
|
glycerate kinase |
| chr3_-_64554953 | 3.74 |
ENSRNOT00000067452
|
LOC102553814
|
serine/arginine repetitive matrix protein 1-like |
| chr8_+_69127708 | 3.64 |
ENSRNOT00000013490
|
Snapc5
|
small nuclear RNA activating complex, polypeptide 5 |
| chr17_+_69634890 | 3.64 |
ENSRNOT00000029049
|
Akr1c13
|
aldo-keto reductase family 1, member C13 |
| chrX_-_10218583 | 3.63 |
ENSRNOT00000013382
|
Nyx
|
nyctalopin |
| chr14_+_94590765 | 3.60 |
ENSRNOT00000072533
|
LOC690700
|
similar to similar to RIKEN cDNA 1700001E04 |
| chr5_-_146795866 | 3.59 |
ENSRNOT00000065640
|
Tlr12
|
toll-like receptor 12 |
| chr18_+_59096643 | 3.57 |
ENSRNOT00000025325
|
Wdr7
|
WD repeat domain 7 |
| chr17_-_43543172 | 3.56 |
ENSRNOT00000080684
ENSRNOT00000029626 ENSRNOT00000082719 |
Slc17a3
|
solute carrier family 17 member 3 |
| chr6_-_42630983 | 3.55 |
ENSRNOT00000071977
|
Atp6v1c2
|
ATPase H+ transporting V1 subunit C2 |
| chr5_+_35865605 | 3.55 |
ENSRNOT00000011442
|
Ccnc
|
cyclin C |
| chr6_-_108796124 | 3.48 |
ENSRNOT00000086545
|
Arel1
|
apoptosis resistant E3 ubiquitin protein ligase 1 |
| chr3_-_146690375 | 3.47 |
ENSRNOT00000010641
|
Abhd12
|
abhydrolase domain containing 12 |
| chr8_+_132607166 | 3.47 |
ENSRNOT00000007223
|
Sacm1l
|
SAC1 suppressor of actin mutations 1-like (yeast) |
| chr1_+_263448633 | 3.42 |
ENSRNOT00000064510
|
Entpd7
|
ectonucleoside triphosphate diphosphohydrolase 7 |
| chrX_+_105911925 | 3.40 |
ENSRNOT00000052422
|
LOC108348137
|
armadillo repeat-containing X-linked protein 1 |
| chr9_+_88918433 | 3.40 |
ENSRNOT00000021730
|
Ccl20
|
C-C motif chemokine ligand 20 |
| chr5_+_81431600 | 3.39 |
ENSRNOT00000013675
|
Trim32
|
tripartite motif-containing 32 |
| chr3_-_46153371 | 3.31 |
ENSRNOT00000085885
|
Baz2b
|
bromodomain adjacent to zinc finger domain, 2B |
| chr4_-_49422824 | 3.25 |
ENSRNOT00000077889
|
Fam3c
|
family with sequence similarity 3, member C |
| chr2_-_123407496 | 3.20 |
ENSRNOT00000080207
|
Trpc3
|
transient receptor potential cation channel, subfamily C, member 3 |
| chr13_-_104080631 | 3.19 |
ENSRNOT00000032865
|
Lyplal1
|
lysophospholipase-like 1 |
| chr11_-_38088753 | 3.19 |
ENSRNOT00000002713
|
Tmprss2
|
transmembrane protease, serine 2 |
| chr10_-_14613878 | 3.17 |
ENSRNOT00000024072
|
Baiap3
|
BAI1-associated protein 3 |
| chr2_+_184243976 | 3.16 |
ENSRNOT00000042146
|
Dear
|
dual endothelin 1, angiotensin II receptor |
| chr6_-_104409005 | 3.14 |
ENSRNOT00000040965
|
Ccdc177
|
coiled-coil domain containing 177 |
| chr1_-_81144024 | 3.13 |
ENSRNOT00000088431
|
Zfp94
|
zinc finger protein 94 |
| chr2_+_86914989 | 3.12 |
ENSRNOT00000085164
ENSRNOT00000081966 |
LOC100360380
|
zinc finger protein 457-like |
| chr14_+_7113544 | 3.12 |
ENSRNOT00000038188
|
Hsd17b13
|
hydroxysteroid (17-beta) dehydrogenase 13 |
| chr8_-_115140080 | 3.11 |
ENSRNOT00000015851
|
Acy1
|
aminoacylase 1 |
| chr3_-_5802129 | 3.10 |
ENSRNOT00000009555
|
Sardh
|
sarcosine dehydrogenase |
| chr11_-_81639872 | 3.09 |
ENSRNOT00000047595
ENSRNOT00000090031 ENSRNOT00000081864 |
Hrg
|
histidine-rich glycoprotein |
| chr1_+_225037737 | 3.08 |
ENSRNOT00000077959
|
Bscl2
|
BSCL2, seipin lipid droplet biogenesis associated |
| chrY_-_1305026 | 3.07 |
ENSRNOT00000092901
|
Usp9y
|
ubiquitin specific peptidase 9, Y-linked |
| chr10_-_84881190 | 3.04 |
ENSRNOT00000073746
|
Pnpo
|
pyridoxamine 5'-phosphate oxidase |
| chr5_-_133786403 | 3.03 |
ENSRNOT00000081051
ENSRNOT00000010318 |
Cmpk1
|
cytidine/uridine monophosphate kinase 1 |
| chr6_+_9790422 | 3.03 |
ENSRNOT00000020959
|
Prkce
|
protein kinase C, epsilon |
| chr1_+_282640706 | 3.02 |
ENSRNOT00000073241
ENSRNOT00000080995 |
Ces2c
|
carboxylesterase 2C |
| chr19_+_15143794 | 3.00 |
ENSRNOT00000085762
|
Ces1f
|
carboxylesterase 1F |
| chr18_-_24929091 | 2.94 |
ENSRNOT00000019596
|
Proc
|
protein C |
| chr17_+_18031228 | 2.93 |
ENSRNOT00000081708
|
Tpmt
|
thiopurine S-methyltransferase |
| chr8_-_65587427 | 2.86 |
ENSRNOT00000016491
|
Lrrc49
|
leucine rich repeat containing 49 |
| chr1_-_4011161 | 2.85 |
ENSRNOT00000044778
|
Stxbp5
|
syntaxin binding protein 5 |
| chr18_+_70974885 | 2.85 |
ENSRNOT00000025198
|
RGD1562987
|
similar to cDNA sequence BC031181 |
| chr4_-_150616895 | 2.84 |
ENSRNOT00000073562
|
Ankrd26
|
ankyrin repeat domain 26 |
| chr10_-_15465404 | 2.84 |
ENSRNOT00000077826
ENSRNOT00000027593 |
Decr2
|
2,4-dienoyl-CoA reductase 2 |
| chr8_+_49077053 | 2.82 |
ENSRNOT00000087922
|
Ift46
|
intraflagellar transport 46 |
| chr8_+_59561721 | 2.81 |
ENSRNOT00000093107
ENSRNOT00000065771 ENSRNOT00000088304 |
Chrna5
|
cholinergic receptor nicotinic alpha 5 subunit |
| chr5_+_61425746 | 2.80 |
ENSRNOT00000064113
|
RGD1305807
|
hypothetical LOC298077 |
| chr2_-_9504134 | 2.79 |
ENSRNOT00000076996
|
Adgrv1
|
adhesion G protein-coupled receptor V1 |
| chr1_-_4011511 | 2.76 |
ENSRNOT00000040559
|
Stxbp5
|
syntaxin binding protein 5 |
| chr16_-_45929 | 2.74 |
ENSRNOT00000043153
|
AABR07024439.1
|
|
| chr6_-_26385761 | 2.71 |
ENSRNOT00000073228
|
Gckr
|
glucokinase regulator |
| chr7_-_123608436 | 2.70 |
ENSRNOT00000011880
|
Cyp2d4
|
cytochrome P450, family 2, subfamily d, polypeptide 4 |
| chr4_+_154423209 | 2.69 |
ENSRNOT00000075799
|
LOC100911545
|
alpha-2-macroglobulin-like |
| chr3_-_7051953 | 2.62 |
ENSRNOT00000013473
|
RGD1306233
|
similar to hypothetical protein MGC29761 |
| chr2_+_264864351 | 2.57 |
ENSRNOT00000015434
|
Lrrc40
|
leucine rich repeat containing 40 |
| chr11_+_60102121 | 2.57 |
ENSRNOT00000045521
|
Tmprss7
|
transmembrane protease, serine 7 |
| chr18_+_40962146 | 2.54 |
ENSRNOT00000035656
|
Arl14epl
|
ADP ribosylation factor like GTPase 14 effector protein like |
| chr6_+_6946695 | 2.53 |
ENSRNOT00000061921
|
Mta3
|
metastasis associated 1 family, member 3 |
| chr18_-_26658892 | 2.52 |
ENSRNOT00000038247
|
Epb41l4a
|
erythrocyte membrane protein band 4.1 like 4A |
| chr14_-_113644779 | 2.51 |
ENSRNOT00000005306
|
Cfap36
|
cilia and flagella associated protein 36 |
Network of associatons between targets according to the STRING database.

First level regulatory network of Crx_Gsc
Gene Ontology Analysis
Gene overrepresentation in biological process category:
| Log-likelihood per target | Total log-likelihood | Term | Description |
|---|---|---|---|
| 5.8 | 17.3 | GO:1990743 | protein sialylation(GO:1990743) |
| 4.7 | 14.1 | GO:0033058 | directional locomotion(GO:0033058) |
| 3.8 | 11.5 | GO:0035054 | embryonic heart tube anterior/posterior pattern specification(GO:0035054) |
| 3.5 | 21.3 | GO:0006863 | purine nucleobase transport(GO:0006863) nucleobase transport(GO:0015851) |
| 3.1 | 12.2 | GO:0010534 | regulation of activation of JAK2 kinase activity(GO:0010534) activation of JAK2 kinase activity(GO:0042977) negative regulation of activation of JAK2 kinase activity(GO:1902569) |
| 2.6 | 10.2 | GO:0019464 | glycine catabolic process(GO:0006546) glycine decarboxylation via glycine cleavage system(GO:0019464) |
| 2.5 | 7.6 | GO:0021849 | neuroblast division in subventricular zone(GO:0021849) |
| 2.3 | 22.6 | GO:0060052 | neurofilament cytoskeleton organization(GO:0060052) |
| 2.2 | 8.8 | GO:1902630 | regulation of membrane hyperpolarization(GO:1902630) |
| 2.2 | 13.1 | GO:1904263 | positive regulation of TORC1 signaling(GO:1904263) |
| 2.2 | 6.5 | GO:1901979 | regulation of inward rectifier potassium channel activity(GO:1901979) |
| 2.1 | 18.6 | GO:0001766 | membrane raft polarization(GO:0001766) membrane raft distribution(GO:0031580) |
| 1.9 | 7.6 | GO:0015888 | thiamine transport(GO:0015888) |
| 1.9 | 7.6 | GO:0072021 | ascending thin limb development(GO:0072021) metanephric ascending thin limb development(GO:0072218) |
| 1.8 | 12.8 | GO:0007621 | negative regulation of female receptivity(GO:0007621) |
| 1.7 | 5.0 | GO:0002585 | positive regulation of antigen processing and presentation of peptide antigen(GO:0002585) detection of peptidoglycan(GO:0032499) |
| 1.6 | 7.9 | GO:2000327 | positive regulation of ligand-dependent nuclear receptor transcription coactivator activity(GO:2000327) |
| 1.5 | 4.4 | GO:0042732 | D-xylose metabolic process(GO:0042732) |
| 1.5 | 8.8 | GO:0048686 | regulation of sprouting of injured axon(GO:0048686) regulation of axon extension involved in regeneration(GO:0048690) |
| 1.4 | 18.6 | GO:0042178 | xenobiotic catabolic process(GO:0042178) |
| 1.4 | 11.4 | GO:0090273 | regulation of somatostatin secretion(GO:0090273) |
| 1.4 | 15.5 | GO:0071578 | zinc II ion transmembrane import(GO:0071578) |
| 1.4 | 4.2 | GO:0032915 | positive regulation of transforming growth factor beta2 production(GO:0032915) |
| 1.4 | 4.1 | GO:0019375 | galactosylceramide biosynthetic process(GO:0006682) galactolipid biosynthetic process(GO:0019375) |
| 1.4 | 18.9 | GO:0021707 | cerebellar granular layer formation(GO:0021684) cerebellar granule cell differentiation(GO:0021707) |
| 1.3 | 5.4 | GO:0060221 | retinal rod cell differentiation(GO:0060221) renal vesicle induction(GO:0072034) |
| 1.3 | 5.3 | GO:0001574 | ganglioside biosynthetic process(GO:0001574) |
| 1.3 | 11.8 | GO:0019336 | phenol-containing compound catabolic process(GO:0019336) |
| 1.3 | 18.2 | GO:0071420 | cellular response to histamine(GO:0071420) |
| 1.3 | 7.7 | GO:0006449 | regulation of translational termination(GO:0006449) positive regulation of translational elongation(GO:0045901) |
| 1.2 | 5.8 | GO:0001757 | somite specification(GO:0001757) |
| 1.2 | 4.7 | GO:0002032 | desensitization of G-protein coupled receptor protein signaling pathway by arrestin(GO:0002032) |
| 1.1 | 9.2 | GO:1900034 | regulation of cellular response to heat(GO:1900034) |
| 1.1 | 6.8 | GO:0016080 | synaptic vesicle targeting(GO:0016080) |
| 1.1 | 3.4 | GO:0042222 | interleukin-1 biosynthetic process(GO:0042222) |
| 1.1 | 4.4 | GO:0034436 | glycoprotein transport(GO:0034436) |
| 1.1 | 4.4 | GO:0060830 | ciliary receptor clustering involved in smoothened signaling pathway(GO:0060830) myotome development(GO:0061055) |
| 1.1 | 11.7 | GO:0007258 | JUN phosphorylation(GO:0007258) |
| 1.1 | 4.2 | GO:0097116 | gephyrin clustering involved in postsynaptic density assembly(GO:0097116) |
| 1.0 | 4.2 | GO:0019072 | viral genome packaging(GO:0019072) viral RNA genome packaging(GO:0019074) |
| 1.0 | 3.1 | GO:0097037 | heme export(GO:0097037) |
| 1.0 | 5.1 | GO:0061727 | methylglyoxal catabolic process to D-lactate via S-lactoyl-glutathione(GO:0019243) methylglyoxal catabolic process(GO:0051596) methylglyoxal catabolic process to lactate(GO:0061727) |
| 1.0 | 3.0 | GO:0042822 | pyridoxal phosphate metabolic process(GO:0042822) |
| 1.0 | 3.0 | GO:0046077 | dUDP biosynthetic process(GO:0006227) pyrimidine nucleoside diphosphate biosynthetic process(GO:0009139) deoxyribonucleoside diphosphate biosynthetic process(GO:0009189) pyrimidine deoxyribonucleoside diphosphate metabolic process(GO:0009196) pyrimidine deoxyribonucleoside diphosphate biosynthetic process(GO:0009197) dUDP metabolic process(GO:0046077) |
| 1.0 | 4.0 | GO:0043179 | rhythmic excitation(GO:0043179) |
| 1.0 | 13.8 | GO:0030388 | fructose 1,6-bisphosphate metabolic process(GO:0030388) |
| 1.0 | 31.5 | GO:1903861 | positive regulation of dendrite extension(GO:1903861) |
| 0.9 | 2.8 | GO:0046864 | isoprenoid transport(GO:0046864) terpenoid transport(GO:0046865) |
| 0.9 | 3.5 | GO:0052651 | monoacylglycerol metabolic process(GO:0046462) monoacylglycerol catabolic process(GO:0052651) |
| 0.8 | 2.5 | GO:0071613 | negative regulation of nucleotide-binding oligomerization domain containing signaling pathway(GO:0070425) negative regulation of nucleotide-binding oligomerization domain containing 2 signaling pathway(GO:0070433) granzyme B production(GO:0071613) regulation of granzyme B production(GO:0071661) positive regulation of granzyme B production(GO:0071663) |
| 0.8 | 4.9 | GO:0043456 | regulation of pentose-phosphate shunt(GO:0043456) |
| 0.8 | 4.1 | GO:0007207 | adenylate cyclase-inhibiting G-protein coupled acetylcholine receptor signaling pathway(GO:0007197) phospholipase C-activating G-protein coupled acetylcholine receptor signaling pathway(GO:0007207) |
| 0.8 | 4.1 | GO:0035063 | nuclear speck organization(GO:0035063) |
| 0.8 | 3.2 | GO:1903244 | positive regulation of cardiac muscle adaptation(GO:0010615) positive regulation of cardiac muscle hypertrophy in response to stress(GO:1903244) |
| 0.8 | 3.2 | GO:0002084 | protein depalmitoylation(GO:0002084) |
| 0.8 | 10.3 | GO:0016338 | calcium-independent cell-cell adhesion via plasma membrane cell-adhesion molecules(GO:0016338) |
| 0.8 | 2.4 | GO:0071469 | cellular response to alkaline pH(GO:0071469) |
| 0.8 | 8.6 | GO:0002371 | dendritic cell cytokine production(GO:0002371) |
| 0.8 | 14.0 | GO:0001675 | acrosome assembly(GO:0001675) |
| 0.8 | 13.2 | GO:0089711 | L-glutamate transmembrane transport(GO:0089711) |
| 0.8 | 2.3 | GO:0034445 | regulation of plasma lipoprotein particle oxidation(GO:0034444) negative regulation of plasma lipoprotein particle oxidation(GO:0034445) |
| 0.8 | 3.0 | GO:0051562 | negative regulation of mitochondrial calcium ion concentration(GO:0051562) |
| 0.7 | 6.7 | GO:0052697 | xenobiotic glucuronidation(GO:0052697) |
| 0.7 | 4.2 | GO:1901098 | positive regulation of autophagosome maturation(GO:1901098) |
| 0.7 | 10.9 | GO:0097503 | sialylation(GO:0097503) |
| 0.7 | 1.4 | GO:0072106 | regulation of ureteric bud formation(GO:0072106) positive regulation of ureteric bud formation(GO:0072107) |
| 0.7 | 2.7 | GO:0009822 | alkaloid catabolic process(GO:0009822) |
| 0.7 | 2.0 | GO:0043382 | positive regulation of memory T cell differentiation(GO:0043382) |
| 0.6 | 3.2 | GO:0086100 | endothelin receptor signaling pathway(GO:0086100) |
| 0.6 | 4.4 | GO:0007168 | receptor guanylyl cyclase signaling pathway(GO:0007168) |
| 0.6 | 2.5 | GO:2001274 | negative regulation of glucose import in response to insulin stimulus(GO:2001274) |
| 0.6 | 1.9 | GO:0032053 | ciliary basal body organization(GO:0032053) positive regulation of protein localization to cilium(GO:1903566) |
| 0.6 | 1.8 | GO:1901844 | regulation of cell communication by electrical coupling involved in cardiac conduction(GO:1901844) |
| 0.6 | 2.5 | GO:1903575 | cornified envelope assembly(GO:1903575) |
| 0.6 | 4.3 | GO:0000103 | sulfate assimilation(GO:0000103) |
| 0.6 | 11.3 | GO:0031643 | positive regulation of myelination(GO:0031643) |
| 0.6 | 2.9 | GO:1903142 | positive regulation of endothelial cell development(GO:1901552) positive regulation of establishment of endothelial barrier(GO:1903142) |
| 0.6 | 1.7 | GO:0006296 | nucleotide-excision repair, DNA incision, 5'-to lesion(GO:0006296) |
| 0.6 | 3.4 | GO:1903265 | positive regulation of tumor necrosis factor-mediated signaling pathway(GO:1903265) |
| 0.5 | 2.7 | GO:1903300 | detection of carbohydrate stimulus(GO:0009730) detection of hexose stimulus(GO:0009732) negative regulation of glucokinase activity(GO:0033132) detection of monosaccharide stimulus(GO:0034287) detection of glucose(GO:0051594) negative regulation of hexokinase activity(GO:1903300) |
| 0.5 | 8.0 | GO:0010839 | negative regulation of keratinocyte proliferation(GO:0010839) |
| 0.5 | 4.3 | GO:0051182 | coenzyme transport(GO:0051182) |
| 0.5 | 1.1 | GO:0080144 | amino acid homeostasis(GO:0080144) |
| 0.5 | 5.2 | GO:0009134 | nucleoside diphosphate catabolic process(GO:0009134) |
| 0.5 | 3.6 | GO:0006384 | transcription initiation from RNA polymerase III promoter(GO:0006384) |
| 0.5 | 5.2 | GO:0016082 | synaptic vesicle priming(GO:0016082) |
| 0.5 | 2.4 | GO:0014053 | negative regulation of gamma-aminobutyric acid secretion(GO:0014053) |
| 0.5 | 7.1 | GO:0043653 | mitochondrial fragmentation involved in apoptotic process(GO:0043653) |
| 0.5 | 15.5 | GO:0032008 | positive regulation of TOR signaling(GO:0032008) |
| 0.5 | 7.5 | GO:0045741 | positive regulation of epidermal growth factor-activated receptor activity(GO:0045741) |
| 0.5 | 2.8 | GO:0048496 | maintenance of organ identity(GO:0048496) |
| 0.5 | 2.3 | GO:2000503 | positive regulation of natural killer cell chemotaxis(GO:2000503) |
| 0.4 | 8.3 | GO:0035641 | locomotory exploration behavior(GO:0035641) |
| 0.4 | 13.4 | GO:2000300 | regulation of synaptic vesicle exocytosis(GO:2000300) |
| 0.4 | 5.6 | GO:0034389 | lipid particle organization(GO:0034389) |
| 0.4 | 1.7 | GO:0009597 | detection of virus(GO:0009597) |
| 0.4 | 7.1 | GO:1902358 | sulfate transmembrane transport(GO:1902358) |
| 0.4 | 2.1 | GO:0002159 | desmosome assembly(GO:0002159) |
| 0.4 | 2.0 | GO:1902019 | regulation of cilium movement involved in cell motility(GO:0060295) regulation of cilium beat frequency involved in ciliary motility(GO:0060296) regulation of cilium-dependent cell motility(GO:1902019) |
| 0.4 | 1.2 | GO:0019677 | NADP catabolic process(GO:0006742) NAD catabolic process(GO:0019677) |
| 0.4 | 3.1 | GO:0006545 | glycine biosynthetic process(GO:0006545) |
| 0.4 | 6.1 | GO:0033235 | positive regulation of protein sumoylation(GO:0033235) |
| 0.4 | 5.5 | GO:0021860 | pyramidal neuron development(GO:0021860) |
| 0.4 | 1.5 | GO:0097527 | necroptotic signaling pathway(GO:0097527) |
| 0.4 | 1.1 | GO:1900673 | olefin metabolic process(GO:1900673) |
| 0.4 | 1.4 | GO:0032824 | natural killer cell differentiation involved in immune response(GO:0002325) negative regulation of natural killer cell differentiation(GO:0032824) regulation of natural killer cell differentiation involved in immune response(GO:0032826) negative regulation of natural killer cell differentiation involved in immune response(GO:0032827) |
| 0.3 | 2.4 | GO:0019441 | tryptophan catabolic process to kynurenine(GO:0019441) |
| 0.3 | 1.7 | GO:0000706 | meiotic DNA double-strand break processing(GO:0000706) double-strand break repair involved in meiotic recombination(GO:1990918) |
| 0.3 | 1.0 | GO:0008594 | photoreceptor cell morphogenesis(GO:0008594) |
| 0.3 | 1.3 | GO:0007597 | blood coagulation, intrinsic pathway(GO:0007597) |
| 0.3 | 2.0 | GO:1903361 | protein localization to basolateral plasma membrane(GO:1903361) |
| 0.3 | 3.6 | GO:0015747 | urate transport(GO:0015747) |
| 0.3 | 2.5 | GO:0007217 | tachykinin receptor signaling pathway(GO:0007217) |
| 0.3 | 2.1 | GO:0032000 | positive regulation of fatty acid beta-oxidation(GO:0032000) |
| 0.3 | 3.5 | GO:1901409 | positive regulation of phosphorylation of RNA polymerase II C-terminal domain(GO:1901409) |
| 0.3 | 1.2 | GO:0030242 | pexophagy(GO:0030242) |
| 0.3 | 1.4 | GO:0006032 | chitin metabolic process(GO:0006030) chitin catabolic process(GO:0006032) |
| 0.3 | 2.8 | GO:0006228 | UTP biosynthetic process(GO:0006228) |
| 0.3 | 1.4 | GO:0001579 | medium-chain fatty acid transport(GO:0001579) |
| 0.3 | 13.5 | GO:0008333 | endosome to lysosome transport(GO:0008333) |
| 0.3 | 4.0 | GO:0015701 | bicarbonate transport(GO:0015701) |
| 0.3 | 3.2 | GO:0046598 | positive regulation of viral entry into host cell(GO:0046598) |
| 0.3 | 0.8 | GO:0070537 | histone H2A K63-linked deubiquitination(GO:0070537) |
| 0.3 | 2.8 | GO:0040015 | negative regulation of multicellular organism growth(GO:0040015) |
| 0.3 | 2.5 | GO:0016926 | protein desumoylation(GO:0016926) |
| 0.2 | 1.0 | GO:0007296 | vitellogenesis(GO:0007296) |
| 0.2 | 9.3 | GO:2001240 | negative regulation of signal transduction in absence of ligand(GO:1901099) negative regulation of extrinsic apoptotic signaling pathway in absence of ligand(GO:2001240) |
| 0.2 | 14.0 | GO:0046579 | positive regulation of Ras protein signal transduction(GO:0046579) |
| 0.2 | 1.2 | GO:0035655 | interleukin-18-mediated signaling pathway(GO:0035655) cellular response to interleukin-18(GO:0071351) |
| 0.2 | 4.1 | GO:0009226 | nucleotide-sugar biosynthetic process(GO:0009226) |
| 0.2 | 4.5 | GO:0070831 | basement membrane assembly(GO:0070831) |
| 0.2 | 1.5 | GO:0009146 | purine nucleoside triphosphate catabolic process(GO:0009146) |
| 0.2 | 1.1 | GO:0097070 | ductus arteriosus closure(GO:0097070) |
| 0.2 | 2.8 | GO:0035095 | behavioral response to nicotine(GO:0035095) |
| 0.2 | 1.1 | GO:1903237 | negative regulation of leukocyte tethering or rolling(GO:1903237) |
| 0.2 | 0.9 | GO:0018214 | peptidyl-glutamic acid carboxylation(GO:0017187) protein carboxylation(GO:0018214) |
| 0.2 | 2.1 | GO:0019227 | neuronal action potential propagation(GO:0019227) action potential propagation(GO:0098870) |
| 0.2 | 11.5 | GO:0010765 | positive regulation of sodium ion transport(GO:0010765) |
| 0.2 | 1.4 | GO:0000711 | meiotic DNA repair synthesis(GO:0000711) |
| 0.2 | 2.0 | GO:0006857 | oligopeptide transport(GO:0006857) |
| 0.2 | 1.4 | GO:0032509 | endosome transport via multivesicular body sorting pathway(GO:0032509) late endosome to vacuole transport via multivesicular body sorting pathway(GO:0032511) |
| 0.2 | 5.4 | GO:0042036 | negative regulation of cytokine biosynthetic process(GO:0042036) |
| 0.2 | 0.4 | GO:0006701 | progesterone biosynthetic process(GO:0006701) |
| 0.2 | 2.5 | GO:0016127 | cholesterol catabolic process(GO:0006707) sterol catabolic process(GO:0016127) |
| 0.2 | 1.2 | GO:0036091 | positive regulation of transcription from RNA polymerase II promoter in response to oxidative stress(GO:0036091) |
| 0.2 | 1.7 | GO:0007171 | activation of transmembrane receptor protein tyrosine kinase activity(GO:0007171) prolactin signaling pathway(GO:0038161) |
| 0.2 | 2.4 | GO:0060158 | phospholipase C-activating dopamine receptor signaling pathway(GO:0060158) |
| 0.2 | 0.7 | GO:1901838 | positive regulation of transcription of nuclear large rRNA transcript from RNA polymerase I promoter(GO:1901838) |
| 0.2 | 0.7 | GO:1904158 | axonemal central apparatus assembly(GO:1904158) |
| 0.2 | 3.4 | GO:0035435 | phosphate ion transmembrane transport(GO:0035435) |
| 0.2 | 1.0 | GO:0000492 | box C/D snoRNP assembly(GO:0000492) |
| 0.2 | 14.6 | GO:0032091 | negative regulation of protein binding(GO:0032091) |
| 0.2 | 0.9 | GO:0034393 | positive regulation of smooth muscle cell apoptotic process(GO:0034393) |
| 0.2 | 1.1 | GO:0090385 | phagosome-lysosome fusion(GO:0090385) |
| 0.2 | 4.8 | GO:0007616 | long-term memory(GO:0007616) |
| 0.2 | 1.4 | GO:0030277 | maintenance of gastrointestinal epithelium(GO:0030277) |
| 0.2 | 1.1 | GO:0098535 | de novo centriole assembly(GO:0098535) |
| 0.2 | 1.4 | GO:0048280 | vesicle fusion with Golgi apparatus(GO:0048280) |
| 0.1 | 1.0 | GO:0070535 | histone H2A K63-linked ubiquitination(GO:0070535) |
| 0.1 | 1.7 | GO:0070863 | vacuolar proton-transporting V-type ATPase complex assembly(GO:0070072) positive regulation of protein exit from endoplasmic reticulum(GO:0070863) |
| 0.1 | 1.3 | GO:0043983 | histone H4-K12 acetylation(GO:0043983) |
| 0.1 | 1.0 | GO:0006688 | glycosphingolipid biosynthetic process(GO:0006688) |
| 0.1 | 7.1 | GO:0035987 | endodermal cell differentiation(GO:0035987) |
| 0.1 | 3.5 | GO:0046856 | phosphatidylinositol dephosphorylation(GO:0046856) |
| 0.1 | 1.0 | GO:0048096 | chromatin-mediated maintenance of transcription(GO:0048096) |
| 0.1 | 0.4 | GO:0014916 | cell proliferation involved in heart valve morphogenesis(GO:0003249) regulation of cell proliferation involved in heart valve morphogenesis(GO:0003250) regulation of lung blood pressure(GO:0014916) negative regulation of cell proliferation involved in heart morphogenesis(GO:2000137) cell proliferation involved in heart valve development(GO:2000793) |
| 0.1 | 2.5 | GO:0010971 | positive regulation of G2/M transition of mitotic cell cycle(GO:0010971) |
| 0.1 | 0.9 | GO:0051045 | negative regulation of membrane protein ectodomain proteolysis(GO:0051045) |
| 0.1 | 2.5 | GO:0042832 | defense response to protozoan(GO:0042832) |
| 0.1 | 2.1 | GO:0099517 | anterograde synaptic vesicle transport(GO:0048490) synaptic vesicle cytoskeletal transport(GO:0099514) synaptic vesicle transport along microtubule(GO:0099517) |
| 0.1 | 3.6 | GO:0015991 | ATP hydrolysis coupled proton transport(GO:0015991) |
| 0.1 | 1.2 | GO:0060294 | cilium movement involved in cell motility(GO:0060294) |
| 0.1 | 3.9 | GO:0042073 | intraciliary transport(GO:0042073) |
| 0.1 | 1.7 | GO:2001256 | regulation of store-operated calcium entry(GO:2001256) |
| 0.1 | 0.2 | GO:0097105 | presynaptic membrane assembly(GO:0097105) |
| 0.1 | 0.6 | GO:0001812 | positive regulation of type I hypersensitivity(GO:0001812) |
| 0.1 | 7.2 | GO:0035249 | synaptic transmission, glutamatergic(GO:0035249) |
| 0.1 | 1.8 | GO:0050901 | leukocyte tethering or rolling(GO:0050901) |
| 0.1 | 0.5 | GO:0050828 | regulation of liquid surface tension(GO:0050828) |
| 0.1 | 4.1 | GO:0048013 | ephrin receptor signaling pathway(GO:0048013) |
| 0.1 | 1.4 | GO:0006590 | thyroid hormone generation(GO:0006590) |
| 0.1 | 3.6 | GO:0046426 | negative regulation of JAK-STAT cascade(GO:0046426) negative regulation of STAT cascade(GO:1904893) |
| 0.1 | 0.4 | GO:0000454 | snoRNA guided rRNA pseudouridine synthesis(GO:0000454) |
| 0.1 | 1.6 | GO:0032012 | regulation of ARF protein signal transduction(GO:0032012) |
| 0.1 | 0.2 | GO:0000491 | small nucleolar ribonucleoprotein complex assembly(GO:0000491) |
| 0.1 | 3.3 | GO:0045668 | negative regulation of osteoblast differentiation(GO:0045668) |
| 0.1 | 0.5 | GO:0021636 | trigeminal nerve morphogenesis(GO:0021636) trigeminal nerve structural organization(GO:0021637) trunk segmentation(GO:0035290) trunk neural crest cell migration(GO:0036484) ventral trunk neural crest cell migration(GO:0036486) sympathetic neuron projection extension(GO:0097490) sympathetic neuron projection guidance(GO:0097491) semaphorin-plexin signaling pathway involved in axon guidance(GO:1902287) |
| 0.1 | 2.7 | GO:0000184 | nuclear-transcribed mRNA catabolic process, nonsense-mediated decay(GO:0000184) |
| 0.1 | 5.2 | GO:0071300 | cellular response to retinoic acid(GO:0071300) |
| 0.1 | 2.1 | GO:0007099 | centriole replication(GO:0007099) |
| 0.1 | 0.6 | GO:0090286 | cytoskeletal anchoring at nuclear membrane(GO:0090286) |
| 0.1 | 0.6 | GO:0007603 | phototransduction, visible light(GO:0007603) |
| 0.1 | 1.0 | GO:0048820 | hair follicle maturation(GO:0048820) |
| 0.1 | 2.9 | GO:0000413 | protein peptidyl-prolyl isomerization(GO:0000413) |
| 0.1 | 1.3 | GO:0033327 | Leydig cell differentiation(GO:0033327) |
| 0.1 | 0.7 | GO:1902231 | positive regulation of intrinsic apoptotic signaling pathway in response to DNA damage(GO:1902231) |
| 0.1 | 0.5 | GO:0060394 | negative regulation of pathway-restricted SMAD protein phosphorylation(GO:0060394) |
| 0.1 | 2.2 | GO:0018345 | protein palmitoylation(GO:0018345) |
| 0.1 | 0.9 | GO:0008211 | glucocorticoid metabolic process(GO:0008211) |
| 0.1 | 0.5 | GO:0018298 | protein-chromophore linkage(GO:0018298) |
| 0.1 | 6.5 | GO:0042552 | myelination(GO:0042552) |
| 0.1 | 1.6 | GO:0007095 | mitotic G2 DNA damage checkpoint(GO:0007095) G2 DNA damage checkpoint(GO:0031572) |
| 0.1 | 0.3 | GO:0031620 | regulation of fever generation(GO:0031620) positive regulation of fever generation(GO:0031622) |
| 0.1 | 0.3 | GO:0000066 | mitochondrial ornithine transport(GO:0000066) |
| 0.1 | 6.1 | GO:0042476 | odontogenesis(GO:0042476) |
| 0.1 | 0.2 | GO:2001168 | regulation of histone H2B ubiquitination(GO:2001166) positive regulation of histone H2B ubiquitination(GO:2001168) |
| 0.0 | 0.3 | GO:0008063 | Toll signaling pathway(GO:0008063) |
| 0.0 | 5.5 | GO:0001508 | action potential(GO:0001508) |
| 0.0 | 1.8 | GO:0001658 | branching involved in ureteric bud morphogenesis(GO:0001658) |
| 0.0 | 0.2 | GO:0031666 | positive regulation of lipopolysaccharide-mediated signaling pathway(GO:0031666) |
| 0.0 | 0.1 | GO:0035887 | aortic smooth muscle cell differentiation(GO:0035887) |
| 0.0 | 0.5 | GO:0070935 | 3'-UTR-mediated mRNA stabilization(GO:0070935) |
| 0.0 | 0.7 | GO:0045948 | positive regulation of translational initiation(GO:0045948) |
| 0.0 | 3.6 | GO:0051028 | mRNA transport(GO:0051028) |
| 0.0 | 0.3 | GO:1990034 | calcium ion export from cell(GO:1990034) |
| 0.0 | 1.8 | GO:0000245 | spliceosomal complex assembly(GO:0000245) |
| 0.0 | 0.3 | GO:0000244 | spliceosomal tri-snRNP complex assembly(GO:0000244) |
| 0.0 | 0.4 | GO:0018095 | protein polyglutamylation(GO:0018095) |
| 0.0 | 0.2 | GO:0071787 | endoplasmic reticulum tubular network assembly(GO:0071787) |
| 0.0 | 3.8 | GO:0030307 | positive regulation of cell growth(GO:0030307) |
| 0.0 | 0.6 | GO:0007271 | synaptic transmission, cholinergic(GO:0007271) |
| 0.0 | 2.6 | GO:0035308 | negative regulation of protein dephosphorylation(GO:0035308) |
| 0.0 | 2.2 | GO:0042147 | retrograde transport, endosome to Golgi(GO:0042147) |
| 0.0 | 12.6 | GO:0043547 | positive regulation of GTPase activity(GO:0043547) |
| 0.0 | 0.8 | GO:0048791 | calcium ion-regulated exocytosis of neurotransmitter(GO:0048791) |
| 0.0 | 1.1 | GO:0000462 | maturation of SSU-rRNA from tricistronic rRNA transcript (SSU-rRNA, 5.8S rRNA, LSU-rRNA)(GO:0000462) |
| 0.0 | 0.1 | GO:1900364 | negative regulation of mRNA 3'-end processing(GO:0031441) negative regulation of mRNA polyadenylation(GO:1900364) |
| 0.0 | 0.1 | GO:0071907 | determination of digestive tract left/right asymmetry(GO:0071907) |
| 0.0 | 0.5 | GO:0045494 | photoreceptor cell maintenance(GO:0045494) |
| 0.0 | 0.3 | GO:0043666 | regulation of phosphoprotein phosphatase activity(GO:0043666) |
| 0.0 | 0.0 | GO:0010961 | cellular magnesium ion homeostasis(GO:0010961) |
| 0.0 | 0.1 | GO:2000465 | regulation of glycogen (starch) synthase activity(GO:2000465) positive regulation of glycogen (starch) synthase activity(GO:2000467) |
| 0.0 | 0.4 | GO:0031297 | replication fork processing(GO:0031297) |
| 0.0 | 0.4 | GO:0006336 | DNA replication-independent nucleosome assembly(GO:0006336) |
| 0.0 | 0.6 | GO:0032418 | lysosome localization(GO:0032418) |
| 0.0 | 0.2 | GO:2000269 | regulation of fibroblast apoptotic process(GO:2000269) |
| 0.0 | 0.4 | GO:0031648 | protein destabilization(GO:0031648) |
| 0.0 | 0.2 | GO:0008340 | determination of adult lifespan(GO:0008340) |
| 0.0 | 0.6 | GO:0000271 | polysaccharide biosynthetic process(GO:0000271) |
| 0.0 | 0.3 | GO:0006270 | DNA replication initiation(GO:0006270) |
Gene overrepresentation in cellular component category:
| Log-likelihood per target | Total log-likelihood | Term | Description |
|---|---|---|---|
| 3.4 | 10.2 | GO:0005960 | glycine cleavage complex(GO:0005960) |
| 2.3 | 9.2 | GO:0045298 | tubulin complex(GO:0045298) |
| 2.3 | 6.8 | GO:0044317 | rod spherule(GO:0044317) |
| 1.9 | 11.5 | GO:0032444 | activin responsive factor complex(GO:0032444) |
| 1.9 | 9.3 | GO:0072534 | perineuronal net(GO:0072534) |
| 1.5 | 6.1 | GO:0005607 | laminin-2 complex(GO:0005607) |
| 1.4 | 22.6 | GO:0005883 | neurofilament(GO:0005883) |
| 1.2 | 14.1 | GO:0098839 | postsynaptic density membrane(GO:0098839) |
| 0.8 | 5.8 | GO:1990357 | terminal web(GO:1990357) |
| 0.8 | 13.2 | GO:0031235 | intrinsic component of the cytoplasmic side of the plasma membrane(GO:0031235) |
| 0.8 | 3.1 | GO:0061474 | phagolysosome membrane(GO:0061474) |
| 0.7 | 18.6 | GO:0043218 | compact myelin(GO:0043218) |
| 0.7 | 3.6 | GO:0000221 | vacuolar proton-transporting V-type ATPase, V1 domain(GO:0000221) |
| 0.7 | 5.9 | GO:0000138 | Golgi trans cisterna(GO:0000138) |
| 0.6 | 4.4 | GO:0030991 | intraciliary transport particle A(GO:0030991) |
| 0.6 | 1.8 | GO:0071006 | U2-type catalytic step 1 spliceosome(GO:0071006) |
| 0.6 | 7.2 | GO:0043083 | synaptic cleft(GO:0043083) |
| 0.6 | 13.5 | GO:1902711 | GABA-A receptor complex(GO:1902711) |
| 0.6 | 1.7 | GO:0000110 | nucleotide-excision repair factor 1 complex(GO:0000110) |
| 0.6 | 11.5 | GO:0005892 | acetylcholine-gated channel complex(GO:0005892) |
| 0.6 | 12.0 | GO:0005922 | connexon complex(GO:0005922) |
| 0.5 | 4.2 | GO:1990316 | ATG1/ULK1 kinase complex(GO:1990316) |
| 0.5 | 5.2 | GO:0048787 | presynaptic active zone membrane(GO:0048787) |
| 0.5 | 2.5 | GO:0034098 | VCP-NPL4-UFD1 AAA ATPase complex(GO:0034098) |
| 0.5 | 2.0 | GO:0002079 | inner acrosomal membrane(GO:0002079) |
| 0.5 | 2.8 | GO:1990696 | stereocilia ankle link complex(GO:0002142) USH2 complex(GO:1990696) |
| 0.5 | 24.2 | GO:0098878 | ionotropic glutamate receptor complex(GO:0008328) neurotransmitter receptor complex(GO:0098878) |
| 0.4 | 1.3 | GO:0071942 | XPC complex(GO:0071942) |
| 0.4 | 1.7 | GO:0032299 | ribonuclease H2 complex(GO:0032299) |
| 0.4 | 11.1 | GO:0005640 | nuclear outer membrane(GO:0005640) |
| 0.4 | 16.2 | GO:0030173 | integral component of Golgi membrane(GO:0030173) |
| 0.4 | 4.7 | GO:0031143 | pseudopodium(GO:0031143) |
| 0.4 | 2.2 | GO:0089701 | U2AF(GO:0089701) |
| 0.4 | 2.1 | GO:0030123 | AP-3 adaptor complex(GO:0030123) |
| 0.3 | 2.4 | GO:0071986 | Ragulator complex(GO:0071986) |
| 0.3 | 4.7 | GO:0030897 | HOPS complex(GO:0030897) |
| 0.3 | 13.4 | GO:0048786 | presynaptic active zone(GO:0048786) |
| 0.3 | 4.1 | GO:0032279 | asymmetric synapse(GO:0032279) |
| 0.3 | 1.8 | GO:0044326 | chromaffin granule membrane(GO:0042584) dendritic spine neck(GO:0044326) |
| 0.3 | 3.4 | GO:0005859 | muscle myosin complex(GO:0005859) |
| 0.3 | 1.6 | GO:0097441 | basilar dendrite(GO:0097441) |
| 0.3 | 7.1 | GO:0000159 | protein phosphatase type 2A complex(GO:0000159) |
| 0.3 | 12.3 | GO:0045171 | intercellular bridge(GO:0045171) |
| 0.3 | 2.3 | GO:0034366 | spherical high-density lipoprotein particle(GO:0034366) |
| 0.2 | 1.5 | GO:0060205 | cytoplasmic membrane-bounded vesicle lumen(GO:0060205) |
| 0.2 | 9.7 | GO:0005834 | heterotrimeric G-protein complex(GO:0005834) |
| 0.2 | 14.9 | GO:0034704 | calcium channel complex(GO:0034704) |
| 0.2 | 4.0 | GO:0031362 | anchored component of external side of plasma membrane(GO:0031362) |
| 0.2 | 4.9 | GO:0031430 | M band(GO:0031430) |
| 0.2 | 4.4 | GO:0010369 | chromocenter(GO:0010369) |
| 0.2 | 1.1 | GO:0098536 | deuterosome(GO:0098536) |
| 0.2 | 10.1 | GO:0031201 | SNARE complex(GO:0031201) |
| 0.2 | 4.0 | GO:0001518 | voltage-gated sodium channel complex(GO:0001518) |
| 0.2 | 16.7 | GO:0031225 | anchored component of membrane(GO:0031225) |
| 0.2 | 1.7 | GO:0016461 | unconventional myosin complex(GO:0016461) |
| 0.2 | 2.5 | GO:0008278 | cohesin complex(GO:0008278) |
| 0.2 | 30.7 | GO:0043197 | dendritic spine(GO:0043197) |
| 0.2 | 1.3 | GO:0042627 | chylomicron(GO:0042627) |
| 0.2 | 1.0 | GO:0000125 | PCAF complex(GO:0000125) pre-snoRNP complex(GO:0070761) |
| 0.2 | 0.6 | GO:0042571 | immunoglobulin complex, circulating(GO:0042571) |
| 0.2 | 4.5 | GO:0034451 | centriolar satellite(GO:0034451) |
| 0.1 | 0.6 | GO:0034993 | microtubule organizing center attachment site(GO:0034992) LINC complex(GO:0034993) |
| 0.1 | 3.9 | GO:0030992 | intraciliary transport particle B(GO:0030992) |
| 0.1 | 1.9 | GO:0035253 | ciliary rootlet(GO:0035253) |
| 0.1 | 0.7 | GO:0001651 | dense fibrillar component(GO:0001651) |
| 0.1 | 18.4 | GO:0030658 | transport vesicle membrane(GO:0030658) |
| 0.1 | 7.7 | GO:0005871 | kinesin complex(GO:0005871) |
| 0.1 | 20.5 | GO:0043204 | perikaryon(GO:0043204) |
| 0.1 | 1.2 | GO:0070531 | BRCA1-A complex(GO:0070531) |
| 0.1 | 2.4 | GO:0005686 | U2 snRNP(GO:0005686) |
| 0.1 | 15.6 | GO:0055037 | recycling endosome(GO:0055037) |
| 0.1 | 2.1 | GO:1990124 | messenger ribonucleoprotein complex(GO:1990124) |
| 0.1 | 11.0 | GO:0036064 | ciliary basal body(GO:0036064) |
| 0.1 | 8.3 | GO:0045178 | basal part of cell(GO:0045178) |
| 0.1 | 1.5 | GO:0035145 | exon-exon junction complex(GO:0035145) |
| 0.1 | 0.6 | GO:0034388 | Pwp2p-containing subcomplex of 90S preribosome(GO:0034388) |
| 0.1 | 1.0 | GO:0042734 | presynaptic membrane(GO:0042734) |
| 0.1 | 9.3 | GO:0045211 | postsynaptic membrane(GO:0045211) |
| 0.1 | 1.1 | GO:0005796 | Golgi lumen(GO:0005796) |
| 0.1 | 6.1 | GO:0031903 | peroxisomal membrane(GO:0005778) microbody membrane(GO:0031903) |
| 0.1 | 2.2 | GO:0000421 | autophagosome membrane(GO:0000421) |
| 0.1 | 1.8 | GO:0005665 | DNA-directed RNA polymerase II, core complex(GO:0005665) |
| 0.1 | 16.1 | GO:0016323 | basolateral plasma membrane(GO:0016323) |
| 0.1 | 15.0 | GO:0005765 | lysosomal membrane(GO:0005765) lytic vacuole membrane(GO:0098852) |
| 0.1 | 2.1 | GO:0005905 | clathrin-coated pit(GO:0005905) |
| 0.1 | 30.9 | GO:0030424 | axon(GO:0030424) |
| 0.1 | 0.4 | GO:0090661 | box H/ACA telomerase RNP complex(GO:0090661) |
| 0.1 | 4.8 | GO:0005902 | microvillus(GO:0005902) |
| 0.1 | 3.6 | GO:0016592 | mediator complex(GO:0016592) |
| 0.1 | 27.6 | GO:0000139 | Golgi membrane(GO:0000139) |
| 0.1 | 4.4 | GO:0098793 | presynapse(GO:0098793) |
| 0.1 | 0.4 | GO:0071821 | FANCM-MHF complex(GO:0071821) |
| 0.1 | 5.8 | GO:0005770 | late endosome(GO:0005770) |
| 0.1 | 8.2 | GO:0030027 | lamellipodium(GO:0030027) |
| 0.1 | 12.4 | GO:0030425 | dendrite(GO:0030425) |
| 0.1 | 3.4 | GO:0005811 | lipid particle(GO:0005811) |
| 0.1 | 2.3 | GO:0035861 | site of double-strand break(GO:0035861) |
| 0.1 | 0.5 | GO:0005850 | eukaryotic translation initiation factor 2 complex(GO:0005850) |
| 0.1 | 2.8 | GO:0005884 | actin filament(GO:0005884) |
| 0.1 | 4.4 | GO:0030176 | integral component of endoplasmic reticulum membrane(GO:0030176) |
| 0.1 | 0.2 | GO:0033503 | HULC complex(GO:0033503) |
| 0.0 | 0.3 | GO:0097550 | transcriptional preinitiation complex(GO:0097550) |
| 0.0 | 0.3 | GO:0016589 | NURF complex(GO:0016589) |
| 0.0 | 17.1 | GO:0048471 | perinuclear region of cytoplasm(GO:0048471) |
| 0.0 | 5.1 | GO:0001650 | fibrillar center(GO:0001650) |
| 0.0 | 0.8 | GO:0019013 | viral nucleocapsid(GO:0019013) |
| 0.0 | 2.1 | GO:0005814 | centriole(GO:0005814) |
| 0.0 | 0.7 | GO:0005868 | cytoplasmic dynein complex(GO:0005868) |
| 0.0 | 1.3 | GO:0099572 | postsynaptic density(GO:0014069) postsynaptic specialization(GO:0099572) |
| 0.0 | 1.0 | GO:0008023 | transcription elongation factor complex(GO:0008023) |
| 0.0 | 3.8 | GO:0045111 | intermediate filament cytoskeleton(GO:0045111) |
| 0.0 | 0.1 | GO:0032044 | DSIF complex(GO:0032044) |
| 0.0 | 0.7 | GO:0015030 | Cajal body(GO:0015030) |
| 0.0 | 7.5 | GO:0005667 | transcription factor complex(GO:0005667) |
| 0.0 | 7.0 | GO:0016607 | nuclear speck(GO:0016607) |
| 0.0 | 0.5 | GO:0001533 | cornified envelope(GO:0001533) |
| 0.0 | 1.3 | GO:0005643 | nuclear pore(GO:0005643) |
| 0.0 | 2.5 | GO:0043025 | neuronal cell body(GO:0043025) |
| 0.0 | 0.5 | GO:0031901 | early endosome membrane(GO:0031901) |
| 0.0 | 1.0 | GO:0005758 | mitochondrial intermembrane space(GO:0005758) |
| 0.0 | 1.1 | GO:0030496 | midbody(GO:0030496) |
| 0.0 | 0.4 | GO:0030686 | 90S preribosome(GO:0030686) |
| 0.0 | 2.7 | GO:0005764 | lytic vacuole(GO:0000323) lysosome(GO:0005764) |
| 0.0 | 1.8 | GO:0045202 | synapse(GO:0045202) |
| 0.0 | 1.0 | GO:0000123 | histone acetyltransferase complex(GO:0000123) |
| 0.0 | 0.1 | GO:0034045 | pre-autophagosomal structure membrane(GO:0034045) |
| 0.0 | 0.2 | GO:0005680 | anaphase-promoting complex(GO:0005680) |
| 0.0 | 1.9 | GO:0005874 | microtubule(GO:0005874) |
| 0.0 | 4.6 | GO:0005789 | endoplasmic reticulum membrane(GO:0005789) |
Gene overrepresentation in molecular function category:
| Log-likelihood per target | Total log-likelihood | Term | Description |
|---|---|---|---|
| 4.7 | 14.0 | GO:0001565 | phorbol ester receptor activity(GO:0001565) |
| 3.9 | 11.6 | GO:0031752 | D5 dopamine receptor binding(GO:0031752) |
| 3.8 | 11.4 | GO:0003828 | alpha-N-acetylneuraminate alpha-2,8-sialyltransferase activity(GO:0003828) |
| 3.7 | 18.3 | GO:1904315 | benzodiazepine receptor activity(GO:0008503) transmitter-gated ion channel activity involved in regulation of postsynaptic membrane potential(GO:1904315) |
| 2.8 | 11.4 | GO:0003835 | beta-galactoside alpha-2,6-sialyltransferase activity(GO:0003835) |
| 2.3 | 9.2 | GO:0099609 | microtubule lateral binding(GO:0099609) |
| 2.3 | 11.4 | GO:0008332 | low voltage-gated calcium channel activity(GO:0008332) |
| 2.2 | 15.4 | GO:0004111 | creatine kinase activity(GO:0004111) |
| 2.0 | 13.8 | GO:0004332 | fructose-bisphosphate aldolase activity(GO:0004332) |
| 1.8 | 21.3 | GO:0015216 | purine nucleotide transmembrane transporter activity(GO:0015216) |
| 1.8 | 14.1 | GO:0004972 | NMDA glutamate receptor activity(GO:0004972) |
| 1.6 | 6.5 | GO:0015272 | ATP-activated inward rectifier potassium channel activity(GO:0015272) |
| 1.6 | 4.7 | GO:0031762 | follicle-stimulating hormone receptor binding(GO:0031762) vasopressin receptor binding(GO:0031893) |
| 1.5 | 18.6 | GO:0019911 | structural constituent of myelin sheath(GO:0019911) |
| 1.5 | 4.4 | GO:0034041 | sterol-transporting ATPase activity(GO:0034041) glycoprotein transporter activity(GO:0034437) |
| 1.4 | 17.2 | GO:0004970 | ionotropic glutamate receptor activity(GO:0004970) |
| 1.4 | 4.3 | GO:0050294 | steroid sulfotransferase activity(GO:0050294) |
| 1.4 | 4.3 | GO:0051185 | coenzyme transporter activity(GO:0051185) |
| 1.4 | 4.2 | GO:0004736 | pyruvate carboxylase activity(GO:0004736) |
| 1.2 | 4.9 | GO:0004082 | bisphosphoglycerate mutase activity(GO:0004082) phosphoglycerate mutase activity(GO:0004619) 2,3-bisphosphoglycerate-dependent phosphoglycerate mutase activity(GO:0046538) |
| 1.2 | 11.7 | GO:0016909 | JUN kinase activity(GO:0004705) SAP kinase activity(GO:0016909) |
| 1.2 | 3.5 | GO:0043812 | phosphatidylinositol-4-phosphate phosphatase activity(GO:0043812) |
| 1.1 | 5.4 | GO:0001665 | alpha-N-acetylgalactosaminide alpha-2,6-sialyltransferase activity(GO:0001665) |
| 1.0 | 3.1 | GO:0004046 | aminoacylase activity(GO:0004046) |
| 1.0 | 5.1 | GO:0004416 | hydroxyacylglutathione hydrolase activity(GO:0004416) |
| 1.0 | 12.2 | GO:0016290 | palmitoyl-CoA hydrolase activity(GO:0016290) |
| 1.0 | 4.1 | GO:0001733 | galactosylceramide sulfotransferase activity(GO:0001733) |
| 1.0 | 3.0 | GO:0009041 | uridylate kinase activity(GO:0009041) nucleoside phosphate kinase activity(GO:0050145) |
| 1.0 | 17.9 | GO:0043295 | glutathione binding(GO:0043295) |
| 1.0 | 5.0 | GO:0070891 | lipoteichoic acid binding(GO:0070891) |
| 1.0 | 2.9 | GO:0070012 | oligopeptidase activity(GO:0070012) |
| 0.9 | 18.0 | GO:0017081 | chloride channel regulator activity(GO:0017081) |
| 0.8 | 13.2 | GO:0005313 | L-glutamate transmembrane transporter activity(GO:0005313) |
| 0.8 | 4.1 | GO:0016907 | G-protein coupled acetylcholine receptor activity(GO:0016907) |
| 0.8 | 2.4 | GO:0004833 | tryptophan 2,3-dioxygenase activity(GO:0004833) |
| 0.8 | 2.3 | GO:0102007 | lactonohydrolase activity(GO:0046573) acyl-L-homoserine-lactone lactonohydrolase activity(GO:0102007) |
| 0.8 | 3.0 | GO:0004699 | calcium-independent protein kinase C activity(GO:0004699) |
| 0.8 | 3.0 | GO:0047619 | acylcarnitine hydrolase activity(GO:0047619) |
| 0.7 | 10.5 | GO:0016594 | glycine binding(GO:0016594) |
| 0.7 | 9.7 | GO:0045294 | alpha-catenin binding(GO:0045294) |
| 0.7 | 8.6 | GO:0009931 | calcium-dependent protein serine/threonine kinase activity(GO:0009931) |
| 0.7 | 2.8 | GO:0008670 | 2,4-dienoyl-CoA reductase (NADPH) activity(GO:0008670) trans-2-enoyl-CoA reductase (NADPH) activity(GO:0019166) |
| 0.7 | 2.7 | GO:0035529 | NADH pyrophosphatase activity(GO:0035529) |
| 0.7 | 11.5 | GO:0070410 | co-SMAD binding(GO:0070410) |
| 0.7 | 12.0 | GO:0015279 | store-operated calcium channel activity(GO:0015279) |
| 0.7 | 15.1 | GO:0032183 | SUMO binding(GO:0032183) |
| 0.6 | 7.6 | GO:0005436 | sodium:phosphate symporter activity(GO:0005436) |
| 0.6 | 3.2 | GO:0004945 | angiotensin type II receptor activity(GO:0004945) endothelin receptor activity(GO:0004962) |
| 0.6 | 5.0 | GO:0008172 | S-methyltransferase activity(GO:0008172) |
| 0.6 | 4.2 | GO:0097109 | neuroligin family protein binding(GO:0097109) |
| 0.6 | 1.7 | GO:0003945 | N-acetyllactosamine synthase activity(GO:0003945) |
| 0.6 | 6.8 | GO:0019864 | IgG binding(GO:0019864) |
| 0.6 | 1.7 | GO:0004925 | prolactin receptor activity(GO:0004925) |
| 0.5 | 5.9 | GO:0004653 | polypeptide N-acetylgalactosaminyltransferase activity(GO:0004653) |
| 0.5 | 15.5 | GO:0005385 | zinc ion transmembrane transporter activity(GO:0005385) |
| 0.5 | 2.0 | GO:0031731 | CCR6 chemokine receptor binding(GO:0031731) |
| 0.5 | 2.5 | GO:0035473 | lipase binding(GO:0035473) |
| 0.5 | 2.4 | GO:0004969 | histamine receptor activity(GO:0004969) |
| 0.5 | 1.4 | GO:0008458 | carnitine O-octanoyltransferase activity(GO:0008458) O-octanoyltransferase activity(GO:0016414) |
| 0.5 | 1.4 | GO:0070573 | metallodipeptidase activity(GO:0070573) |
| 0.5 | 2.3 | GO:0031726 | CCR1 chemokine receptor binding(GO:0031726) |
| 0.4 | 7.1 | GO:0008271 | secondary active sulfate transmembrane transporter activity(GO:0008271) |
| 0.4 | 1.3 | GO:0032795 | heterotrimeric G-protein binding(GO:0032795) |
| 0.4 | 1.3 | GO:0060230 | lipoprotein lipase activator activity(GO:0060230) |
| 0.4 | 1.7 | GO:1990599 | 3' overhang single-stranded DNA endodeoxyribonuclease activity(GO:1990599) |
| 0.4 | 5.2 | GO:0035612 | AP-2 adaptor complex binding(GO:0035612) |
| 0.4 | 1.7 | GO:0003918 | DNA topoisomerase type II (ATP-hydrolyzing) activity(GO:0003918) DNA topoisomerase II activity(GO:0061505) |
| 0.4 | 2.5 | GO:0003854 | 3-beta-hydroxy-delta5-steroid dehydrogenase activity(GO:0003854) |
| 0.4 | 3.6 | GO:0008553 | hydrogen-exporting ATPase activity, phosphorylative mechanism(GO:0008553) |
| 0.4 | 2.7 | GO:0070095 | fructose-6-phosphate binding(GO:0070095) |
| 0.4 | 6.8 | GO:0005522 | profilin binding(GO:0005522) |
| 0.4 | 1.4 | GO:0016019 | peptidoglycan receptor activity(GO:0016019) |
| 0.3 | 5.2 | GO:0017110 | nucleoside-diphosphatase activity(GO:0017110) |
| 0.3 | 2.0 | GO:0015198 | oligopeptide transporter activity(GO:0015198) |
| 0.3 | 5.3 | GO:0008376 | acetylgalactosaminyltransferase activity(GO:0008376) |
| 0.3 | 17.8 | GO:0001786 | phosphatidylserine binding(GO:0001786) |
| 0.3 | 1.2 | GO:0015057 | thrombin receptor activity(GO:0015057) |
| 0.3 | 29.3 | GO:0008081 | phosphoric diester hydrolase activity(GO:0008081) |
| 0.3 | 0.9 | GO:0016900 | oxidoreductase activity, acting on the CH-OH group of donors, disulfide as acceptor(GO:0016900) vitamin-K-epoxide reductase (warfarin-sensitive) activity(GO:0047057) |
| 0.3 | 4.2 | GO:0035497 | cAMP response element binding(GO:0035497) |
| 0.3 | 2.5 | GO:0016929 | SUMO-specific protease activity(GO:0016929) |
| 0.3 | 1.4 | GO:0005134 | interleukin-2 receptor binding(GO:0005134) |
| 0.3 | 3.5 | GO:0047372 | acylglycerol lipase activity(GO:0047372) |
| 0.3 | 1.8 | GO:0004865 | protein serine/threonine phosphatase inhibitor activity(GO:0004865) |
| 0.3 | 8.0 | GO:0017075 | syntaxin-1 binding(GO:0017075) |
| 0.3 | 5.1 | GO:0008171 | O-methyltransferase activity(GO:0008171) |
| 0.2 | 1.0 | GO:0008489 | UDP-galactose:glucosylceramide beta-1,4-galactosyltransferase activity(GO:0008489) |
| 0.2 | 1.4 | GO:0004568 | chitinase activity(GO:0004568) |
| 0.2 | 3.1 | GO:0005542 | folic acid binding(GO:0005542) |
| 0.2 | 0.7 | GO:0042134 | rRNA primary transcript binding(GO:0042134) |
| 0.2 | 3.1 | GO:0004089 | carbonate dehydratase activity(GO:0004089) |
| 0.2 | 6.7 | GO:0015020 | glucuronosyltransferase activity(GO:0015020) |
| 0.2 | 3.4 | GO:0015464 | acetylcholine receptor activity(GO:0015464) acetylcholine-gated cation channel activity(GO:0022848) |
| 0.2 | 1.1 | GO:0004301 | epoxide hydrolase activity(GO:0004301) |
| 0.2 | 2.2 | GO:0030628 | pre-mRNA 3'-splice site binding(GO:0030628) |
| 0.2 | 1.1 | GO:0004784 | superoxide dismutase activity(GO:0004784) oxidoreductase activity, acting on superoxide radicals as acceptor(GO:0016721) |
| 0.2 | 3.1 | GO:0019865 | immunoglobulin binding(GO:0019865) |
| 0.2 | 2.4 | GO:0043560 | insulin receptor substrate binding(GO:0043560) |
| 0.2 | 4.0 | GO:0003746 | translation elongation factor activity(GO:0003746) |
| 0.2 | 1.1 | GO:0008467 | [heparan sulfate]-glucosamine 3-sulfotransferase 1 activity(GO:0008467) |
| 0.2 | 1.1 | GO:0015189 | L-lysine transmembrane transporter activity(GO:0015189) |
| 0.2 | 4.2 | GO:0005070 | SH3/SH2 adaptor activity(GO:0005070) |
| 0.2 | 1.3 | GO:0016832 | aldehyde-lyase activity(GO:0016832) |
| 0.2 | 1.8 | GO:0070492 | oligosaccharide binding(GO:0070492) |
| 0.2 | 3.0 | GO:0010181 | FMN binding(GO:0010181) |
| 0.1 | 4.0 | GO:0005248 | voltage-gated sodium channel activity(GO:0005248) |
| 0.1 | 4.1 | GO:0071889 | 14-3-3 protein binding(GO:0071889) |
| 0.1 | 1.0 | GO:0045503 | dynein light chain binding(GO:0045503) |
| 0.1 | 1.7 | GO:0070008 | serine-type exopeptidase activity(GO:0070008) |
| 0.1 | 4.1 | GO:0046875 | ephrin receptor binding(GO:0046875) |
| 0.1 | 1.0 | GO:0001075 | transcription factor activity, RNA polymerase II core promoter sequence-specific binding involved in preinitiation complex assembly(GO:0001075) |
| 0.1 | 5.3 | GO:0005154 | epidermal growth factor receptor binding(GO:0005154) |
| 0.1 | 17.7 | GO:0005088 | Ras guanyl-nucleotide exchange factor activity(GO:0005088) |
| 0.1 | 4.0 | GO:0008536 | Ran GTPase binding(GO:0008536) |
| 0.1 | 1.9 | GO:0031683 | G-protein beta/gamma-subunit complex binding(GO:0031683) |
| 0.1 | 4.0 | GO:0031369 | translation initiation factor binding(GO:0031369) |
| 0.1 | 1.2 | GO:0004887 | thyroid hormone receptor activity(GO:0004887) |
| 0.1 | 3.6 | GO:0005484 | SNAP receptor activity(GO:0005484) |
| 0.1 | 3.5 | GO:0016538 | cyclin-dependent protein serine/threonine kinase regulator activity(GO:0016538) |
| 0.1 | 14.4 | GO:0044325 | ion channel binding(GO:0044325) |
| 0.1 | 2.0 | GO:0001848 | complement binding(GO:0001848) |
| 0.1 | 2.7 | GO:0008395 | steroid hydroxylase activity(GO:0008395) |
| 0.1 | 9.3 | GO:0005178 | integrin binding(GO:0005178) |
| 0.1 | 5.6 | GO:0019888 | protein phosphatase regulator activity(GO:0019888) |
| 0.1 | 0.9 | GO:0008191 | metalloendopeptidase inhibitor activity(GO:0008191) |
| 0.1 | 4.8 | GO:0008146 | sulfotransferase activity(GO:0008146) |
| 0.1 | 3.9 | GO:0005044 | scavenger receptor activity(GO:0005044) |
| 0.1 | 1.5 | GO:0005123 | death receptor binding(GO:0005123) |
| 0.1 | 9.8 | GO:0001948 | glycoprotein binding(GO:0001948) |
| 0.1 | 2.3 | GO:0032266 | phosphatidylinositol-3-phosphate binding(GO:0032266) |
| 0.1 | 19.6 | GO:0005096 | GTPase activator activity(GO:0005096) |
| 0.1 | 1.6 | GO:0005086 | ARF guanyl-nucleotide exchange factor activity(GO:0005086) |
| 0.1 | 0.8 | GO:0016805 | dipeptidase activity(GO:0016805) |
| 0.1 | 1.1 | GO:0070403 | NAD+ binding(GO:0070403) |
| 0.1 | 0.4 | GO:0019198 | transmembrane receptor protein tyrosine phosphatase activity(GO:0005001) transmembrane receptor protein phosphatase activity(GO:0019198) |
| 0.1 | 25.5 | GO:0005525 | GTP binding(GO:0005525) |
| 0.1 | 0.4 | GO:0070739 | protein-glutamic acid ligase activity(GO:0070739) |
| 0.1 | 17.1 | GO:0008017 | microtubule binding(GO:0008017) |
| 0.1 | 1.5 | GO:0005388 | calcium-transporting ATPase activity(GO:0005388) |
| 0.1 | 2.9 | GO:0003755 | peptidyl-prolyl cis-trans isomerase activity(GO:0003755) |
| 0.1 | 0.5 | GO:0045499 | chemorepellent activity(GO:0045499) |
| 0.1 | 0.4 | GO:0036122 | BMP binding(GO:0036122) |
| 0.1 | 0.3 | GO:0000064 | L-ornithine transmembrane transporter activity(GO:0000064) |
| 0.1 | 1.4 | GO:0070530 | K63-linked polyubiquitin binding(GO:0070530) |
| 0.1 | 0.4 | GO:0034513 | box H/ACA snoRNA binding(GO:0034513) |
| 0.1 | 0.3 | GO:0003996 | acyl-CoA ligase activity(GO:0003996) |
| 0.0 | 1.2 | GO:0000062 | fatty-acyl-CoA binding(GO:0000062) |
| 0.0 | 1.0 | GO:0051537 | 2 iron, 2 sulfur cluster binding(GO:0051537) |
| 0.0 | 1.0 | GO:0000993 | RNA polymerase II core binding(GO:0000993) |
| 0.0 | 0.9 | GO:0005540 | hyaluronic acid binding(GO:0005540) |
| 0.0 | 2.6 | GO:0004860 | protein kinase inhibitor activity(GO:0004860) |
| 0.0 | 0.2 | GO:0008061 | chitin binding(GO:0008061) |
| 0.0 | 1.0 | GO:0070566 | adenylyltransferase activity(GO:0070566) |
| 0.0 | 1.1 | GO:0019707 | protein-cysteine S-palmitoyltransferase activity(GO:0019706) protein-cysteine S-acyltransferase activity(GO:0019707) |
| 0.0 | 0.5 | GO:0001530 | lipopolysaccharide binding(GO:0001530) |
| 0.0 | 0.8 | GO:0004364 | glutathione transferase activity(GO:0004364) |
| 0.0 | 2.4 | GO:0015171 | amino acid transmembrane transporter activity(GO:0015171) |
| 0.0 | 0.6 | GO:0030515 | snoRNA binding(GO:0030515) |
| 0.0 | 0.8 | GO:0019894 | kinesin binding(GO:0019894) |
| 0.0 | 0.2 | GO:0034185 | apolipoprotein binding(GO:0034185) |
| 0.0 | 0.2 | GO:0034450 | ubiquitin-ubiquitin ligase activity(GO:0034450) |
| 0.0 | 0.3 | GO:0004791 | thioredoxin-disulfide reductase activity(GO:0004791) |
| 0.0 | 0.1 | GO:0034647 | histone demethylase activity (H3-trimethyl-K4 specific)(GO:0034647) |
| 0.0 | 2.4 | GO:0001078 | transcriptional repressor activity, RNA polymerase II core promoter proximal region sequence-specific binding(GO:0001078) |
| 0.0 | 1.3 | GO:0005496 | steroid binding(GO:0005496) |
| 0.0 | 1.5 | GO:0008080 | N-acetyltransferase activity(GO:0008080) |
| 0.0 | 0.8 | GO:0030276 | clathrin binding(GO:0030276) |
| 0.0 | 0.2 | GO:0008157 | protein phosphatase 1 binding(GO:0008157) |
| 0.0 | 2.9 | GO:0061630 | ubiquitin protein ligase activity(GO:0061630) |
| 0.0 | 0.1 | GO:0034987 | immunoglobulin receptor binding(GO:0034987) |
| 0.0 | 1.3 | GO:0042626 | ATPase activity, coupled to transmembrane movement of substances(GO:0042626) |
| 0.0 | 1.5 | GO:0052689 | carboxylic ester hydrolase activity(GO:0052689) |
| 0.0 | 0.3 | GO:0005164 | tumor necrosis factor receptor binding(GO:0005164) |
Gene overrepresentation in curated gene sets: canonical pathways category:
| Log-likelihood per target | Total log-likelihood | Term | Description |
|---|---|---|---|
| 0.7 | 9.2 | PID P38 GAMMA DELTA PATHWAY | Signaling mediated by p38-gamma and p38-delta |
| 0.4 | 14.4 | ST GA12 PATHWAY | G alpha 12 Pathway |
| 0.4 | 11.7 | ST GRANULE CELL SURVIVAL PATHWAY | Granule Cell Survival Pathway is a specific case of more general PAC1 Receptor Pathway. |
| 0.4 | 14.1 | PID REELIN PATHWAY | Reelin signaling pathway |
| 0.4 | 7.5 | PID ERBB NETWORK PATHWAY | ErbB receptor signaling network |
| 0.4 | 14.5 | PID HDAC CLASSII PATHWAY | Signaling events mediated by HDAC Class II |
| 0.4 | 9.5 | PID IL8 CXCR1 PATHWAY | IL8- and CXCR1-mediated signaling events |
| 0.4 | 6.1 | PID INTEGRIN4 PATHWAY | Alpha6 beta4 integrin-ligand interactions |
| 0.3 | 14.6 | PID RAC1 REG PATHWAY | Regulation of RAC1 activity |
| 0.3 | 27.1 | PID SMAD2 3NUCLEAR PATHWAY | Regulation of nuclear SMAD2/3 signaling |
| 0.2 | 5.5 | PID LIS1 PATHWAY | Lissencephaly gene (LIS1) in neuronal migration and development |
| 0.2 | 7.2 | PID IL1 PATHWAY | IL1-mediated signaling events |
| 0.2 | 7.5 | PID ATR PATHWAY | ATR signaling pathway |
| 0.1 | 1.5 | SA FAS SIGNALING | The TNF-type receptor Fas induces apoptosis on ligand binding. |
| 0.1 | 8.3 | PID NOTCH PATHWAY | Notch signaling pathway |
| 0.1 | 8.2 | PID MTOR 4PATHWAY | mTOR signaling pathway |
| 0.1 | 3.2 | PID PI3K PLC TRK PATHWAY | Trk receptor signaling mediated by PI3K and PLC-gamma |
| 0.1 | 8.1 | PID BETA CATENIN NUC PATHWAY | Regulation of nuclear beta catenin signaling and target gene transcription |
| 0.1 | 1.7 | PID ERBB4 PATHWAY | ErbB4 signaling events |
| 0.1 | 3.3 | PID AR TF PATHWAY | Regulation of Androgen receptor activity |
| 0.1 | 3.4 | NABA PROTEOGLYCANS | Genes encoding proteoglycans |
| 0.1 | 1.4 | PID ARF 3PATHWAY | Arf1 pathway |
| 0.1 | 2.2 | PID INTEGRIN2 PATHWAY | Beta2 integrin cell surface interactions |
| 0.1 | 1.0 | PID MYC PATHWAY | C-MYC pathway |
| 0.1 | 2.4 | PID FAK PATHWAY | Signaling events mediated by focal adhesion kinase |
| 0.1 | 1.3 | PID S1P META PATHWAY | Sphingosine 1-phosphate (S1P) pathway |
| 0.1 | 2.3 | PID RHOA REG PATHWAY | Regulation of RhoA activity |
| 0.1 | 1.2 | PID RXR VDR PATHWAY | RXR and RAR heterodimerization with other nuclear receptor |
| 0.1 | 10.4 | NABA ECM GLYCOPROTEINS | Genes encoding structural ECM glycoproteins |
| 0.0 | 1.8 | PID ATF2 PATHWAY | ATF-2 transcription factor network |
| 0.0 | 1.2 | PID IL12 STAT4 PATHWAY | IL12 signaling mediated by STAT4 |
| 0.0 | 0.4 | PID ALK2 PATHWAY | ALK2 signaling events |
| 0.0 | 1.1 | PID TAP63 PATHWAY | Validated transcriptional targets of TAp63 isoforms |
| 0.0 | 1.0 | PID CD8 TCR DOWNSTREAM PATHWAY | Downstream signaling in naïve CD8+ T cells |
| 0.0 | 0.7 | PID UPA UPAR PATHWAY | Urokinase-type plasminogen activator (uPA) and uPAR-mediated signaling |
| 0.0 | 0.3 | PID CD40 PATHWAY | CD40/CD40L signaling |
| 0.0 | 0.4 | PID ATM PATHWAY | ATM pathway |
Gene overrepresentation in curated gene sets: REACTOME pathways category:
| Log-likelihood per target | Total log-likelihood | Term | Description |
|---|---|---|---|
| 1.2 | 20.0 | REACTOME N GLYCAN ANTENNAE ELONGATION | Genes involved in N-Glycan antennae elongation |
| 1.1 | 18.3 | REACTOME GABA A RECEPTOR ACTIVATION | Genes involved in GABA A receptor activation |
| 1.0 | 15.9 | REACTOME ACTIVATION OF THE AP1 FAMILY OF TRANSCRIPTION FACTORS | Genes involved in Activation of the AP-1 family of transcription factors |
| 0.9 | 12.0 | REACTOME ROLE OF SECOND MESSENGERS IN NETRIN1 SIGNALING | Genes involved in Role of second messengers in netrin-1 signaling |
| 0.8 | 23.8 | REACTOME ACTIVATED NOTCH1 TRANSMITS SIGNAL TO THE NUCLEUS | Genes involved in Activated NOTCH1 Transmits Signal to the Nucleus |
| 0.8 | 14.1 | REACTOME CREB PHOSPHORYLATION THROUGH THE ACTIVATION OF CAMKII | Genes involved in CREB phosphorylation through the activation of CaMKII |
| 0.7 | 19.9 | REACTOME ADHERENS JUNCTIONS INTERACTIONS | Genes involved in Adherens junctions interactions |
| 0.6 | 18.6 | REACTOME GLUTATHIONE CONJUGATION | Genes involved in Glutathione conjugation |
| 0.6 | 8.7 | REACTOME PROTEOLYTIC CLEAVAGE OF SNARE COMPLEX PROTEINS | Genes involved in Proteolytic cleavage of SNARE complex proteins |
| 0.6 | 10.8 | REACTOME GLUCURONIDATION | Genes involved in Glucuronidation |
| 0.5 | 12.3 | REACTOME GLUTAMATE NEUROTRANSMITTER RELEASE CYCLE | Genes involved in Glutamate Neurotransmitter Release Cycle |
| 0.5 | 11.5 | REACTOME SIGNALING BY NODAL | Genes involved in Signaling by NODAL |
| 0.5 | 6.7 | REACTOME TERMINATION OF O GLYCAN BIOSYNTHESIS | Genes involved in Termination of O-glycan biosynthesis |
| 0.5 | 7.1 | REACTOME BILE SALT AND ORGANIC ANION SLC TRANSPORTERS | Genes involved in Bile salt and organic anion SLC transporters |
| 0.5 | 11.5 | REACTOME PTM GAMMA CARBOXYLATION HYPUSINE FORMATION AND ARYLSULFATASE ACTIVATION | Genes involved in PTM: gamma carboxylation, hypusine formation and arylsulfatase activation |
| 0.5 | 12.2 | REACTOME REGULATION OF GENE EXPRESSION IN BETA CELLS | Genes involved in Regulation of gene expression in beta cells |
| 0.5 | 18.7 | REACTOME GLYCOLYSIS | Genes involved in Glycolysis |
| 0.5 | 8.6 | REACTOME ACTIVATION OF NMDA RECEPTOR UPON GLUTAMATE BINDING AND POSTSYNAPTIC EVENTS | Genes involved in Activation of NMDA receptor upon glutamate binding and postsynaptic events |
| 0.5 | 10.4 | REACTOME DARPP 32 EVENTS | Genes involved in DARPP-32 events |
| 0.4 | 14.4 | REACTOME PHASE II CONJUGATION | Genes involved in Phase II conjugation |
| 0.4 | 7.6 | REACTOME POST CHAPERONIN TUBULIN FOLDING PATHWAY | Genes involved in Post-chaperonin tubulin folding pathway |
| 0.4 | 6.7 | REACTOME AMINE DERIVED HORMONES | Genes involved in Amine-derived hormones |
| 0.4 | 10.3 | REACTOME THROMBOXANE SIGNALLING THROUGH TP RECEPTOR | Genes involved in Thromboxane signalling through TP receptor |
| 0.4 | 12.5 | REACTOME TIGHT JUNCTION INTERACTIONS | Genes involved in Tight junction interactions |
| 0.3 | 6.5 | REACTOME ABCA TRANSPORTERS IN LIPID HOMEOSTASIS | Genes involved in ABCA transporters in lipid homeostasis |
| 0.3 | 9.2 | REACTOME CASPASE MEDIATED CLEAVAGE OF CYTOSKELETAL PROTEINS | Genes involved in Caspase-mediated cleavage of cytoskeletal proteins |
| 0.3 | 5.5 | REACTOME GAP JUNCTION ASSEMBLY | Genes involved in Gap junction assembly |
| 0.3 | 6.5 | REACTOME INWARDLY RECTIFYING K CHANNELS | Genes involved in Inwardly rectifying K+ channels |
| 0.3 | 3.4 | REACTOME PRESYNAPTIC NICOTINIC ACETYLCHOLINE RECEPTORS | Genes involved in Presynaptic nicotinic acetylcholine receptors |
| 0.3 | 5.0 | REACTOME OTHER SEMAPHORIN INTERACTIONS | Genes involved in Other semaphorin interactions |
| 0.3 | 2.4 | REACTOME TRYPTOPHAN CATABOLISM | Genes involved in Tryptophan catabolism |
| 0.2 | 1.2 | REACTOME THROMBIN SIGNALLING THROUGH PROTEINASE ACTIVATED RECEPTORS PARS | Genes involved in Thrombin signalling through proteinase activated receptors (PARs) |
| 0.2 | 2.5 | REACTOME SYNTHESIS OF BILE ACIDS AND BILE SALTS VIA 24 HYDROXYCHOLESTEROL | Genes involved in Synthesis of bile acids and bile salts via 24-hydroxycholesterol |
| 0.2 | 5.2 | REACTOME CELL JUNCTION ORGANIZATION | Genes involved in Cell junction organization |
| 0.2 | 3.5 | REACTOME SYNTHESIS OF PIPS AT THE GOLGI MEMBRANE | Genes involved in Synthesis of PIPs at the Golgi membrane |
| 0.2 | 5.9 | REACTOME O LINKED GLYCOSYLATION OF MUCINS | Genes involved in O-linked glycosylation of mucins |
| 0.2 | 3.5 | REACTOME SMAD2 SMAD3 SMAD4 HETEROTRIMER REGULATES TRANSCRIPTION | Genes involved in SMAD2/SMAD3:SMAD4 heterotrimer regulates transcription |
| 0.2 | 4.7 | REACTOME REGULATION OF GLUCOKINASE BY GLUCOKINASE REGULATORY PROTEIN | Genes involved in Regulation of Glucokinase by Glucokinase Regulatory Protein |
| 0.2 | 23.5 | REACTOME SIGNALING BY RHO GTPASES | Genes involved in Signaling by Rho GTPases |
| 0.2 | 3.0 | REACTOME SYNTHESIS AND INTERCONVERSION OF NUCLEOTIDE DI AND TRIPHOSPHATES | Genes involved in Synthesis and interconversion of nucleotide di- and triphosphates |
| 0.2 | 2.0 | REACTOME REGULATION OF COMPLEMENT CASCADE | Genes involved in Regulation of Complement cascade |
| 0.1 | 0.3 | REACTOME ADP SIGNALLING THROUGH P2RY1 | Genes involved in ADP signalling through P2Y purinoceptor 1 |
| 0.1 | 4.1 | REACTOME GLYCOSPHINGOLIPID METABOLISM | Genes involved in Glycosphingolipid metabolism |
| 0.1 | 3.6 | REACTOME INSULIN RECEPTOR RECYCLING | Genes involved in Insulin receptor recycling |
| 0.1 | 6.2 | REACTOME IL1 SIGNALING | Genes involved in Interleukin-1 signaling |
| 0.1 | 3.6 | REACTOME RNA POL III TRANSCRIPTION INITIATION FROM TYPE 3 PROMOTER | Genes involved in RNA Polymerase III Transcription Initiation From Type 3 Promoter |
| 0.1 | 4.3 | REACTOME TRANSPORT OF VITAMINS NUCLEOSIDES AND RELATED MOLECULES | Genes involved in Transport of vitamins, nucleosides, and related molecules |
| 0.1 | 1.5 | REACTOME EXTRINSIC PATHWAY FOR APOPTOSIS | Genes involved in Extrinsic Pathway for Apoptosis |
| 0.1 | 1.7 | REACTOME PROLACTIN RECEPTOR SIGNALING | Genes involved in Prolactin receptor signaling |
| 0.1 | 5.2 | REACTOME AMINO ACID AND OLIGOPEPTIDE SLC TRANSPORTERS | Genes involved in Amino acid and oligopeptide SLC transporters |
| 0.1 | 0.7 | REACTOME DOWNREGULATION OF SMAD2 3 SMAD4 TRANSCRIPTIONAL ACTIVITY | Genes involved in Downregulation of SMAD2/3:SMAD4 transcriptional activity |
| 0.1 | 2.4 | REACTOME FORMATION OF TRANSCRIPTION COUPLED NER TC NER REPAIR COMPLEX | Genes involved in Formation of transcription-coupled NER (TC-NER) repair complex |
| 0.1 | 1.7 | REACTOME SEMA4D INDUCED CELL MIGRATION AND GROWTH CONE COLLAPSE | Genes involved in Sema4D induced cell migration and growth-cone collapse |
| 0.1 | 4.1 | REACTOME CHEMOKINE RECEPTORS BIND CHEMOKINES | Genes involved in Chemokine receptors bind chemokines |
| 0.1 | 2.5 | REACTOME G ALPHA Z SIGNALLING EVENTS | Genes involved in G alpha (z) signalling events |
| 0.1 | 1.4 | REACTOME PEROXISOMAL LIPID METABOLISM | Genes involved in Peroxisomal lipid metabolism |
| 0.1 | 4.0 | REACTOME LOSS OF NLP FROM MITOTIC CENTROSOMES | Genes involved in Loss of Nlp from mitotic centrosomes |
| 0.1 | 1.3 | REACTOME RNA POL II TRANSCRIPTION PRE INITIATION AND PROMOTER OPENING | Genes involved in RNA Polymerase II Transcription Pre-Initiation And Promoter Opening |
| 0.1 | 3.0 | REACTOME METABOLISM OF VITAMINS AND COFACTORS | Genes involved in Metabolism of vitamins and cofactors |
| 0.1 | 2.0 | REACTOME AMINE LIGAND BINDING RECEPTORS | Genes involved in Amine ligand-binding receptors |
| 0.0 | 0.4 | REACTOME G2 M DNA DAMAGE CHECKPOINT | Genes involved in G2/M DNA damage checkpoint |
| 0.0 | 1.8 | REACTOME NCAM1 INTERACTIONS | Genes involved in NCAM1 interactions |
| 0.0 | 2.1 | REACTOME GOLGI ASSOCIATED VESICLE BIOGENESIS | Genes involved in Golgi Associated Vesicle Biogenesis |
| 0.0 | 3.5 | REACTOME L1CAM INTERACTIONS | Genes involved in L1CAM interactions |
| 0.0 | 1.1 | REACTOME HS GAG BIOSYNTHESIS | Genes involved in HS-GAG biosynthesis |
| 0.0 | 1.3 | REACTOME SPHINGOLIPID DE NOVO BIOSYNTHESIS | Genes involved in Sphingolipid de novo biosynthesis |
| 0.0 | 1.5 | REACTOME MRNA 3 END PROCESSING | Genes involved in mRNA 3'-end processing |
| 0.0 | 1.4 | REACTOME ACTIVATION OF CHAPERONE GENES BY XBP1S | Genes involved in Activation of Chaperone Genes by XBP1(S) |
| 0.0 | 0.3 | REACTOME ACTIVATION OF IRF3 IRF7 MEDIATED BY TBK1 IKK EPSILON | Genes involved in Activation of IRF3/IRF7 mediated by TBK1/IKK epsilon |
| 0.0 | 2.0 | REACTOME CLASS B 2 SECRETIN FAMILY RECEPTORS | Genes involved in Class B/2 (Secretin family receptors) |
| 0.0 | 0.1 | REACTOME FORMATION OF THE HIV1 EARLY ELONGATION COMPLEX | Genes involved in Formation of the HIV-1 Early Elongation Complex |
| 0.0 | 0.7 | REACTOME ION TRANSPORT BY P TYPE ATPASES | Genes involved in Ion transport by P-type ATPases |