Project
GSE53960: rat RNA-Seq transcriptomic Bodymap
Navigation
Downloads
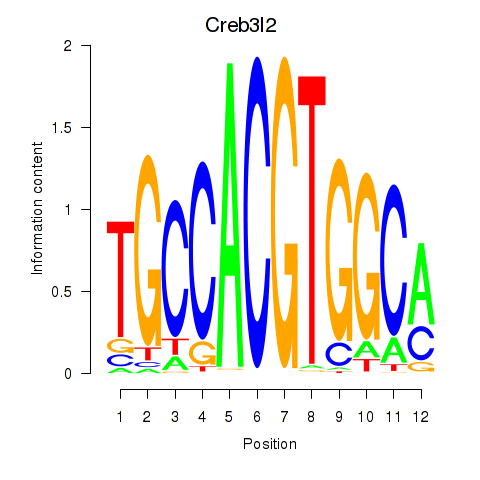
Results for Creb3l2
Z-value: 0.79
Motif logo
Transcription factors associated with Creb3l2
| Gene Symbol | Gene ID | Gene Info |
|---|---|---|
|
Creb3l2
|
ENSRNOG00000012826 | cAMP responsive element binding protein 3-like 2 |
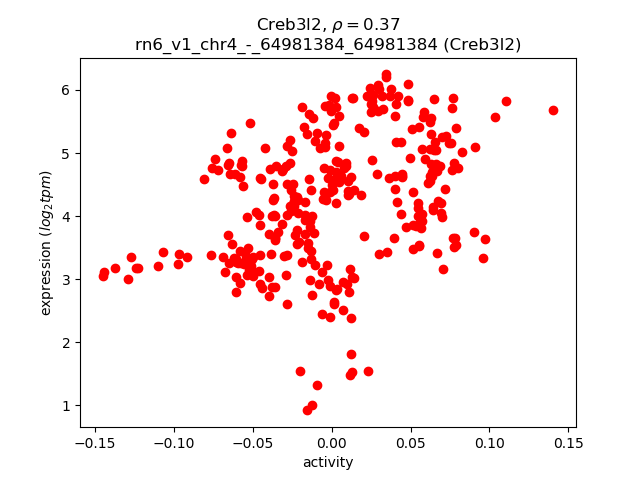
Activity-expression correlation:
| Gene | Promoter | Pearson corr. coef. | P-value | Plot |
|---|---|---|---|---|
| Creb3l2 | rn6_v1_chr4_-_64981384_64981384 | 0.37 | 7.1e-12 | Click! |
Activity profile of Creb3l2 motif
Sorted Z-values of Creb3l2 motif
| Promoter | Log-likelihood | Transcript | Gene | Gene Info |
|---|---|---|---|---|
| chr7_-_73270308 | 30.59 |
ENSRNOT00000007430
|
Rida
|
reactive intermediate imine deaminase A homolog |
| chr3_-_10375826 | 27.81 |
ENSRNOT00000093365
|
Ass1
|
argininosuccinate synthase 1 |
| chr9_+_80118029 | 27.09 |
ENSRNOT00000023068
|
Igfbp2
|
insulin-like growth factor binding protein 2 |
| chrX_-_138435391 | 25.05 |
ENSRNOT00000043258
|
Mbnl3
|
muscleblind-like splicing regulator 3 |
| chr3_+_114176309 | 23.23 |
ENSRNOT00000023350
|
Sord
|
sorbitol dehydrogenase |
| chr11_-_70499200 | 22.86 |
ENSRNOT00000002439
|
Slc12a8
|
solute carrier family 12, member 8 |
| chr10_+_88459490 | 19.22 |
ENSRNOT00000080231
ENSRNOT00000067559 |
Ttc25
|
tetratricopeptide repeat domain 25 |
| chr20_-_10386663 | 17.74 |
ENSRNOT00000045275
ENSRNOT00000042432 |
Cbs
|
cystathionine beta synthase |
| chr7_+_141249044 | 15.63 |
ENSRNOT00000084911
|
Aqp5
|
aquaporin 5 |
| chr1_+_15620653 | 15.19 |
ENSRNOT00000017401
|
Map7
|
microtubule-associated protein 7 |
| chr16_-_21348391 | 13.78 |
ENSRNOT00000083537
|
Lpar2
|
lysophosphatidic acid receptor 2 |
| chr2_-_204032023 | 12.91 |
ENSRNOT00000040430
|
Atp1a1
|
ATPase Na+/K+ transporting subunit alpha 1 |
| chr7_+_69213147 | 12.26 |
ENSRNOT00000032786
|
Lrig3
|
leucine-rich repeats and immunoglobulin-like domains 3 |
| chr3_+_55094637 | 12.25 |
ENSRNOT00000058763
|
Cers6
|
ceramide synthase 6 |
| chr16_-_21347968 | 12.12 |
ENSRNOT00000068554
|
Lpar2
|
lysophosphatidic acid receptor 2 |
| chr3_+_125503638 | 12.09 |
ENSRNOT00000028900
|
Crls1
|
cardiolipin synthase 1 |
| chr12_+_16912249 | 11.91 |
ENSRNOT00000085936
|
Tmem184a
|
transmembrane protein 184A |
| chr19_-_38120578 | 11.78 |
ENSRNOT00000026873
|
Esrp2
|
epithelial splicing regulatory protein 2 |
| chr8_-_47529689 | 11.21 |
ENSRNOT00000012826
|
Oaf
|
out at first homolog |
| chr3_-_81282157 | 10.83 |
ENSRNOT00000051258
|
Large2
|
LARGE xylosyl- and glucuronyltransferase 2 |
| chr17_-_9837293 | 10.53 |
ENSRNOT00000091320
ENSRNOT00000022134 |
Prelid1
|
PRELI domain containing 1 |
| chr10_-_104564480 | 10.40 |
ENSRNOT00000008525
|
Galk1
|
galactokinase 1 |
| chr1_-_198045154 | 10.08 |
ENSRNOT00000072875
|
Nupr1l1
|
nuclear protein, transcriptional regulator, 1-like 1 |
| chrX_+_16050780 | 9.89 |
ENSRNOT00000079054
|
Clcn5
|
chloride voltage-gated channel 5 |
| chr18_-_15637715 | 9.72 |
ENSRNOT00000022270
|
Dsg2
|
desmoglein 2 |
| chr5_+_138470069 | 9.54 |
ENSRNOT00000076343
ENSRNOT00000064073 |
Zmynd12
|
zinc finger, MYND-type containing 12 |
| chr16_+_2338333 | 9.38 |
ENSRNOT00000017692
|
Arf4
|
ADP-ribosylation factor 4 |
| chr2_+_227455722 | 9.28 |
ENSRNOT00000064809
|
Sec24d
|
SEC24 homolog D, COPII coat complex component |
| chr5_+_151776004 | 9.00 |
ENSRNOT00000009683
|
Nr0b2
|
nuclear receptor subfamily 0, group B, member 2 |
| chr1_-_194769524 | 8.82 |
ENSRNOT00000025988
|
Nupr1
|
nuclear protein 1, transcriptional regulator |
| chr7_+_3332788 | 8.75 |
ENSRNOT00000010180
|
Cd63
|
Cd63 molecule |
| chr10_+_37032043 | 8.58 |
ENSRNOT00000037303
ENSRNOT00000091242 |
Phykpl
|
5-phosphohydroxy-L-lysine phospho-lyase |
| chr10_-_37209881 | 8.35 |
ENSRNOT00000090475
|
Sec24a
|
SEC24 homolog A, COPII coat complex component |
| chr1_+_266333440 | 8.24 |
ENSRNOT00000071243
|
Sfxn2
|
sideroflexin 2 |
| chr3_+_176230378 | 7.61 |
ENSRNOT00000013623
|
Slc17a9
|
solute carrier family 17 member 9 |
| chr10_+_34938667 | 7.59 |
ENSRNOT00000086443
ENSRNOT00000059104 |
LOC103690164
|
5-phosphohydroxy-L-lysine phospho-lyase |
| chr11_+_39482408 | 7.37 |
ENSRNOT00000075126
|
Hmgn1
|
high mobility group nucleosome binding domain 1 |
| chr11_-_36479868 | 6.93 |
ENSRNOT00000075762
|
LOC100911295
|
non-histone chromosomal protein HMG-14-like |
| chr20_-_41209728 | 6.78 |
ENSRNOT00000000657
|
Nt5dc1
|
5'-nucleotidase domain containing 1 |
| chr1_-_82120902 | 6.72 |
ENSRNOT00000027684
|
Erf
|
Ets2 repressor factor |
| chr11_-_83867203 | 6.65 |
ENSRNOT00000002394
|
Chrd
|
chordin |
| chr6_+_26797126 | 6.57 |
ENSRNOT00000010586
|
Cgref1
|
cell growth regulator with EF hand domain 1 |
| chr20_+_6288267 | 6.45 |
ENSRNOT00000000627
|
Srsf3
|
serine and arginine rich splicing factor 3 |
| chr15_-_52029816 | 6.37 |
ENSRNOT00000013067
|
Slc39a14
|
solute carrier family 39 member 14 |
| chr2_+_209097927 | 6.29 |
ENSRNOT00000023807
|
Dennd2d
|
DENN domain containing 2D |
| chr9_-_61690956 | 6.23 |
ENSRNOT00000066589
|
Hspd1
|
heat shock protein family D member 1 |
| chr14_+_104475082 | 6.12 |
ENSRNOT00000084481
|
Rab1a
|
RAB1A, member RAS oncogene family |
| chr18_-_33414236 | 6.00 |
ENSRNOT00000020385
|
Yipf5
|
Yip1 domain family, member 5 |
| chr1_-_84812486 | 5.97 |
ENSRNOT00000078369
|
AABR07002779.1
|
|
| chr15_-_34322115 | 5.54 |
ENSRNOT00000026734
|
Tm9sf1
|
transmembrane 9 superfamily member 1 |
| chr5_-_138470096 | 5.28 |
ENSRNOT00000011392
|
Ppcs
|
phosphopantothenoylcysteine synthetase |
| chr10_+_13996645 | 4.74 |
ENSRNOT00000016490
|
Nthl1
|
nth-like DNA glycosylase 1 |
| chr7_+_73270455 | 4.40 |
ENSRNOT00000007190
|
Pop1
|
POP1 homolog, ribonuclease P/MRP subunit |
| chr6_+_42852683 | 4.20 |
ENSRNOT00000079185
|
Odc1
|
ornithine decarboxylase 1 |
| chr7_+_72924799 | 4.16 |
ENSRNOT00000008969
|
Laptm4b
|
lysosomal protein transmembrane 4 beta |
| chr11_-_16889201 | 4.11 |
ENSRNOT00000002121
|
Btg3
|
BTG anti-proliferation factor 3 |
| chr7_-_130451283 | 4.00 |
ENSRNOT00000017783
|
Arsa
|
arylsulfatase A |
| chr12_-_13210758 | 3.93 |
ENSRNOT00000001438
|
Kdelr2
|
KDEL endoplasmic reticulum protein retention receptor 2 |
| chr1_+_140602542 | 3.86 |
ENSRNOT00000085570
|
Isg20
|
interferon stimulated exonuclease gene 20 |
| chr2_-_61414038 | 3.84 |
ENSRNOT00000051910
ENSRNOT00000088202 |
Tars
|
threonyl-tRNA synthetase |
| chr17_+_85356042 | 3.78 |
ENSRNOT00000022201
|
Commd3
|
COMM domain containing 3 |
| chr7_-_124198200 | 3.66 |
ENSRNOT00000078947
|
Arfgap3
|
ADP-ribosylation factor GTPase activating protein 3 |
| chr4_-_34779776 | 3.66 |
ENSRNOT00000077329
|
Ica1
|
islet cell autoantigen 1 |
| chr4_-_66002444 | 3.59 |
ENSRNOT00000018645
|
Zc3hav1l
|
zinc finger CCCH-type containing, antiviral 1 like |
| chr14_-_85350786 | 3.38 |
ENSRNOT00000012634
|
LOC100912481
|
RNA-binding protein EWS-like |
| chr4_+_24612205 | 3.36 |
ENSRNOT00000057382
|
Ewsr1
|
EWS RNA-binding protein 1 |
| chr10_+_70134729 | 3.33 |
ENSRNOT00000076739
|
Lig3
|
DNA ligase 3 |
| chr4_+_98648545 | 3.24 |
ENSRNOT00000008451
|
Eif2ak3
|
eukaryotic translation initiation factor 2 alpha kinase 3 |
| chrX_+_68627313 | 3.11 |
ENSRNOT00000076699
ENSRNOT00000076795 ENSRNOT00000008705 |
Yipf6
|
Yip1 domain family, member 6 |
| chr2_-_210874304 | 2.96 |
ENSRNOT00000088657
|
Ampd2
|
adenosine monophosphate deaminase 2 |
| chr2_+_250600823 | 2.85 |
ENSRNOT00000083750
|
Sep15
|
selenoprotein 15 |
| chr18_+_27956429 | 2.84 |
ENSRNOT00000080999
|
Ctnna1
|
catenin alpha 1 |
| chr1_+_48176106 | 2.73 |
ENSRNOT00000021840
|
Igf2r
|
insulin-like growth factor 2 receptor |
| chr2_-_142686577 | 2.51 |
ENSRNOT00000014562
|
Nhlrc3
|
NHL repeat containing 3 |
| chr14_+_35683442 | 2.41 |
ENSRNOT00000003085
|
Chic2
|
cysteine-rich hydrophobic domain 2 |
| chr3_-_119405453 | 2.33 |
ENSRNOT00000090355
|
Sppl2a
|
signal peptide peptidase-like 2A |
| chr10_+_88326337 | 2.19 |
ENSRNOT00000022029
ENSRNOT00000076461 |
Fkbp10
|
FK506 binding protein 10 |
| chr20_+_22728208 | 2.15 |
ENSRNOT00000000794
|
LOC100363472
|
nuclear receptor-binding factor 2-like |
| chr10_+_36099263 | 2.14 |
ENSRNOT00000083568
|
Adamts2
|
ADAM metallopeptidase with thrombospondin type 1 motif, 2 |
| chr1_+_154377447 | 2.09 |
ENSRNOT00000084268
ENSRNOT00000092086 ENSRNOT00000091470 ENSRNOT00000025415 |
Picalm
|
phosphatidylinositol binding clathrin assembly protein |
| chr20_-_30888735 | 2.09 |
ENSRNOT00000090004
ENSRNOT00000063875 |
Adamts14
|
ADAM metallopeptidase with thrombospondin type 1 motif, 14 |
| chrX_-_10413984 | 2.05 |
ENSRNOT00000039551
ENSRNOT00000091448 |
Ddx3x
|
DEAD-box helicase 3, X-linked |
| chr5_-_173081839 | 1.84 |
ENSRNOT00000066880
|
Mmp23
|
matrix metallopeptidase 23 |
| chr6_-_26680284 | 1.80 |
ENSRNOT00000039709
|
Cad
|
carbamoyl-phosphate synthetase 2, aspartate transcarbamylase, and dihydroorotase |
| chr10_+_88326080 | 1.72 |
ENSRNOT00000076475
|
Fkbp10
|
FK506 binding protein 10 |
| chr5_+_60250546 | 1.63 |
ENSRNOT00000017707
|
Zcchc7
|
zinc finger CCHC-type containing 7 |
| chr9_+_94425252 | 1.63 |
ENSRNOT00000064965
ENSRNOT00000076099 |
Gigyf2
|
GRB10 interacting GYF protein 2 |
| chr3_-_119405300 | 1.61 |
ENSRNOT00000015568
|
Sppl2a
|
signal peptide peptidase-like 2A |
| chr1_+_225015616 | 1.51 |
ENSRNOT00000026416
|
Hnrnpul2
|
heterogeneous nuclear ribonucleoprotein U-like 2 |
| chr1_+_170471238 | 1.45 |
ENSRNOT00000076961
ENSRNOT00000075597 ENSRNOT00000076631 ENSRNOT00000076783 |
Timm10b
Dnhd1
|
translocase of inner mitochondrial membrane 10B dynein heavy chain domain 1 |
| chr7_+_120923274 | 1.45 |
ENSRNOT00000049247
|
Gtpbp1
|
GTP binding protein 1 |
| chr19_-_57422093 | 1.44 |
ENSRNOT00000025512
|
RGD1559896
|
similar to RIKEN cDNA 2310022B05 |
| chrX_-_154722220 | 1.43 |
ENSRNOT00000089743
ENSRNOT00000087893 |
Fmr1
|
fragile X mental retardation 1 |
| chr2_+_198823366 | 1.36 |
ENSRNOT00000083769
ENSRNOT00000028814 |
Pias3
|
protein inhibitor of activated STAT, 3 |
| chr9_+_10013854 | 1.32 |
ENSRNOT00000077653
ENSRNOT00000072033 |
Khsrp
|
KH-type splicing regulatory protein |
| chr10_-_102576878 | 1.04 |
ENSRNOT00000091129
|
Sdk2
|
sidekick cell adhesion molecule 2 |
| chr3_+_14588870 | 1.02 |
ENSRNOT00000071712
|
LOC100912604
|
spermidine synthase-like |
| chr4_-_34780193 | 0.99 |
ENSRNOT00000011651
|
Ica1
|
islet cell autoantigen 1 |
| chr4_+_119815139 | 0.98 |
ENSRNOT00000083402
ENSRNOT00000016137 |
Hmces
|
5-hydroxymethylcytosine (hmC) binding, ES cell-specific |
| chr5_+_154668179 | 0.87 |
ENSRNOT00000015971
|
Hnrnpr
|
heterogeneous nuclear ribonucleoprotein R |
| chrX_+_138046494 | 0.74 |
ENSRNOT00000010596
|
Stk26
|
serine/threonine kinase 26 |
| chr5_-_164844586 | 0.66 |
ENSRNOT00000011287
|
Clcn6
|
chloride voltage-gated channel 6 |
| chr19_-_43215281 | 0.53 |
ENSRNOT00000025052
|
Aars
|
alanyl-tRNA synthetase |
| chr2_+_189106039 | 0.45 |
ENSRNOT00000028210
|
Ube2q1
|
ubiquitin conjugating enzyme E2 Q1 |
| chr15_+_38096994 | 0.29 |
ENSRNOT00000064635
|
Mrpl57
|
mitochondrial ribosomal protein L57 |
| chr2_+_44512895 | 0.03 |
ENSRNOT00000013218
|
Slc38a9
|
solute carrier family 38, member 9 |
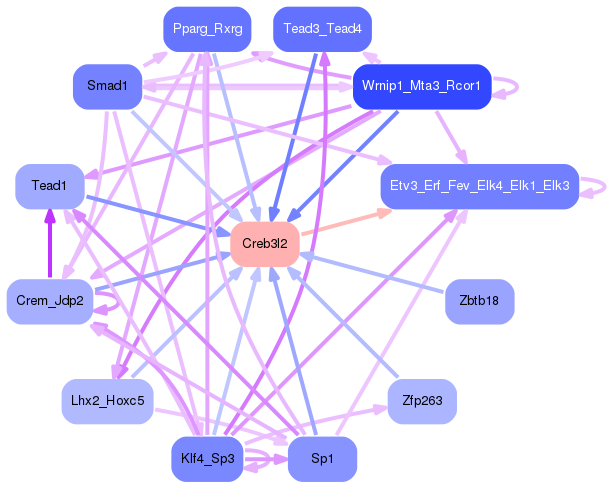
Network of associatons between targets according to the STRING database.

First level regulatory network of Creb3l2
Gene Ontology Analysis
Gene overrepresentation in biological process category:
| Log-likelihood per target | Total log-likelihood | Term | Description |
|---|---|---|---|
| 11.2 | 33.6 | GO:0006059 | hexitol metabolic process(GO:0006059) |
| 9.3 | 27.8 | GO:0000053 | argininosuccinate metabolic process(GO:0000053) |
| 5.9 | 17.7 | GO:0070814 | cysteine biosynthetic process via cystathionine(GO:0019343) hydrogen sulfide biosynthetic process(GO:0070814) |
| 4.1 | 12.3 | GO:0032474 | otolith morphogenesis(GO:0032474) |
| 3.1 | 30.6 | GO:0070314 | G1 to G0 transition(GO:0070314) |
| 3.0 | 11.9 | GO:0018992 | germ-line sex determination(GO:0018992) |
| 2.5 | 7.4 | GO:0000720 | pyrimidine dimer repair by nucleotide-excision repair(GO:0000720) |
| 2.4 | 4.7 | GO:0006296 | nucleotide-excision repair, DNA incision, 5'-to lesion(GO:0006296) |
| 2.2 | 15.6 | GO:0015670 | carbon dioxide transport(GO:0015670) |
| 2.2 | 12.9 | GO:1990573 | negative regulation of glucocorticoid metabolic process(GO:0031944) negative regulation of glucocorticoid biosynthetic process(GO:0031947) potassium ion import across plasma membrane(GO:1990573) |
| 2.1 | 6.2 | GO:0002840 | T cell mediated immune response to tumor cell(GO:0002424) regulation of T cell mediated immune response to tumor cell(GO:0002840) protein import into mitochondrial intermembrane space(GO:0045041) |
| 1.7 | 12.1 | GO:0032049 | cardiolipin biosynthetic process(GO:0032049) |
| 1.4 | 9.7 | GO:0003164 | His-Purkinje system development(GO:0003164) |
| 1.3 | 9.4 | GO:0031584 | activation of phospholipase D activity(GO:0031584) |
| 1.3 | 6.7 | GO:0021914 | negative regulation of smoothened signaling pathway involved in ventral spinal cord patterning(GO:0021914) |
| 1.3 | 3.9 | GO:0000738 | DNA catabolic process, exonucleolytic(GO:0000738) |
| 1.3 | 3.8 | GO:0006435 | threonyl-tRNA aminoacylation(GO:0006435) |
| 1.1 | 3.3 | GO:0006288 | base-excision repair, DNA ligation(GO:0006288) |
| 1.1 | 8.7 | GO:2000680 | regulation of rubidium ion transport(GO:2000680) |
| 1.1 | 3.2 | GO:0060734 | regulation of endoplasmic reticulum stress-induced eIF2 alpha phosphorylation(GO:0060734) response to manganese-induced endoplasmic reticulum stress(GO:1990737) |
| 1.1 | 10.5 | GO:1901857 | positive regulation of cellular respiration(GO:1901857) |
| 1.0 | 27.1 | GO:0043567 | regulation of insulin-like growth factor receptor signaling pathway(GO:0043567) |
| 0.9 | 2.8 | GO:2001045 | negative regulation of integrin-mediated signaling pathway(GO:2001045) |
| 0.9 | 8.3 | GO:2000189 | positive regulation of cholesterol homeostasis(GO:2000189) |
| 0.9 | 4.4 | GO:0016078 | tRNA catabolic process(GO:0016078) |
| 0.9 | 25.0 | GO:0045662 | negative regulation of myoblast differentiation(GO:0045662) |
| 0.8 | 6.1 | GO:0090110 | cargo loading into COPII-coated vesicle(GO:0090110) |
| 0.8 | 15.2 | GO:0033327 | Leydig cell differentiation(GO:0033327) |
| 0.7 | 6.7 | GO:0010668 | ectodermal cell differentiation(GO:0010668) |
| 0.7 | 10.8 | GO:0035269 | protein O-linked mannosylation(GO:0035269) |
| 0.7 | 23.3 | GO:0035025 | positive regulation of Rho protein signal transduction(GO:0035025) |
| 0.7 | 4.2 | GO:0033387 | putrescine biosynthetic process from ornithine(GO:0033387) |
| 0.7 | 2.1 | GO:1902962 | regulation of aspartic-type endopeptidase activity involved in amyloid precursor protein catabolic process(GO:1902959) positive regulation of aspartic-type endopeptidase activity involved in amyloid precursor protein catabolic process(GO:1902961) regulation of metalloendopeptidase activity involved in amyloid precursor protein catabolic process(GO:1902962) negative regulation of metalloendopeptidase activity involved in amyloid precursor protein catabolic process(GO:1902963) regulation of aspartic-type peptidase activity(GO:1905245) positive regulation of aspartic-type peptidase activity(GO:1905247) |
| 0.6 | 6.0 | GO:0060628 | regulation of ER to Golgi vesicle-mediated transport(GO:0060628) |
| 0.6 | 8.8 | GO:2000194 | regulation of female gonad development(GO:2000194) |
| 0.6 | 6.4 | GO:0015684 | ferrous iron transport(GO:0015684) zinc II ion transmembrane import(GO:0071578) ferrous iron transmembrane transport(GO:1903874) |
| 0.6 | 3.9 | GO:0006621 | protein retention in ER lumen(GO:0006621) |
| 0.5 | 3.0 | GO:0032264 | IMP salvage(GO:0032264) |
| 0.5 | 1.4 | GO:1904009 | negative regulation of long term synaptic depression(GO:1900453) regulation of intracellular transport of viral material(GO:1901252) cellular response to monosodium glutamate(GO:1904009) regulation of modification of synaptic structure(GO:1905244) |
| 0.4 | 3.9 | GO:0031293 | membrane protein intracellular domain proteolysis(GO:0031293) |
| 0.4 | 11.8 | GO:0060445 | branching involved in salivary gland morphogenesis(GO:0060445) |
| 0.3 | 5.3 | GO:0015937 | coenzyme A biosynthetic process(GO:0015937) |
| 0.3 | 2.1 | GO:0042256 | mature ribosome assembly(GO:0042256) |
| 0.3 | 1.4 | GO:0033234 | negative regulation of protein sumoylation(GO:0033234) |
| 0.3 | 12.3 | GO:0046513 | ceramide biosynthetic process(GO:0046513) |
| 0.3 | 1.8 | GO:0019856 | 'de novo' pyrimidine nucleobase biosynthetic process(GO:0006207) pyrimidine nucleobase biosynthetic process(GO:0019856) |
| 0.2 | 4.4 | GO:0048009 | insulin-like growth factor receptor signaling pathway(GO:0048009) |
| 0.2 | 4.6 | GO:0043496 | regulation of protein homodimerization activity(GO:0043496) |
| 0.2 | 30.1 | GO:0006821 | chloride transport(GO:0006821) |
| 0.2 | 4.0 | GO:0051597 | response to methylmercury(GO:0051597) |
| 0.2 | 3.1 | GO:0060576 | intestinal epithelial cell development(GO:0060576) |
| 0.2 | 1.3 | GO:2000628 | regulation of miRNA metabolic process(GO:2000628) |
| 0.1 | 7.6 | GO:1903146 | regulation of mitophagy(GO:1903146) |
| 0.1 | 9.0 | GO:0032024 | positive regulation of insulin secretion(GO:0032024) |
| 0.1 | 9.3 | GO:0006888 | ER to Golgi vesicle-mediated transport(GO:0006888) |
| 0.1 | 2.3 | GO:0061014 | positive regulation of mRNA catabolic process(GO:0061014) |
| 0.1 | 4.2 | GO:0030199 | collagen fibril organization(GO:0030199) |
| 0.1 | 3.9 | GO:0000413 | protein peptidyl-prolyl isomerization(GO:0000413) |
| 0.1 | 6.5 | GO:0048024 | regulation of mRNA splicing, via spliceosome(GO:0048024) |
| 0.1 | 0.3 | GO:0006419 | alanyl-tRNA aminoacylation(GO:0006419) |
| 0.1 | 0.5 | GO:0070459 | prolactin secretion(GO:0070459) |
| 0.0 | 1.0 | GO:0060219 | camera-type eye photoreceptor cell differentiation(GO:0060219) |
| 0.0 | 6.6 | GO:0030308 | negative regulation of cell growth(GO:0030308) |
| 0.0 | 2.3 | GO:0006893 | Golgi to plasma membrane transport(GO:0006893) |
| 0.0 | 0.7 | GO:0030033 | microvillus assembly(GO:0030033) |
| 0.0 | 4.1 | GO:0045930 | negative regulation of mitotic cell cycle(GO:0045930) |
| 0.0 | 3.8 | GO:0006814 | sodium ion transport(GO:0006814) |
| 0.0 | 7.8 | GO:0043547 | positive regulation of GTPase activity(GO:0043547) |
Gene overrepresentation in cellular component category:
| Log-likelihood per target | Total log-likelihood | Term | Description |
|---|---|---|---|
| 2.2 | 8.7 | GO:0097487 | multivesicular body, internal vesicle(GO:0097487) |
| 1.7 | 27.8 | GO:0070852 | cell body fiber(GO:0070852) |
| 1.5 | 4.4 | GO:0000172 | ribonuclease MRP complex(GO:0000172) |
| 1.3 | 17.6 | GO:0030127 | COPII vesicle coat(GO:0030127) |
| 1.2 | 6.2 | GO:0046696 | lipopolysaccharide receptor complex(GO:0046696) |
| 1.1 | 3.3 | GO:0070421 | DNA ligase III-XRCC1 complex(GO:0070421) |
| 1.1 | 12.9 | GO:0005890 | sodium:potassium-exchanging ATPase complex(GO:0005890) |
| 0.6 | 3.9 | GO:0098553 | integral component of cytoplasmic side of endoplasmic reticulum membrane(GO:0071458) integral component of lumenal side of endoplasmic reticulum membrane(GO:0071556) lumenal side of endoplasmic reticulum membrane(GO:0098553) |
| 0.5 | 1.4 | GO:0097444 | spine apparatus(GO:0097444) |
| 0.4 | 9.7 | GO:0030057 | desmosome(GO:0030057) |
| 0.3 | 6.0 | GO:0070971 | endoplasmic reticulum exit site(GO:0070971) |
| 0.3 | 4.0 | GO:0031232 | extrinsic component of external side of plasma membrane(GO:0031232) |
| 0.3 | 2.8 | GO:0005915 | zonula adherens(GO:0005915) |
| 0.3 | 1.5 | GO:0042719 | mitochondrial intermembrane space protein transporter complex(GO:0042719) |
| 0.3 | 2.7 | GO:0005641 | nuclear envelope lumen(GO:0005641) |
| 0.3 | 14.5 | GO:0009925 | basal plasma membrane(GO:0009925) |
| 0.2 | 5.5 | GO:0000421 | autophagosome membrane(GO:0000421) |
| 0.2 | 2.1 | GO:0097418 | neurofibrillary tangle(GO:0097418) |
| 0.2 | 16.6 | GO:0030667 | secretory granule membrane(GO:0030667) |
| 0.2 | 1.6 | GO:1990635 | proximal dendrite(GO:1990635) |
| 0.2 | 25.9 | GO:0030139 | endocytic vesicle(GO:0030139) |
| 0.1 | 10.5 | GO:0031970 | mitochondrial intermembrane space(GO:0005758) organelle envelope lumen(GO:0031970) |
| 0.1 | 7.0 | GO:0005801 | cis-Golgi network(GO:0005801) |
| 0.1 | 23.2 | GO:0031514 | motile cilium(GO:0031514) |
| 0.1 | 7.2 | GO:0015030 | Cajal body(GO:0015030) |
| 0.1 | 1.4 | GO:0000177 | cytoplasmic exosome (RNase complex)(GO:0000177) |
| 0.1 | 20.9 | GO:0042579 | peroxisome(GO:0005777) microbody(GO:0042579) |
| 0.1 | 2.1 | GO:0005852 | eukaryotic translation initiation factor 3 complex(GO:0005852) |
| 0.1 | 9.4 | GO:0032587 | ruffle membrane(GO:0032587) |
| 0.1 | 6.1 | GO:0042470 | melanosome(GO:0042470) pigment granule(GO:0048770) |
| 0.1 | 34.8 | GO:0045177 | apical part of cell(GO:0045177) |
| 0.1 | 3.3 | GO:0005798 | Golgi-associated vesicle(GO:0005798) |
| 0.0 | 8.8 | GO:0032993 | protein-DNA complex(GO:0032993) |
| 0.0 | 0.9 | GO:0019013 | viral nucleocapsid(GO:0019013) |
| 0.0 | 13.3 | GO:0005743 | mitochondrial inner membrane(GO:0005743) |
| 0.0 | 1.3 | GO:0010494 | cytoplasmic stress granule(GO:0010494) |
| 0.0 | 7.8 | GO:0016607 | nuclear speck(GO:0016607) |
| 0.0 | 9.4 | GO:0000139 | Golgi membrane(GO:0000139) |
| 0.0 | 1.8 | GO:0043195 | terminal bouton(GO:0043195) |
| 0.0 | 6.5 | GO:0000785 | chromatin(GO:0000785) |
Gene overrepresentation in molecular function category:
| Log-likelihood per target | Total log-likelihood | Term | Description |
|---|---|---|---|
| 3.5 | 10.5 | GO:1990050 | phosphatidic acid transporter activity(GO:1990050) |
| 3.5 | 10.4 | GO:0004335 | galactokinase activity(GO:0004335) |
| 3.3 | 29.8 | GO:0031995 | insulin-like growth factor II binding(GO:0031995) |
| 3.1 | 30.6 | GO:0016892 | endoribonuclease activity, producing 3'-phosphomonoesters(GO:0016892) |
| 2.5 | 17.7 | GO:1904047 | oxidoreductase activity, acting on other nitrogenous compounds as donors(GO:0016661) S-adenosyl-L-methionine binding(GO:1904047) |
| 1.9 | 22.9 | GO:0022820 | potassium:chloride symporter activity(GO:0015379) potassium ion symporter activity(GO:0022820) |
| 1.7 | 8.6 | GO:0008453 | alanine-glyoxylate transaminase activity(GO:0008453) |
| 1.6 | 4.7 | GO:0000703 | oxidized pyrimidine nucleobase lesion DNA N-glycosylase activity(GO:0000703) |
| 1.5 | 12.3 | GO:0050291 | sphingosine N-acyltransferase activity(GO:0050291) |
| 1.5 | 4.4 | GO:0000171 | ribonuclease MRP activity(GO:0000171) |
| 1.5 | 27.8 | GO:0015643 | toxic substance binding(GO:0015643) |
| 1.3 | 12.9 | GO:1990239 | steroid hormone binding(GO:1990239) |
| 1.3 | 3.8 | GO:0004829 | threonine-tRNA ligase activity(GO:0004829) |
| 1.2 | 6.2 | GO:0034186 | apolipoprotein A-I binding(GO:0034186) |
| 1.2 | 10.8 | GO:0042285 | xylosyltransferase activity(GO:0042285) |
| 1.1 | 15.6 | GO:0015250 | water channel activity(GO:0015250) |
| 0.8 | 4.2 | GO:0004586 | ornithine decarboxylase activity(GO:0004586) |
| 0.8 | 6.7 | GO:0045545 | syndecan binding(GO:0045545) |
| 0.8 | 3.9 | GO:0046923 | ER retention sequence binding(GO:0046923) |
| 0.8 | 3.9 | GO:0008310 | single-stranded DNA 3'-5' exodeoxyribonuclease activity(GO:0008310) |
| 0.7 | 3.0 | GO:0047623 | AMP deaminase activity(GO:0003876) adenosine-phosphate deaminase activity(GO:0047623) |
| 0.7 | 6.4 | GO:0015093 | ferrous iron transmembrane transporter activity(GO:0015093) |
| 0.7 | 3.9 | GO:0042500 | aspartic endopeptidase activity, intramembrane cleaving(GO:0042500) |
| 0.6 | 4.0 | GO:0004065 | arylsulfatase activity(GO:0004065) |
| 0.6 | 10.5 | GO:0005247 | voltage-gated chloride channel activity(GO:0005247) |
| 0.5 | 12.1 | GO:0016780 | phosphotransferase activity, for other substituted phosphate groups(GO:0016780) |
| 0.5 | 3.2 | GO:0004694 | eukaryotic translation initiation factor 2alpha kinase activity(GO:0004694) |
| 0.5 | 3.5 | GO:0033592 | RNA strand annealing activity(GO:0033592) |
| 0.4 | 9.0 | GO:0042975 | peroxisome proliferator activated receptor binding(GO:0042975) |
| 0.4 | 14.3 | GO:0031492 | nucleosomal DNA binding(GO:0031492) |
| 0.4 | 3.3 | GO:0003909 | DNA ligase activity(GO:0003909) DNA ligase (ATP) activity(GO:0003910) |
| 0.4 | 2.9 | GO:1990825 | sequence-specific mRNA binding(GO:1990825) |
| 0.3 | 3.9 | GO:0005528 | macrolide binding(GO:0005527) FK506 binding(GO:0005528) |
| 0.3 | 2.1 | GO:0032050 | clathrin heavy chain binding(GO:0032050) |
| 0.3 | 1.8 | GO:0016812 | hydrolase activity, acting on carbon-nitrogen (but not peptide) bonds, in cyclic amides(GO:0016812) |
| 0.3 | 5.3 | GO:0016881 | acid-amino acid ligase activity(GO:0016881) |
| 0.2 | 5.4 | GO:0008483 | transaminase activity(GO:0008483) |
| 0.2 | 3.7 | GO:0008253 | 5'-nucleotidase activity(GO:0008253) |
| 0.2 | 2.8 | GO:0045295 | gamma-catenin binding(GO:0045295) |
| 0.2 | 9.4 | GO:0005154 | epidermal growth factor receptor binding(GO:0005154) |
| 0.2 | 25.9 | GO:0030165 | PDZ domain binding(GO:0030165) |
| 0.1 | 6.3 | GO:0017112 | Rab guanyl-nucleotide exchange factor activity(GO:0017112) |
| 0.1 | 10.5 | GO:0051287 | NAD binding(GO:0051287) |
| 0.1 | 1.3 | GO:0035925 | mRNA 3'-UTR AU-rich region binding(GO:0035925) |
| 0.1 | 1.4 | GO:0019789 | SUMO transferase activity(GO:0019789) |
| 0.1 | 11.9 | GO:0008201 | heparin binding(GO:0008201) |
| 0.1 | 0.3 | GO:0004813 | alanine-tRNA ligase activity(GO:0004813) |
| 0.1 | 12.7 | GO:0044822 | mRNA binding(GO:0003729) poly(A) RNA binding(GO:0044822) |
| 0.1 | 1.6 | GO:0070064 | proline-rich region binding(GO:0070064) |
| 0.0 | 6.7 | GO:0003714 | transcription corepressor activity(GO:0003714) |
| 0.0 | 2.8 | GO:0004222 | metalloendopeptidase activity(GO:0004222) |
| 0.0 | 10.3 | GO:0050839 | cell adhesion molecule binding(GO:0050839) |
| 0.0 | 20.9 | GO:0008270 | zinc ion binding(GO:0008270) |
| 0.0 | 1.5 | GO:0003777 | microtubule motor activity(GO:0003777) |
| 0.0 | 0.5 | GO:0061650 | ubiquitin conjugating enzyme activity(GO:0061631) ubiquitin-like protein conjugating enzyme activity(GO:0061650) |
Gene overrepresentation in curated gene sets: canonical pathways category:
| Log-likelihood per target | Total log-likelihood | Term | Description |
|---|---|---|---|
| 0.5 | 9.0 | PID ERB GENOMIC PATHWAY | Validated nuclear estrogen receptor beta network |
| 0.4 | 18.5 | PID ECADHERIN STABILIZATION PATHWAY | Stabilization and expansion of the E-cadherin adherens junction |
| 0.3 | 25.9 | PID LYSOPHOSPHOLIPID PATHWAY | LPA receptor mediated events |
| 0.3 | 6.2 | PID TOLL ENDOGENOUS PATHWAY | Endogenous TLR signaling |
| 0.1 | 6.7 | PID BMP PATHWAY | BMP receptor signaling |
| 0.1 | 1.4 | ST JAK STAT PATHWAY | Jak-STAT Pathway |
| 0.1 | 27.1 | NABA ECM GLYCOPROTEINS | Genes encoding structural ECM glycoproteins |
| 0.1 | 6.1 | PID PLK1 PATHWAY | PLK1 signaling events |
| 0.1 | 3.4 | PID BARD1 PATHWAY | BARD1 signaling events |
| 0.1 | 8.2 | PID ERBB1 DOWNSTREAM PATHWAY | ErbB1 downstream signaling |
| 0.0 | 1.8 | ST FAS SIGNALING PATHWAY | Fas Signaling Pathway |
Gene overrepresentation in curated gene sets: REACTOME pathways category:
| Log-likelihood per target | Total log-likelihood | Term | Description |
|---|---|---|---|
| 1.3 | 15.6 | REACTOME PASSIVE TRANSPORT BY AQUAPORINS | Genes involved in Passive Transport by Aquaporins |
| 1.3 | 27.1 | REACTOME REGULATION OF INSULIN LIKE GROWTH FACTOR IGF ACTIVITY BY INSULIN LIKE GROWTH FACTOR BINDING PROTEINS IGFBPS | Genes involved in Regulation of Insulin-like Growth Factor (IGF) Activity by Insulin-like Growth Factor Binding Proteins (IGFBPs) |
| 0.8 | 12.1 | REACTOME ACYL CHAIN REMODELLING OF PG | Genes involved in Acyl chain remodelling of PG |
| 0.7 | 9.7 | REACTOME APOPTOTIC CLEAVAGE OF CELL ADHESION PROTEINS | Genes involved in Apoptotic cleavage of cell adhesion proteins |
| 0.6 | 17.7 | REACTOME SULFUR AMINO ACID METABOLISM | Genes involved in Sulfur amino acid metabolism |
| 0.5 | 9.3 | REACTOME ANTIGEN PRESENTATION FOLDING ASSEMBLY AND PEPTIDE LOADING OF CLASS I MHC | Genes involved in Antigen Presentation: Folding, assembly and peptide loading of class I MHC |
| 0.5 | 8.1 | REACTOME RESOLUTION OF AP SITES VIA THE SINGLE NUCLEOTIDE REPLACEMENT PATHWAY | Genes involved in Resolution of AP sites via the single-nucleotide replacement pathway |
| 0.4 | 5.3 | REACTOME VITAMIN B5 PANTOTHENATE METABOLISM | Genes involved in Vitamin B5 (pantothenate) metabolism |
| 0.4 | 4.0 | REACTOME THE ACTIVATION OF ARYLSULFATASES | Genes involved in The activation of arylsulfatases |
| 0.3 | 12.3 | REACTOME SPHINGOLIPID DE NOVO BIOSYNTHESIS | Genes involved in Sphingolipid de novo biosynthesis |
| 0.3 | 12.9 | REACTOME ION TRANSPORT BY P TYPE ATPASES | Genes involved in Ion transport by P-type ATPases |
| 0.2 | 3.0 | REACTOME PURINE SALVAGE | Genes involved in Purine salvage |
| 0.2 | 6.5 | REACTOME MRNA 3 END PROCESSING | Genes involved in mRNA 3'-end processing |
| 0.1 | 4.6 | REACTOME PERK REGULATED GENE EXPRESSION | Genes involved in PERK regulated gene expression |
| 0.1 | 7.9 | REACTOME GOLGI ASSOCIATED VESICLE BIOGENESIS | Genes involved in Golgi Associated Vesicle Biogenesis |
| 0.1 | 6.2 | REACTOME MITOCHONDRIAL PROTEIN IMPORT | Genes involved in Mitochondrial Protein Import |
| 0.1 | 25.9 | REACTOME G ALPHA I SIGNALLING EVENTS | Genes involved in G alpha (i) signalling events |
| 0.1 | 9.0 | REACTOME NUCLEAR RECEPTOR TRANSCRIPTION PATHWAY | Genes involved in Nuclear Receptor transcription pathway |
| 0.1 | 2.8 | REACTOME ADHERENS JUNCTIONS INTERACTIONS | Genes involved in Adherens junctions interactions |
| 0.1 | 17.8 | REACTOME METABOLISM OF AMINO ACIDS AND DERIVATIVES | Genes involved in Metabolism of amino acids and derivatives |
| 0.1 | 8.7 | REACTOME RESPONSE TO ELEVATED PLATELET CYTOSOLIC CA2 | Genes involved in Response to elevated platelet cytosolic Ca2+ |
| 0.1 | 1.8 | REACTOME PYRIMIDINE METABOLISM | Genes involved in Pyrimidine metabolism |
| 0.1 | 4.2 | REACTOME COLLAGEN FORMATION | Genes involved in Collagen formation |
| 0.1 | 3.9 | REACTOME INTERFERON ALPHA BETA SIGNALING | Genes involved in Interferon alpha/beta signaling |
| 0.0 | 0.9 | REACTOME MRNA SPLICING | Genes involved in mRNA Splicing |