Project
GSE53960: rat RNA-Seq transcriptomic Bodymap
Navigation
Downloads
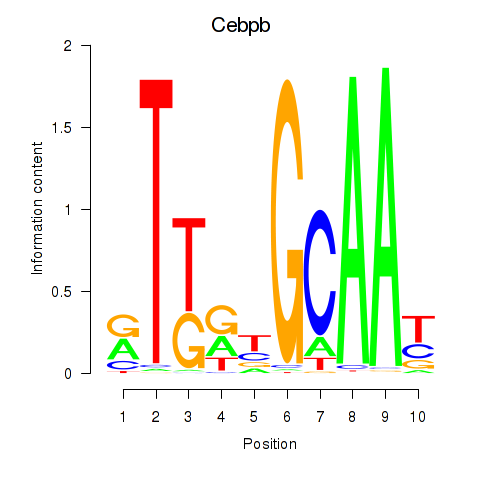
Results for Cebpb
Z-value: 2.48
Motif logo
Transcription factors associated with Cebpb
| Gene Symbol | Gene ID | Gene Info |
|---|---|---|
|
Cebpb
|
ENSRNOG00000057347 | CCAAT/enhancer binding protein beta |
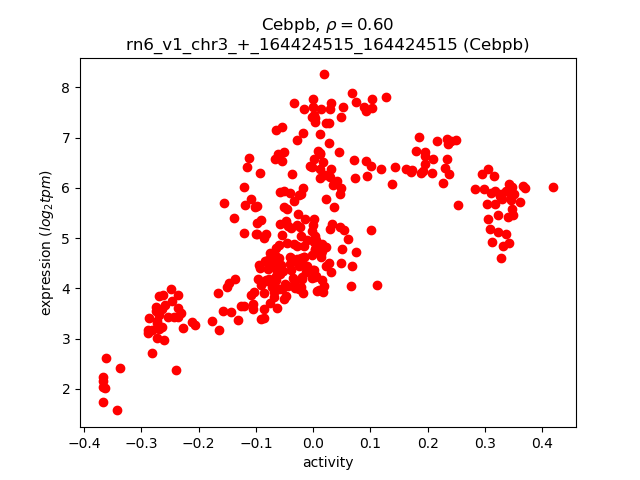
Activity-expression correlation:
| Gene | Promoter | Pearson corr. coef. | P-value | Plot |
|---|---|---|---|---|
| Cebpb | rn6_v1_chr3_+_164424515_164424515 | 0.60 | 8.3e-33 | Click! |
Activity profile of Cebpb motif
Sorted Z-values of Cebpb motif
| Promoter | Log-likelihood | Transcript | Gene | Gene Info |
|---|---|---|---|---|
| chr2_+_181987217 | 196.04 |
ENSRNOT00000034521
|
Fgg
|
fibrinogen gamma chain |
| chr11_-_81717521 | 157.82 |
ENSRNOT00000058422
|
Ahsg
|
alpha-2-HS-glycoprotein |
| chr9_+_74124016 | 157.18 |
ENSRNOT00000019023
|
Cps1
|
carbamoyl-phosphate synthase 1 |
| chr15_+_28018040 | 155.80 |
ENSRNOT00000041495
|
Rnase4
|
ribonuclease A family member 4 |
| chr2_+_55775274 | 149.13 |
ENSRNOT00000018545
|
C9
|
complement C9 |
| chr1_-_76614279 | 148.08 |
ENSRNOT00000041367
ENSRNOT00000089371 |
LOC100912485
|
alcohol sulfotransferase-like |
| chrX_+_33443186 | 137.09 |
ENSRNOT00000005622
|
S100g
|
S100 calcium binding protein G |
| chr1_-_76780230 | 132.59 |
ENSRNOT00000002046
|
LOC100912485
|
alcohol sulfotransferase-like |
| chr1_-_76722965 | 127.69 |
ENSRNOT00000052129
|
LOC100912485
|
alcohol sulfotransferase-like |
| chr2_+_182006242 | 126.94 |
ENSRNOT00000064091
|
Fga
|
fibrinogen alpha chain |
| chr9_-_78969013 | 126.22 |
ENSRNOT00000019772
ENSRNOT00000057585 |
Fn1
|
fibronectin 1 |
| chrX_+_143097525 | 123.62 |
ENSRNOT00000004559
|
F9
|
coagulation factor IX |
| chr2_+_104744461 | 121.43 |
ENSRNOT00000016083
ENSRNOT00000082627 |
Cp
|
ceruloplasmin |
| chr10_+_96639924 | 113.55 |
ENSRNOT00000004756
|
Apoh
|
apolipoprotein H |
| chr8_-_111721303 | 109.14 |
ENSRNOT00000045628
ENSRNOT00000012725 |
Tf
|
transferrin |
| chr1_-_256813711 | 103.63 |
ENSRNOT00000021055
|
Rbp4
|
retinol binding protein 4 |
| chr7_+_99142450 | 99.16 |
ENSRNOT00000079036
ENSRNOT00000091923 |
LOC108348266
|
cytochrome P450 2B1 |
| chr4_+_100166863 | 96.95 |
ENSRNOT00000014505
|
Sftpb
|
surfactant protein B |
| chr1_-_76517134 | 94.01 |
ENSRNOT00000064593
ENSRNOT00000085775 |
LOC100912485
|
alcohol sulfotransferase-like |
| chr8_+_116857684 | 93.97 |
ENSRNOT00000026711
|
Mst1
|
macrophage stimulating 1 |
| chr16_+_18690246 | 90.66 |
ENSRNOT00000081484
|
Mat1a
|
methionine adenosyltransferase 1A |
| chr10_+_56710464 | 85.90 |
ENSRNOT00000065370
ENSRNOT00000064064 |
Asgr2
|
asialoglycoprotein receptor 2 |
| chr3_-_101474890 | 85.03 |
ENSRNOT00000091869
|
Bbox1
|
gamma-butyrobetaine hydroxylase 1 |
| chr10_-_62254287 | 83.26 |
ENSRNOT00000004313
|
Serpinf1
|
serpin family F member 1 |
| chr1_+_276240703 | 71.80 |
ENSRNOT00000022126
|
Acsl5
|
acyl-CoA synthetase long-chain family member 5 |
| chr13_-_111972603 | 71.72 |
ENSRNOT00000007870
|
Hsd11b1
|
hydroxysteroid 11-beta dehydrogenase 1 |
| chr8_+_22856539 | 67.75 |
ENSRNOT00000015381
|
Angptl8
|
angiopoietin-like 8 |
| chrX_-_110232179 | 65.96 |
ENSRNOT00000014739
|
Serpina7
|
serpin family A member 7 |
| chr3_-_147819571 | 65.28 |
ENSRNOT00000009840
|
Trib3
|
tribbles pseudokinase 3 |
| chr9_+_46962288 | 63.70 |
ENSRNOT00000082146
|
Il1r1
|
interleukin 1 receptor type 1 |
| chr2_-_189254628 | 62.13 |
ENSRNOT00000028234
|
Il6r
|
interleukin 6 receptor |
| chr10_-_87407634 | 60.33 |
ENSRNOT00000016657
|
Krt23
|
keratin 23 |
| chr7_-_143538579 | 60.29 |
ENSRNOT00000081518
|
Krt79
|
keratin 79 |
| chr19_+_15081158 | 60.10 |
ENSRNOT00000074070
|
Ces1f
|
carboxylesterase 1F |
| chr14_+_7113544 | 59.43 |
ENSRNOT00000038188
|
Hsd17b13
|
hydroxysteroid (17-beta) dehydrogenase 13 |
| chr4_-_157155609 | 58.76 |
ENSRNOT00000016330
|
C1s
|
complement C1s |
| chr1_-_101596822 | 58.54 |
ENSRNOT00000028490
|
Fgf21
|
fibroblast growth factor 21 |
| chr6_-_25211494 | 58.33 |
ENSRNOT00000009634
|
Xdh
|
xanthine dehydrogenase |
| chr19_+_15081590 | 58.07 |
ENSRNOT00000024187
|
Ces1f
|
carboxylesterase 1F |
| chr7_+_3216497 | 56.27 |
ENSRNOT00000008909
|
Mmp19
|
matrix metallopeptidase 19 |
| chr9_+_95233957 | 53.70 |
ENSRNOT00000071003
|
Ugt1a5
|
UDP glucuronosyltransferase family 1 member A5 |
| chr5_+_151181559 | 53.68 |
ENSRNOT00000085674
|
Fgr
|
FGR proto-oncogene, Src family tyrosine kinase |
| chr9_+_81656116 | 53.54 |
ENSRNOT00000083421
|
Slc11a1
|
solute carrier family 11 member 1 |
| chr11_-_34142753 | 53.46 |
ENSRNOT00000002297
|
Cldn14
|
claudin 14 |
| chr13_+_83073544 | 52.58 |
ENSRNOT00000066119
ENSRNOT00000079796 ENSRNOT00000077070 |
Dpt
|
dermatopontin |
| chr16_+_61954809 | 48.20 |
ENSRNOT00000068011
|
Rbpms
|
RNA binding protein with multiple splicing |
| chr20_+_3176107 | 46.88 |
ENSRNOT00000001036
|
RT1-S3
|
RT1 class Ib, locus S3 |
| chr18_+_16590197 | 46.57 |
ENSRNOT00000066583
|
Mocos
|
molybdenum cofactor sulfurase |
| chr3_-_121882726 | 46.27 |
ENSRNOT00000006308
|
Il1b
|
interleukin 1 beta |
| chr10_-_70871066 | 45.32 |
ENSRNOT00000015139
|
Ccl3
|
C-C motif chemokine ligand 3 |
| chr1_-_22661377 | 44.96 |
ENSRNOT00000021896
|
Vnn3
|
vanin 3 |
| chr1_-_253185533 | 44.22 |
ENSRNOT00000067822
|
Pank1
|
pantothenate kinase 1 |
| chr16_+_61954590 | 44.00 |
ENSRNOT00000017883
|
Rbpms
|
RNA binding protein with multiple splicing |
| chr6_+_56846789 | 43.56 |
ENSRNOT00000032108
|
Agmo
|
alkylglycerol monooxygenase |
| chr3_+_154786215 | 41.28 |
ENSRNOT00000019787
|
Lbp
|
lipopolysaccharide binding protein |
| chr14_+_84306466 | 40.84 |
ENSRNOT00000006116
|
Sec14l4
|
SEC14-like lipid binding 4 |
| chr19_+_14508616 | 39.86 |
ENSRNOT00000019192
|
Hmox1
|
heme oxygenase 1 |
| chr11_-_69201380 | 39.46 |
ENSRNOT00000085618
|
Mylk
|
myosin light chain kinase |
| chr20_-_45260119 | 38.99 |
ENSRNOT00000000718
|
Slc16a10
|
solute carrier family 16 member 10 |
| chr20_+_22913694 | 38.92 |
ENSRNOT00000067920
|
Reep3
|
receptor accessory protein 3 |
| chr10_-_82117109 | 38.10 |
ENSRNOT00000079711
|
Abcc3
|
ATP binding cassette subfamily C member 3 |
| chr7_-_101140308 | 37.71 |
ENSRNOT00000006279
|
Fam84b
|
family with sequence similarity 84, member B |
| chr1_+_145770135 | 37.44 |
ENSRNOT00000015320
|
Stard5
|
StAR-related lipid transfer domain containing 5 |
| chr13_-_80775230 | 36.66 |
ENSRNOT00000091389
ENSRNOT00000004762 |
Fmo2
|
flavin containing monooxygenase 2 |
| chr11_+_82680253 | 36.60 |
ENSRNOT00000077119
ENSRNOT00000075512 |
Liph
|
lipase H |
| chr9_+_10952374 | 36.03 |
ENSRNOT00000074993
|
Lrg1
|
leucine-rich alpha-2-glycoprotein 1 |
| chr18_-_29562153 | 35.77 |
ENSRNOT00000023977
|
Cd14
|
CD14 molecule |
| chr10_-_82116621 | 35.70 |
ENSRNOT00000003977
ENSRNOT00000051497 ENSRNOT00000085451 |
Abcc3
|
ATP binding cassette subfamily C member 3 |
| chr5_-_137372993 | 35.24 |
ENSRNOT00000092823
|
Tmem125
|
transmembrane protein 125 |
| chr6_-_125723732 | 34.42 |
ENSRNOT00000084815
|
Fbln5
|
fibulin 5 |
| chr18_-_15688117 | 33.87 |
ENSRNOT00000022584
|
Dsg3
|
desmoglein 3 |
| chr4_-_82173207 | 33.86 |
ENSRNOT00000074167
|
Hoxa5
|
homeo box A5 |
| chr20_-_45259928 | 33.82 |
ENSRNOT00000087226
|
Slc16a10
|
solute carrier family 16 member 10 |
| chr14_+_45062662 | 33.63 |
ENSRNOT00000059124
|
Tlr10
|
toll-like receptor 10 |
| chr1_-_167700332 | 33.03 |
ENSRNOT00000092890
|
Trim21
|
tripartite motif-containing 21 |
| chr4_-_82258765 | 33.03 |
ENSRNOT00000008523
|
Hoxa5
|
homeo box A5 |
| chr9_-_46309451 | 32.96 |
ENSRNOT00000018684
|
Rnf149
|
ring finger protein 149 |
| chrX_+_120624518 | 32.28 |
ENSRNOT00000007967
|
Slc6a14
|
solute carrier family 6 member 14 |
| chr14_+_22072024 | 31.78 |
ENSRNOT00000002680
|
ste2
|
estrogen sulfotransferase |
| chr1_+_256786124 | 30.56 |
ENSRNOT00000034563
|
Ffar4
|
free fatty acid receptor 4 |
| chr6_-_125723944 | 30.49 |
ENSRNOT00000007004
|
Fbln5
|
fibulin 5 |
| chr7_-_70829815 | 30.14 |
ENSRNOT00000011082
|
Shmt2
|
serine hydroxymethyltransferase 2 |
| chr10_-_104628676 | 28.75 |
ENSRNOT00000010466
|
Unc13d
|
unc-13 homolog D |
| chr1_-_100537377 | 27.78 |
ENSRNOT00000026599
|
Spib
|
Spi-B transcription factor |
| chr20_-_2707108 | 27.01 |
ENSRNOT00000082052
ENSRNOT00000048535 |
LOC100364500
|
RT1 class I, locus CE11-like |
| chr2_-_190100276 | 26.13 |
ENSRNOT00000015351
|
S100a9
|
S100 calcium binding protein A9 |
| chr18_+_16590408 | 25.20 |
ENSRNOT00000093715
|
Mocos
|
molybdenum cofactor sulfurase |
| chr17_-_46115004 | 24.64 |
ENSRNOT00000087838
|
Aoah
|
acyloxyacyl hydrolase |
| chr2_-_185168476 | 23.27 |
ENSRNOT00000093447
|
Fam160a1
|
family with sequence similarity 160, member A1 |
| chr7_+_99954492 | 22.27 |
ENSRNOT00000005885
|
Trib1
|
tribbles pseudokinase 1 |
| chr1_+_84256159 | 22.04 |
ENSRNOT00000031026
|
Blvrb
|
biliverdin reductase B |
| chr12_-_48238887 | 21.96 |
ENSRNOT00000078868
|
Acacb
|
acetyl-CoA carboxylase beta |
| chr20_+_4517307 | 21.29 |
ENSRNOT00000000483
|
Dxo
|
decapping exoribonuclease |
| chr14_+_60657686 | 21.28 |
ENSRNOT00000070892
|
Sepsecs
|
Sep (O-phosphoserine) tRNA:Sec (selenocysteine) tRNA synthase |
| chr14_-_18591394 | 20.30 |
ENSRNOT00000003716
|
Ereg
|
epiregulin |
| chr14_-_7384876 | 20.22 |
ENSRNOT00000086694
|
Aff1
|
AF4/FMR2 family, member 1 |
| chr16_-_85306366 | 19.85 |
ENSRNOT00000089650
|
Tnfsf13b
|
tumor necrosis factor superfamily member 13b |
| chr3_+_1285664 | 19.69 |
ENSRNOT00000007512
|
Il36g
|
interleukin 36, gamma |
| chr8_+_132607166 | 19.40 |
ENSRNOT00000007223
|
Sacm1l
|
SAC1 suppressor of actin mutations 1-like (yeast) |
| chr1_+_91152635 | 17.46 |
ENSRNOT00000073438
|
LOC100912070
|
dermokine-like |
| chr10_-_108196217 | 17.39 |
ENSRNOT00000075440
|
Cbx4
|
chromobox 4 |
| chr7_-_14302552 | 16.70 |
ENSRNOT00000091368
|
Brd4
|
bromodomain containing 4 |
| chr6_+_24163026 | 16.25 |
ENSRNOT00000061284
|
Lbh
|
limb bud and heart development |
| chr18_+_32594958 | 16.11 |
ENSRNOT00000018511
|
Spry4
|
sprouty RTK signaling antagonist 4 |
| chr1_+_89215266 | 15.88 |
ENSRNOT00000093612
ENSRNOT00000084799 |
Dmkn
|
dermokine |
| chr2_-_178297172 | 15.35 |
ENSRNOT00000038543
|
Fnip2
|
folliculin interacting protein 2 |
| chr2_-_147693082 | 15.23 |
ENSRNOT00000022507
|
Wwtr1
|
WW domain containing transcription regulator 1 |
| chr8_-_48674748 | 14.56 |
ENSRNOT00000014127
|
Hmbs
|
hydroxymethylbilane synthase |
| chr1_-_6970040 | 14.14 |
ENSRNOT00000016273
|
Utrn
|
utrophin |
| chr3_+_151285249 | 14.13 |
ENSRNOT00000055254
|
Procr
|
protein C receptor |
| chr3_+_18706988 | 13.80 |
ENSRNOT00000074650
|
AABR07051652.1
|
|
| chr2_-_1561464 | 13.77 |
ENSRNOT00000062055
ENSRNOT00000062054 ENSRNOT00000062052 |
Cast
|
calpastatin |
| chr1_-_254735548 | 13.49 |
ENSRNOT00000025258
|
Ankrd1
|
ankyrin repeat domain 1 |
| chr8_+_5768811 | 13.33 |
ENSRNOT00000013936
|
Mmp8
|
matrix metallopeptidase 8 |
| chr3_+_97349454 | 13.23 |
ENSRNOT00000089524
|
Dcdc5
|
doublecortin domain containing 5 |
| chr14_-_8548310 | 13.19 |
ENSRNOT00000092436
|
Arhgap24
|
Rho GTPase activating protein 24 |
| chr2_+_150756185 | 12.99 |
ENSRNOT00000088461
ENSRNOT00000036808 |
Mbnl1
|
muscleblind-like splicing regulator 1 |
| chr11_+_85042348 | 12.97 |
ENSRNOT00000042220
|
AABR07034718.1
|
|
| chr5_+_72103704 | 12.96 |
ENSRNOT00000021629
|
Rad23b
|
RAD23 homolog B, nucleotide excision repair protein |
| chr7_-_27240528 | 12.92 |
ENSRNOT00000029435
ENSRNOT00000079731 |
Hsp90b1
|
heat shock protein 90 beta family member 1 |
| chr6_-_107678156 | 12.59 |
ENSRNOT00000014158
|
Elmsan1
|
ELM2 and Myb/SANT domain containing 1 |
| chr4_+_147333056 | 12.56 |
ENSRNOT00000012137
|
Pparg
|
peroxisome proliferator-activated receptor gamma |
| chr14_-_38575785 | 12.37 |
ENSRNOT00000003146
|
Atp10d
|
ATPase phospholipid transporting 10D (putative) |
| chr9_-_54327958 | 12.29 |
ENSRNOT00000019465
|
Stat1
|
signal transducer and activator of transcription 1 |
| chr5_+_142731767 | 11.26 |
ENSRNOT00000067762
|
Inpp5b
|
inositol polyphosphate-5-phosphatase B |
| chr19_-_11057254 | 11.25 |
ENSRNOT00000025559
|
Herpud1
|
homocysteine inducible ER protein with ubiquitin like domain 1 |
| chr7_+_2504695 | 11.23 |
ENSRNOT00000003965
|
Atp5b
|
ATP synthase, H+ transporting, mitochondrial F1 complex, beta polypeptide |
| chr4_-_35730599 | 11.10 |
ENSRNOT00000051149
|
Rps4x
|
ribosomal protein S4, X-linked |
| chr11_-_28777603 | 11.00 |
ENSRNOT00000002132
|
Krtap14
|
keratin associated protein 14 |
| chr1_-_83418777 | 10.89 |
ENSRNOT00000049175
|
Cyp2b21
|
cytochrome P450, family 2, subfamily b, polypeptide 21 |
| chr3_+_18315320 | 10.73 |
ENSRNOT00000006954
|
AABR07051626.2
|
|
| chr20_-_2103864 | 10.70 |
ENSRNOT00000001014
|
Rnf39
|
ring finger protein 39 |
| chr1_+_252323865 | 10.58 |
ENSRNOT00000026299
|
Lipk
|
lipase, family member K |
| chr11_-_60547201 | 10.30 |
ENSRNOT00000093151
|
Btla
|
B and T lymphocyte associated |
| chr16_-_85305782 | 10.07 |
ENSRNOT00000067511
ENSRNOT00000076737 |
Tnfsf13b
|
tumor necrosis factor superfamily member 13b |
| chr13_+_48427038 | 9.89 |
ENSRNOT00000009241
|
Ctse
|
cathepsin E |
| chr7_-_137856485 | 9.74 |
ENSRNOT00000007003
|
LOC688906
|
similar to splicing factor, arginine/serine-rich 2, interacting protein |
| chr3_-_152259156 | 9.33 |
ENSRNOT00000065729
|
LOC100910882
|
RNA-binding protein 39-like |
| chr20_+_7908304 | 9.28 |
ENSRNOT00000000603
|
Rpl10a
|
ribosomal protein L10A |
| chr7_-_14303055 | 9.07 |
ENSRNOT00000008963
|
Brd4
|
bromodomain containing 4 |
| chr4_-_28953067 | 8.77 |
ENSRNOT00000013989
|
Tfpi2
|
tissue factor pathway inhibitor 2 |
| chr14_-_100184192 | 8.69 |
ENSRNOT00000007044
|
Plek
|
pleckstrin |
| chr12_+_38160464 | 8.69 |
ENSRNOT00000032249
|
Hcar2
|
hydroxycarboxylic acid receptor 2 |
| chr3_-_151724654 | 8.63 |
ENSRNOT00000026964
|
Rbm39
|
RNA binding motif protein 39 |
| chr11_-_60546997 | 7.65 |
ENSRNOT00000083124
ENSRNOT00000050092 |
Btla
|
B and T lymphocyte associated |
| chr3_+_11921715 | 7.43 |
ENSRNOT00000021689
|
Fam129b
|
family with sequence similarity 129, member B |
| chr8_-_133002201 | 7.32 |
ENSRNOT00000008772
|
Ccr1
|
C-C motif chemokine receptor 1 |
| chr5_+_144031402 | 7.25 |
ENSRNOT00000011694
|
Csf3r
|
colony stimulating factor 3 receptor |
| chr8_-_117932518 | 7.14 |
ENSRNOT00000028130
|
Camp
|
cathelicidin antimicrobial peptide |
| chr8_-_96132634 | 6.64 |
ENSRNOT00000041655
|
Syncrip
|
synaptotagmin binding, cytoplasmic RNA interacting protein |
| chr2_+_149899538 | 6.63 |
ENSRNOT00000065365
|
RGD1560324
|
similar to hypothetical protein C130079G13 |
| chr10_-_72188164 | 6.44 |
ENSRNOT00000085728
ENSRNOT00000042506 |
Ggnbp2
|
gametogenetin binding protein 2 |
| chr10_-_84920886 | 5.62 |
ENSRNOT00000068083
|
Sp2
|
Sp2 transcription factor |
| chr1_-_73263466 | 5.24 |
ENSRNOT00000087826
|
Fcar
|
Fc fragment of IgA receptor |
| chr10_+_10725819 | 4.92 |
ENSRNOT00000004159
|
Glyr1
|
glyoxylate reductase 1 homolog |
| chr19_-_43215281 | 4.34 |
ENSRNOT00000025052
|
Aars
|
alanyl-tRNA synthetase |
| chr5_+_142986526 | 4.10 |
ENSRNOT00000012811
|
Rspo1
|
R-spondin 1 |
| chr1_-_170092062 | 4.01 |
ENSRNOT00000023335
|
Olr197
|
olfactory receptor 197 |
| chr3_+_159095876 | 3.73 |
ENSRNOT00000074363
|
LOC103694889
|
seminal vesicle secretory protein 4 |
| chr5_+_74649765 | 3.64 |
ENSRNOT00000075952
|
Palm2
|
paralemmin 2 |
| chr13_+_52887649 | 3.60 |
ENSRNOT00000048033
|
Ascl5
|
achaete-scute family bHLH transcription factor 5 |
| chr20_+_7821755 | 3.58 |
ENSRNOT00000083109
|
Ppard
|
peroxisome proliferator-activated receptor delta |
| chr9_-_46206605 | 3.45 |
ENSRNOT00000018640
|
Tbc1d8
|
TBC1 domain family, member 8 |
| chr10_-_90049112 | 3.30 |
ENSRNOT00000028323
|
Pyy
|
peptide YY (mapped) |
| chr10_+_43446526 | 3.07 |
ENSRNOT00000036959
|
Larp1
|
La ribonucleoprotein domain family, member 1 |
| chr14_-_44375804 | 2.98 |
ENSRNOT00000042825
|
LOC100362751
|
ribosomal protein P2-like |
| chrX_+_25016401 | 2.69 |
ENSRNOT00000059270
|
Clcn4
|
chloride voltage-gated channel 4 |
| chr8_-_96266342 | 2.61 |
ENSRNOT00000078891
|
Syncrip
|
synaptotagmin binding, cytoplasmic RNA interacting protein |
| chr19_-_10596851 | 2.26 |
ENSRNOT00000021716
|
Coq9
|
coenzyme Q9 |
| chr20_-_32133431 | 2.21 |
ENSRNOT00000000443
|
Srgn
|
serglycin |
| chrX_+_111396995 | 2.06 |
ENSRNOT00000087634
|
Pih1d3
|
PIH1 domain containing 3 |
| chr17_-_15402631 | 1.55 |
ENSRNOT00000019862
ENSRNOT00000093637 |
Iars
|
isoleucyl-tRNA synthetase |
| chr1_+_137799185 | 1.51 |
ENSRNOT00000083590
ENSRNOT00000092778 |
Agbl1
|
ATP/GTP binding protein-like 1 |
| chr2_-_149754776 | 1.47 |
ENSRNOT00000035057
|
RGD1559622
|
similar to hypothetical protein C130079G13 |
| chr9_-_24467892 | 1.15 |
ENSRNOT00000060803
|
Defb18
|
defensin beta 18 |
| chr1_+_169912819 | 0.94 |
ENSRNOT00000023283
|
Olr185
|
olfactory receptor 185 |
| chr19_-_43215077 | 0.87 |
ENSRNOT00000082151
|
Aars
|
alanyl-tRNA synthetase |
| chr18_-_15688284 | 0.56 |
ENSRNOT00000091816
|
Dsg3
|
desmoglein 3 |
| chr5_+_139100898 | 0.45 |
ENSRNOT00000012569
|
Edn2
|
endothelin 2 |
| chr7_+_122818975 | 0.06 |
ENSRNOT00000000206
|
Ep300
|
E1A binding protein p300 |
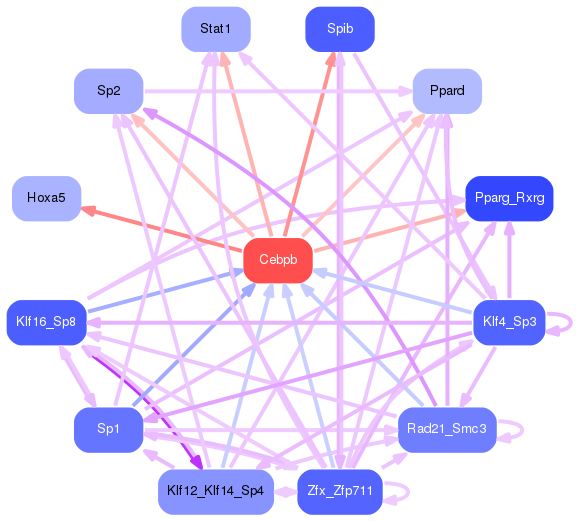
Network of associatons between targets according to the STRING database.

First level regulatory network of Cebpb
Gene Ontology Analysis
Gene overrepresentation in biological process category:
| Log-likelihood per target | Total log-likelihood | Term | Description |
|---|---|---|---|
| 42.1 | 126.2 | GO:2001201 | calcium-independent cell-matrix adhesion(GO:0007161) interaction with other organism via secreted substance involved in symbiotic interaction(GO:0052047) regulation of transforming growth factor-beta secretion(GO:2001201) |
| 39.7 | 436.5 | GO:0072378 | blood coagulation, fibrin clot formation(GO:0072378) |
| 34.5 | 103.6 | GO:0046865 | isoprenoid transport(GO:0046864) terpenoid transport(GO:0046865) |
| 31.4 | 157.2 | GO:0071400 | cellular response to oleic acid(GO:0071400) |
| 27.3 | 109.1 | GO:0070447 | positive regulation of oligodendrocyte progenitor proliferation(GO:0070447) ferrous iron import into cell(GO:0097460) ferrous iron import across plasma membrane(GO:0098707) |
| 23.9 | 71.8 | GO:0010747 | positive regulation of plasma membrane long-chain fatty acid transport(GO:0010747) |
| 23.9 | 71.7 | GO:0006713 | glucocorticoid catabolic process(GO:0006713) |
| 22.3 | 66.9 | GO:0060764 | cell-cell signaling involved in mammary gland development(GO:0060764) |
| 21.2 | 63.7 | GO:2000661 | positive regulation of interleukin-1-mediated signaling pathway(GO:2000661) |
| 19.4 | 96.9 | GO:0050828 | regulation of liquid surface tension(GO:0050828) |
| 18.1 | 90.7 | GO:0006556 | S-adenosylmethionine biosynthetic process(GO:0006556) |
| 17.8 | 53.5 | GO:0055073 | cadmium ion homeostasis(GO:0055073) |
| 15.6 | 46.9 | GO:0002488 | antigen processing and presentation of endogenous peptide antigen via MHC class Ib via ER pathway(GO:0002488) antigen processing and presentation of endogenous peptide antigen via MHC class Ib via ER pathway, TAP-dependent(GO:0002489) TRAIL production(GO:0032639) regulation of TRAIL production(GO:0032679) positive regulation of TRAIL production(GO:0032759) |
| 15.4 | 46.3 | GO:0060559 | positive regulation of vitamin metabolic process(GO:0046136) positive regulation of vitamin D biosynthetic process(GO:0060557) positive regulation of calcidiol 1-monooxygenase activity(GO:0060559) |
| 15.2 | 121.4 | GO:0015679 | plasma membrane copper ion transport(GO:0015679) |
| 14.6 | 72.8 | GO:0015801 | aromatic amino acid transport(GO:0015801) |
| 14.2 | 85.0 | GO:0045329 | carnitine biosynthetic process(GO:0045329) |
| 13.9 | 83.3 | GO:0071279 | cellular response to cobalt ion(GO:0071279) |
| 13.8 | 41.3 | GO:0015920 | lipopolysaccharide transport(GO:0015920) |
| 13.6 | 149.1 | GO:0006957 | complement activation, alternative pathway(GO:0006957) |
| 13.3 | 39.9 | GO:0006788 | heme oxidation(GO:0006788) |
| 12.4 | 62.1 | GO:0010533 | regulation of activation of Janus kinase activity(GO:0010533) ciliary neurotrophic factor-mediated signaling pathway(GO:0070120) |
| 12.3 | 73.8 | GO:0042908 | xenobiotic transport(GO:0042908) |
| 12.2 | 36.7 | GO:0072592 | oxygen metabolic process(GO:0072592) |
| 11.7 | 58.5 | GO:1904640 | response to methionine(GO:1904640) |
| 11.7 | 58.3 | GO:0009115 | xanthine catabolic process(GO:0009115) |
| 11.0 | 22.0 | GO:0042167 | porphyrin-containing compound catabolic process(GO:0006787) tetrapyrrole catabolic process(GO:0033015) heme catabolic process(GO:0042167) pigment catabolic process(GO:0046149) |
| 10.4 | 94.0 | GO:0060763 | mammary duct terminal end bud growth(GO:0060763) |
| 9.9 | 39.5 | GO:0060414 | aorta smooth muscle tissue morphogenesis(GO:0060414) |
| 9.7 | 38.9 | GO:0007084 | mitotic nuclear envelope reassembly(GO:0007084) |
| 9.7 | 212.7 | GO:0030502 | negative regulation of bone mineralization(GO:0030502) |
| 9.6 | 28.8 | GO:0002432 | granuloma formation(GO:0002432) |
| 9.3 | 64.9 | GO:0048251 | elastic fiber assembly(GO:0048251) |
| 8.7 | 26.1 | GO:0035606 | peptidyl-cysteine S-trans-nitrosylation(GO:0035606) |
| 8.3 | 33.3 | GO:1903575 | cornified envelope assembly(GO:1903575) |
| 7.3 | 66.0 | GO:0070327 | thyroid hormone transport(GO:0070327) |
| 6.6 | 19.7 | GO:1901740 | negative regulation of myoblast fusion(GO:1901740) |
| 6.5 | 71.8 | GO:0006777 | Mo-molybdopterin cofactor biosynthetic process(GO:0006777) Mo-molybdopterin cofactor metabolic process(GO:0019720) |
| 6.0 | 29.9 | GO:0002636 | positive regulation of germinal center formation(GO:0002636) |
| 6.0 | 53.7 | GO:0052697 | xenobiotic glucuronidation(GO:0052697) |
| 5.6 | 22.3 | GO:0045658 | regulation of neutrophil differentiation(GO:0045658) |
| 5.5 | 55.0 | GO:0001554 | luteolysis(GO:0001554) |
| 5.5 | 22.0 | GO:2001295 | malonyl-CoA biosynthetic process(GO:2001295) |
| 5.4 | 92.2 | GO:0060391 | positive regulation of SMAD protein import into nucleus(GO:0060391) |
| 5.1 | 20.3 | GO:0045410 | positive regulation of interleukin-6 biosynthetic process(GO:0045410) |
| 4.7 | 37.4 | GO:0070508 | sterol import(GO:0035376) cholesterol import(GO:0070508) |
| 4.4 | 65.3 | GO:0045717 | negative regulation of fatty acid biosynthetic process(GO:0045717) |
| 4.3 | 13.0 | GO:0000715 | nucleotide-excision repair, DNA damage recognition(GO:0000715) |
| 4.2 | 67.7 | GO:0050746 | regulation of lipoprotein metabolic process(GO:0050746) |
| 4.2 | 58.8 | GO:0001867 | complement activation, lectin pathway(GO:0001867) |
| 4.2 | 12.6 | GO:1901558 | response to metformin(GO:1901558) negative regulation of pancreatic stellate cell proliferation(GO:2000230) |
| 4.1 | 33.0 | GO:0090086 | negative regulation of protein deubiquitination(GO:0090086) |
| 4.0 | 35.8 | GO:0071726 | response to diacyl bacterial lipopeptide(GO:0071724) cellular response to diacyl bacterial lipopeptide(GO:0071726) |
| 3.8 | 15.2 | GO:0060390 | regulation of SMAD protein import into nucleus(GO:0060390) |
| 3.8 | 30.1 | GO:0006545 | glycine biosynthetic process(GO:0006545) |
| 3.6 | 43.6 | GO:0046485 | ether lipid metabolic process(GO:0046485) |
| 3.2 | 44.2 | GO:0015937 | coenzyme A biosynthetic process(GO:0015937) |
| 3.1 | 12.3 | GO:0034240 | negative regulation of macrophage fusion(GO:0034240) |
| 2.9 | 25.8 | GO:2000002 | histone H3-K14 acetylation(GO:0044154) negative regulation of DNA damage checkpoint(GO:2000002) |
| 2.8 | 11.2 | GO:0006933 | negative regulation of cell adhesion involved in substrate-bound cell migration(GO:0006933) |
| 2.7 | 16.3 | GO:1904674 | positive regulation of somatic stem cell population maintenance(GO:1904674) |
| 2.7 | 21.3 | GO:0001514 | selenocysteine incorporation(GO:0001514) translational readthrough(GO:0006451) |
| 2.5 | 46.9 | GO:0043306 | positive regulation of mast cell activation involved in immune response(GO:0033008) positive regulation of mast cell degranulation(GO:0043306) |
| 2.4 | 14.6 | GO:0071418 | protein-cofactor linkage(GO:0018065) cellular response to amine stimulus(GO:0071418) |
| 2.3 | 11.3 | GO:1903071 | positive regulation of ER-associated ubiquitin-dependent protein catabolic process(GO:1903071) |
| 2.2 | 8.7 | GO:0070560 | protein secretion by platelet(GO:0070560) |
| 2.0 | 18.0 | GO:0046642 | negative regulation of alpha-beta T cell proliferation(GO:0046642) |
| 1.8 | 21.3 | GO:0071027 | nuclear RNA surveillance(GO:0071027) nuclear mRNA surveillance(GO:0071028) |
| 1.7 | 13.9 | GO:0033031 | positive regulation of neutrophil apoptotic process(GO:0033031) |
| 1.6 | 36.0 | GO:1903846 | positive regulation of transforming growth factor beta receptor signaling pathway(GO:0030511) positive regulation of cellular response to transforming growth factor beta stimulus(GO:1903846) |
| 1.5 | 9.2 | GO:0090367 | negative regulation of mRNA modification(GO:0090367) |
| 1.5 | 13.8 | GO:2000675 | negative regulation of type B pancreatic cell apoptotic process(GO:2000675) |
| 1.4 | 7.1 | GO:0071224 | cellular response to peptidoglycan(GO:0071224) |
| 1.4 | 44.6 | GO:0006767 | water-soluble vitamin metabolic process(GO:0006767) |
| 1.3 | 13.2 | GO:0035021 | negative regulation of Rac protein signal transduction(GO:0035021) |
| 1.3 | 52.6 | GO:0030199 | collagen fibril organization(GO:0030199) |
| 1.3 | 5.2 | GO:0006419 | alanyl-tRNA aminoacylation(GO:0006419) |
| 1.1 | 30.7 | GO:0046856 | phosphatidylinositol dephosphorylation(GO:0046856) |
| 1.1 | 153.3 | GO:0090501 | RNA phosphodiester bond hydrolysis(GO:0090501) |
| 0.9 | 27.8 | GO:0030225 | macrophage differentiation(GO:0030225) |
| 0.9 | 109.2 | GO:0031638 | zymogen activation(GO:0031638) |
| 0.8 | 13.5 | GO:0043517 | positive regulation of DNA damage response, signal transduction by p53 class mediator(GO:0043517) |
| 0.8 | 9.9 | GO:0016540 | protein autoprocessing(GO:0016540) |
| 0.7 | 30.6 | GO:0050912 | detection of chemical stimulus involved in sensory perception of taste(GO:0050912) |
| 0.7 | 13.3 | GO:0030574 | collagen catabolic process(GO:0030574) |
| 0.7 | 27.0 | GO:0002474 | antigen processing and presentation of peptide antigen via MHC class I(GO:0002474) |
| 0.6 | 3.1 | GO:1990928 | response to amino acid starvation(GO:1990928) |
| 0.6 | 4.1 | GO:2000254 | regulation of male germ cell proliferation(GO:2000254) |
| 0.5 | 13.0 | GO:0006376 | mRNA splice site selection(GO:0006376) |
| 0.5 | 12.9 | GO:0030970 | retrograde protein transport, ER to cytosol(GO:0030970) |
| 0.4 | 3.6 | GO:0006776 | vitamin A metabolic process(GO:0006776) |
| 0.4 | 0.4 | GO:0060585 | regulation of prostaglandin-endoperoxide synthase activity(GO:0060584) positive regulation of prostaglandin-endoperoxide synthase activity(GO:0060585) |
| 0.4 | 12.4 | GO:0045332 | phospholipid translocation(GO:0045332) |
| 0.4 | 48.0 | GO:0055088 | lipid homeostasis(GO:0055088) |
| 0.4 | 17.4 | GO:0016925 | protein sumoylation(GO:0016925) |
| 0.4 | 10.9 | GO:0019373 | epoxygenase P450 pathway(GO:0019373) |
| 0.4 | 9.3 | GO:0000470 | maturation of LSU-rRNA(GO:0000470) |
| 0.4 | 10.1 | GO:0050819 | negative regulation of coagulation(GO:0050819) |
| 0.4 | 1.6 | GO:0006428 | isoleucyl-tRNA aminoacylation(GO:0006428) |
| 0.3 | 7.4 | GO:0032274 | gonadotropin secretion(GO:0032274) |
| 0.3 | 33.0 | GO:0035690 | cellular response to drug(GO:0035690) |
| 0.3 | 6.4 | GO:0061099 | negative regulation of protein tyrosine kinase activity(GO:0061099) |
| 0.3 | 7.2 | GO:0097186 | amelogenesis(GO:0097186) |
| 0.3 | 3.3 | GO:0032096 | negative regulation of response to food(GO:0032096) |
| 0.3 | 14.1 | GO:0001954 | positive regulation of cell-matrix adhesion(GO:0001954) |
| 0.3 | 1.5 | GO:0035609 | C-terminal protein deglutamylation(GO:0035609) |
| 0.3 | 16.1 | GO:0070373 | negative regulation of ERK1 and ERK2 cascade(GO:0070373) |
| 0.2 | 34.4 | GO:0007156 | homophilic cell adhesion via plasma membrane adhesion molecules(GO:0007156) |
| 0.2 | 24.6 | GO:0050728 | negative regulation of inflammatory response(GO:0050728) |
| 0.2 | 15.4 | GO:0008630 | intrinsic apoptotic signaling pathway in response to DNA damage(GO:0008630) |
| 0.1 | 2.3 | GO:0006120 | mitochondrial electron transport, NADH to ubiquinone(GO:0006120) |
| 0.1 | 11.1 | GO:0045727 | positive regulation of translation(GO:0045727) |
| 0.1 | 2.7 | GO:1903959 | regulation of anion transmembrane transport(GO:1903959) |
| 0.1 | 19.8 | GO:0016042 | lipid catabolic process(GO:0016042) |
| 0.1 | 3.0 | GO:0002181 | cytoplasmic translation(GO:0002181) |
| 0.1 | 2.1 | GO:0070286 | axonemal dynein complex assembly(GO:0070286) |
| 0.1 | 3.4 | GO:0031338 | regulation of vesicle fusion(GO:0031338) |
| 0.1 | 1.8 | GO:0070207 | protein homotrimerization(GO:0070207) |
| 0.0 | 13.4 | GO:0006397 | mRNA processing(GO:0006397) |
Gene overrepresentation in cellular component category:
| Log-likelihood per target | Total log-likelihood | Term | Description |
|---|---|---|---|
| 56.2 | 449.2 | GO:0005577 | fibrinogen complex(GO:0005577) |
| 37.3 | 149.1 | GO:0044218 | other organism cell membrane(GO:0044218) other organism membrane(GO:0044279) |
| 20.7 | 62.1 | GO:0005896 | interleukin-6 receptor complex(GO:0005896) ciliary neurotrophic factor receptor complex(GO:0070110) |
| 18.2 | 109.1 | GO:1990712 | HFE-transferrin receptor complex(GO:1990712) |
| 17.8 | 53.5 | GO:0070821 | tertiary granule membrane(GO:0070821) |
| 16.2 | 64.9 | GO:0071953 | elastic fiber(GO:0071953) |
| 15.6 | 46.9 | GO:0032398 | MHC class Ib protein complex(GO:0032398) |
| 10.4 | 83.3 | GO:0043203 | axon hillock(GO:0043203) |
| 8.7 | 113.5 | GO:0042627 | chylomicron(GO:0042627) |
| 7.2 | 35.8 | GO:0046696 | lipopolysaccharide receptor complex(GO:0046696) |
| 6.9 | 96.9 | GO:0097208 | alveolar lamellar body(GO:0097208) |
| 6.0 | 30.1 | GO:0070552 | BRISC complex(GO:0070552) |
| 4.8 | 28.8 | GO:0033093 | Weibel-Palade body(GO:0033093) |
| 4.3 | 13.0 | GO:0071942 | XPC complex(GO:0071942) |
| 4.2 | 92.2 | GO:0005685 | U1 snRNP(GO:0005685) |
| 3.8 | 11.3 | GO:1990037 | Lewy body core(GO:1990037) |
| 3.3 | 168.4 | GO:0009295 | nucleoid(GO:0009295) mitochondrial nucleoid(GO:0042645) |
| 2.9 | 338.0 | GO:0072562 | blood microparticle(GO:0072562) |
| 2.9 | 25.8 | GO:0008024 | cyclin/CDK positive transcription elongation factor complex(GO:0008024) |
| 2.3 | 27.0 | GO:0042612 | MHC class I protein complex(GO:0042612) |
| 1.5 | 118.2 | GO:0005788 | endoplasmic reticulum lumen(GO:0005788) |
| 1.2 | 53.7 | GO:0016235 | aggresome(GO:0016235) |
| 1.2 | 17.4 | GO:0035102 | PRC1 complex(GO:0035102) |
| 1.2 | 9.2 | GO:0071204 | CRD-mediated mRNA stability complex(GO:0070937) histone pre-mRNA 3'end processing complex(GO:0071204) GAIT complex(GO:0097452) |
| 0.9 | 58.3 | GO:0016529 | sarcoplasmic reticulum(GO:0016529) |
| 0.9 | 39.5 | GO:0032154 | cleavage furrow(GO:0032154) cell surface furrow(GO:0097610) |
| 0.8 | 14.1 | GO:0070938 | contractile ring(GO:0070938) |
| 0.8 | 198.3 | GO:0016323 | basolateral plasma membrane(GO:0016323) |
| 0.8 | 19.4 | GO:0032281 | AMPA glutamate receptor complex(GO:0032281) |
| 0.7 | 44.2 | GO:0030118 | clathrin coat(GO:0030118) |
| 0.7 | 54.7 | GO:0045095 | keratin filament(GO:0045095) |
| 0.7 | 51.5 | GO:0005882 | intermediate filament(GO:0005882) |
| 0.7 | 957.0 | GO:0005615 | extracellular space(GO:0005615) |
| 0.7 | 68.6 | GO:0016363 | nuclear matrix(GO:0016363) |
| 0.6 | 40.2 | GO:0005811 | lipid particle(GO:0005811) |
| 0.6 | 32.3 | GO:0031526 | brush border membrane(GO:0031526) |
| 0.5 | 71.8 | GO:0005741 | mitochondrial outer membrane(GO:0005741) |
| 0.5 | 3.1 | GO:0031931 | TORC1 complex(GO:0031931) |
| 0.4 | 20.2 | GO:0008023 | transcription elongation factor complex(GO:0008023) |
| 0.3 | 13.0 | GO:0010494 | cytoplasmic stress granule(GO:0010494) |
| 0.3 | 83.7 | GO:0031965 | nuclear membrane(GO:0031965) |
| 0.2 | 30.6 | GO:0030139 | endocytic vesicle(GO:0030139) |
| 0.2 | 11.1 | GO:0005844 | polysome(GO:0005844) |
| 0.2 | 12.0 | GO:0019005 | SCF ubiquitin ligase complex(GO:0019005) |
| 0.2 | 14.9 | GO:0005923 | bicellular tight junction(GO:0005923) |
| 0.1 | 12.3 | GO:0022625 | cytosolic large ribosomal subunit(GO:0022625) |
| 0.1 | 46.2 | GO:0005667 | transcription factor complex(GO:0005667) |
| 0.1 | 21.3 | GO:0009897 | external side of plasma membrane(GO:0009897) |
| 0.1 | 29.0 | GO:0005925 | focal adhesion(GO:0005925) |
| 0.1 | 51.1 | GO:0005789 | endoplasmic reticulum membrane(GO:0005789) |
| 0.1 | 3.6 | GO:0032587 | ruffle membrane(GO:0032587) |
| 0.0 | 39.3 | GO:0005739 | mitochondrion(GO:0005739) |
| 0.0 | 7.0 | GO:0005768 | endosome(GO:0005768) |
Gene overrepresentation in molecular function category:
| Log-likelihood per target | Total log-likelihood | Term | Description |
|---|---|---|---|
| 39.5 | 157.8 | GO:0030294 | receptor signaling protein tyrosine kinase inhibitor activity(GO:0030294) |
| 37.9 | 113.5 | GO:0060230 | lipoprotein lipase activator activity(GO:0060230) |
| 30.2 | 90.7 | GO:0004478 | methionine adenosyltransferase activity(GO:0004478) |
| 23.9 | 71.7 | GO:0003845 | 11-beta-hydroxysteroid dehydrogenase [NAD(P)] activity(GO:0003845) |
| 23.1 | 92.2 | GO:0035614 | snRNA stem-loop binding(GO:0035614) |
| 22.8 | 137.1 | GO:0005499 | vitamin D binding(GO:0005499) |
| 21.2 | 63.7 | GO:0004909 | interleukin-1, Type I, activating receptor activity(GO:0004909) |
| 20.2 | 121.4 | GO:0004322 | ferroxidase activity(GO:0004322) oxidoreductase activity, oxidizing metal ions, oxygen as acceptor(GO:0016724) |
| 18.0 | 126.2 | GO:0045340 | mercury ion binding(GO:0045340) |
| 17.9 | 71.8 | GO:0008265 | Mo-molybdopterin cofactor sulfurase activity(GO:0008265) |
| 17.3 | 138.8 | GO:0015349 | thyroid hormone transmembrane transporter activity(GO:0015349) |
| 15.5 | 62.1 | GO:0004897 | ciliary neurotrophic factor receptor activity(GO:0004897) |
| 15.4 | 77.0 | GO:0070891 | lipoteichoic acid binding(GO:0070891) |
| 15.1 | 45.3 | GO:0004698 | calcium-dependent protein kinase C activity(GO:0004698) |
| 13.6 | 109.1 | GO:1990459 | transferrin receptor binding(GO:1990459) |
| 13.3 | 39.9 | GO:0004392 | heme oxygenase (decyclizing) activity(GO:0004392) |
| 13.1 | 157.2 | GO:0016884 | carbon-nitrogen ligase activity, with glutamine as amido-N-donor(GO:0016884) |
| 11.7 | 58.3 | GO:0004854 | xanthine dehydrogenase activity(GO:0004854) oxidoreductase activity, acting on CH or CH2 groups, NAD or NADP as acceptor(GO:0016726) |
| 11.1 | 44.2 | GO:0004594 | pantothenate kinase activity(GO:0004594) |
| 10.0 | 30.1 | GO:0008732 | threonine aldolase activity(GO:0004793) L-allo-threonine aldolase activity(GO:0008732) |
| 9.9 | 39.5 | GO:0004687 | myosin light chain kinase activity(GO:0004687) |
| 8.9 | 53.7 | GO:0034988 | Fc-gamma receptor I complex binding(GO:0034988) |
| 8.6 | 25.8 | GO:0034211 | GTP-dependent protein kinase activity(GO:0034211) |
| 8.2 | 73.8 | GO:0008559 | xenobiotic-transporting ATPase activity(GO:0008559) |
| 7.8 | 46.9 | GO:0030881 | beta-2-microglobulin binding(GO:0030881) |
| 6.5 | 19.4 | GO:0043812 | phosphatidylinositol-4-phosphate phosphatase activity(GO:0043812) |
| 6.2 | 81.1 | GO:0019841 | retinol binding(GO:0019841) |
| 6.2 | 43.6 | GO:0016714 | oxidoreductase activity, acting on paired donors, with incorporation or reduction of molecular oxygen, reduced pteridine as one donor, and incorporation of one atom of oxygen(GO:0016714) |
| 6.0 | 71.8 | GO:0102391 | decanoate--CoA ligase activity(GO:0102391) |
| 5.5 | 22.0 | GO:0003989 | acetyl-CoA carboxylase activity(GO:0003989) |
| 5.4 | 53.5 | GO:0005384 | manganese ion transmembrane transporter activity(GO:0005384) |
| 4.9 | 14.6 | GO:0004852 | uroporphyrinogen-III synthase activity(GO:0004852) |
| 4.7 | 37.4 | GO:0032052 | bile acid binding(GO:0032052) |
| 4.6 | 87.6 | GO:0055106 | ubiquitin-protein transferase regulator activity(GO:0055106) |
| 4.4 | 26.1 | GO:0035662 | Toll-like receptor 4 binding(GO:0035662) |
| 4.3 | 13.0 | GO:0001069 | regulatory region RNA binding(GO:0001069) |
| 3.5 | 66.0 | GO:0005149 | interleukin-1 receptor binding(GO:0005149) |
| 3.1 | 36.7 | GO:0004499 | N,N-dimethylaniline monooxygenase activity(GO:0004499) |
| 2.6 | 15.4 | GO:0042030 | ATPase inhibitor activity(GO:0042030) |
| 2.4 | 7.3 | GO:0071791 | chemokine (C-C motif) ligand 5 binding(GO:0071791) |
| 2.4 | 318.0 | GO:0030674 | protein binding, bridging(GO:0030674) |
| 2.4 | 7.2 | GO:0051916 | granulocyte colony-stimulating factor binding(GO:0051916) |
| 2.2 | 11.2 | GO:0043532 | angiostatin binding(GO:0043532) |
| 2.2 | 110.1 | GO:0016712 | oxidoreductase activity, acting on paired donors, with incorporation or reduction of molecular oxygen, reduced flavin or flavoprotein as one donor, and incorporation of one atom of oxygen(GO:0016712) |
| 1.9 | 58.5 | GO:0005104 | fibroblast growth factor receptor binding(GO:0005104) |
| 1.8 | 12.6 | GO:0050692 | DBD domain binding(GO:0050692) |
| 1.8 | 21.3 | GO:0008409 | 5'-3' exonuclease activity(GO:0008409) |
| 1.7 | 53.7 | GO:0015020 | glucuronosyltransferase activity(GO:0015020) |
| 1.6 | 11.3 | GO:0004439 | phosphatidylinositol-4,5-bisphosphate 5-phosphatase activity(GO:0004439) |
| 1.5 | 94.0 | GO:0030971 | receptor tyrosine kinase binding(GO:0030971) |
| 1.4 | 12.9 | GO:0046790 | virion binding(GO:0046790) |
| 1.4 | 155.8 | GO:0004540 | ribonuclease activity(GO:0004540) |
| 1.3 | 5.2 | GO:0019862 | IgA binding(GO:0019862) |
| 1.3 | 5.2 | GO:0004813 | alanine-tRNA ligase activity(GO:0004813) |
| 1.3 | 64.6 | GO:0016706 | oxidoreductase activity, acting on paired donors, with incorporation or reduction of molecular oxygen, 2-oxoglutarate as one donor, and incorporation of one atom each of oxygen into both donors(GO:0016706) |
| 1.2 | 32.3 | GO:0005328 | neurotransmitter:sodium symporter activity(GO:0005328) |
| 1.1 | 12.3 | GO:0031730 | CCR5 chemokine receptor binding(GO:0031730) |
| 1.1 | 30.6 | GO:0008527 | taste receptor activity(GO:0008527) |
| 1.0 | 13.5 | GO:0031432 | titin binding(GO:0031432) |
| 1.0 | 17.4 | GO:0019789 | SUMO transferase activity(GO:0019789) |
| 0.9 | 152.5 | GO:0052689 | carboxylic ester hydrolase activity(GO:0052689) |
| 0.8 | 22.0 | GO:0016628 | oxidoreductase activity, acting on the CH-CH group of donors, NAD or NADP as acceptor(GO:0016628) |
| 0.8 | 4.9 | GO:0004616 | phosphogluconate dehydrogenase (decarboxylating) activity(GO:0004616) |
| 0.8 | 178.6 | GO:0004252 | serine-type endopeptidase activity(GO:0004252) |
| 0.8 | 89.0 | GO:0004867 | serine-type endopeptidase inhibitor activity(GO:0004867) |
| 0.8 | 29.9 | GO:0005164 | tumor necrosis factor receptor binding(GO:0005164) |
| 0.7 | 9.2 | GO:0008143 | poly(A) binding(GO:0008143) |
| 0.7 | 14.1 | GO:0017166 | vinculin binding(GO:0017166) |
| 0.7 | 12.4 | GO:0004012 | phospholipid-translocating ATPase activity(GO:0004012) |
| 0.7 | 27.8 | GO:0001205 | transcriptional activator activity, RNA polymerase II distal enhancer sequence-specific binding(GO:0001205) |
| 0.6 | 36.0 | GO:0005160 | transforming growth factor beta receptor binding(GO:0005160) |
| 0.6 | 20.3 | GO:0005154 | epidermal growth factor receptor binding(GO:0005154) |
| 0.5 | 47.2 | GO:0005178 | integrin binding(GO:0005178) |
| 0.4 | 64.2 | GO:0005179 | hormone activity(GO:0005179) |
| 0.4 | 8.7 | GO:0001614 | purinergic nucleotide receptor activity(GO:0001614) nucleotide receptor activity(GO:0016502) |
| 0.4 | 9.9 | GO:0004190 | aspartic-type endopeptidase activity(GO:0004190) |
| 0.4 | 8.7 | GO:0043325 | phosphatidylinositol-3,4-bisphosphate binding(GO:0043325) |
| 0.4 | 27.9 | GO:0016811 | hydrolase activity, acting on carbon-nitrogen (but not peptide) bonds, in linear amides(GO:0016811) |
| 0.3 | 3.1 | GO:0008494 | translation activator activity(GO:0008494) |
| 0.3 | 34.4 | GO:0004222 | metalloendopeptidase activity(GO:0004222) |
| 0.3 | 14.6 | GO:0000049 | tRNA binding(GO:0000049) |
| 0.3 | 13.0 | GO:0031593 | polyubiquitin binding(GO:0031593) |
| 0.2 | 13.8 | GO:0004869 | cysteine-type endopeptidase inhibitor activity(GO:0004869) |
| 0.2 | 59.1 | GO:0030246 | carbohydrate binding(GO:0030246) |
| 0.2 | 3.6 | GO:0036041 | long-chain fatty acid binding(GO:0036041) |
| 0.2 | 32.2 | GO:0017137 | Rab GTPase binding(GO:0017137) |
| 0.2 | 120.3 | GO:0005198 | structural molecule activity(GO:0005198) |
| 0.1 | 2.7 | GO:0005247 | voltage-gated chloride channel activity(GO:0005247) |
| 0.1 | 11.3 | GO:0044325 | ion channel binding(GO:0044325) |
| 0.1 | 3.7 | GO:0043621 | protein self-association(GO:0043621) |
| 0.1 | 13.7 | GO:0061630 | ubiquitin protein ligase activity(GO:0061630) ubiquitin-like protein ligase activity(GO:0061659) |
| 0.1 | 1.5 | GO:0004181 | metallocarboxypeptidase activity(GO:0004181) |
| 0.1 | 12.0 | GO:0004842 | ubiquitin-protein transferase activity(GO:0004842) |
| 0.0 | 2.2 | GO:0005518 | collagen binding(GO:0005518) |
| 0.0 | 5.2 | GO:0003713 | transcription coactivator activity(GO:0003713) |
| 0.0 | 1.1 | GO:0042826 | histone deacetylase binding(GO:0042826) |
Gene overrepresentation in curated gene sets: canonical pathways category:
| Log-likelihood per target | Total log-likelihood | Term | Description |
|---|---|---|---|
| 10.4 | 323.0 | PID INTEGRIN2 PATHWAY | Beta2 integrin cell surface interactions |
| 8.4 | 126.2 | PID INTEGRIN5 PATHWAY | Beta5 beta6 beta7 and beta8 integrin cell surface interactions |
| 6.0 | 108.4 | SA MMP CYTOKINE CONNECTION | Cytokines can induce activation of matrix metalloproteinases, which degrade extracellular matrix. |
| 4.2 | 109.1 | ST WNT CA2 CYCLIC GMP PATHWAY | Wnt/Ca2+/cyclic GMP signaling. |
| 3.5 | 147.7 | PID AMB2 NEUTROPHILS PATHWAY | amb2 Integrin signaling |
| 2.9 | 157.8 | PID BMP PATHWAY | BMP receptor signaling |
| 2.8 | 61.9 | PID TOLL ENDOGENOUS PATHWAY | Endogenous TLR signaling |
| 2.2 | 161.4 | PID HIF1 TFPATHWAY | HIF-1-alpha transcription factor network |
| 1.8 | 7.1 | ST PAC1 RECEPTOR PATHWAY | PAC1 Receptor Pathway |
| 1.3 | 63.7 | ST JNK MAPK PATHWAY | JNK MAPK Pathway |
| 1.3 | 296.4 | NABA ECM REGULATORS | Genes encoding enzymes and their regulators involved in the remodeling of the extracellular matrix |
| 1.1 | 20.3 | PID ERBB NETWORK PATHWAY | ErbB receptor signaling network |
| 0.9 | 12.3 | ST INTERFERON GAMMA PATHWAY | Interferon gamma pathway. |
| 0.9 | 50.6 | SIG CHEMOTAXIS | Genes related to chemotaxis |
| 0.9 | 263.5 | NABA SECRETED FACTORS | Genes encoding secreted soluble factors |
| 0.7 | 136.6 | NABA ECM GLYCOPROTEINS | Genes encoding structural ECM glycoproteins |
| 0.6 | 96.9 | NABA ECM AFFILIATED | Genes encoding proteins affiliated structurally or functionally to extracellular matrix proteins |
| 0.6 | 25.8 | SIG INSULIN RECEPTOR PATHWAY IN CARDIAC MYOCYTES | Genes related to the insulin receptor pathway |
| 0.6 | 42.2 | PID MYC REPRESS PATHWAY | Validated targets of C-MYC transcriptional repression |
| 0.5 | 29.9 | PID RB 1PATHWAY | Regulation of retinoblastoma protein |
| 0.2 | 1.6 | ST PHOSPHOINOSITIDE 3 KINASE PATHWAY | PI3K Pathway |
| 0.1 | 3.6 | PID PS1 PATHWAY | Presenilin action in Notch and Wnt signaling |
| 0.0 | 0.7 | PID IL6 7 PATHWAY | IL6-mediated signaling events |
Gene overrepresentation in curated gene sets: REACTOME pathways category:
| Log-likelihood per target | Total log-likelihood | Term | Description |
|---|---|---|---|
| 25.0 | 449.2 | REACTOME P130CAS LINKAGE TO MAPK SIGNALING FOR INTEGRINS | Genes involved in p130Cas linkage to MAPK signaling for integrins |
| 12.4 | 123.6 | REACTOME GAMMA CARBOXYLATION TRANSPORT AND AMINO TERMINAL CLEAVAGE OF PROTEINS | Genes involved in Gamma-carboxylation, transport, and amino-terminal cleavage of proteins |
| 8.2 | 65.3 | REACTOME NEGATIVE REGULATION OF THE PI3K AKT NETWORK | Genes involved in Negative regulation of the PI3K/AKT network |
| 6.1 | 73.8 | REACTOME RECYCLING OF BILE ACIDS AND SALTS | Genes involved in Recycling of bile acids and salts |
| 6.1 | 270.4 | REACTOME IRON UPTAKE AND TRANSPORT | Genes involved in Iron uptake and transport |
| 6.1 | 207.9 | REACTOME COMPLEMENT CASCADE | Genes involved in Complement cascade |
| 6.1 | 60.7 | REACTOME LATENT INFECTION OF HOMO SAPIENS WITH MYCOBACTERIUM TUBERCULOSIS | Genes involved in Latent infection of Homo sapiens with Mycobacterium tuberculosis |
| 5.8 | 58.3 | REACTOME PURINE CATABOLISM | Genes involved in Purine catabolism |
| 5.7 | 74.4 | REACTOME IL 6 SIGNALING | Genes involved in Interleukin-6 signaling |
| 4.0 | 71.8 | REACTOME SYNTHESIS OF VERY LONG CHAIN FATTY ACYL COAS | Genes involved in Synthesis of very long-chain fatty acyl-CoAs |
| 4.0 | 35.8 | REACTOME IKK COMPLEX RECRUITMENT MEDIATED BY RIP1 | Genes involved in IKK complex recruitment mediated by RIP1 |
| 3.4 | 44.2 | REACTOME VITAMIN B5 PANTOTHENATE METABOLISM | Genes involved in Vitamin B5 (pantothenate) metabolism |
| 2.8 | 53.7 | REACTOME GLUCURONIDATION | Genes involved in Glucuronidation |
| 2.6 | 36.6 | REACTOME METABOLISM OF PORPHYRINS | Genes involved in Metabolism of porphyrins |
| 2.6 | 53.7 | REACTOME PLATELET SENSITIZATION BY LDL | Genes involved in Platelet sensitization by LDL |
| 2.5 | 83.9 | REACTOME STEROID HORMONES | Genes involved in Steroid hormones |
| 2.5 | 73.1 | REACTOME SULFUR AMINO ACID METABOLISM | Genes involved in Sulfur amino acid metabolism |
| 2.5 | 34.4 | REACTOME APOPTOTIC CLEAVAGE OF CELL ADHESION PROTEINS | Genes involved in Apoptotic cleavage of cell adhesion proteins |
| 1.7 | 73.9 | REACTOME IL1 SIGNALING | Genes involved in Interleukin-1 signaling |
| 1.6 | 53.5 | REACTOME TIGHT JUNCTION INTERACTIONS | Genes involved in Tight junction interactions |
| 1.5 | 39.5 | REACTOME SMOOTH MUSCLE CONTRACTION | Genes involved in Smooth Muscle Contraction |
| 1.5 | 71.8 | REACTOME METABOLISM OF VITAMINS AND COFACTORS | Genes involved in Metabolism of vitamins and cofactors |
| 1.4 | 32.3 | REACTOME NA CL DEPENDENT NEUROTRANSMITTER TRANSPORTERS | Genes involved in Na+/Cl- dependent neurotransmitter transporters |
| 1.3 | 12.9 | REACTOME TRAFFICKING AND PROCESSING OF ENDOSOMAL TLR | Genes involved in Trafficking and processing of endosomal TLR |
| 1.1 | 22.0 | REACTOME ACTIVATED AMPK STIMULATES FATTY ACID OXIDATION IN MUSCLE | Genes involved in Activated AMPK stimulates fatty-acid oxidation in muscle |
| 1.1 | 52.6 | REACTOME CHEMOKINE RECEPTORS BIND CHEMOKINES | Genes involved in Chemokine receptors bind chemokines |
| 1.0 | 182.1 | REACTOME METABOLISM OF AMINO ACIDS AND DERIVATIVES | Genes involved in Metabolism of amino acids and derivatives |
| 1.0 | 19.4 | REACTOME SYNTHESIS OF PIPS AT THE GOLGI MEMBRANE | Genes involved in Synthesis of PIPs at the Golgi membrane |
| 1.0 | 74.9 | REACTOME TOLL RECEPTOR CASCADES | Genes involved in Toll Receptor Cascades |
| 1.0 | 20.3 | REACTOME SHC1 EVENTS IN ERBB4 SIGNALING | Genes involved in SHC1 events in ERBB4 signaling |
| 0.8 | 15.2 | REACTOME SIGNALING BY HIPPO | Genes involved in Signaling by Hippo |
| 0.7 | 11.2 | REACTOME FORMATION OF ATP BY CHEMIOSMOTIC COUPLING | Genes involved in Formation of ATP by chemiosmotic coupling |
| 0.6 | 13.0 | REACTOME FORMATION OF INCISION COMPLEX IN GG NER | Genes involved in Formation of incision complex in GG-NER |
| 0.3 | 18.0 | REACTOME COSTIMULATION BY THE CD28 FAMILY | Genes involved in Costimulation by the CD28 family |
| 0.3 | 6.8 | REACTOME CYTOSOLIC TRNA AMINOACYLATION | Genes involved in Cytosolic tRNA aminoacylation |
| 0.2 | 24.9 | REACTOME PPARA ACTIVATES GENE EXPRESSION | Genes involved in PPARA Activates Gene Expression |
| 0.2 | 20.4 | REACTOME PEPTIDE CHAIN ELONGATION | Genes involved in Peptide chain elongation |
| 0.2 | 33.0 | REACTOME ANTIGEN PROCESSING UBIQUITINATION PROTEASOME DEGRADATION | Genes involved in Antigen processing: Ubiquitination & Proteasome degradation |
| 0.1 | 10.9 | REACTOME RESPONSE TO ELEVATED PLATELET CYTOSOLIC CA2 | Genes involved in Response to elevated platelet cytosolic Ca2+ |