Project
GSE53960: rat RNA-Seq transcriptomic Bodymap
Navigation
Downloads
Results for Cdx2
Z-value: 0.26
Motif logo
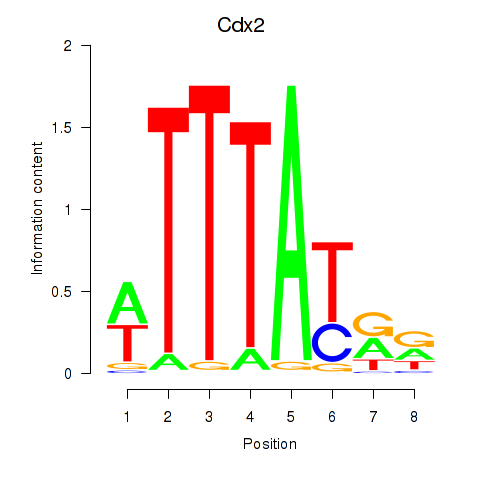
Transcription factors associated with Cdx2
| Gene Symbol | Gene ID | Gene Info |
|---|---|---|
|
Cdx2
|
ENSRNOG00000032759 | caudal type homeo box 2 |
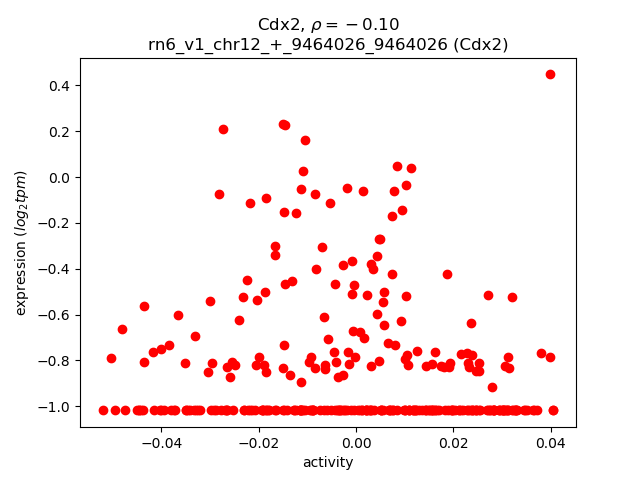
Activity-expression correlation:
| Gene | Promoter | Pearson corr. coef. | P-value | Plot |
|---|---|---|---|---|
| Cdx2 | rn6_v1_chr12_+_9464026_9464026 | -0.10 | 8.5e-02 | Click! |
Activity profile of Cdx2 motif
Sorted Z-values of Cdx2 motif
| Promoter | Log-likelihood | Transcript | Gene | Gene Info |
|---|---|---|---|---|
| chr1_+_201620642 | 16.91 |
ENSRNOT00000093674
|
Dmbt1
|
deleted in malignant brain tumors 1 |
| chr4_+_99063181 | 13.15 |
ENSRNOT00000008840
|
Fabp1
|
fatty acid binding protein 1 |
| chr10_+_53778662 | 8.48 |
ENSRNOT00000045718
|
Myh2
|
myosin heavy chain 2 |
| chrX_+_120624518 | 2.73 |
ENSRNOT00000007967
|
Slc6a14
|
solute carrier family 6 member 14 |
| chr19_-_11057254 | 2.55 |
ENSRNOT00000025559
|
Herpud1
|
homocysteine inducible ER protein with ubiquitin like domain 1 |
| chr14_+_23405717 | 1.68 |
ENSRNOT00000029805
|
Tmprss11c
|
transmembrane protease, serine 11C |
| chr1_+_103145939 | 1.59 |
ENSRNOT00000040529
|
AABR07003273.1
|
|
| chr11_+_85618714 | 0.75 |
ENSRNOT00000074614
|
AC109901.1
|
|
| chr10_-_87351030 | 0.50 |
ENSRNOT00000034889
ENSRNOT00000091152 |
Krt20
|
keratin 20 |
| chr2_-_43067956 | 0.26 |
ENSRNOT00000090616
|
Gpbp1
|
GC-rich promoter binding protein 1 |
| chr2_+_85305225 | 0.16 |
ENSRNOT00000015904
|
Tas2r119
|
taste receptor, type 2, member 119 |
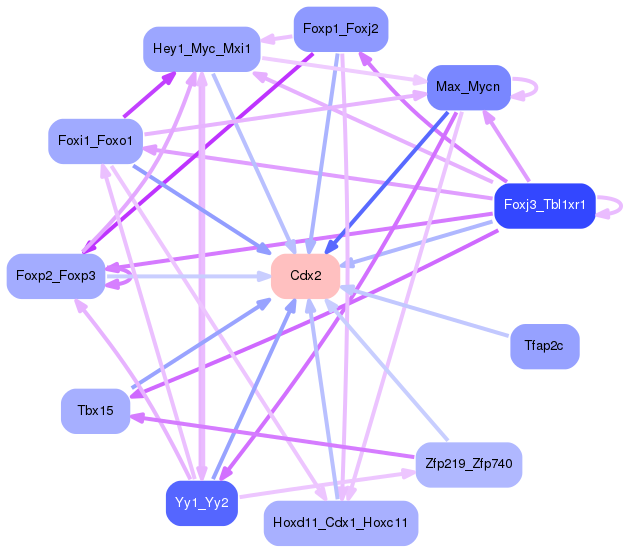
Network of associatons between targets according to the STRING database.

First level regulatory network of Cdx2
Gene Ontology Analysis
Gene overrepresentation in biological process category:
| Log-likelihood per target | Total log-likelihood | Term | Description |
|---|---|---|---|
| 4.4 | 13.2 | GO:0051977 | lysophospholipid transport(GO:0051977) |
| 0.8 | 16.9 | GO:0001833 | inner cell mass cell proliferation(GO:0001833) |
| 0.7 | 8.5 | GO:0001778 | plasma membrane repair(GO:0001778) |
| 0.5 | 2.5 | GO:1903071 | positive regulation of ER-associated ubiquitin-dependent protein catabolic process(GO:1903071) |
| 0.2 | 1.7 | GO:0097264 | self proteolysis(GO:0097264) |
| 0.0 | 0.5 | GO:0045109 | intermediate filament organization(GO:0045109) |
| 0.0 | 2.7 | GO:0006836 | neurotransmitter transport(GO:0006836) |
Gene overrepresentation in cellular component category:
| Log-likelihood per target | Total log-likelihood | Term | Description |
|---|---|---|---|
| 1.3 | 13.2 | GO:0045179 | apical cortex(GO:0045179) |
| 0.9 | 8.5 | GO:0005826 | actomyosin contractile ring(GO:0005826) |
| 0.9 | 16.9 | GO:0042589 | zymogen granule membrane(GO:0042589) |
| 0.8 | 2.5 | GO:1990037 | Lewy body core(GO:1990037) |
| 0.0 | 2.7 | GO:0031526 | brush border membrane(GO:0031526) |
Gene overrepresentation in molecular function category:
| Log-likelihood per target | Total log-likelihood | Term | Description |
|---|---|---|---|
| 2.4 | 16.9 | GO:0035375 | zymogen binding(GO:0035375) |
| 2.2 | 13.2 | GO:0005324 | long-chain fatty acid transporter activity(GO:0005324) |
| 0.1 | 2.7 | GO:0005328 | neurotransmitter:sodium symporter activity(GO:0005328) |
| 0.0 | 8.5 | GO:0003779 | actin binding(GO:0003779) |
| 0.0 | 2.5 | GO:0044325 | ion channel binding(GO:0044325) |
| 0.0 | 0.2 | GO:0033038 | bitter taste receptor activity(GO:0033038) |
Gene overrepresentation in curated gene sets: canonical pathways category:
| Log-likelihood per target | Total log-likelihood | Term | Description |
|---|---|---|---|
| 0.2 | 8.5 | PID INTEGRIN A4B1 PATHWAY | Alpha4 beta1 integrin signaling events |
| 0.1 | 16.9 | NABA ECM GLYCOPROTEINS | Genes encoding structural ECM glycoproteins |
Gene overrepresentation in curated gene sets: REACTOME pathways category:
| Log-likelihood per target | Total log-likelihood | Term | Description |
|---|---|---|---|
| 0.1 | 2.7 | REACTOME NA CL DEPENDENT NEUROTRANSMITTER TRANSPORTERS | Genes involved in Na+/Cl- dependent neurotransmitter transporters |
| 0.1 | 13.2 | REACTOME PPARA ACTIVATES GENE EXPRESSION | Genes involved in PPARA Activates Gene Expression |
| 0.1 | 2.5 | REACTOME ACTIVATION OF GENES BY ATF4 | Genes involved in Activation of Genes by ATF4 |