Project
GSE53960: rat RNA-Seq transcriptomic Bodymap
Navigation
Downloads
Results for Cdc5l
Z-value: 0.24
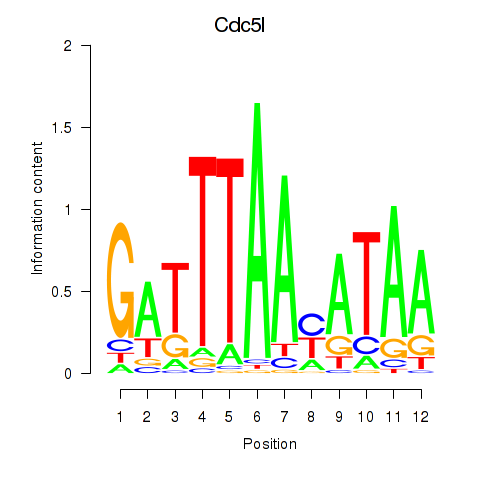
Motif logo
Transcription factors associated with Cdc5l
| Gene Symbol | Gene ID | Gene Info |
|---|---|---|
|
Cdc5l
|
ENSRNOG00000019975 | cell division cycle 5-like |
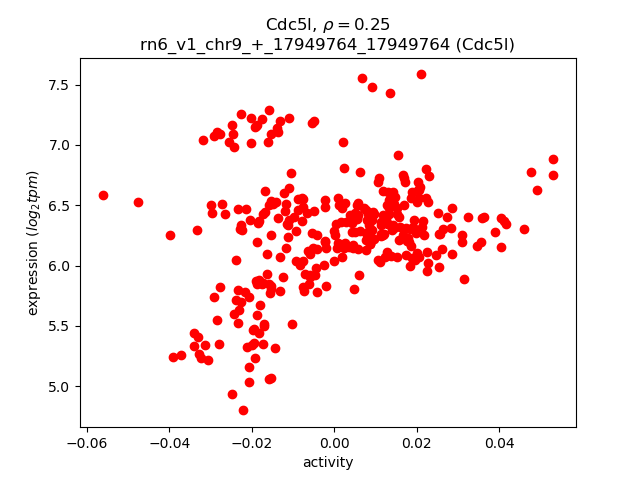
Activity-expression correlation:
| Gene | Promoter | Pearson corr. coef. | P-value | Plot |
|---|---|---|---|---|
| Cdc5l | rn6_v1_chr9_+_17949764_17949764 | 0.25 | 4.8e-06 | Click! |
Activity profile of Cdc5l motif
Sorted Z-values of Cdc5l motif
| Promoter | Log-likelihood | Transcript | Gene | Gene Info |
|---|---|---|---|---|
| chr3_-_52849907 | 5.26 |
ENSRNOT00000041096
|
Scn7a
|
sodium voltage-gated channel alpha subunit 7 |
| chr9_-_32019205 | 4.61 |
ENSRNOT00000016194
|
Adgrb3
|
adhesion G protein-coupled receptor B3 |
| chr6_-_71199110 | 4.57 |
ENSRNOT00000081883
|
Prkd1
|
protein kinase D1 |
| chr3_+_97723901 | 3.64 |
ENSRNOT00000080416
|
Mpped2
|
metallophosphoesterase domain containing 2 |
| chr4_+_120672152 | 3.04 |
ENSRNOT00000077231
|
Mgll
|
monoglyceride lipase |
| chr11_+_52828116 | 2.73 |
ENSRNOT00000035340
|
Ccdc54
|
coiled-coil domain containing 54 |
| chr7_-_144837583 | 2.43 |
ENSRNOT00000055289
|
Cbx5
|
chromobox 5 |
| chr5_-_72287669 | 1.89 |
ENSRNOT00000022255
|
Klf4
|
Kruppel like factor 4 |
| chr1_+_15642153 | 1.56 |
ENSRNOT00000079845
|
Map7
|
microtubule-associated protein 7 |
| chr7_-_144837395 | 1.53 |
ENSRNOT00000089024
|
Cbx5
|
chromobox 5 |
| chr3_-_67787990 | 1.38 |
ENSRNOT00000064851
|
Nckap1
|
NCK-associated protein 1 |
| chrX_+_78769419 | 1.35 |
ENSRNOT00000003190
|
Tbx22
|
T-box 22 |
| chr12_+_22835019 | 1.25 |
ENSRNOT00000059530
|
Col26a1
|
collagen type XXVI alpha 1 chain |
| chrX_-_82699487 | 1.21 |
ENSRNOT00000081625
|
Rps6ka6
|
ribosomal protein S6 kinase A6 |
| chr3_+_69549673 | 1.09 |
ENSRNOT00000043974
|
Zfp804a
|
zinc finger protein 804A |
| chr20_-_45399694 | 1.04 |
ENSRNOT00000000715
|
Amd1
|
adenosylmethionine decarboxylase 1 |
| chr10_-_66020682 | 0.88 |
ENSRNOT00000011019
|
Fam58b
|
family with sequence similarity 58, member B |
| chr2_-_22096949 | 0.87 |
ENSRNOT00000089325
|
Zfyve16
|
zinc finger FYVE-type containing 16 |
| chr2_-_189395746 | 0.73 |
ENSRNOT00000089042
|
Ubap2l
|
ubiquitin associated protein 2-like |
| chr13_+_98615287 | 0.65 |
ENSRNOT00000004032
|
Itpkb
|
inositol-trisphosphate 3-kinase B |
| chr15_+_28894627 | 0.63 |
ENSRNOT00000017795
|
Olr1643
|
olfactory receptor 1643 |
| chr4_-_84127331 | 0.53 |
ENSRNOT00000085812
|
Cpvl
|
carboxypeptidase, vitellogenic-like |
| chr8_+_76426335 | 0.53 |
ENSRNOT00000085496
|
Gtf2a2
|
general transcription factor2A subunit 2 |
| chr2_+_251534535 | 0.45 |
ENSRNOT00000080311
|
AABR07013701.1
|
|
| chr12_-_43576754 | 0.23 |
ENSRNOT00000042331
ENSRNOT00000081780 |
Med13l
|
mediator complex subunit 13-like |
| chr2_+_184230459 | 0.09 |
ENSRNOT00000074187
|
AABR07012054.1
|
|
Network of associatons between targets according to the STRING database.

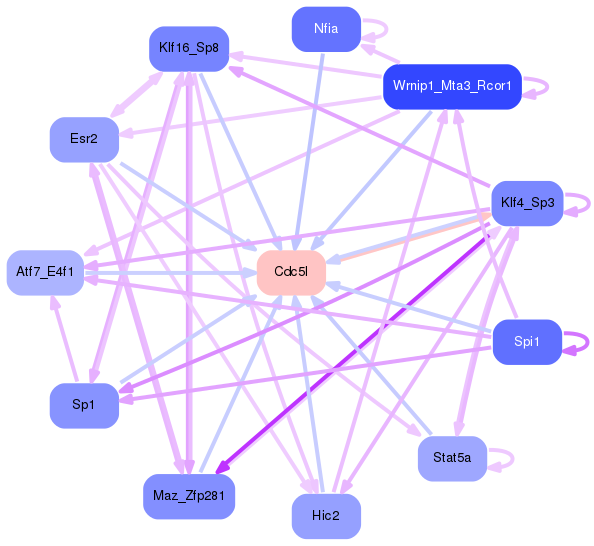
First level regulatory network of Cdc5l
Gene Ontology Analysis
Gene overrepresentation in biological process category:
| Log-likelihood per target | Total log-likelihood | Term | Description |
|---|---|---|---|
| 0.9 | 4.6 | GO:0061743 | motor learning(GO:0061743) |
| 0.8 | 4.6 | GO:0089700 | protein kinase D signaling(GO:0089700) |
| 0.8 | 3.0 | GO:2000124 | regulation of endocannabinoid signaling pathway(GO:2000124) |
| 0.6 | 1.9 | GO:2000342 | negative regulation of chemokine (C-X-C motif) ligand 2 production(GO:2000342) |
| 0.3 | 1.4 | GO:0007354 | zygotic determination of anterior/posterior axis, embryo(GO:0007354) |
| 0.2 | 1.0 | GO:0008295 | spermidine biosynthetic process(GO:0008295) |
| 0.1 | 0.7 | GO:0033030 | negative regulation of neutrophil apoptotic process(GO:0033030) |
| 0.1 | 0.7 | GO:0061484 | hematopoietic stem cell homeostasis(GO:0061484) |
| 0.1 | 1.2 | GO:2000381 | negative regulation of mesoderm development(GO:2000381) |
| 0.1 | 5.3 | GO:0055078 | sodium ion homeostasis(GO:0055078) |
| 0.1 | 1.6 | GO:0033327 | Leydig cell differentiation(GO:0033327) |
| 0.1 | 0.9 | GO:1901409 | positive regulation of phosphorylation of RNA polymerase II C-terminal domain(GO:1901409) |
| 0.0 | 0.9 | GO:0006622 | protein targeting to lysosome(GO:0006622) |
| 0.0 | 0.5 | GO:0051123 | RNA polymerase II transcriptional preinitiation complex assembly(GO:0051123) |
Gene overrepresentation in cellular component category:
| Log-likelihood per target | Total log-likelihood | Term | Description |
|---|---|---|---|
| 0.3 | 4.6 | GO:0043083 | synaptic cleft(GO:0043083) |
| 0.3 | 5.3 | GO:0001518 | voltage-gated sodium channel complex(GO:0001518) |
| 0.2 | 4.0 | GO:0010369 | chromocenter(GO:0010369) |
| 0.2 | 4.6 | GO:0000421 | autophagosome membrane(GO:0000421) |
| 0.2 | 1.4 | GO:0031209 | SCAR complex(GO:0031209) |
| 0.2 | 3.0 | GO:0043196 | varicosity(GO:0043196) |
| 0.1 | 0.5 | GO:0005672 | transcription factor TFIIA complex(GO:0005672) |
| 0.1 | 1.9 | GO:0005719 | nuclear euchromatin(GO:0005719) |
| 0.0 | 0.7 | GO:0005671 | Ada2/Gcn5/Ada3 transcription activator complex(GO:0005671) |
| 0.0 | 0.9 | GO:0000307 | cyclin-dependent protein kinase holoenzyme complex(GO:0000307) |
Gene overrepresentation in molecular function category:
| Log-likelihood per target | Total log-likelihood | Term | Description |
|---|---|---|---|
| 0.4 | 1.9 | GO:0001010 | transcription factor activity, sequence-specific DNA binding transcription factor recruiting(GO:0001010) |
| 0.2 | 3.0 | GO:0047372 | acylglycerol lipase activity(GO:0047372) |
| 0.2 | 4.6 | GO:0004697 | protein kinase C activity(GO:0004697) |
| 0.2 | 5.3 | GO:0005248 | voltage-gated sodium channel activity(GO:0005248) |
| 0.1 | 0.5 | GO:0004185 | serine-type carboxypeptidase activity(GO:0004185) |
| 0.1 | 1.0 | GO:0019808 | polyamine binding(GO:0019808) |
| 0.1 | 0.7 | GO:0008440 | inositol-1,4,5-trisphosphate 3-kinase activity(GO:0008440) |
| 0.1 | 4.0 | GO:0035064 | methylated histone binding(GO:0035064) |
| 0.0 | 0.9 | GO:0005545 | 1-phosphatidylinositol binding(GO:0005545) |
| 0.0 | 1.4 | GO:0048365 | Rac GTPase binding(GO:0048365) |
| 0.0 | 0.9 | GO:0016538 | cyclin-dependent protein serine/threonine kinase regulator activity(GO:0016538) |
| 0.0 | 4.6 | GO:0005096 | GTPase activator activity(GO:0005096) |
| 0.0 | 0.5 | GO:0001103 | RNA polymerase II repressing transcription factor binding(GO:0001103) TBP-class protein binding(GO:0017025) |
Gene overrepresentation in curated gene sets: canonical pathways category:
| Log-likelihood per target | Total log-likelihood | Term | Description |
|---|---|---|---|
| 0.1 | 4.6 | PID IGF1 PATHWAY | IGF1 pathway |
| 0.1 | 0.7 | ST PAC1 RECEPTOR PATHWAY | PAC1 Receptor Pathway |
| 0.1 | 4.0 | PID AURORA B PATHWAY | Aurora B signaling |
| 0.0 | 1.4 | PID ECADHERIN STABILIZATION PATHWAY | Stabilization and expansion of the E-cadherin adherens junction |
| 0.0 | 1.2 | NABA COLLAGENS | Genes encoding collagen proteins |
| 0.0 | 1.9 | PID BETA CATENIN NUC PATHWAY | Regulation of nuclear beta catenin signaling and target gene transcription |
| 0.0 | 0.9 | PID BMP PATHWAY | BMP receptor signaling |
Gene overrepresentation in curated gene sets: REACTOME pathways category:
| Log-likelihood per target | Total log-likelihood | Term | Description |
|---|---|---|---|
| 0.2 | 3.0 | REACTOME HORMONE SENSITIVE LIPASE HSL MEDIATED TRIACYLGLYCEROL HYDROLYSIS | Genes involved in Hormone-sensitive lipase (HSL)-mediated triacylglycerol hydrolysis |
| 0.2 | 5.3 | REACTOME INTERACTION BETWEEN L1 AND ANKYRINS | Genes involved in Interaction between L1 and Ankyrins |
| 0.1 | 1.9 | REACTOME SYNTHESIS SECRETION AND DEACYLATION OF GHRELIN | Genes involved in Synthesis, Secretion, and Deacylation of Ghrelin |
| 0.1 | 4.6 | REACTOME SPHINGOLIPID DE NOVO BIOSYNTHESIS | Genes involved in Sphingolipid de novo biosynthesis |
| 0.1 | 1.0 | REACTOME METABOLISM OF POLYAMINES | Genes involved in Metabolism of polyamines |
| 0.0 | 1.2 | REACTOME RECYCLING PATHWAY OF L1 | Genes involved in Recycling pathway of L1 |
| 0.0 | 4.0 | REACTOME FACTORS INVOLVED IN MEGAKARYOCYTE DEVELOPMENT AND PLATELET PRODUCTION | Genes involved in Factors involved in megakaryocyte development and platelet production |
| 0.0 | 0.9 | REACTOME SIGNALING BY BMP | Genes involved in Signaling by BMP |
| 0.0 | 0.5 | REACTOME RNA POL II TRANSCRIPTION PRE INITIATION AND PROMOTER OPENING | Genes involved in RNA Polymerase II Transcription Pre-Initiation And Promoter Opening |