Project
GSE53960: rat RNA-Seq transcriptomic Bodymap
Navigation
Downloads
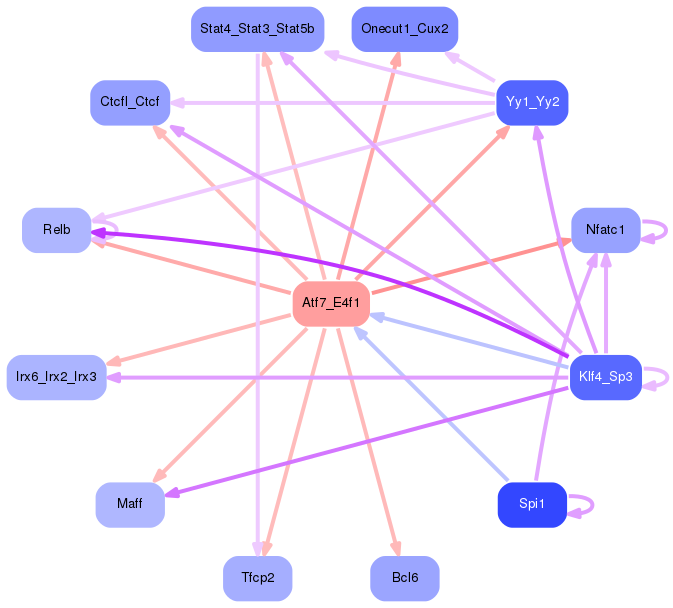
Results for Atf7_E4f1
Z-value: 0.95
Motif logo
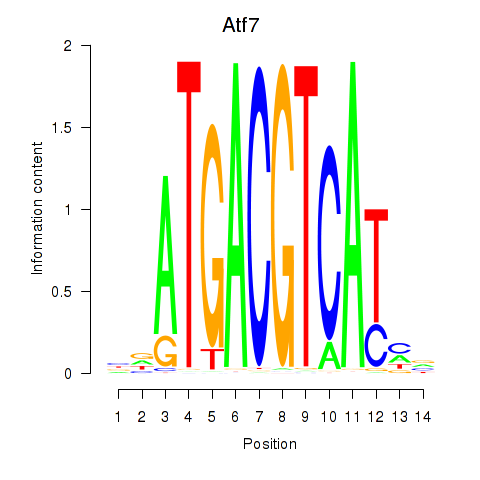
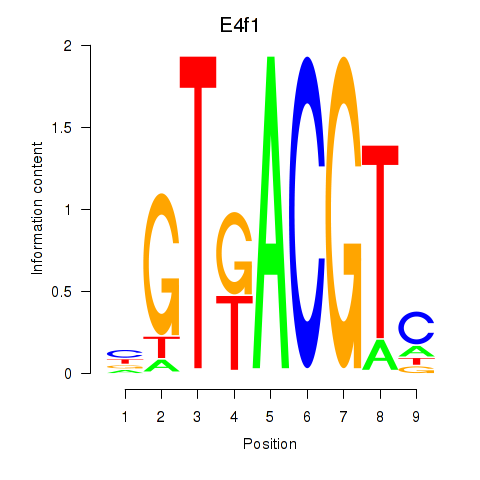
Transcription factors associated with Atf7_E4f1
| Gene Symbol | Gene ID | Gene Info |
|---|---|---|
|
Atf7
|
ENSRNOG00000015269 | activating transcription factor 7 |
|
E4f1
|
ENSRNOG00000009224 | E4F transcription factor 1 |
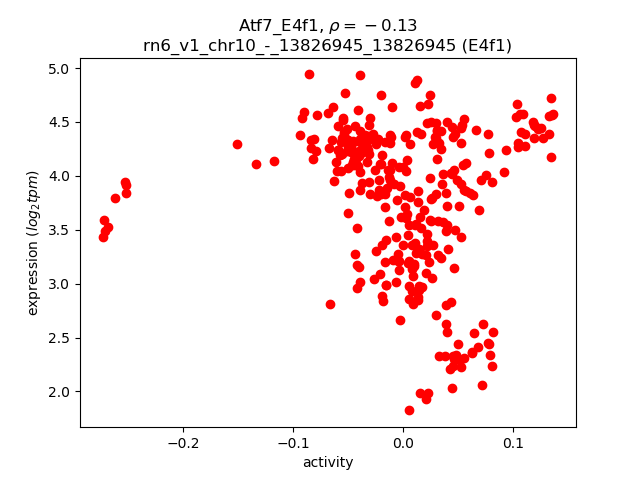
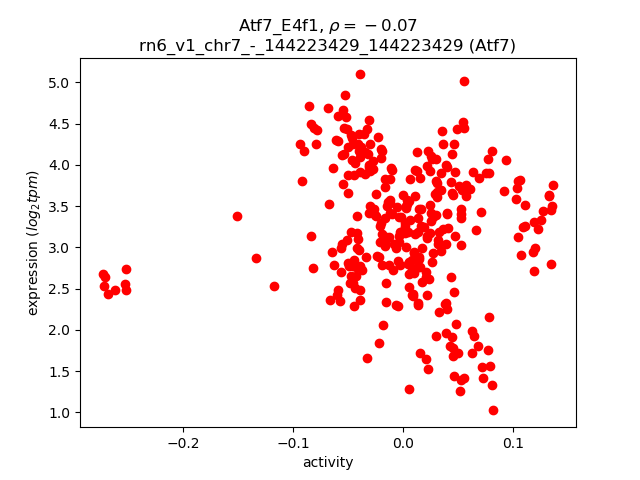
Activity-expression correlation:
| Gene | Promoter | Pearson corr. coef. | P-value | Plot |
|---|---|---|---|---|
| E4f1 | rn6_v1_chr10_-_13826945_13826945 | -0.13 | 2.4e-02 | Click! |
| Atf7 | rn6_v1_chr7_-_144223429_144223429 | -0.07 | 2.3e-01 | Click! |
Activity profile of Atf7_E4f1 motif
Sorted Z-values of Atf7_E4f1 motif
| Promoter | Log-likelihood | Transcript | Gene | Gene Info |
|---|---|---|---|---|
| chr10_-_65424802 | 56.11 |
ENSRNOT00000018468
|
Traf4
|
Tnf receptor associated factor 4 |
| chr2_+_189629297 | 55.29 |
ENSRNOT00000049810
|
Dennd4b
|
DENN domain containing 4B |
| chr4_+_70572942 | 45.39 |
ENSRNOT00000051964
|
AC142181.1
|
|
| chr4_-_57625147 | 39.21 |
ENSRNOT00000074649
ENSRNOT00000078961 |
Ube2h
|
ubiquitin-conjugating enzyme E2H |
| chr17_+_43617247 | 37.15 |
ENSRNOT00000075065
|
Hist1h2ao
|
histone cluster 1, H2ao |
| chr18_-_77322690 | 33.81 |
ENSRNOT00000058382
|
Nfatc1
|
nuclear factor of activated T-cells 1 |
| chr12_+_37984790 | 33.34 |
ENSRNOT00000001445
|
Vps37b
|
VPS37B, ESCRT-I subunit |
| chr10_+_11724032 | 31.18 |
ENSRNOT00000008966
|
Trap1
|
TNF receptor-associated protein 1 |
| chr17_-_43821536 | 29.89 |
ENSRNOT00000072286
|
RGD1562378
|
histone H4 variant H4-v.1 |
| chr13_-_50916982 | 25.37 |
ENSRNOT00000004408
|
Btg2
|
BTG anti-proliferation factor 2 |
| chr2_-_123282214 | 24.98 |
ENSRNOT00000021156
|
Ccna2
|
cyclin A2 |
| chr10_+_70884531 | 24.26 |
ENSRNOT00000015199
|
Ccl4
|
C-C motif chemokine ligand 4 |
| chr1_+_196996581 | 22.96 |
ENSRNOT00000021690
|
Il21r
|
interleukin 21 receptor |
| chr4_-_67520356 | 22.63 |
ENSRNOT00000014604
|
Braf
|
B-Raf proto-oncogene, serine/threonine kinase |
| chr17_-_1797732 | 22.16 |
ENSRNOT00000033017
ENSRNOT00000079742 |
Cdc14b
|
cell division cycle 14B |
| chr10_-_88163712 | 21.81 |
ENSRNOT00000005382
ENSRNOT00000084493 |
Krt17
|
keratin 17 |
| chr1_+_86938138 | 21.64 |
ENSRNOT00000075601
|
Ccer2
|
coiled-coil glutamate-rich protein 2 |
| chr6_+_132702448 | 21.52 |
ENSRNOT00000005743
|
Yy1
|
YY1 transcription factor |
| chr2_-_123281856 | 21.09 |
ENSRNOT00000079745
|
Ccna2
|
cyclin A2 |
| chr9_+_20765296 | 20.84 |
ENSRNOT00000016291
|
Cd2ap
|
CD2-associated protein |
| chr8_+_81766041 | 20.47 |
ENSRNOT00000032280
|
Onecut1
|
one cut homeobox 1 |
| chr1_-_80544825 | 20.17 |
ENSRNOT00000057802
ENSRNOT00000040060 ENSRNOT00000067049 ENSRNOT00000052387 ENSRNOT00000073352 |
Relb
|
RELB proto-oncogene, NF-kB subunit |
| chr5_+_148320438 | 19.65 |
ENSRNOT00000018742
|
Pef1
|
penta-EF hand domain containing 1 |
| chr10_+_16970626 | 19.51 |
ENSRNOT00000005383
|
Dusp1
|
dual specificity phosphatase 1 |
| chr4_+_99239115 | 18.70 |
ENSRNOT00000009515
|
Cd8a
|
CD8a molecule |
| chr17_+_10463303 | 18.06 |
ENSRNOT00000060822
|
Rnf44
|
ring finger protein 44 |
| chr1_-_64090017 | 17.64 |
ENSRNOT00000086622
ENSRNOT00000091654 |
Rps9
|
ribosomal protein S9 |
| chr5_-_152464850 | 17.23 |
ENSRNOT00000021937
|
Zfp593
|
zinc finger protein 593 |
| chr1_-_64021321 | 17.21 |
ENSRNOT00000090819
|
Rps9
|
ribosomal protein S9 |
| chr3_+_100366168 | 17.18 |
ENSRNOT00000006689
|
Kif18a
|
kinesin family member 18A |
| chr6_-_91456696 | 16.96 |
ENSRNOT00000005577
|
Rps29
|
ribosomal protein S29 |
| chr4_+_69435703 | 16.90 |
ENSRNOT00000065485
|
LOC100911271
|
uncharacterized LOC100911271 |
| chr15_+_57290849 | 16.61 |
ENSRNOT00000014909
|
Cpb2
|
carboxypeptidase B2 |
| chr7_-_2941122 | 16.61 |
ENSRNOT00000082107
|
Esyt1
|
extended synaptotagmin 1 |
| chr20_-_4070721 | 16.50 |
ENSRNOT00000000523
|
RT1-Ba
|
RT1 class II, locus Ba |
| chr4_-_170740274 | 16.35 |
ENSRNOT00000012212
|
Gucy2c
|
guanylate cyclase 2C |
| chr2_+_240396152 | 16.09 |
ENSRNOT00000034565
|
Cenpe
|
centromere protein E |
| chrX_-_156399760 | 16.04 |
ENSRNOT00000086921
|
Fam50a
|
family with sequence similarity 50, member A |
| chr7_-_54778848 | 15.90 |
ENSRNOT00000005399
|
Glipr1
|
GLI pathogenesis-related 1 |
| chr6_-_7741414 | 15.84 |
ENSRNOT00000038246
|
Thada
|
THADA, armadillo repeat containing |
| chr20_-_10680283 | 15.44 |
ENSRNOT00000001579
|
Sik1
|
salt-inducible kinase 1 |
| chr8_-_21995806 | 15.30 |
ENSRNOT00000028034
|
S1pr2
|
sphingosine-1-phosphate receptor 2 |
| chr9_+_9970209 | 15.17 |
ENSRNOT00000075215
|
Dennd1c
|
DENN/MADD domain containing 1C |
| chr3_+_161212156 | 15.06 |
ENSRNOT00000020280
ENSRNOT00000083553 |
Dnttip1
|
deoxynucleotidyltransferase, terminal, interacting protein 1 |
| chr4_-_51946715 | 14.42 |
ENSRNOT00000079130
|
Pot1
|
protection of telomeres 1 |
| chr10_-_64398294 | 13.92 |
ENSRNOT00000010386
|
Glod4
|
glyoxalase domain containing 4 |
| chr12_+_52072188 | 13.52 |
ENSRNOT00000056725
|
Noc4l
|
nucleolar complex associated 4 homolog |
| chr1_-_156296161 | 13.37 |
ENSRNOT00000025653
|
Crebzf
|
CREB/ATF bZIP transcription factor |
| chr11_-_62451149 | 13.13 |
ENSRNOT00000093686
ENSRNOT00000081443 |
Zbtb20
|
zinc finger and BTB domain containing 20 |
| chr9_+_82370924 | 12.91 |
ENSRNOT00000025219
|
Zfand2b
|
zinc finger AN1-type containing 2B |
| chr10_+_45559578 | 12.87 |
ENSRNOT00000004011
|
RGD1304587
|
similar to RIKEN cDNA 2310033P09 |
| chr9_-_78969013 | 12.85 |
ENSRNOT00000019772
ENSRNOT00000057585 |
Fn1
|
fibronectin 1 |
| chr1_-_178218761 | 12.66 |
ENSRNOT00000019199
|
Pth
|
parathyroid hormone |
| chr6_+_126623015 | 12.62 |
ENSRNOT00000010672
|
Tmem251
|
transmembrane protein 251 |
| chr10_+_13000090 | 12.20 |
ENSRNOT00000004845
|
Cldn6
|
claudin 6 |
| chr10_-_74724472 | 11.87 |
ENSRNOT00000008846
|
Rad51c
|
RAD51 paralog C |
| chr14_+_2613406 | 11.85 |
ENSRNOT00000000083
|
Tmed5
|
transmembrane p24 trafficking protein 5 |
| chr19_-_15733412 | 11.83 |
ENSRNOT00000014831
|
Irx6
|
iroquois homeobox 6 |
| chr20_+_10844266 | 11.63 |
ENSRNOT00000001583
|
Rrp1b
|
ribosomal RNA processing 1B |
| chr4_+_84854386 | 11.62 |
ENSRNOT00000013620
|
Mturn
|
maturin, neural progenitor differentiation regulator homolog |
| chr11_+_80255790 | 11.13 |
ENSRNOT00000002522
|
Bcl6
|
B-cell CLL/lymphoma 6 |
| chr8_+_50310405 | 11.11 |
ENSRNOT00000073507
|
Sik3
|
SIK family kinase 3 |
| chr9_+_78968814 | 11.10 |
ENSRNOT00000057584
|
AABR07068042.1
|
|
| chr1_+_103172987 | 11.10 |
ENSRNOT00000018688
|
Tmem86a
|
transmembrane protein 86A |
| chr7_+_120580743 | 10.92 |
ENSRNOT00000017181
|
Maff
|
MAF bZIP transcription factor F |
| chr19_-_34105610 | 10.74 |
ENSRNOT00000017347
|
Prmt9
|
protein arginine methyltransferase 9 |
| chr10_+_31324512 | 10.70 |
ENSRNOT00000008559
|
Fndc9
|
fibronectin type III domain containing 9 |
| chr12_+_13102019 | 10.60 |
ENSRNOT00000092628
|
Rac1
|
ras-related C3 botulinum toxin substrate 1 |
| chr5_+_159845774 | 10.50 |
ENSRNOT00000012328
|
Epha2
|
Eph receptor A2 |
| chr19_+_27404712 | 10.49 |
ENSRNOT00000023657
|
Mylk3
|
myosin light chain kinase 3 |
| chr7_+_25919867 | 10.31 |
ENSRNOT00000009625
ENSRNOT00000090153 |
Ric8b
|
RIC8 guanine nucleotide exchange factor B |
| chr3_-_161212188 | 10.29 |
ENSRNOT00000065751
|
Wfdc3
|
WAP four-disulfide core domain 3 |
| chr7_+_61236037 | 10.27 |
ENSRNOT00000009776
|
Il22
|
interleukin 22 |
| chr4_-_120840111 | 10.24 |
ENSRNOT00000022231
|
Mcm2
|
minichromosome maintenance complex component 2 |
| chr2_-_66608324 | 10.24 |
ENSRNOT00000077597
|
Cln5
|
ceroid-lipofuscinosis, neuronal 5 |
| chr15_-_70399924 | 10.22 |
ENSRNOT00000087940
|
Diaph3
|
diaphanous-related formin 3 |
| chr7_-_142180997 | 10.20 |
ENSRNOT00000087632
|
Tfcp2
|
transcription factor CP2 |
| chr19_+_37600148 | 10.11 |
ENSRNOT00000023853
|
Ctcf
|
CCCTC-binding factor |
| chr8_+_114866768 | 9.97 |
ENSRNOT00000076731
|
Wdr82
|
WD repeat domain 82 |
| chr7_+_63922879 | 9.85 |
ENSRNOT00000043581
|
RGD1565498
|
similar to Hypothetical protein LOC270802 |
| chrX_+_1321315 | 9.83 |
ENSRNOT00000014250
|
Syn1
|
synapsin I |
| chr19_+_37990374 | 9.63 |
ENSRNOT00000026827
|
Dus2
|
dihydrouridine synthase 2 |
| chr7_+_140758615 | 9.58 |
ENSRNOT00000089448
|
Troap
|
trophinin associated protein |
| chr9_-_99651813 | 9.58 |
ENSRNOT00000022089
|
Ndufa10
|
NADH:ubiquinone oxidoreductase subunit A10 |
| chrX_+_45420596 | 9.51 |
ENSRNOT00000051897
|
Sts
|
steroid sulfatase (microsomal), isozyme S |
| chr12_-_13668515 | 9.49 |
ENSRNOT00000086847
|
Fscn1
|
fascin actin-bundling protein 1 |
| chrX_-_54303729 | 9.39 |
ENSRNOT00000087919
ENSRNOT00000064340 ENSRNOT00000051249 ENSRNOT00000087547 |
Gk
|
glycerol kinase |
| chr20_-_3815834 | 9.38 |
ENSRNOT00000000543
|
Ring1
|
ring finger protein 1 |
| chr4_-_80333326 | 9.30 |
ENSRNOT00000014058
|
LOC100363502
|
cytochrome c, somatic-like |
| chr3_-_15463881 | 9.29 |
ENSRNOT00000009706
|
Rbm18
|
RNA binding motif protein 18 |
| chr10_+_94407559 | 9.27 |
ENSRNOT00000013046
|
Ddx42
|
DEAD-box helicase 42 |
| chr5_-_141430659 | 9.27 |
ENSRNOT00000034944
|
Akirin1
|
akirin 1 |
| chr11_+_70034139 | 9.17 |
ENSRNOT00000002450
|
Umps
|
uridine monophosphate synthetase |
| chr10_-_88842233 | 9.14 |
ENSRNOT00000026760
|
Stat3
|
signal transducer and activator of transcription 3 |
| chrX_+_134940615 | 9.04 |
ENSRNOT00000005604
|
Xpnpep2
|
X-prolyl aminopeptidase 2 |
| chr7_-_142180794 | 9.00 |
ENSRNOT00000037447
|
Tfcp2
|
transcription factor CP2 |
| chr20_-_3299580 | 8.95 |
ENSRNOT00000050373
|
Gnl1
|
G protein nucleolar 1 |
| chr19_-_54245855 | 8.81 |
ENSRNOT00000023855
|
Emc8
|
ER membrane protein complex subunit 8 |
| chr6_+_137210052 | 8.80 |
ENSRNOT00000031788
ENSRNOT00000065213 |
Siva1
|
SIVA1, apoptosis-inducing factor |
| chr2_+_188784222 | 8.72 |
ENSRNOT00000028095
|
Pmvk
|
phosphomevalonate kinase |
| chr4_+_25635765 | 8.68 |
ENSRNOT00000009340
|
Gtpbp10
|
GTP binding protein 10 |
| chr9_+_45672157 | 8.64 |
ENSRNOT00000017882
|
Pdcl3
|
phosducin-like 3 |
| chr18_+_62174670 | 8.34 |
ENSRNOT00000025362
|
Pmaip1
|
phorbol-12-myristate-13-acetate-induced protein 1 |
| chr19_-_37990353 | 8.32 |
ENSRNOT00000026817
|
Ddx28
|
DEAD-box helicase 28 |
| chr10_+_64398339 | 8.30 |
ENSRNOT00000056278
|
Mrm3
|
mitochondrial rRNA methyltransferase 3 |
| chr2_-_30340103 | 8.19 |
ENSRNOT00000024023
ENSRNOT00000067722 |
Bdp1
|
B double prime 1, subunit of RNA polymerase III transcription initiation factor IIIB |
| chr4_+_157452607 | 8.19 |
ENSRNOT00000022467
|
Mlf2
|
myeloid leukemia factor 2 |
| chr3_+_8802852 | 8.13 |
ENSRNOT00000033934
|
Lrrc8a
|
leucine rich repeat containing 8 family, member A |
| chr16_-_29936307 | 7.89 |
ENSRNOT00000088707
|
Ddx60
|
DEAD (Asp-Glu-Ala-Asp) box polypeptide 60 |
| chr9_+_17817721 | 7.73 |
ENSRNOT00000086986
ENSRNOT00000026920 |
Hsp90ab1
|
heat shock protein 90 alpha family class B member 1 |
| chr19_-_43841795 | 7.71 |
ENSRNOT00000079539
|
Ldhd
|
lactate dehydrogenase D |
| chr1_-_167308827 | 7.64 |
ENSRNOT00000027590
ENSRNOT00000027575 |
Nup98
|
nucleoporin 98 |
| chr6_-_96171629 | 7.55 |
ENSRNOT00000010546
ENSRNOT00000078190 |
Trmt5
|
tRNA methyltransferase 5 |
| chrX_-_158978995 | 7.53 |
ENSRNOT00000001179
|
Mmgt1
|
membrane magnesium transporter 1 |
| chr19_+_55917736 | 7.39 |
ENSRNOT00000020635
|
Rpl13
|
ribosomal protein L13 |
| chr3_+_15463953 | 7.33 |
ENSRNOT00000033047
|
Mrrf
|
mitochondrial ribosome recycling factor |
| chr20_+_2088533 | 7.20 |
ENSRNOT00000001012
ENSRNOT00000079021 |
Znrd1
|
zinc ribbon domain containing 1 |
| chr10_+_29165577 | 7.16 |
ENSRNOT00000078415
|
Ccnjl
|
cyclin J-like |
| chr20_+_22728208 | 6.97 |
ENSRNOT00000000794
|
LOC100363472
|
nuclear receptor-binding factor 2-like |
| chr4_+_157453069 | 6.97 |
ENSRNOT00000088622
|
Mlf2
|
myeloid leukemia factor 2 |
| chrX_-_45522665 | 6.93 |
ENSRNOT00000030771
|
RGD1562200
|
similar to GS2 gene |
| chr14_-_80355420 | 6.92 |
ENSRNOT00000049798
|
Acox3
|
acyl-CoA oxidase 3, pristanoyl |
| chr1_+_102900286 | 6.83 |
ENSRNOT00000017468
|
Ldha
|
lactate dehydrogenase A |
| chr12_-_18531161 | 6.74 |
ENSRNOT00000037829
|
Akap17a
|
A-kinase anchoring protein 17A |
| chr19_+_14523554 | 6.70 |
ENSRNOT00000084271
ENSRNOT00000064731 |
Mcm5
|
minichromosome maintenance complex component 5 |
| chr1_+_81395841 | 6.69 |
ENSRNOT00000072750
|
Irgq
|
immunity-related GTPase Q |
| chr10_+_104019888 | 6.68 |
ENSRNOT00000032016
|
Slc16a5
|
solute carrier family 16 member 5 |
| chr1_-_101118825 | 6.63 |
ENSRNOT00000066328
|
Rps11
|
ribosomal protein S11 |
| chr14_-_81254637 | 6.63 |
ENSRNOT00000058166
|
Htt
|
huntingtin |
| chr1_+_162768156 | 6.63 |
ENSRNOT00000049321
|
Pak1
|
p21 (RAC1) activated kinase 1 |
| chr1_+_280423079 | 6.53 |
ENSRNOT00000011983
|
Slc18a2
|
solute carrier family 18 member A2 |
| chr5_-_169200109 | 6.53 |
ENSRNOT00000012745
|
Zbtb48
|
zinc finger and BTB domain containing 48 |
| chr1_+_167538263 | 6.46 |
ENSRNOT00000074058
|
Rrm1
|
ribonucleotide reductase catalytic subunit M1 |
| chr4_+_157554794 | 6.45 |
ENSRNOT00000024116
|
Ing4
|
inhibitor of growth family, member 4 |
| chr8_+_114867062 | 6.45 |
ENSRNOT00000074771
|
Wdr82
|
WD repeat domain 82 |
| chr8_+_69127708 | 6.42 |
ENSRNOT00000013490
|
Snapc5
|
small nuclear RNA activating complex, polypeptide 5 |
| chr2_-_152824547 | 6.41 |
ENSRNOT00000019824
|
Dhx36
|
DEAH-box helicase 36 |
| chr20_+_3299730 | 6.35 |
ENSRNOT00000078538
|
Prr3
|
proline rich 3 |
| chr10_-_56531483 | 6.31 |
ENSRNOT00000022343
|
Eif5a
|
eukaryotic translation initiation factor 5A |
| chr12_-_52072106 | 6.30 |
ENSRNOT00000088306
ENSRNOT00000068621 |
Ddx51
|
DEAD-box helicase 51 |
| chr9_-_49902943 | 6.23 |
ENSRNOT00000037094
|
Tgfbrap1
|
transforming growth factor, beta receptor associated protein 1 |
| chr10_+_55492404 | 6.21 |
ENSRNOT00000005588
ENSRNOT00000078038 |
Rpl26
|
ribosomal protein L26 |
| chr2_-_104133985 | 6.20 |
ENSRNOT00000088167
ENSRNOT00000067725 |
Pde7a
|
phosphodiesterase 7A |
| chr11_-_64752544 | 6.14 |
ENSRNOT00000048738
|
Tmem39a
|
transmembrane protein 39a |
| chr19_-_25955371 | 6.14 |
ENSRNOT00000004042
ENSRNOT00000084123 |
Rad23a
|
RAD23 homolog A, nucleotide excision repair protein |
| chr14_-_86706626 | 6.08 |
ENSRNOT00000082893
|
H2afv
|
H2A histone family, member V |
| chr5_-_140162642 | 5.96 |
ENSRNOT00000046906
|
Rlf
|
rearranged L-myc fusion |
| chr7_-_75597087 | 5.92 |
ENSRNOT00000080676
|
Ywhaz
|
tyrosine 3-monooxygenase/tryptophan 5-monooxygenase activation protein, zeta |
| chr6_+_108032856 | 5.91 |
ENSRNOT00000014738
|
Zfp410
|
zinc finger protein 410 |
| chr1_-_89124132 | 5.91 |
ENSRNOT00000031044
|
Haus5
|
HAUS augmin-like complex, subunit 5 |
| chr20_-_10407554 | 5.88 |
ENSRNOT00000074081
|
U2af1
|
U2 small nuclear RNA auxiliary factor 1 |
| chr12_+_47920743 | 5.87 |
ENSRNOT00000072511
|
Mmab
|
methylmalonic aciduria (cobalamin deficiency) cblB type |
| chr8_+_116826680 | 5.85 |
ENSRNOT00000026854
|
Gmppb
|
GDP-mannose pyrophosphorylase B |
| chr4_-_168517177 | 5.85 |
ENSRNOT00000009151
|
Dusp16
|
dual specificity phosphatase 16 |
| chr10_-_66602987 | 5.83 |
ENSRNOT00000017949
|
Wsb1
|
WD repeat and SOCS box-containing 1 |
| chr3_-_110964452 | 5.78 |
ENSRNOT00000016356
|
Rmdn3
|
regulator of microtubule dynamics 3 |
| chr10_-_94406949 | 5.77 |
ENSRNOT00000012533
|
Ccdc47
|
coiled-coil domain containing 47 |
| chr2_+_264786242 | 5.75 |
ENSRNOT00000015170
|
Ankrd13c
|
ankyrin repeat domain 13C |
| chr19_+_31867981 | 5.71 |
ENSRNOT00000024753
|
Abce1
|
ATP binding cassette subfamily E member 1 |
| chr5_+_155935554 | 5.70 |
ENSRNOT00000031855
|
LOC100911993
|
ubiquitin carboxyl-terminal hydrolase 48-like |
| chr4_+_8256611 | 5.69 |
ENSRNOT00000061894
|
AABR07059198.1
|
|
| chr14_+_107767392 | 5.68 |
ENSRNOT00000012847
|
Cct4
|
chaperonin containing TCP1 subunit 4 |
| chr5_-_150653172 | 5.65 |
ENSRNOT00000072028
|
Med18
|
mediator complex subunit 18 |
| chr19_+_56272162 | 5.57 |
ENSRNOT00000030399
|
Afg3l1
|
AFG3(ATPase family gene 3)-like 1 (S. cerevisiae) |
| chr1_+_100473643 | 5.56 |
ENSRNOT00000026379
|
Josd2
|
Josephin domain containing 2 |
| chr5_+_150001281 | 5.48 |
ENSRNOT00000034057
|
Mecr
|
mitochondrial trans-2-enoyl-CoA reductase |
| chr4_+_67378188 | 5.46 |
ENSRNOT00000030892
|
Ndufb2
|
NADH:ubiquinone oxidoreductase subunit B2 |
| chr7_+_125034764 | 5.45 |
ENSRNOT00000015767
|
Pnpla3
|
patatin-like phospholipase domain containing 3 |
| chr7_-_2588686 | 5.42 |
ENSRNOT00000048848
|
Rbms2
|
RNA binding motif, single stranded interacting protein 2 |
| chr10_-_85574889 | 5.37 |
ENSRNOT00000072274
|
LOC691153
|
hypothetical protein LOC691153 |
| chr1_-_134867001 | 5.36 |
ENSRNOT00000090149
|
Chd2
|
chromodomain helicase DNA binding protein 2 |
| chr1_+_100755682 | 5.31 |
ENSRNOT00000035748
|
Vrk3
|
vaccinia related kinase 3 |
| chr4_+_3043231 | 5.30 |
ENSRNOT00000013732
|
Il6
|
interleukin 6 |
| chr13_+_111890894 | 5.29 |
ENSRNOT00000007341
|
LOC100125367
|
hypothetical protein LOC100125367 |
| chr9_+_38799881 | 5.26 |
ENSRNOT00000083847
|
AABR07067300.1
|
|
| chr17_+_6840463 | 5.26 |
ENSRNOT00000061233
|
Ubqln1
|
ubiquilin 1 |
| chr11_+_82373870 | 5.24 |
ENSRNOT00000002429
|
Tra2b
|
transformer 2 beta homolog (Drosophila) |
| chr1_+_177495782 | 5.22 |
ENSRNOT00000021020
|
Tead1
|
TEA domain transcription factor 1 |
| chr2_-_115891097 | 5.19 |
ENSRNOT00000013191
|
Skil
|
SKI-like proto-oncogene |
| chr20_-_7397448 | 5.17 |
ENSRNOT00000059426
|
LOC294154
|
similar to chromosome 6 open reading frame 106 isoform a |
| chr13_-_110257367 | 5.12 |
ENSRNOT00000005576
|
Dtl
|
denticleless E3 ubiquitin protein ligase homolog |
| chr11_-_67647818 | 5.12 |
ENSRNOT00000003068
|
Wdr5b
|
WD repeat domain 5B |
| chr7_-_70355619 | 5.11 |
ENSRNOT00000031272
|
Tspan31
|
tetraspanin 31 |
| chr6_-_41870046 | 4.99 |
ENSRNOT00000005863
|
Lpin1
|
lipin 1 |
| chr3_+_152933771 | 4.98 |
ENSRNOT00000027539
|
RGD1307752
|
similar to RIKEN cDNA 1110008F13 |
| chr6_+_137184820 | 4.93 |
ENSRNOT00000073796
|
Adssl1
|
adenylosuccinate synthase like 1 |
| chr1_-_37863756 | 4.92 |
ENSRNOT00000077781
|
Zfp874b
|
zinc finger protein 874b |
| chr15_+_34234193 | 4.92 |
ENSRNOT00000077584
|
Dcaf11
|
DDB1 and CUL4 associated factor 11 |
| chr7_+_120923274 | 4.89 |
ENSRNOT00000049247
|
Gtpbp1
|
GTP binding protein 1 |
| chr9_+_10428853 | 4.84 |
ENSRNOT00000074253
|
Lonp1
|
lon peptidase 1, mitochondrial |
| chr12_-_16002788 | 4.83 |
ENSRNOT00000090318
|
Amz1
|
archaelysin family metallopeptidase 1 |
| chr2_-_187909394 | 4.80 |
ENSRNOT00000032355
|
Rab25
|
RAB25, member RAS oncogene family |
| chr14_+_86414949 | 4.80 |
ENSRNOT00000083394
ENSRNOT00000057199 |
LOC103693780
|
2-oxoglutarate dehydrogenase, mitochondrial-like |
| chr8_-_25904564 | 4.77 |
ENSRNOT00000082744
ENSRNOT00000064783 |
Tbx20
|
T-box 20 |
| chr16_+_82184387 | 4.76 |
ENSRNOT00000089329
ENSRNOT00000068416 |
Tubgcp3
|
tubulin, gamma complex associated protein 3 |
| chr3_+_94530586 | 4.67 |
ENSRNOT00000067860
|
Cstf3
|
cleavage stimulation factor subunit 3 |
| chr1_+_261415191 | 4.66 |
ENSRNOT00000083287
ENSRNOT00000040740 |
Zfyve27
|
zinc finger FYVE-type containing 27 |
| chr4_+_21872856 | 4.64 |
ENSRNOT00000044810
|
Dmtf1
|
cyclin D binding myb-like transcription factor 1 |
| chr12_+_504007 | 4.57 |
ENSRNOT00000001475
|
Brca2
|
BRCA2, DNA repair associated |
| chr15_-_43733182 | 4.54 |
ENSRNOT00000015318
|
Ppp2r2a
|
protein phosphatase 2, regulatory subunit B, alpha |
Network of associatons between targets according to the STRING database.

First level regulatory network of Atf7_E4f1
Gene Ontology Analysis
Gene overrepresentation in biological process category:
| Log-likelihood per target | Total log-likelihood | Term | Description |
|---|---|---|---|
| 11.1 | 33.3 | GO:1903774 | positive regulation of viral budding via host ESCRT complex(GO:1903774) |
| 10.4 | 31.2 | GO:1901856 | negative regulation of cellular respiration(GO:1901856) |
| 8.7 | 34.9 | GO:0045903 | positive regulation of translational fidelity(GO:0045903) |
| 8.5 | 33.8 | GO:0002337 | B-1a B cell differentiation(GO:0002337) |
| 7.9 | 55.3 | GO:0032483 | regulation of Rab protein signal transduction(GO:0032483) |
| 7.7 | 46.2 | GO:0071314 | cellular response to cocaine(GO:0071314) |
| 6.5 | 19.6 | GO:1902527 | positive regulation of protein monoubiquitination(GO:1902527) |
| 6.2 | 18.7 | GO:0045065 | cytotoxic T cell differentiation(GO:0045065) |
| 5.5 | 16.6 | GO:0003330 | regulation of extracellular matrix constituent secretion(GO:0003330) positive regulation of extracellular matrix constituent secretion(GO:0003331) |
| 5.4 | 21.5 | GO:0034696 | response to prostaglandin F(GO:0034696) |
| 5.2 | 20.8 | GO:0032911 | negative regulation of transforming growth factor beta1 production(GO:0032911) |
| 5.1 | 56.1 | GO:0090073 | positive regulation of protein homodimerization activity(GO:0090073) |
| 4.8 | 14.4 | GO:0060383 | positive regulation of DNA strand elongation(GO:0060383) |
| 4.5 | 22.6 | GO:2000301 | negative regulation of synaptic vesicle exocytosis(GO:2000301) |
| 4.3 | 12.9 | GO:0007161 | calcium-independent cell-matrix adhesion(GO:0007161) interaction with other organism via secreted substance involved in symbiotic interaction(GO:0052047) regulation of transforming growth factor-beta secretion(GO:2001201) |
| 4.0 | 24.3 | GO:2000503 | positive regulation of natural killer cell chemotaxis(GO:2000503) |
| 4.0 | 11.9 | GO:0007066 | female meiosis sister chromatid cohesion(GO:0007066) |
| 3.9 | 67.0 | GO:0045653 | negative regulation of megakaryocyte differentiation(GO:0045653) |
| 3.7 | 11.0 | GO:0000973 | posttranscriptional tethering of RNA polymerase II gene DNA at nuclear periphery(GO:0000973) |
| 3.2 | 12.9 | GO:0006616 | SRP-dependent cotranslational protein targeting to membrane, translocation(GO:0006616) |
| 3.2 | 22.2 | GO:0000022 | mitotic spindle elongation(GO:0000022) mitotic spindle midzone assembly(GO:0051256) |
| 3.2 | 12.7 | GO:0090290 | positive regulation of osteoclast proliferation(GO:0090290) negative regulation of bone mineralization involved in bone maturation(GO:1900158) |
| 3.1 | 9.4 | GO:0046167 | glycerol-3-phosphate biosynthetic process(GO:0046167) |
| 3.1 | 15.4 | GO:0032792 | negative regulation of CREB transcription factor activity(GO:0032792) |
| 3.0 | 9.1 | GO:1904685 | positive regulation of metalloendopeptidase activity(GO:1904685) |
| 2.9 | 8.7 | GO:0019287 | isopentenyl diphosphate biosynthetic process, mevalonate pathway(GO:0019287) |
| 2.8 | 11.1 | GO:0048294 | regulation of mast cell cytokine production(GO:0032763) negative regulation of isotype switching to IgE isotypes(GO:0048294) |
| 2.8 | 8.3 | GO:1900739 | regulation of protein insertion into mitochondrial membrane involved in apoptotic signaling pathway(GO:1900739) positive regulation of protein insertion into mitochondrial membrane involved in apoptotic signaling pathway(GO:1900740) |
| 2.7 | 16.1 | GO:1901970 | positive regulation of mitotic metaphase/anaphase transition(GO:0045842) positive regulation of attachment of spindle microtubules to kinetochore(GO:0051987) positive regulation of mitotic sister chromatid separation(GO:1901970) positive regulation of metaphase/anaphase transition of cell cycle(GO:1902101) |
| 2.6 | 10.5 | GO:0048319 | notochord formation(GO:0014028) axial mesoderm morphogenesis(GO:0048319) negative regulation of lymphangiogenesis(GO:1901491) |
| 2.6 | 10.5 | GO:0060298 | positive regulation of sarcomere organization(GO:0060298) |
| 2.6 | 7.7 | GO:1903660 | negative regulation of complement-dependent cytotoxicity(GO:1903660) |
| 2.6 | 10.2 | GO:1904426 | positive regulation of GTP binding(GO:1904426) |
| 2.6 | 15.3 | GO:1903142 | positive regulation of endothelial cell development(GO:1901552) positive regulation of establishment of endothelial barrier(GO:1903142) |
| 2.5 | 7.5 | GO:1900864 | mitochondrial tRNA modification(GO:0070900) mitochondrial RNA modification(GO:1900864) |
| 2.3 | 6.9 | GO:0033540 | fatty acid beta-oxidation using acyl-CoA oxidase(GO:0033540) |
| 2.2 | 6.6 | GO:0019244 | lactate biosynthetic process from pyruvate(GO:0019244) positive regulation of inositol 1,4,5-trisphosphate-sensitive calcium-release channel activity(GO:0031587) |
| 2.2 | 17.2 | GO:1903026 | negative regulation of RNA polymerase II regulatory region sequence-specific DNA binding(GO:1903026) |
| 2.1 | 10.6 | GO:0032707 | negative regulation of interleukin-23 production(GO:0032707) |
| 2.1 | 25.4 | GO:0060213 | regulation of nuclear-transcribed mRNA poly(A) tail shortening(GO:0060211) positive regulation of nuclear-transcribed mRNA poly(A) tail shortening(GO:0060213) |
| 2.1 | 8.3 | GO:1902775 | mitochondrial large ribosomal subunit assembly(GO:1902775) |
| 2.1 | 6.2 | GO:1902167 | positive regulation of intrinsic apoptotic signaling pathway in response to DNA damage by p53 class mediator(GO:1902167) |
| 2.0 | 21.8 | GO:0051798 | positive regulation of hair follicle development(GO:0051798) |
| 1.8 | 19.5 | GO:0090231 | regulation of spindle checkpoint(GO:0090231) regulation of mitotic cell cycle spindle assembly checkpoint(GO:0090266) regulation of mitotic spindle checkpoint(GO:1903504) |
| 1.8 | 5.3 | GO:2000660 | negative regulation of chemokine biosynthetic process(GO:0045079) negative regulation of interleukin-1-mediated signaling pathway(GO:2000660) |
| 1.8 | 5.3 | GO:0034140 | negative regulation of toll-like receptor 3 signaling pathway(GO:0034140) |
| 1.7 | 5.2 | GO:0090669 | telomerase RNA stabilization(GO:0090669) |
| 1.7 | 6.6 | GO:0061534 | gamma-aminobutyric acid secretion, neurotransmission(GO:0061534) |
| 1.6 | 4.9 | GO:0044208 | 'de novo' AMP biosynthetic process(GO:0044208) |
| 1.6 | 9.6 | GO:0002943 | tRNA dihydrouridine synthesis(GO:0002943) |
| 1.6 | 4.8 | GO:0021524 | visceral motor neuron differentiation(GO:0021524) |
| 1.5 | 4.6 | GO:0090172 | meiotic metaphase I plate congression(GO:0043060) microtubule cytoskeleton organization involved in homologous chromosome segregation(GO:0090172) |
| 1.5 | 10.6 | GO:0006384 | transcription initiation from RNA polymerase III promoter(GO:0006384) |
| 1.5 | 10.2 | GO:0006268 | DNA unwinding involved in DNA replication(GO:0006268) |
| 1.5 | 4.4 | GO:0000720 | pyrimidine dimer repair by nucleotide-excision repair(GO:0000720) |
| 1.4 | 5.7 | GO:0060702 | negative regulation of ribonuclease activity(GO:0060701) negative regulation of endoribonuclease activity(GO:0060702) |
| 1.4 | 5.7 | GO:0090666 | scaRNA localization to Cajal body(GO:0090666) |
| 1.4 | 4.2 | GO:0021538 | epithalamus development(GO:0021538) habenula development(GO:0021986) |
| 1.4 | 37.4 | GO:0070979 | protein K11-linked ubiquitination(GO:0070979) |
| 1.4 | 9.5 | GO:0071460 | microspike assembly(GO:0030035) cellular response to cell-matrix adhesion(GO:0071460) |
| 1.3 | 20.2 | GO:0032688 | negative regulation of interferon-beta production(GO:0032688) |
| 1.3 | 4.0 | GO:0021569 | rhombomere 3 development(GO:0021569) |
| 1.3 | 9.2 | GO:0006621 | protein retention in ER lumen(GO:0006621) |
| 1.3 | 9.2 | GO:0006207 | 'de novo' pyrimidine nucleobase biosynthetic process(GO:0006207) pyrimidine nucleobase biosynthetic process(GO:0019856) |
| 1.3 | 10.1 | GO:0016584 | maintenance of DNA methylation(GO:0010216) nucleosome positioning(GO:0016584) |
| 1.3 | 8.8 | GO:1901030 | positive regulation of mitochondrial outer membrane permeabilization involved in apoptotic signaling pathway(GO:1901030) |
| 1.2 | 5.9 | GO:0090168 | Golgi reassembly(GO:0090168) |
| 1.2 | 9.3 | GO:0008635 | activation of cysteine-type endopeptidase activity involved in apoptotic process by cytochrome c(GO:0008635) |
| 1.1 | 6.8 | GO:0006113 | fermentation(GO:0006113) glucose catabolic process to lactate(GO:0019659) glycolytic fermentation(GO:0019660) glucose catabolic process to lactate via pyruvate(GO:0019661) |
| 1.1 | 3.3 | GO:0007571 | age-dependent response to oxidative stress(GO:0001306) age-dependent general metabolic decline(GO:0007571) |
| 1.1 | 6.5 | GO:0015842 | aminergic neurotransmitter loading into synaptic vesicle(GO:0015842) |
| 1.1 | 8.6 | GO:0046116 | queuosine biosynthetic process(GO:0008616) queuosine metabolic process(GO:0046116) |
| 1.1 | 7.5 | GO:0006824 | cobalt ion transport(GO:0006824) |
| 1.1 | 11.8 | GO:0060040 | retinal bipolar neuron differentiation(GO:0060040) |
| 1.1 | 6.3 | GO:0045901 | regulation of translational termination(GO:0006449) positive regulation of translational elongation(GO:0045901) |
| 1.0 | 3.1 | GO:1903860 | negative regulation of neuron maturation(GO:0014043) negative regulation of dendrite extension(GO:1903860) |
| 1.0 | 6.0 | GO:0015074 | DNA integration(GO:0015074) |
| 1.0 | 16.4 | GO:0080182 | histone H3-K4 trimethylation(GO:0080182) |
| 1.0 | 4.8 | GO:0061034 | olfactory bulb mitral cell layer development(GO:0061034) |
| 0.9 | 3.8 | GO:0043137 | DNA replication, removal of RNA primer(GO:0043137) |
| 0.9 | 16.5 | GO:0019886 | antigen processing and presentation of exogenous peptide antigen via MHC class II(GO:0019886) |
| 0.9 | 3.6 | GO:0035513 | oxidative RNA demethylation(GO:0035513) oxidative single-stranded RNA demethylation(GO:0035553) |
| 0.9 | 8.1 | GO:0002329 | pre-B cell differentiation(GO:0002329) |
| 0.9 | 13.5 | GO:0035518 | histone H2A monoubiquitination(GO:0035518) |
| 0.9 | 1.8 | GO:0032202 | telomere assembly(GO:0032202) |
| 0.9 | 2.7 | GO:0009240 | isopentenyl diphosphate biosynthetic process(GO:0009240) isopentenyl diphosphate metabolic process(GO:0046490) |
| 0.9 | 2.6 | GO:0071586 | CAAX-box protein processing(GO:0071586) CAAX-box protein maturation(GO:0080120) |
| 0.9 | 2.6 | GO:0046601 | positive regulation of centriole replication(GO:0046601) |
| 0.8 | 5.0 | GO:0006642 | triglyceride mobilization(GO:0006642) |
| 0.8 | 2.5 | GO:0018312 | peptidyl-serine ADP-ribosylation(GO:0018312) |
| 0.8 | 7.3 | GO:0032790 | ribosome disassembly(GO:0032790) |
| 0.8 | 4.8 | GO:0051415 | interphase microtubule nucleation by interphase microtubule organizing center(GO:0051415) microtubule nucleation by microtubule organizing center(GO:0051418) |
| 0.8 | 3.9 | GO:0070940 | dephosphorylation of RNA polymerase II C-terminal domain(GO:0070940) |
| 0.8 | 0.8 | GO:0018307 | enzyme active site formation(GO:0018307) |
| 0.8 | 3.8 | GO:0018243 | protein O-linked glycosylation via threonine(GO:0018243) |
| 0.7 | 5.2 | GO:0021796 | cerebral cortex regionalization(GO:0021796) |
| 0.7 | 3.0 | GO:0038158 | granulocyte colony-stimulating factor signaling pathway(GO:0038158) |
| 0.7 | 5.8 | GO:0006983 | ER overload response(GO:0006983) |
| 0.7 | 3.5 | GO:0070127 | tRNA aminoacylation for mitochondrial protein translation(GO:0070127) |
| 0.7 | 6.2 | GO:0034058 | endosomal vesicle fusion(GO:0034058) |
| 0.7 | 13.0 | GO:0090161 | Golgi ribbon formation(GO:0090161) |
| 0.7 | 3.4 | GO:0060112 | generation of ovulation cycle rhythm(GO:0060112) |
| 0.7 | 4.7 | GO:0071787 | endoplasmic reticulum tubular network assembly(GO:0071787) |
| 0.7 | 17.2 | GO:0072520 | seminiferous tubule development(GO:0072520) |
| 0.7 | 2.0 | GO:0061084 | negative regulation of protein refolding(GO:0061084) |
| 0.6 | 9.7 | GO:0009263 | deoxyribonucleotide biosynthetic process(GO:0009263) |
| 0.6 | 9.8 | GO:0097091 | synaptic vesicle clustering(GO:0097091) |
| 0.6 | 4.3 | GO:1901503 | ether lipid biosynthetic process(GO:0008611) glycerol ether biosynthetic process(GO:0046504) ether biosynthetic process(GO:1901503) |
| 0.6 | 3.6 | GO:1904424 | regulation of GTP binding(GO:1904424) |
| 0.6 | 3.6 | GO:0051365 | cellular response to potassium ion starvation(GO:0051365) |
| 0.6 | 3.5 | GO:0042796 | snRNA transcription from RNA polymerase III promoter(GO:0042796) |
| 0.6 | 6.5 | GO:0043983 | histone H4-K12 acetylation(GO:0043983) |
| 0.6 | 7.4 | GO:1904262 | negative regulation of TORC1 signaling(GO:1904262) |
| 0.5 | 2.2 | GO:0021526 | medial motor column neuron differentiation(GO:0021526) |
| 0.5 | 3.2 | GO:0035188 | blastocyst hatching(GO:0001835) hatching(GO:0035188) organism emergence from protective structure(GO:0071684) |
| 0.5 | 4.2 | GO:0060501 | positive regulation of epithelial cell proliferation involved in lung morphogenesis(GO:0060501) |
| 0.5 | 1.6 | GO:0036451 | cap mRNA methylation(GO:0036451) |
| 0.5 | 5.2 | GO:0014883 | transition between fast and slow fiber(GO:0014883) |
| 0.5 | 5.6 | GO:0034982 | mitochondrial protein processing(GO:0034982) |
| 0.5 | 5.1 | GO:0021520 | spinal cord motor neuron cell fate specification(GO:0021520) |
| 0.5 | 2.0 | GO:0042695 | thelarche(GO:0042695) mammary gland branching involved in thelarche(GO:0060744) |
| 0.5 | 1.0 | GO:0019042 | viral latency(GO:0019042) release from viral latency(GO:0019046) |
| 0.5 | 20.5 | GO:0031018 | endocrine pancreas development(GO:0031018) |
| 0.5 | 2.8 | GO:0038169 | somatostatin receptor signaling pathway(GO:0038169) somatostatin signaling pathway(GO:0038170) |
| 0.5 | 1.4 | GO:2000681 | negative regulation of rubidium ion transport(GO:2000681) negative regulation of rubidium ion transmembrane transporter activity(GO:2000687) |
| 0.5 | 1.4 | GO:0044375 | regulation of peroxisome size(GO:0044375) |
| 0.5 | 1.4 | GO:1905245 | regulation of aspartic-type endopeptidase activity involved in amyloid precursor protein catabolic process(GO:1902959) positive regulation of aspartic-type endopeptidase activity involved in amyloid precursor protein catabolic process(GO:1902961) regulation of metalloendopeptidase activity involved in amyloid precursor protein catabolic process(GO:1902962) negative regulation of metalloendopeptidase activity involved in amyloid precursor protein catabolic process(GO:1902963) regulation of aspartic-type peptidase activity(GO:1905245) positive regulation of aspartic-type peptidase activity(GO:1905247) |
| 0.5 | 4.6 | GO:0033148 | positive regulation of intracellular estrogen receptor signaling pathway(GO:0033148) |
| 0.5 | 4.5 | GO:0034472 | snRNA 3'-end processing(GO:0034472) |
| 0.4 | 13.1 | GO:0032728 | positive regulation of interferon-beta production(GO:0032728) |
| 0.4 | 3.5 | GO:0006578 | amino-acid betaine biosynthetic process(GO:0006578) |
| 0.4 | 5.2 | GO:1902231 | positive regulation of intrinsic apoptotic signaling pathway in response to DNA damage(GO:1902231) |
| 0.4 | 4.8 | GO:0010044 | response to aluminum ion(GO:0010044) |
| 0.4 | 4.0 | GO:0051152 | positive regulation of smooth muscle cell differentiation(GO:0051152) |
| 0.4 | 2.4 | GO:1903593 | regulation of histamine secretion by mast cell(GO:1903593) |
| 0.4 | 1.6 | GO:0010032 | meiotic chromosome condensation(GO:0010032) |
| 0.4 | 4.9 | GO:0061014 | positive regulation of mRNA catabolic process(GO:0061014) |
| 0.4 | 11.1 | GO:0036075 | endochondral ossification(GO:0001958) replacement ossification(GO:0036075) |
| 0.4 | 7.0 | GO:0006120 | mitochondrial electron transport, NADH to ubiquinone(GO:0006120) |
| 0.4 | 5.1 | GO:0019985 | translesion synthesis(GO:0019985) |
| 0.4 | 9.9 | GO:0006379 | mRNA cleavage(GO:0006379) |
| 0.4 | 3.9 | GO:0006123 | mitochondrial electron transport, cytochrome c to oxygen(GO:0006123) |
| 0.4 | 3.2 | GO:0090091 | positive regulation of extracellular matrix disassembly(GO:0090091) |
| 0.3 | 12.4 | GO:0019433 | triglyceride catabolic process(GO:0019433) |
| 0.3 | 3.0 | GO:0051382 | kinetochore assembly(GO:0051382) kinetochore organization(GO:0051383) |
| 0.3 | 16.3 | GO:0006182 | cGMP biosynthetic process(GO:0006182) |
| 0.3 | 3.3 | GO:0060965 | negative regulation of gene silencing by miRNA(GO:0060965) |
| 0.3 | 1.3 | GO:0090204 | protein localization to nuclear pore(GO:0090204) |
| 0.3 | 3.5 | GO:0030277 | maintenance of gastrointestinal epithelium(GO:0030277) |
| 0.3 | 13.5 | GO:0000462 | maturation of SSU-rRNA from tricistronic rRNA transcript (SSU-rRNA, 5.8S rRNA, LSU-rRNA)(GO:0000462) |
| 0.3 | 0.9 | GO:0021699 | cerebellar cortex maturation(GO:0021699) |
| 0.3 | 4.8 | GO:0031268 | pseudopodium organization(GO:0031268) |
| 0.3 | 3.5 | GO:0000083 | regulation of transcription involved in G1/S transition of mitotic cell cycle(GO:0000083) |
| 0.3 | 3.8 | GO:0034508 | centromere complex assembly(GO:0034508) |
| 0.3 | 5.4 | GO:0060218 | hematopoietic stem cell differentiation(GO:0060218) |
| 0.3 | 2.0 | GO:0006610 | ribosomal protein import into nucleus(GO:0006610) |
| 0.3 | 2.7 | GO:0035562 | negative regulation of chromatin binding(GO:0035562) |
| 0.3 | 3.7 | GO:0031167 | rRNA methylation(GO:0031167) |
| 0.3 | 1.8 | GO:0090070 | positive regulation of ribosome biogenesis(GO:0090070) positive regulation of rRNA processing(GO:2000234) |
| 0.3 | 8.4 | GO:0045070 | positive regulation of viral genome replication(GO:0045070) |
| 0.3 | 5.3 | GO:0032516 | positive regulation of phosphoprotein phosphatase activity(GO:0032516) |
| 0.2 | 0.7 | GO:0000738 | DNA catabolic process, exonucleolytic(GO:0000738) |
| 0.2 | 1.5 | GO:0007042 | lysosomal lumen acidification(GO:0007042) |
| 0.2 | 10.9 | GO:0045604 | regulation of epidermal cell differentiation(GO:0045604) |
| 0.2 | 2.0 | GO:0060017 | parathyroid gland development(GO:0060017) |
| 0.2 | 0.2 | GO:1903210 | glomerular visceral epithelial cell apoptotic process(GO:1903210) |
| 0.2 | 8.3 | GO:0001510 | RNA methylation(GO:0001510) |
| 0.2 | 1.0 | GO:0000972 | transcription-dependent tethering of RNA polymerase II gene DNA at nuclear periphery(GO:0000972) |
| 0.2 | 6.2 | GO:0006198 | cAMP catabolic process(GO:0006198) |
| 0.2 | 8.9 | GO:0010501 | RNA secondary structure unwinding(GO:0010501) |
| 0.2 | 2.3 | GO:0007020 | microtubule nucleation(GO:0007020) |
| 0.2 | 19.4 | GO:0045814 | negative regulation of gene expression, epigenetic(GO:0045814) |
| 0.2 | 0.7 | GO:0048696 | regulation of collateral sprouting in absence of injury(GO:0048696) |
| 0.2 | 3.8 | GO:0048172 | regulation of short-term neuronal synaptic plasticity(GO:0048172) |
| 0.2 | 0.4 | GO:2000286 | receptor internalization involved in canonical Wnt signaling pathway(GO:2000286) |
| 0.2 | 4.5 | GO:0016226 | iron-sulfur cluster assembly(GO:0016226) metallo-sulfur cluster assembly(GO:0031163) |
| 0.2 | 0.4 | GO:2000384 | regulation of ectoderm development(GO:2000383) negative regulation of ectoderm development(GO:2000384) |
| 0.2 | 1.4 | GO:0060373 | regulation of ventricular cardiac muscle cell membrane depolarization(GO:0060373) |
| 0.2 | 2.6 | GO:0006071 | glycerol metabolic process(GO:0006071) |
| 0.2 | 6.7 | GO:0032508 | DNA duplex unwinding(GO:0032508) |
| 0.2 | 1.2 | GO:0006102 | isocitrate metabolic process(GO:0006102) |
| 0.2 | 2.4 | GO:0015693 | magnesium ion transport(GO:0015693) |
| 0.2 | 1.8 | GO:0030953 | astral microtubule organization(GO:0030953) |
| 0.2 | 4.1 | GO:0035641 | locomotory exploration behavior(GO:0035641) |
| 0.2 | 3.3 | GO:0090557 | establishment of endothelial intestinal barrier(GO:0090557) |
| 0.2 | 4.0 | GO:1902230 | negative regulation of intrinsic apoptotic signaling pathway in response to DNA damage(GO:1902230) |
| 0.2 | 4.4 | GO:0000188 | inactivation of MAPK activity(GO:0000188) |
| 0.2 | 0.3 | GO:1990646 | cellular response to prolactin(GO:1990646) |
| 0.2 | 13.1 | GO:0010923 | negative regulation of phosphatase activity(GO:0010923) |
| 0.2 | 8.5 | GO:0009268 | response to pH(GO:0009268) |
| 0.2 | 7.2 | GO:0097421 | liver regeneration(GO:0097421) |
| 0.1 | 2.0 | GO:0048026 | positive regulation of mRNA splicing, via spliceosome(GO:0048026) |
| 0.1 | 0.4 | GO:0031989 | bombesin receptor signaling pathway(GO:0031989) |
| 0.1 | 0.5 | GO:0051958 | methotrexate transport(GO:0051958) |
| 0.1 | 4.4 | GO:0031648 | protein destabilization(GO:0031648) |
| 0.1 | 8.0 | GO:0051225 | spindle assembly(GO:0051225) |
| 0.1 | 4.0 | GO:0048384 | retinoic acid receptor signaling pathway(GO:0048384) |
| 0.1 | 6.7 | GO:0010833 | telomere maintenance via telomere lengthening(GO:0010833) |
| 0.1 | 3.1 | GO:0034204 | lipid translocation(GO:0034204) |
| 0.1 | 10.9 | GO:0043484 | regulation of RNA splicing(GO:0043484) |
| 0.1 | 4.2 | GO:1903959 | regulation of anion transmembrane transport(GO:1903959) |
| 0.1 | 3.8 | GO:1903146 | regulation of mitophagy(GO:1903146) |
| 0.1 | 1.9 | GO:0048147 | negative regulation of fibroblast proliferation(GO:0048147) |
| 0.1 | 0.4 | GO:0002877 | regulation of acute inflammatory response to non-antigenic stimulus(GO:0002877) regulation of heart rate by chemical signal(GO:0003062) |
| 0.1 | 10.3 | GO:0050728 | negative regulation of inflammatory response(GO:0050728) |
| 0.1 | 0.9 | GO:1901096 | regulation of autophagosome maturation(GO:1901096) |
| 0.1 | 5.7 | GO:0000186 | activation of MAPKK activity(GO:0000186) |
| 0.1 | 1.4 | GO:0071157 | negative regulation of cell cycle arrest(GO:0071157) |
| 0.1 | 4.4 | GO:0043154 | negative regulation of cysteine-type endopeptidase activity involved in apoptotic process(GO:0043154) |
| 0.1 | 1.9 | GO:0071425 | hematopoietic stem cell proliferation(GO:0071425) |
| 0.1 | 0.6 | GO:0035308 | negative regulation of protein dephosphorylation(GO:0035308) |
| 0.1 | 3.4 | GO:0030968 | endoplasmic reticulum unfolded protein response(GO:0030968) |
| 0.1 | 3.8 | GO:0006893 | Golgi to plasma membrane transport(GO:0006893) |
| 0.1 | 24.5 | GO:0019221 | cytokine-mediated signaling pathway(GO:0019221) |
| 0.1 | 0.6 | GO:0034551 | respiratory chain complex III assembly(GO:0017062) mitochondrial respiratory chain complex III assembly(GO:0034551) |
| 0.1 | 2.2 | GO:0042462 | eye photoreceptor cell development(GO:0042462) |
| 0.1 | 0.8 | GO:0030490 | maturation of SSU-rRNA(GO:0030490) |
| 0.1 | 1.1 | GO:0016578 | histone deubiquitination(GO:0016578) |
| 0.1 | 0.7 | GO:0042487 | regulation of odontogenesis of dentin-containing tooth(GO:0042487) sebaceous gland development(GO:0048733) |
| 0.1 | 1.7 | GO:1903861 | regulation of dendrite extension(GO:1903859) positive regulation of dendrite extension(GO:1903861) |
| 0.1 | 4.0 | GO:1903749 | positive regulation of establishment of protein localization to mitochondrion(GO:1903749) |
| 0.1 | 0.2 | GO:0043923 | positive regulation by host of viral transcription(GO:0043923) |
| 0.1 | 7.4 | GO:0008213 | protein methylation(GO:0006479) protein alkylation(GO:0008213) |
| 0.1 | 1.1 | GO:0033327 | Leydig cell differentiation(GO:0033327) |
| 0.1 | 10.3 | GO:0010466 | negative regulation of peptidase activity(GO:0010466) |
| 0.1 | 30.3 | GO:0006412 | translation(GO:0006412) |
| 0.1 | 4.2 | GO:0003333 | amino acid transmembrane transport(GO:0003333) |
| 0.1 | 5.5 | GO:0006633 | fatty acid biosynthetic process(GO:0006633) |
| 0.0 | 2.3 | GO:0030433 | ER-associated ubiquitin-dependent protein catabolic process(GO:0030433) |
| 0.0 | 1.1 | GO:0051491 | positive regulation of filopodium assembly(GO:0051491) |
| 0.0 | 1.2 | GO:0000413 | protein peptidyl-prolyl isomerization(GO:0000413) |
| 0.0 | 1.4 | GO:0032233 | positive regulation of actin filament bundle assembly(GO:0032233) |
| 0.0 | 1.3 | GO:0043966 | histone H3 acetylation(GO:0043966) |
| 0.0 | 2.0 | GO:0032259 | methylation(GO:0032259) |
| 0.0 | 0.7 | GO:0050873 | brown fat cell differentiation(GO:0050873) |
| 0.0 | 4.7 | GO:0006869 | lipid transport(GO:0006869) |
| 0.0 | 0.2 | GO:1901976 | regulation of cell cycle checkpoint(GO:1901976) |
| 0.0 | 0.3 | GO:0045116 | protein neddylation(GO:0045116) |
| 0.0 | 0.5 | GO:0006879 | cellular iron ion homeostasis(GO:0006879) |
| 0.0 | 0.6 | GO:0032570 | response to progesterone(GO:0032570) |
| 0.0 | 7.2 | GO:0043547 | positive regulation of GTPase activity(GO:0043547) |
| 0.0 | 0.3 | GO:0003094 | glomerular filtration(GO:0003094) |
| 0.0 | 0.5 | GO:0071427 | mRNA export from nucleus(GO:0006406) mRNA-containing ribonucleoprotein complex export from nucleus(GO:0071427) |
| 0.0 | 0.1 | GO:0010758 | regulation of macrophage chemotaxis(GO:0010758) |
Gene overrepresentation in cellular component category:
| Log-likelihood per target | Total log-likelihood | Term | Description |
|---|---|---|---|
| 15.4 | 46.1 | GO:0097124 | cyclin A2-CDK2 complex(GO:0097124) |
| 3.7 | 33.3 | GO:0000813 | ESCRT I complex(GO:0000813) |
| 2.7 | 13.5 | GO:0030689 | Noc complex(GO:0030689) |
| 2.4 | 9.7 | GO:0005971 | ribonucleoside-diphosphate reductase complex(GO:0005971) |
| 2.4 | 67.0 | GO:0000788 | nuclear nucleosome(GO:0000788) |
| 2.4 | 11.9 | GO:0033063 | Rad51B-Rad51C-Rad51D-XRCC2 complex(GO:0033063) Holliday junction resolvase complex(GO:0048476) |
| 2.4 | 9.5 | GO:0044393 | microspike(GO:0044393) |
| 2.2 | 20.2 | GO:0033256 | I-kappaB/NF-kappaB complex(GO:0033256) |
| 2.2 | 33.3 | GO:1990023 | mitotic spindle midzone(GO:1990023) |
| 1.9 | 5.6 | GO:0005745 | m-AAA complex(GO:0005745) |
| 1.8 | 5.3 | GO:0005896 | interleukin-6 receptor complex(GO:0005896) |
| 1.7 | 5.2 | GO:0071148 | TEAD-1-YAP complex(GO:0071148) |
| 1.6 | 16.2 | GO:0070187 | telosome(GO:0070187) |
| 1.6 | 12.9 | GO:0005577 | fibrinogen complex(GO:0005577) |
| 1.6 | 4.8 | GO:0008275 | gamma-tubulin small complex(GO:0008275) |
| 1.5 | 7.7 | GO:0034751 | aryl hydrocarbon receptor complex(GO:0034751) |
| 1.5 | 16.9 | GO:0042555 | MCM complex(GO:0042555) |
| 1.5 | 7.6 | GO:0044614 | nuclear pore cytoplasmic filaments(GO:0044614) |
| 1.5 | 13.5 | GO:0030688 | preribosome, small subunit precursor(GO:0030688) |
| 1.4 | 19.6 | GO:0030127 | COPII vesicle coat(GO:0030127) |
| 1.3 | 9.4 | GO:0001739 | sex chromatin(GO:0001739) |
| 1.3 | 21.5 | GO:0031011 | Ino80 complex(GO:0031011) DNA helicase complex(GO:0033202) |
| 1.3 | 16.4 | GO:0072357 | PTW/PP1 phosphatase complex(GO:0072357) |
| 1.3 | 6.3 | GO:0005642 | annulate lamellae(GO:0005642) |
| 1.2 | 16.6 | GO:0044232 | organelle membrane contact site(GO:0044232) |
| 1.1 | 12.3 | GO:0072546 | ER membrane protein complex(GO:0072546) |
| 1.0 | 16.5 | GO:0042613 | MHC class II protein complex(GO:0042613) |
| 1.0 | 5.1 | GO:0031465 | Cul4B-RING E3 ubiquitin ligase complex(GO:0031465) |
| 1.0 | 5.9 | GO:0089701 | U2AF(GO:0089701) |
| 0.9 | 6.6 | GO:0071598 | neuronal ribonucleoprotein granule(GO:0071598) |
| 0.9 | 3.5 | GO:0035363 | histone locus body(GO:0035363) |
| 0.8 | 4.2 | GO:0031467 | Cul7-RING ubiquitin ligase complex(GO:0031467) |
| 0.8 | 2.4 | GO:0000172 | ribonuclease MRP complex(GO:0000172) |
| 0.8 | 59.2 | GO:0022627 | cytosolic small ribosomal subunit(GO:0022627) |
| 0.8 | 7.6 | GO:0070652 | HAUS complex(GO:0070652) |
| 0.8 | 10.6 | GO:0060091 | kinocilium(GO:0060091) |
| 0.7 | 2.2 | GO:0033165 | interphotoreceptor matrix(GO:0033165) |
| 0.7 | 17.0 | GO:0030687 | preribosome, large subunit precursor(GO:0030687) |
| 0.7 | 6.2 | GO:0033263 | CORVET complex(GO:0033263) |
| 0.7 | 11.9 | GO:0070971 | endoplasmic reticulum exit site(GO:0070971) |
| 0.7 | 16.3 | GO:0008074 | guanylate cyclase complex, soluble(GO:0008074) |
| 0.6 | 4.7 | GO:0032584 | growth cone membrane(GO:0032584) |
| 0.6 | 43.0 | GO:0005811 | lipid particle(GO:0005811) |
| 0.5 | 3.6 | GO:0000322 | storage vacuole(GO:0000322) |
| 0.5 | 4.1 | GO:0072669 | tRNA-splicing ligase complex(GO:0072669) |
| 0.5 | 2.6 | GO:0098536 | deuterosome(GO:0098536) |
| 0.5 | 11.3 | GO:0016327 | apicolateral plasma membrane(GO:0016327) |
| 0.5 | 4.2 | GO:0090576 | RNA polymerase III transcription factor complex(GO:0090576) |
| 0.5 | 10.2 | GO:0005775 | vacuolar lumen(GO:0005775) |
| 0.5 | 4.1 | GO:0019907 | cyclin-dependent protein kinase activating kinase holoenzyme complex(GO:0019907) |
| 0.5 | 3.2 | GO:0030981 | cortical microtubule cytoskeleton(GO:0030981) |
| 0.4 | 6.6 | GO:0071437 | invadopodium(GO:0071437) |
| 0.4 | 18.4 | GO:0031941 | filamentous actin(GO:0031941) |
| 0.4 | 5.7 | GO:0002199 | zona pellucida receptor complex(GO:0002199) |
| 0.4 | 3.9 | GO:0016461 | unconventional myosin complex(GO:0016461) |
| 0.4 | 3.3 | GO:0031314 | extrinsic component of mitochondrial inner membrane(GO:0031314) |
| 0.4 | 4.9 | GO:0000177 | cytoplasmic exosome (RNase complex)(GO:0000177) |
| 0.4 | 3.2 | GO:0000974 | Prp19 complex(GO:0000974) |
| 0.4 | 8.5 | GO:0080008 | Cul4-RING E3 ubiquitin ligase complex(GO:0080008) |
| 0.4 | 4.8 | GO:0031143 | pseudopodium(GO:0031143) |
| 0.3 | 1.9 | GO:0070847 | core mediator complex(GO:0070847) |
| 0.3 | 5.7 | GO:0005852 | eukaryotic translation initiation factor 3 complex(GO:0005852) |
| 0.3 | 1.5 | GO:0000220 | vacuolar proton-transporting V-type ATPase, V0 domain(GO:0000220) |
| 0.3 | 21.8 | GO:0045095 | keratin filament(GO:0045095) |
| 0.3 | 14.4 | GO:0000795 | synaptonemal complex(GO:0000795) |
| 0.3 | 4.5 | GO:0032039 | integrator complex(GO:0032039) |
| 0.3 | 1.3 | GO:0008622 | epsilon DNA polymerase complex(GO:0008622) |
| 0.3 | 12.3 | GO:0009295 | nucleoid(GO:0009295) mitochondrial nucleoid(GO:0042645) |
| 0.3 | 23.8 | GO:0070469 | respiratory chain(GO:0070469) |
| 0.2 | 5.2 | GO:0000407 | pre-autophagosomal structure(GO:0000407) |
| 0.2 | 13.2 | GO:0072686 | mitotic spindle(GO:0072686) |
| 0.2 | 16.0 | GO:0000118 | histone deacetylase complex(GO:0000118) |
| 0.2 | 3.4 | GO:0035327 | transcriptionally active chromatin(GO:0035327) |
| 0.2 | 1.6 | GO:0000796 | condensin complex(GO:0000796) |
| 0.2 | 1.5 | GO:0005869 | dynactin complex(GO:0005869) |
| 0.2 | 18.0 | GO:0022626 | cytosolic ribosome(GO:0022626) |
| 0.2 | 1.4 | GO:0097418 | neurofibrillary tangle(GO:0097418) |
| 0.2 | 17.9 | GO:0000793 | condensed chromosome(GO:0000793) |
| 0.2 | 5.8 | GO:0032281 | AMPA glutamate receptor complex(GO:0032281) |
| 0.2 | 2.8 | GO:0031235 | intrinsic component of the cytoplasmic side of the plasma membrane(GO:0031235) |
| 0.2 | 46.1 | GO:0000790 | nuclear chromatin(GO:0000790) |
| 0.2 | 9.0 | GO:0005657 | replication fork(GO:0005657) |
| 0.1 | 2.4 | GO:0008250 | oligosaccharyltransferase complex(GO:0008250) |
| 0.1 | 5.6 | GO:0016592 | mediator complex(GO:0016592) |
| 0.1 | 6.0 | GO:0016235 | aggresome(GO:0016235) |
| 0.1 | 3.5 | GO:0033116 | endoplasmic reticulum-Golgi intermediate compartment membrane(GO:0033116) |
| 0.1 | 1.4 | GO:0008385 | IkappaB kinase complex(GO:0008385) |
| 0.1 | 9.7 | GO:0048770 | melanosome(GO:0042470) pigment granule(GO:0048770) |
| 0.1 | 19.7 | GO:0005777 | peroxisome(GO:0005777) microbody(GO:0042579) |
| 0.1 | 1.3 | GO:0032541 | cortical endoplasmic reticulum(GO:0032541) |
| 0.1 | 8.5 | GO:0000123 | histone acetyltransferase complex(GO:0000123) |
| 0.1 | 3.3 | GO:0000786 | nucleosome(GO:0000786) |
| 0.1 | 29.8 | GO:0016607 | nuclear speck(GO:0016607) |
| 0.1 | 0.5 | GO:0044615 | nuclear pore nuclear basket(GO:0044615) |
| 0.1 | 0.9 | GO:0030008 | TRAPP complex(GO:0030008) |
| 0.1 | 0.3 | GO:0005846 | nuclear cap binding complex(GO:0005846) |
| 0.1 | 5.0 | GO:0000781 | chromosome, telomeric region(GO:0000781) |
| 0.1 | 1.4 | GO:0001518 | voltage-gated sodium channel complex(GO:0001518) |
| 0.1 | 3.2 | GO:0017053 | transcriptional repressor complex(GO:0017053) |
| 0.1 | 4.1 | GO:0000922 | spindle pole(GO:0000922) |
| 0.1 | 1.9 | GO:0005876 | spindle microtubule(GO:0005876) |
| 0.1 | 10.5 | GO:0030027 | lamellipodium(GO:0030027) |
| 0.1 | 4.4 | GO:0031225 | anchored component of membrane(GO:0031225) |
| 0.1 | 5.8 | GO:0005791 | rough endoplasmic reticulum(GO:0005791) |
| 0.1 | 6.5 | GO:0043195 | terminal bouton(GO:0043195) |
| 0.1 | 18.7 | GO:0009897 | external side of plasma membrane(GO:0009897) |
| 0.1 | 14.1 | GO:0005759 | mitochondrial matrix(GO:0005759) |
| 0.1 | 0.3 | GO:0000815 | ESCRT III complex(GO:0000815) |
| 0.1 | 10.5 | GO:0005813 | centrosome(GO:0005813) |
| 0.0 | 13.2 | GO:0016324 | apical plasma membrane(GO:0016324) |
| 0.0 | 2.4 | GO:0005840 | ribosome(GO:0005840) |
| 0.0 | 0.8 | GO:0000159 | protein phosphatase type 2A complex(GO:0000159) |
| 0.0 | 53.4 | GO:0005739 | mitochondrion(GO:0005739) |
| 0.0 | 4.7 | GO:0005681 | spliceosomal complex(GO:0005681) |
| 0.0 | 3.1 | GO:0045177 | apical part of cell(GO:0045177) |
| 0.0 | 8.1 | GO:0034702 | ion channel complex(GO:0034702) |
| 0.0 | 1.1 | GO:0032587 | ruffle membrane(GO:0032587) |
| 0.0 | 2.5 | GO:0055037 | recycling endosome(GO:0055037) |
| 0.0 | 0.4 | GO:0046930 | pore complex(GO:0046930) |
| 0.0 | 2.0 | GO:0034399 | nuclear periphery(GO:0034399) |
| 0.0 | 32.5 | GO:0005794 | Golgi apparatus(GO:0005794) |
| 0.0 | 2.5 | GO:0036064 | ciliary basal body(GO:0036064) |
| 0.0 | 4.5 | GO:0031012 | extracellular matrix(GO:0031012) |
| 0.0 | 1.1 | GO:0000785 | chromatin(GO:0000785) |
| 0.0 | 35.3 | GO:0005654 | nucleoplasm(GO:0005654) |
| 0.0 | 27.9 | GO:0005615 | extracellular space(GO:0005615) |
| 0.0 | 8.1 | GO:0005783 | endoplasmic reticulum(GO:0005783) |
Gene overrepresentation in molecular function category:
| Log-likelihood per target | Total log-likelihood | Term | Description |
|---|---|---|---|
| 8.5 | 33.8 | GO:0001225 | RNA polymerase II transcription coactivator binding(GO:0001225) |
| 7.0 | 34.9 | GO:1990932 | 5.8S rRNA binding(GO:1990932) |
| 6.0 | 18.1 | GO:0008330 | protein tyrosine/threonine phosphatase activity(GO:0008330) |
| 5.7 | 17.2 | GO:0031177 | phosphopantetheine binding(GO:0031177) |
| 4.0 | 24.3 | GO:0031726 | CCR1 chemokine receptor binding(GO:0031726) |
| 3.6 | 21.8 | GO:0042289 | MHC class II protein binding(GO:0042289) |
| 3.6 | 14.4 | GO:1990955 | G-rich single-stranded DNA binding(GO:1990955) |
| 3.2 | 66.7 | GO:0031996 | thioesterase binding(GO:0031996) |
| 3.1 | 9.4 | GO:0004370 | glycerol kinase activity(GO:0004370) |
| 2.6 | 10.5 | GO:0004687 | myosin light chain kinase activity(GO:0004687) |
| 2.6 | 7.7 | GO:0002134 | UTP binding(GO:0002134) sulfonylurea receptor binding(GO:0017098) pyrimidine ribonucleoside binding(GO:0032551) |
| 2.5 | 29.5 | GO:0005172 | vascular endothelial growth factor receptor binding(GO:0005172) |
| 2.3 | 6.9 | GO:0050253 | retinyl-palmitate esterase activity(GO:0050253) |
| 2.2 | 11.2 | GO:0051880 | G-quadruplex DNA binding(GO:0051880) |
| 2.2 | 6.5 | GO:0015222 | serotonin transmembrane transporter activity(GO:0015222) |
| 2.0 | 8.2 | GO:0001156 | TFIIIC-class transcription factor binding(GO:0001156) |
| 2.0 | 11.9 | GO:0000150 | recombinase activity(GO:0000150) |
| 1.9 | 7.5 | GO:0015087 | cobalt ion transmembrane transporter activity(GO:0015087) |
| 1.8 | 12.9 | GO:0045340 | mercury ion binding(GO:0045340) |
| 1.8 | 21.5 | GO:0000400 | four-way junction DNA binding(GO:0000400) |
| 1.8 | 16.1 | GO:0043515 | kinetochore binding(GO:0043515) |
| 1.7 | 15.4 | GO:0008140 | cAMP response element binding protein binding(GO:0008140) |
| 1.7 | 6.8 | GO:0004459 | L-lactate dehydrogenase activity(GO:0004459) |
| 1.6 | 9.7 | GO:0016728 | ribonucleoside-diphosphate reductase activity, thioredoxin disulfide as acceptor(GO:0004748) oxidoreductase activity, acting on CH or CH2 groups, disulfide as acceptor(GO:0016728) ribonucleoside-diphosphate reductase activity(GO:0061731) |
| 1.6 | 9.6 | GO:0017150 | tRNA dihydrouridine synthase activity(GO:0017150) |
| 1.6 | 71.4 | GO:0017112 | Rab guanyl-nucleotide exchange factor activity(GO:0017112) |
| 1.5 | 4.6 | GO:0010484 | H3 histone acetyltransferase activity(GO:0010484) |
| 1.5 | 7.5 | GO:0009019 | tRNA (guanine-N1-)-methyltransferase activity(GO:0009019) |
| 1.5 | 46.1 | GO:0097472 | cyclin-dependent protein kinase activity(GO:0097472) |
| 1.4 | 14.4 | GO:0038036 | sphingosine-1-phosphate receptor activity(GO:0038036) |
| 1.4 | 5.7 | GO:0060698 | endoribonuclease inhibitor activity(GO:0060698) |
| 1.4 | 6.9 | GO:0003997 | acyl-CoA oxidase activity(GO:0003997) |
| 1.4 | 5.5 | GO:0019166 | trans-2-enoyl-CoA reductase (NADPH) activity(GO:0019166) |
| 1.4 | 4.1 | GO:0003945 | N-acetyllactosamine synthase activity(GO:0003945) |
| 1.3 | 34.9 | GO:0004709 | MAP kinase kinase kinase activity(GO:0004709) |
| 1.2 | 3.7 | GO:0000179 | rRNA (adenine-N6,N6-)-dimethyltransferase activity(GO:0000179) |
| 1.2 | 3.6 | GO:0004507 | steroid 11-beta-monooxygenase activity(GO:0004507) corticosterone 18-monooxygenase activity(GO:0047783) |
| 1.2 | 5.9 | GO:0050733 | RS domain binding(GO:0050733) |
| 1.2 | 15.3 | GO:0003688 | DNA replication origin binding(GO:0003688) |
| 1.1 | 20.3 | GO:0051010 | microtubule plus-end binding(GO:0051010) |
| 1.1 | 37.1 | GO:0061631 | ubiquitin conjugating enzyme activity(GO:0061631) |
| 1.0 | 9.1 | GO:0031730 | CCR5 chemokine receptor binding(GO:0031730) |
| 1.0 | 3.0 | GO:0051916 | granulocyte colony-stimulating factor binding(GO:0051916) |
| 0.9 | 11.1 | GO:0001161 | intronic transcription regulatory region sequence-specific DNA binding(GO:0001161) |
| 0.9 | 3.6 | GO:0035515 | oxidative RNA demethylase activity(GO:0035515) |
| 0.9 | 16.3 | GO:0015643 | toxic substance binding(GO:0015643) |
| 0.8 | 8.3 | GO:0008649 | rRNA methyltransferase activity(GO:0008649) |
| 0.8 | 6.6 | GO:0034452 | dynactin binding(GO:0034452) |
| 0.8 | 19.6 | GO:0004198 | calcium-dependent cysteine-type endopeptidase activity(GO:0004198) |
| 0.8 | 2.4 | GO:0000171 | ribonuclease MRP activity(GO:0000171) |
| 0.8 | 6.3 | GO:0017070 | U6 snRNA binding(GO:0017070) |
| 0.8 | 5.3 | GO:0005138 | interleukin-6 receptor binding(GO:0005138) |
| 0.8 | 3.8 | GO:0004523 | RNA-DNA hybrid ribonuclease activity(GO:0004523) |
| 0.7 | 7.3 | GO:0043023 | ribosomal large subunit binding(GO:0043023) |
| 0.7 | 3.5 | GO:0046923 | ER retention sequence binding(GO:0046923) |
| 0.7 | 9.5 | GO:0008484 | sulfuric ester hydrolase activity(GO:0008484) |
| 0.7 | 2.7 | GO:0004452 | isopentenyl-diphosphate delta-isomerase activity(GO:0004452) |
| 0.7 | 2.0 | GO:0032564 | dATP binding(GO:0032564) |
| 0.7 | 16.4 | GO:0042800 | histone methyltransferase activity (H3-K4 specific)(GO:0042800) |
| 0.7 | 6.5 | GO:0003691 | double-stranded telomeric DNA binding(GO:0003691) |
| 0.6 | 12.7 | GO:0048018 | receptor agonist activity(GO:0048018) |
| 0.6 | 8.1 | GO:0005225 | volume-sensitive anion channel activity(GO:0005225) |
| 0.6 | 1.9 | GO:0043812 | phosphatidylinositol-4-phosphate phosphatase activity(GO:0043812) |
| 0.6 | 16.6 | GO:0004181 | metallocarboxypeptidase activity(GO:0004181) |
| 0.6 | 6.1 | GO:1990381 | ubiquitin-specific protease binding(GO:1990381) |
| 0.6 | 2.9 | GO:0004427 | inorganic diphosphatase activity(GO:0004427) |
| 0.6 | 28.8 | GO:0008138 | protein tyrosine/serine/threonine phosphatase activity(GO:0008138) |
| 0.5 | 41.0 | GO:0048306 | calcium-dependent protein binding(GO:0048306) |
| 0.5 | 1.6 | GO:0004483 | mRNA (nucleoside-2'-O-)-methyltransferase activity(GO:0004483) |
| 0.5 | 10.2 | GO:0001134 | transcription factor activity, transcription factor recruiting(GO:0001134) |
| 0.5 | 23.1 | GO:0031491 | nucleosome binding(GO:0031491) |
| 0.5 | 8.8 | GO:0001618 | virus receptor activity(GO:0001618) |
| 0.5 | 2.8 | GO:0004994 | somatostatin receptor activity(GO:0004994) |
| 0.5 | 9.1 | GO:0017056 | structural constituent of nuclear pore(GO:0017056) |
| 0.4 | 4.8 | GO:0051011 | microtubule minus-end binding(GO:0051011) |
| 0.4 | 4.7 | GO:0097027 | ubiquitin-protein transferase activator activity(GO:0097027) |
| 0.4 | 16.5 | GO:0042605 | peptide antigen binding(GO:0042605) |
| 0.4 | 9.0 | GO:0070006 | metalloaminopeptidase activity(GO:0070006) |
| 0.4 | 78.5 | GO:0042393 | histone binding(GO:0042393) |
| 0.4 | 1.2 | GO:0051538 | 3 iron, 4 sulfur cluster binding(GO:0051538) |
| 0.4 | 2.2 | GO:1990247 | N6-methyladenosine-containing RNA binding(GO:1990247) |
| 0.4 | 3.2 | GO:0000014 | single-stranded DNA endodeoxyribonuclease activity(GO:0000014) |
| 0.4 | 6.1 | GO:0005537 | mannose binding(GO:0005537) |
| 0.3 | 49.6 | GO:0001078 | transcriptional repressor activity, RNA polymerase II core promoter proximal region sequence-specific binding(GO:0001078) |
| 0.3 | 3.8 | GO:0004653 | polypeptide N-acetylgalactosaminyltransferase activity(GO:0004653) |
| 0.3 | 3.4 | GO:0035497 | cAMP response element binding(GO:0035497) |
| 0.3 | 5.5 | GO:0004806 | triglyceride lipase activity(GO:0004806) |
| 0.3 | 1.1 | GO:0061676 | importin-alpha family protein binding(GO:0061676) |
| 0.3 | 4.5 | GO:0048156 | tau protein binding(GO:0048156) |
| 0.3 | 8.8 | GO:0001102 | RNA polymerase II activating transcription factor binding(GO:0001102) |
| 0.3 | 6.2 | GO:0048027 | mRNA 5'-UTR binding(GO:0048027) |
| 0.3 | 5.2 | GO:0070717 | poly-purine tract binding(GO:0070717) |
| 0.3 | 2.5 | GO:0003910 | DNA ligase activity(GO:0003909) DNA ligase (ATP) activity(GO:0003910) |
| 0.3 | 4.5 | GO:0097602 | cullin family protein binding(GO:0097602) |
| 0.3 | 5.2 | GO:0042975 | peroxisome proliferator activated receptor binding(GO:0042975) |
| 0.3 | 17.2 | GO:0004004 | RNA helicase activity(GO:0003724) ATP-dependent RNA helicase activity(GO:0004004) RNA-dependent ATPase activity(GO:0008186) |
| 0.3 | 2.3 | GO:0034450 | ubiquitin-ubiquitin ligase activity(GO:0034450) |
| 0.3 | 7.0 | GO:0008137 | NADH dehydrogenase (ubiquinone) activity(GO:0008137) NADH dehydrogenase (quinone) activity(GO:0050136) |
| 0.3 | 0.8 | GO:0004792 | thiosulfate sulfurtransferase activity(GO:0004792) |
| 0.3 | 3.3 | GO:0035925 | mRNA 3'-UTR AU-rich region binding(GO:0035925) |
| 0.2 | 4.2 | GO:0005247 | voltage-gated chloride channel activity(GO:0005247) |
| 0.2 | 23.0 | GO:0004896 | cytokine receptor activity(GO:0004896) |
| 0.2 | 23.3 | GO:0003705 | transcription factor activity, RNA polymerase II distal enhancer sequence-specific binding(GO:0003705) |
| 0.2 | 3.5 | GO:0004029 | aldehyde dehydrogenase (NAD) activity(GO:0004029) |
| 0.2 | 13.2 | GO:0009055 | electron carrier activity(GO:0009055) |
| 0.2 | 9.2 | GO:0016831 | carboxy-lyase activity(GO:0016831) |
| 0.2 | 8.7 | GO:0016776 | phosphotransferase activity, phosphate group as acceptor(GO:0016776) |
| 0.2 | 1.7 | GO:0050321 | tau-protein kinase activity(GO:0050321) |
| 0.2 | 3.1 | GO:0016709 | oxidoreductase activity, acting on paired donors, with incorporation or reduction of molecular oxygen, NAD(P)H as one donor, and incorporation of one atom of oxygen(GO:0016709) |
| 0.2 | 10.9 | GO:0051018 | protein kinase A binding(GO:0051018) |
| 0.2 | 7.7 | GO:0001965 | G-protein alpha-subunit binding(GO:0001965) |
| 0.2 | 16.8 | GO:0051082 | unfolded protein binding(GO:0051082) |
| 0.2 | 7.2 | GO:0003899 | DNA-directed RNA polymerase activity(GO:0003899) |
| 0.2 | 3.3 | GO:0070300 | phosphatidic acid binding(GO:0070300) |
| 0.2 | 4.8 | GO:0016620 | oxidoreductase activity, acting on the aldehyde or oxo group of donors, NAD or NADP as acceptor(GO:0016620) |
| 0.2 | 2.4 | GO:0004579 | oligosaccharyl transferase activity(GO:0004576) dolichyl-diphosphooligosaccharide-protein glycotransferase activity(GO:0004579) |
| 0.2 | 1.4 | GO:0086006 | voltage-gated sodium channel activity involved in cardiac muscle cell action potential(GO:0086006) |
| 0.2 | 3.8 | GO:0031489 | myosin V binding(GO:0031489) |
| 0.2 | 2.2 | GO:0019841 | retinol binding(GO:0019841) |
| 0.2 | 25.4 | GO:0001047 | core promoter binding(GO:0001047) |
| 0.2 | 41.5 | GO:0003735 | structural constituent of ribosome(GO:0003735) |
| 0.2 | 2.6 | GO:0004659 | prenyltransferase activity(GO:0004659) |
| 0.2 | 4.2 | GO:0036002 | pre-mRNA binding(GO:0036002) |
| 0.1 | 48.3 | GO:0045296 | cadherin binding(GO:0045296) |
| 0.1 | 0.4 | GO:0004946 | bombesin receptor activity(GO:0004946) |
| 0.1 | 5.3 | GO:0031593 | polyubiquitin binding(GO:0031593) |
| 0.1 | 4.3 | GO:0030331 | estrogen receptor binding(GO:0030331) |
| 0.1 | 0.5 | GO:0015350 | methotrexate transporter activity(GO:0015350) |
| 0.1 | 6.2 | GO:0001227 | transcriptional repressor activity, RNA polymerase II transcription regulatory region sequence-specific binding(GO:0001227) |
| 0.1 | 2.5 | GO:0004177 | aminopeptidase activity(GO:0004177) |
| 0.1 | 2.8 | GO:0004012 | phospholipid-translocating ATPase activity(GO:0004012) |
| 0.1 | 6.2 | GO:0005160 | transforming growth factor beta receptor binding(GO:0005160) |
| 0.1 | 2.2 | GO:0003950 | NAD+ ADP-ribosyltransferase activity(GO:0003950) |
| 0.1 | 7.7 | GO:0050660 | flavin adenine dinucleotide binding(GO:0050660) |
| 0.1 | 2.4 | GO:0017075 | syntaxin-1 binding(GO:0017075) |
| 0.1 | 5.9 | GO:0016765 | transferase activity, transferring alkyl or aryl (other than methyl) groups(GO:0016765) |
| 0.1 | 1.3 | GO:0010485 | H4 histone acetyltransferase activity(GO:0010485) |
| 0.1 | 3.5 | GO:0071855 | neuropeptide receptor binding(GO:0071855) |
| 0.1 | 1.9 | GO:0042162 | telomeric DNA binding(GO:0042162) |
| 0.1 | 19.2 | GO:0008022 | protein C-terminus binding(GO:0008022) |
| 0.1 | 0.6 | GO:0019870 | potassium channel inhibitor activity(GO:0019870) |
| 0.1 | 4.7 | GO:0043621 | protein self-association(GO:0043621) |
| 0.1 | 2.0 | GO:0008139 | nuclear localization sequence binding(GO:0008139) |
| 0.1 | 4.9 | GO:0016879 | ligase activity, forming carbon-nitrogen bonds(GO:0016879) |
| 0.1 | 96.6 | GO:0003723 | RNA binding(GO:0003723) |
| 0.1 | 9.4 | GO:0008168 | methyltransferase activity(GO:0008168) |
| 0.1 | 0.4 | GO:0070137 | ubiquitin-like protein-specific endopeptidase activity(GO:0070137) SUMO-specific endopeptidase activity(GO:0070139) |
| 0.1 | 1.5 | GO:0046961 | proton-transporting ATPase activity, rotational mechanism(GO:0046961) |
| 0.1 | 11.8 | GO:0061630 | ubiquitin protein ligase activity(GO:0061630) |
| 0.1 | 1.8 | GO:0035257 | nuclear hormone receptor binding(GO:0035257) |
| 0.1 | 7.6 | GO:0008083 | growth factor activity(GO:0008083) |
| 0.1 | 0.9 | GO:0001106 | RNA polymerase II transcription corepressor activity(GO:0001106) |
| 0.1 | 7.0 | GO:0008237 | metallopeptidase activity(GO:0008237) |
| 0.1 | 1.1 | GO:0043325 | phosphatidylinositol-3,4-bisphosphate binding(GO:0043325) |
| 0.0 | 10.3 | GO:0030414 | peptidase inhibitor activity(GO:0030414) |
| 0.0 | 3.6 | GO:0005089 | Rho guanyl-nucleotide exchange factor activity(GO:0005089) |
| 0.0 | 0.3 | GO:0004716 | receptor signaling protein tyrosine kinase activity(GO:0004716) |
| 0.0 | 1.3 | GO:0001786 | phosphatidylserine binding(GO:0001786) |
| 0.0 | 0.9 | GO:0008483 | transaminase activity(GO:0008483) |
| 0.0 | 1.2 | GO:0003755 | peptidyl-prolyl cis-trans isomerase activity(GO:0003755) cis-trans isomerase activity(GO:0016859) |
| 0.0 | 0.4 | GO:0042813 | Wnt-activated receptor activity(GO:0042813) |
| 0.0 | 0.2 | GO:0042809 | vitamin D receptor binding(GO:0042809) |
| 0.0 | 16.2 | GO:0001071 | nucleic acid binding transcription factor activity(GO:0001071) transcription factor activity, sequence-specific DNA binding(GO:0003700) |
| 0.0 | 0.3 | GO:0031210 | phosphatidylcholine binding(GO:0031210) |
| 0.0 | 0.3 | GO:0004115 | 3',5'-cyclic-AMP phosphodiesterase activity(GO:0004115) |
| 0.0 | 5.5 | GO:0046982 | protein heterodimerization activity(GO:0046982) |
| 0.0 | 2.2 | GO:0004252 | serine-type endopeptidase activity(GO:0004252) |
Gene overrepresentation in curated gene sets: canonical pathways category:
| Log-likelihood per target | Total log-likelihood | Term | Description |
|---|---|---|---|
| 2.7 | 46.1 | SA REG CASCADE OF CYCLIN EXPR | Expression of cyclins regulates progression through the cell cycle by activating cyclin-dependent kinases. |
| 2.0 | 5.9 | PID P38 ALPHA BETA PATHWAY | Regulation of p38-alpha and p38-beta |
| 1.4 | 22.6 | PID TCR RAS PATHWAY | Ras signaling in the CD4+ TCR pathway |
| 1.3 | 32.5 | PID S1P S1P2 PATHWAY | S1P2 pathway |
| 1.2 | 68.5 | PID TAP63 PATHWAY | Validated transcriptional targets of TAp63 isoforms |
| 1.1 | 42.2 | PID FRA PATHWAY | Validated transcriptional targets of AP1 family members Fra1 and Fra2 |
| 1.0 | 72.3 | PID IL12 2PATHWAY | IL12-mediated signaling events |
| 0.8 | 21.2 | PID VEGFR1 PATHWAY | VEGFR1 specific signals |
| 0.8 | 25.0 | PID FOXM1 PATHWAY | FOXM1 transcription factor network |
| 0.7 | 12.9 | PID INTEGRIN5 PATHWAY | Beta5 beta6 beta7 and beta8 integrin cell surface interactions |
| 0.7 | 31.0 | PID PLK1 PATHWAY | PLK1 signaling events |
| 0.6 | 26.3 | PID MTOR 4PATHWAY | mTOR signaling pathway |
| 0.6 | 31.0 | PID LKB1 PATHWAY | LKB1 signaling events |
| 0.6 | 20.5 | ST P38 MAPK PATHWAY | p38 MAPK Pathway |
| 0.4 | 47.5 | PID P53 DOWNSTREAM PATHWAY | Direct p53 effectors |
| 0.4 | 6.7 | PID SMAD2 3PATHWAY | Regulation of cytoplasmic and nuclear SMAD2/3 signaling |
| 0.4 | 19.7 | PID REG GR PATHWAY | Glucocorticoid receptor regulatory network |
| 0.3 | 17.5 | PID TELOMERASE PATHWAY | Regulation of Telomerase |
| 0.3 | 4.4 | PID IL23 PATHWAY | IL23-mediated signaling events |
| 0.3 | 5.6 | PID BETA CATENIN DEG PATHWAY | Degradation of beta catenin |
| 0.3 | 10.2 | PID ATR PATHWAY | ATR signaling pathway |
| 0.3 | 19.2 | PID HDAC CLASSI PATHWAY | Signaling events mediated by HDAC Class I |
| 0.3 | 12.9 | PID E2F PATHWAY | E2F transcription factor network |
| 0.3 | 18.7 | PID ERBB1 DOWNSTREAM PATHWAY | ErbB1 downstream signaling |
| 0.2 | 3.0 | PID GMCSF PATHWAY | GMCSF-mediated signaling events |
| 0.2 | 3.6 | PID AURORA A PATHWAY | Aurora A signaling |
| 0.2 | 7.7 | PID VEGFR1 2 PATHWAY | Signaling events mediated by VEGFR1 and VEGFR2 |
| 0.1 | 2.0 | PID ERBB NETWORK PATHWAY | ErbB receptor signaling network |
| 0.1 | 8.1 | PID ERA GENOMIC PATHWAY | Validated nuclear estrogen receptor alpha network |
| 0.1 | 1.9 | PID TCR CALCIUM PATHWAY | Calcium signaling in the CD4+ TCR pathway |
| 0.1 | 1.7 | ST GA12 PATHWAY | G alpha 12 Pathway |
| 0.1 | 4.1 | PID TGFBR PATHWAY | TGF-beta receptor signaling |
| 0.1 | 5.3 | PID CXCR4 PATHWAY | CXCR4-mediated signaling events |
| 0.1 | 1.9 | PID ARF 3PATHWAY | Arf1 pathway |
| 0.1 | 5.1 | PID HIF1 TFPATHWAY | HIF-1-alpha transcription factor network |
| 0.1 | 1.1 | PID PI3KCI PATHWAY | Class I PI3K signaling events |
| 0.1 | 0.7 | PID PRL SIGNALING EVENTS PATHWAY | Signaling events mediated by PRL |
| 0.1 | 0.2 | SA G2 AND M PHASES | Cdc25 activates the cdc2/cyclin B complex to induce the G2/M transition. |
| 0.0 | 0.4 | PID WNT NONCANONICAL PATHWAY | Noncanonical Wnt signaling pathway |
| 0.0 | 0.3 | ST JNK MAPK PATHWAY | JNK MAPK Pathway |
| 0.0 | 0.5 | PID AP1 PATHWAY | AP-1 transcription factor network |
| 0.0 | 0.4 | ST WNT BETA CATENIN PATHWAY | Wnt/beta-catenin Pathway |
Gene overrepresentation in curated gene sets: REACTOME pathways category:
| Log-likelihood per target | Total log-likelihood | Term | Description |
|---|---|---|---|
| 3.7 | 33.3 | REACTOME MEMBRANE BINDING AND TARGETTING OF GAG PROTEINS | Genes involved in Membrane binding and targetting of GAG proteins |
| 2.9 | 46.1 | REACTOME CYCLIN A B1 ASSOCIATED EVENTS DURING G2 M TRANSITION | Genes involved in Cyclin A/B1 associated events during G2/M transition |
| 1.6 | 18.9 | REACTOME SPRY REGULATION OF FGF SIGNALING | Genes involved in Spry regulation of FGF signaling |
| 1.5 | 16.9 | REACTOME UNWINDING OF DNA | Genes involved in Unwinding of DNA |
| 1.2 | 14.4 | REACTOME IL 6 SIGNALING | Genes involved in Interleukin-6 signaling |
| 1.1 | 25.0 | REACTOME SEMA3A PAK DEPENDENT AXON REPULSION | Genes involved in Sema3A PAK dependent Axon repulsion |
| 1.1 | 59.2 | REACTOME FORMATION OF THE TERNARY COMPLEX AND SUBSEQUENTLY THE 43S COMPLEX | Genes involved in Formation of the ternary complex, and subsequently, the 43S complex |
| 1.1 | 16.4 | REACTOME DOPAMINE NEUROTRANSMITTER RELEASE CYCLE | Genes involved in Dopamine Neurotransmitter Release Cycle |
| 1.0 | 9.5 | REACTOME THE ACTIVATION OF ARYLSULFATASES | Genes involved in The activation of arylsulfatases |
| 0.8 | 20.8 | REACTOME NEPHRIN INTERACTIONS | Genes involved in Nephrin interactions |
| 0.8 | 12.9 | REACTOME GRB2 SOS PROVIDES LINKAGE TO MAPK SIGNALING FOR INTERGRINS | Genes involved in GRB2:SOS provides linkage to MAPK signaling for Intergrins |
| 0.8 | 19.5 | REACTOME PACKAGING OF TELOMERE ENDS | Genes involved in Packaging Of Telomere Ends |
| 0.5 | 21.4 | REACTOME REGULATION OF BETA CELL DEVELOPMENT | Genes involved in Regulation of beta-cell development |
| 0.5 | 19.7 | REACTOME MEIOTIC RECOMBINATION | Genes involved in Meiotic Recombination |
| 0.5 | 4.8 | REACTOME RECRUITMENT OF NUMA TO MITOTIC CENTROSOMES | Genes involved in Recruitment of NuMA to mitotic centrosomes |
| 0.5 | 11.4 | REACTOME CHOLESTEROL BIOSYNTHESIS | Genes involved in Cholesterol biosynthesis |
| 0.5 | 9.7 | REACTOME SYNTHESIS AND INTERCONVERSION OF NUCLEOTIDE DI AND TRIPHOSPHATES | Genes involved in Synthesis and interconversion of nucleotide di- and triphosphates |
| 0.5 | 14.8 | REACTOME KINESINS | Genes involved in Kinesins |
| 0.5 | 6.3 | REACTOME PTM GAMMA CARBOXYLATION HYPUSINE FORMATION AND ARYLSULFATASE ACTIVATION | Genes involved in PTM: gamma carboxylation, hypusine formation and arylsulfatase activation |
| 0.4 | 4.9 | REACTOME PURINE RIBONUCLEOSIDE MONOPHOSPHATE BIOSYNTHESIS | Genes involved in Purine ribonucleoside monophosphate biosynthesis |
| 0.4 | 8.3 | REACTOME ACTIVATION OF BH3 ONLY PROTEINS | Genes involved in Activation of BH3-only proteins |
| 0.4 | 5.9 | REACTOME RAP1 SIGNALLING | Genes involved in Rap1 signalling |
| 0.4 | 4.5 | REACTOME ACTIVATION OF THE MRNA UPON BINDING OF THE CAP BINDING COMPLEX AND EIFS AND SUBSEQUENT BINDING TO 43S | Genes involved in Activation of the mRNA upon binding of the cap-binding complex and eIFs, and subsequent binding to 43S |
| 0.4 | 18.7 | REACTOME IMMUNOREGULATORY INTERACTIONS BETWEEN A LYMPHOID AND A NON LYMPHOID CELL | Genes involved in Immunoregulatory interactions between a Lymphoid and a non-Lymphoid cell |
| 0.4 | 15.1 | REACTOME MRNA 3 END PROCESSING | Genes involved in mRNA 3'-end processing |
| 0.4 | 5.0 | REACTOME SYNTHESIS OF PE | Genes involved in Synthesis of PE |
| 0.3 | 9.2 | REACTOME PYRIMIDINE METABOLISM | Genes involved in Pyrimidine metabolism |
| 0.3 | 6.9 | REACTOME PEROXISOMAL LIPID METABOLISM | Genes involved in Peroxisomal lipid metabolism |
| 0.3 | 10.2 | REACTOME TIGHT JUNCTION INTERACTIONS | Genes involved in Tight junction interactions |
| 0.2 | 4.1 | REACTOME N GLYCAN ANTENNAE ELONGATION | Genes involved in N-Glycan antennae elongation |
| 0.2 | 18.1 | REACTOME NONSENSE MEDIATED DECAY ENHANCED BY THE EXON JUNCTION COMPLEX | Genes involved in Nonsense Mediated Decay Enhanced by the Exon Junction Complex |
| 0.2 | 6.4 | REACTOME ASSOCIATION OF TRIC CCT WITH TARGET PROTEINS DURING BIOSYNTHESIS | Genes involved in Association of TriC/CCT with target proteins during biosynthesis |
| 0.2 | 5.2 | REACTOME DOWNREGULATION OF SMAD2 3 SMAD4 TRANSCRIPTIONAL ACTIVITY | Genes involved in Downregulation of SMAD2/3:SMAD4 transcriptional activity |
| 0.2 | 11.5 | REACTOME MITOCHONDRIAL PROTEIN IMPORT | Genes involved in Mitochondrial Protein Import |
| 0.2 | 6.4 | REACTOME RNA POL III TRANSCRIPTION INITIATION FROM TYPE 3 PROMOTER | Genes involved in RNA Polymerase III Transcription Initiation From Type 3 Promoter |
| 0.2 | 26.8 | REACTOME PPARA ACTIVATES GENE EXPRESSION | Genes involved in PPARA Activates Gene Expression |
| 0.2 | 14.5 | REACTOME RESPIRATORY ELECTRON TRANSPORT | Genes involved in Respiratory electron transport |
| 0.2 | 3.6 | REACTOME ENDOGENOUS STEROLS | Genes involved in Endogenous sterols |
| 0.2 | 9.4 | REACTOME TRIGLYCERIDE BIOSYNTHESIS | Genes involved in Triglyceride Biosynthesis |
| 0.2 | 10.8 | REACTOME CHEMOKINE RECEPTORS BIND CHEMOKINES | Genes involved in Chemokine receptors bind chemokines |
| 0.2 | 48.1 | REACTOME ANTIGEN PROCESSING UBIQUITINATION PROTEASOME DEGRADATION | Genes involved in Antigen processing: Ubiquitination & Proteasome degradation |
| 0.2 | 3.5 | REACTOME MITOCHONDRIAL TRNA AMINOACYLATION | Genes involved in Mitochondrial tRNA aminoacylation |
| 0.2 | 3.8 | REACTOME DEPOSITION OF NEW CENPA CONTAINING NUCLEOSOMES AT THE CENTROMERE | Genes involved in Deposition of New CENPA-containing Nucleosomes at the Centromere |
| 0.2 | 4.0 | REACTOME TRANSCRIPTIONAL REGULATION OF WHITE ADIPOCYTE DIFFERENTIATION | Genes involved in Transcriptional Regulation of White Adipocyte Differentiation |
| 0.2 | 3.9 | REACTOME SMOOTH MUSCLE CONTRACTION | Genes involved in Smooth Muscle Contraction |
| 0.1 | 10.9 | REACTOME FACTORS INVOLVED IN MEGAKARYOCYTE DEVELOPMENT AND PLATELET PRODUCTION | Genes involved in Factors involved in megakaryocyte development and platelet production |
| 0.1 | 13.1 | REACTOME CLASS B 2 SECRETIN FAMILY RECEPTORS | Genes involved in Class B/2 (Secretin family receptors) |
| 0.1 | 2.9 | REACTOME CYTOSOLIC TRNA AMINOACYLATION | Genes involved in Cytosolic tRNA aminoacylation |
| 0.1 | 1.7 | REACTOME SYNTHESIS OF SUBSTRATES IN N GLYCAN BIOSYTHESIS | Genes involved in Synthesis of substrates in N-glycan biosythesis |
| 0.1 | 15.3 | REACTOME G ALPHA I SIGNALLING EVENTS | Genes involved in G alpha (i) signalling events |
| 0.1 | 3.0 | REACTOME IL RECEPTOR SHC SIGNALING | Genes involved in Interleukin receptor SHC signaling |
| 0.1 | 3.8 | REACTOME REGULATION OF MRNA STABILITY BY PROTEINS THAT BIND AU RICH ELEMENTS | Genes involved in Regulation of mRNA Stability by Proteins that Bind AU-rich Elements |
| 0.1 | 1.9 | REACTOME SYNTHESIS OF PIPS AT THE GOLGI MEMBRANE | Genes involved in Synthesis of PIPs at the Golgi membrane |
| 0.1 | 4.2 | REACTOME NUCLEAR RECEPTOR TRANSCRIPTION PATHWAY | Genes involved in Nuclear Receptor transcription pathway |
| 0.1 | 2.8 | REACTOME ION TRANSPORT BY P TYPE ATPASES | Genes involved in Ion transport by P-type ATPases |
| 0.1 | 1.5 | REACTOME INSULIN RECEPTOR RECYCLING | Genes involved in Insulin receptor recycling |
| 0.1 | 1.4 | REACTOME REGULATION OF GLUCOKINASE BY GLUCOKINASE REGULATORY PROTEIN | Genes involved in Regulation of Glucokinase by Glucokinase Regulatory Protein |
| 0.0 | 1.4 | REACTOME INTERACTION BETWEEN L1 AND ANKYRINS | Genes involved in Interaction between L1 and Ankyrins |
| 0.0 | 0.3 | REACTOME VEGF LIGAND RECEPTOR INTERACTIONS | Genes involved in VEGF ligand-receptor interactions |
| 0.0 | 1.4 | REACTOME GOLGI ASSOCIATED VESICLE BIOGENESIS | Genes involved in Golgi Associated Vesicle Biogenesis |
| 0.0 | 1.3 | REACTOME METABOLISM OF VITAMINS AND COFACTORS | Genes involved in Metabolism of vitamins and cofactors |
| 0.0 | 0.3 | REACTOME ENDOSOMAL SORTING COMPLEX REQUIRED FOR TRANSPORT ESCRT | Genes involved in Endosomal Sorting Complex Required For Transport (ESCRT) |
| 0.0 | 0.2 | REACTOME BIOSYNTHESIS OF THE N GLYCAN PRECURSOR DOLICHOL LIPID LINKED OLIGOSACCHARIDE LLO AND TRANSFER TO A NASCENT PROTEIN | Genes involved in Biosynthesis of the N-glycan precursor (dolichol lipid-linked oligosaccharide, LLO) and transfer to a nascent protein |