Project
GSE53960: rat RNA-Seq transcriptomic Bodymap
Navigation
Downloads
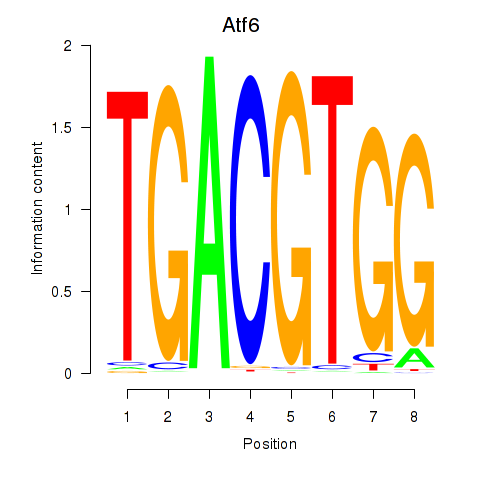
Results for Atf6
Z-value: 1.29
Motif logo
Transcription factors associated with Atf6
| Gene Symbol | Gene ID | Gene Info |
|---|---|---|
|
Atf6
|
ENSRNOG00000024632 | activating transcription factor 6 |
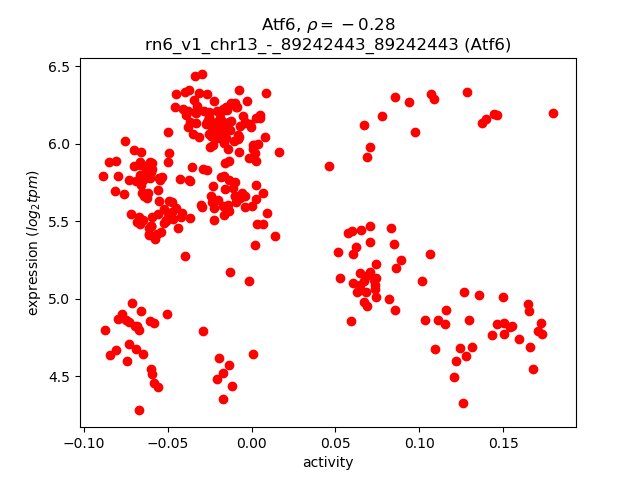
Activity-expression correlation:
| Gene | Promoter | Pearson corr. coef. | P-value | Plot |
|---|---|---|---|---|
| Atf6 | rn6_v1_chr13_-_89242443_89242443 | -0.28 | 3.5e-07 | Click! |
Activity profile of Atf6 motif
Sorted Z-values of Atf6 motif
| Promoter | Log-likelihood | Transcript | Gene | Gene Info |
|---|---|---|---|---|
| chr4_+_56711049 | 82.68 |
ENSRNOT00000027237
|
Flnc
|
filamin C |
| chr4_+_56711275 | 80.25 |
ENSRNOT00000088149
|
Flnc
|
filamin C |
| chr16_+_26906716 | 47.73 |
ENSRNOT00000064297
|
Cpe
|
carboxypeptidase E |
| chrX_+_106774980 | 38.56 |
ENSRNOT00000046091
|
Tceal7
|
transcription elongation factor A like 7 |
| chr1_-_215660492 | 38.51 |
ENSRNOT00000079442
|
AC132720.1
|
|
| chr5_+_1417478 | 37.44 |
ENSRNOT00000008153
ENSRNOT00000085564 |
Jph1
|
junctophilin 1 |
| chr12_+_37490584 | 35.26 |
ENSRNOT00000001401
ENSRNOT00000090831 |
Rilpl1
|
Rab interacting lysosomal protein-like 1 |
| chr17_-_47394231 | 35.17 |
ENSRNOT00000079368
ENSRNOT00000079216 |
Sfrp4
|
secreted frizzled-related protein 4 |
| chr8_-_116361343 | 31.75 |
ENSRNOT00000066296
|
Sema3b
|
semaphorin 3B |
| chr2_-_211017778 | 31.20 |
ENSRNOT00000026883
|
Sypl2
|
synaptophysin-like 2 |
| chr4_-_82215022 | 30.14 |
ENSRNOT00000010256
|
Hoxa11
|
homeobox A11 |
| chr7_-_2786856 | 29.09 |
ENSRNOT00000047530
ENSRNOT00000086939 |
Coq10a
|
coenzyme Q10A |
| chr1_+_199941161 | 27.91 |
ENSRNOT00000027616
|
Bag3
|
Bcl2-associated athanogene 3 |
| chr8_+_65733400 | 25.85 |
ENSRNOT00000089126
|
Uaca
|
uveal autoantigen with coiled-coil domains and ankyrin repeats |
| chr8_-_53146953 | 25.56 |
ENSRNOT00000045356
|
Zbtb16
|
zinc finger and BTB domain containing 16 |
| chr13_+_113692131 | 25.55 |
ENSRNOT00000057160
|
Cd34
|
CD34 molecule |
| chr13_+_113691932 | 24.67 |
ENSRNOT00000084709
|
Cd34
|
CD34 molecule |
| chr1_-_31055453 | 24.45 |
ENSRNOT00000031083
|
Soga3
|
SOGA family member 3 |
| chr17_-_84614228 | 22.67 |
ENSRNOT00000043042
|
AABR07028748.1
|
|
| chr6_+_53401109 | 21.90 |
ENSRNOT00000014763
|
Twist1
|
twist family bHLH transcription factor 1 |
| chr11_-_34598102 | 21.21 |
ENSRNOT00000068743
|
Pigp
|
phosphatidylinositol glycan anchor biosynthesis, class P |
| chr7_+_120749752 | 21.16 |
ENSRNOT00000087888
|
Kdelr3
|
KDEL endoplasmic reticulum protein retention receptor 3 |
| chr9_-_61810417 | 21.13 |
ENSRNOT00000020910
|
Rftn2
|
raftlin family member 2 |
| chr4_+_82300778 | 20.80 |
ENSRNOT00000075254
|
Hoxa11-as
|
homeobox A11, opposite strand |
| chr8_+_48422036 | 20.44 |
ENSRNOT00000036051
|
Usp2
|
ubiquitin specific peptidase 2 |
| chr11_-_34598275 | 20.33 |
ENSRNOT00000077233
|
Pigp
|
phosphatidylinositol glycan anchor biosynthesis, class P |
| chr2_-_52282548 | 19.78 |
ENSRNOT00000033627
|
Nnt
|
nicotinamide nucleotide transhydrogenase |
| chr1_+_78933372 | 19.75 |
ENSRNOT00000029810
|
Ccdc8
|
coiled-coil domain containing 8 |
| chr1_-_101085884 | 19.70 |
ENSRNOT00000085352
|
Rcn3
|
reticulocalbin 3 |
| chr6_-_135412312 | 19.44 |
ENSRNOT00000010610
|
Ankrd9
|
ankyrin repeat domain 9 |
| chr4_-_82300503 | 18.44 |
ENSRNOT00000071568
|
Hoxa11
|
homeobox A11 |
| chr10_-_40764185 | 17.53 |
ENSRNOT00000017486
|
Sparc
|
secreted protein acidic and cysteine rich |
| chr6_-_80107236 | 17.43 |
ENSRNOT00000006369
|
Sec23a
|
Sec23 homolog A, coat complex II component |
| chrX_+_156999826 | 17.26 |
ENSRNOT00000081819
|
Idh3g
|
isocitrate dehydrogenase 3 (NAD), gamma |
| chr5_-_64850427 | 16.71 |
ENSRNOT00000008883
|
Tmem246
|
transmembrane protein 246 |
| chr2_+_233615739 | 16.23 |
ENSRNOT00000051009
|
Pitx2
|
paired-like homeodomain 2 |
| chr3_+_112428395 | 15.86 |
ENSRNOT00000079109
ENSRNOT00000048141 |
Stard9
|
StAR-related lipid transfer domain containing 9 |
| chr2_-_231521052 | 15.49 |
ENSRNOT00000089534
ENSRNOT00000080470 ENSRNOT00000084756 |
Ank2
|
ankyrin 2 |
| chr1_-_101086198 | 15.13 |
ENSRNOT00000027917
|
Rcn3
|
reticulocalbin 3 |
| chr9_-_115555261 | 15.04 |
ENSRNOT00000056366
|
Ptprm
|
protein tyrosine phosphatase, receptor type, M |
| chr13_+_80125391 | 14.81 |
ENSRNOT00000044190
|
Mir199a2
|
microRNA 199a-2 |
| chr7_-_58286770 | 14.70 |
ENSRNOT00000005258
|
Rab21
|
RAB21, member RAS oncogene family |
| chr9_-_55673704 | 14.28 |
ENSRNOT00000066231
ENSRNOT00000081677 |
Tmeff2
|
transmembrane protein with EGF-like and two follistatin-like domains 2 |
| chr8_-_25904564 | 14.01 |
ENSRNOT00000082744
ENSRNOT00000064783 |
Tbx20
|
T-box 20 |
| chr19_-_22632071 | 13.87 |
ENSRNOT00000077275
|
Gpt2
|
glutamic--pyruvic transaminase 2 |
| chr8_-_116045954 | 13.51 |
ENSRNOT00000020065
|
Mapkapk3
|
mitogen-activated protein kinase-activated protein kinase 3 |
| chr1_-_32643771 | 13.30 |
ENSRNOT00000016975
|
Irx4
|
iroquois homeobox 4 |
| chr13_-_47831110 | 13.27 |
ENSRNOT00000061070
|
Mapkapk2
|
mitogen-activated protein kinase-activated protein kinase 2 |
| chr7_-_95310005 | 13.20 |
ENSRNOT00000005815
|
Mrpl13
|
mitochondrial ribosomal protein L13 |
| chr16_-_81880502 | 12.70 |
ENSRNOT00000079096
|
Mcf2l
|
MCF.2 cell line derived transforming sequence-like |
| chr5_+_169452493 | 12.51 |
ENSRNOT00000014444
|
Gpr153
|
G protein-coupled receptor 153 |
| chr1_-_209641123 | 11.96 |
ENSRNOT00000021702
|
Ebf3
|
early B-cell factor 3 |
| chr1_+_240908483 | 11.79 |
ENSRNOT00000019367
|
Klf9
|
Kruppel-like factor 9 |
| chr11_-_83867203 | 11.65 |
ENSRNOT00000002394
|
Chrd
|
chordin |
| chr7_+_24939498 | 11.62 |
ENSRNOT00000010601
|
Ckap4
|
cytoskeleton-associated protein 4 |
| chr5_-_138222534 | 11.12 |
ENSRNOT00000009691
|
Zfp691
|
zinc finger protein 691 |
| chr3_-_79892429 | 10.99 |
ENSRNOT00000016191
|
Slc39a13
|
solute carrier family 39 member 13 |
| chr7_+_142905758 | 10.92 |
ENSRNOT00000078663
|
Nr4a1
|
nuclear receptor subfamily 4, group A, member 1 |
| chr3_-_146470293 | 10.80 |
ENSRNOT00000009627
|
Acss1
|
acyl-CoA synthetase short-chain family member 1 |
| chr3_-_12944494 | 10.65 |
ENSRNOT00000023172
|
Mvb12b
|
multivesicular body subunit 12B |
| chr20_-_11721838 | 10.37 |
ENSRNOT00000001636
|
Ube2g2
|
ubiquitin-conjugating enzyme E2G 2 |
| chr6_+_26797126 | 10.21 |
ENSRNOT00000010586
|
Cgref1
|
cell growth regulator with EF hand domain 1 |
| chr6_-_55524436 | 10.20 |
ENSRNOT00000006752
|
Tspan13
|
tetraspanin 13 |
| chr4_-_157486844 | 10.17 |
ENSRNOT00000038281
ENSRNOT00000022874 |
Cops7a
|
COP9 signalosome subunit 7A |
| chr5_-_147584038 | 10.04 |
ENSRNOT00000010983
|
Zbtb8a
|
zinc finger and BTB domain containing 8a |
| chr20_-_54517709 | 9.95 |
ENSRNOT00000076234
|
Grik2
|
glutamate ionotropic receptor kainate type subunit 2 |
| chr11_+_87677966 | 9.91 |
ENSRNOT00000068711
|
Klhl22
|
kelch-like family member 22 |
| chrX_-_105622156 | 9.91 |
ENSRNOT00000029511
|
Armcx2
|
armadillo repeat containing, X-linked 2 |
| chr4_+_56625561 | 9.73 |
ENSRNOT00000008356
ENSRNOT00000090808 ENSRNOT00000008972 |
Calu
|
calumenin |
| chr12_+_24473981 | 9.52 |
ENSRNOT00000001973
|
Fzd9
|
frizzled class receptor 9 |
| chr20_-_5533600 | 9.36 |
ENSRNOT00000072319
|
Cuta
|
cutA divalent cation tolerance homolog |
| chr20_-_5533448 | 9.20 |
ENSRNOT00000000568
|
Cuta
|
cutA divalent cation tolerance homolog |
| chr1_+_264768105 | 9.09 |
ENSRNOT00000086766
ENSRNOT00000048843 |
Lzts2
|
leucine zipper tumor suppressor 2 |
| chr11_+_87678295 | 8.82 |
ENSRNOT00000091675
|
Klhl22
|
kelch-like family member 22 |
| chr1_+_198383201 | 8.68 |
ENSRNOT00000037405
|
Sez6l2
|
seizure related 6 homolog like 2 |
| chr5_+_21632926 | 8.49 |
ENSRNOT00000008522
|
Rab2a
|
RAB2A, member RAS oncogene family |
| chr20_-_29990111 | 8.32 |
ENSRNOT00000048029
|
Cdh23
|
cadherin-related 23 |
| chr12_-_23021517 | 8.31 |
ENSRNOT00000041654
|
Myl10
|
myosin light chain 10 |
| chr1_+_255479261 | 8.16 |
ENSRNOT00000079808
|
Tnks2
|
tankyrase 2 |
| chrX_+_73390903 | 8.14 |
ENSRNOT00000077002
|
Zfp449
|
zinc finger protein 449 |
| chrX_-_34162827 | 7.96 |
ENSRNOT00000046759
|
RGD1560203
|
similar to ferritin heavy polypeptide-like 17 |
| chr12_+_45727112 | 7.85 |
ENSRNOT00000001507
|
Srrm4
|
serine/arginine repetitive matrix 4 |
| chrX_+_105911925 | 7.73 |
ENSRNOT00000052422
|
LOC108348137
|
armadillo repeat-containing X-linked protein 1 |
| chr15_+_52241801 | 7.61 |
ENSRNOT00000082639
|
Hr
|
HR, lysine demethylase and nuclear receptor corepressor |
| chr3_+_113415774 | 7.07 |
ENSRNOT00000056151
|
Serf2
|
small EDRK-rich factor 2 |
| chr10_-_65805693 | 6.93 |
ENSRNOT00000012245
|
Tnfaip1
|
TNF alpha induced protein 1 |
| chr1_+_226947105 | 6.80 |
ENSRNOT00000028373
|
Prpf19
|
pre-mRNA processing factor 19 |
| chr10_+_94445877 | 6.78 |
ENSRNOT00000013997
|
Psmc5
|
proteasome 26S subunit, ATPase 5 |
| chr5_+_76150840 | 6.62 |
ENSRNOT00000020702
|
Dnajc25
|
DnaJ heat shock protein family (Hsp40) member C25 |
| chr12_+_23463157 | 6.43 |
ENSRNOT00000044841
|
Cux1
|
cut-like homeobox 1 |
| chr16_+_6035926 | 6.27 |
ENSRNOT00000020284
|
Selenok
|
selenoprotein K |
| chr10_-_74119009 | 6.13 |
ENSRNOT00000085712
ENSRNOT00000006926 |
Dhx40
|
DEAH-box helicase 40 |
| chr8_+_22021213 | 6.00 |
ENSRNOT00000049706
|
Mrpl4
|
mitochondrial ribosomal protein L4 |
| chr20_-_48881119 | 5.92 |
ENSRNOT00000018892
|
Qrsl1
|
glutaminyl-tRNA synthase (glutamine-hydrolyzing)-like 1 |
| chr1_+_77994203 | 5.83 |
ENSRNOT00000002044
|
Napa
|
NSF attachment protein alpha |
| chr1_-_100865894 | 5.81 |
ENSRNOT00000027580
|
Ptov1
|
prostate tumor overexpressed 1 |
| chr8_+_5790034 | 5.71 |
ENSRNOT00000061887
|
Mmp27
|
matrix metallopeptidase 27 |
| chr6_-_38453797 | 5.66 |
ENSRNOT00000009100
|
Ddx1
|
DEAD-box helicase 1 |
| chr5_-_58445953 | 5.42 |
ENSRNOT00000046102
|
Vcp
|
valosin-containing protein |
| chr4_-_147756294 | 5.10 |
ENSRNOT00000014537
|
Mbd4
|
methyl-CpG binding domain 4 DNA glycosylase |
| chr14_-_114484127 | 5.06 |
ENSRNOT00000056706
|
Eml6
|
echinoderm microtubule associated protein like 6 |
| chr20_+_48881194 | 5.05 |
ENSRNOT00000000304
|
Rtn4ip1
|
reticulon 4 interacting protein 1 |
| chr13_-_88497901 | 4.99 |
ENSRNOT00000058560
|
Uap1
|
UDP-N-acetylglucosamine pyrophosphorylase 1 |
| chr9_+_94178221 | 4.78 |
ENSRNOT00000033487
|
Alppl2
|
alkaline phosphatase, placental-like 2 |
| chr1_+_174767960 | 4.73 |
ENSRNOT00000013362
|
Wee1
|
WEE1 G2 checkpoint kinase |
| chr4_-_152380184 | 4.69 |
ENSRNOT00000091473
|
Erc1
|
ELKS/RAB6-interacting/CAST family member 1 |
| chr10_+_40247436 | 4.30 |
ENSRNOT00000079830
|
Gpx3
|
glutathione peroxidase 3 |
| chr12_-_48663143 | 4.17 |
ENSRNOT00000082809
|
Ficd
|
FIC domain containing |
| chr7_+_29282305 | 4.05 |
ENSRNOT00000007623
|
Arl1
|
ADP-ribosylation factor like GTPase 1 |
| chr5_+_128629942 | 4.00 |
ENSRNOT00000010462
ENSRNOT00000010440 |
Nrdc
|
nardilysin convertase |
| chr15_+_57891680 | 3.75 |
ENSRNOT00000001383
|
Tpt1
|
tumor protein, translationally-controlled 1 |
| chr7_+_141249044 | 3.74 |
ENSRNOT00000084911
|
Aqp5
|
aquaporin 5 |
| chr12_-_13210758 | 3.73 |
ENSRNOT00000001438
|
Kdelr2
|
KDEL endoplasmic reticulum protein retention receptor 2 |
| chr12_-_43940798 | 3.60 |
ENSRNOT00000001485
|
RGD1562310
|
similar to hypothetical protein FLJ21415 |
| chr1_-_239265997 | 3.58 |
ENSRNOT00000037500
|
RGD1359158
|
similar to RIKEN cDNA 1110059E24 |
| chr17_-_67945037 | 3.52 |
ENSRNOT00000023033
|
Klf6
|
Kruppel-like factor 6 |
| chr1_-_220265772 | 3.46 |
ENSRNOT00000027119
|
Npas4
|
neuronal PAS domain protein 4 |
| chr4_-_152380023 | 3.45 |
ENSRNOT00000012397
|
Erc1
|
ELKS/RAB6-interacting/CAST family member 1 |
| chr16_+_59077574 | 3.42 |
ENSRNOT00000090477
|
Dlc1
|
DLC1 Rho GTPase activating protein |
| chr9_-_113331319 | 3.41 |
ENSRNOT00000020681
|
Vapa
|
VAMP associated protein A |
| chr13_+_35554964 | 3.29 |
ENSRNOT00000072632
|
Tmem185b
|
transmembrane protein 185B |
| chr7_-_120559157 | 3.28 |
ENSRNOT00000090565
ENSRNOT00000016827 ENSRNOT00000017108 |
Pla2g6
|
phospholipase A2 group VI |
| chrX_+_48779110 | 3.26 |
ENSRNOT00000058434
|
Tmem47
|
transmembrane protein 47 |
| chrX_-_19369746 | 3.23 |
ENSRNOT00000075249
|
LOC108348096
|
ras-related GTP-binding protein B |
| chr17_+_6459056 | 3.22 |
ENSRNOT00000025745
|
Slc28a3
|
solute carrier family 28 member 3 |
| chr5_+_59063531 | 3.20 |
ENSRNOT00000085311
ENSRNOT00000065909 |
Creb3
|
cAMP responsive element binding protein 3 |
| chr1_-_221129654 | 3.16 |
ENSRNOT00000032387
|
Scyl1
|
SCY1 like pseudokinase 1 |
| chr1_-_205842428 | 3.13 |
ENSRNOT00000024655
|
Dhx32
|
DEAH-box helicase 32 (putative) |
| chr11_+_34598492 | 3.09 |
ENSRNOT00000065600
|
Ttc3
|
tetratricopeptide repeat domain 3 |
| chr1_-_174588529 | 3.05 |
ENSRNOT00000017485
|
Dennd5a
|
DENN domain containing 5A |
| chr1_-_229639187 | 3.04 |
ENSRNOT00000016804
|
Zfp91
|
zinc finger protein 91 |
| chr10_+_43768708 | 3.01 |
ENSRNOT00000086218
|
Sh3bp5l
|
SH3 binding domain protein 5 like |
| chr7_-_24667301 | 2.99 |
ENSRNOT00000009154
|
Tmem263
|
transmembrane protein 263 |
| chr7_+_25919867 | 2.94 |
ENSRNOT00000009625
ENSRNOT00000090153 |
Ric8b
|
RIC8 guanine nucleotide exchange factor B |
| chr10_+_84135116 | 2.85 |
ENSRNOT00000031035
|
Hoxb7
|
homeo box B7 |
| chr6_-_86713370 | 2.77 |
ENSRNOT00000005821
|
Klhl28
|
kelch-like family member 28 |
| chr2_+_207108552 | 2.77 |
ENSRNOT00000027234
|
Slc16a1
|
solute carrier family 16 member 1 |
| chr11_+_77239098 | 2.72 |
ENSRNOT00000058701
|
Gmnc
|
geminin coiled-coil domain containing |
| chr7_-_139254149 | 2.60 |
ENSRNOT00000078644
|
Rapgef3
|
Rap guanine nucleotide exchange factor 3 |
| chr6_-_26051229 | 2.55 |
ENSRNOT00000005855
|
Bre
|
brain and reproductive organ-expressed (TNFRSF1A modulator) |
| chr2_+_56887987 | 2.52 |
ENSRNOT00000041288
|
Gdnf
|
glial cell derived neurotrophic factor |
| chrX_-_19134869 | 2.52 |
ENSRNOT00000004235
|
RragB
|
Ras-related GTP binding B |
| chr14_+_11198896 | 2.43 |
ENSRNOT00000079767
|
Hnrnpdl
|
heterogeneous nuclear ribonucleoprotein D-like |
| chr12_+_8976585 | 2.38 |
ENSRNOT00000071796
|
LOC100911238
|
proteasome maturation protein-like |
| chr1_+_173532803 | 2.30 |
ENSRNOT00000021017
|
Eif3f
|
eukaryotic translation initiation factor 3, subunit F |
| chr19_-_39257451 | 2.25 |
ENSRNOT00000066312
|
Cog8
|
component of oligomeric golgi complex 8 |
| chr12_+_50269347 | 2.19 |
ENSRNOT00000079190
|
Asphd2
|
aspartate beta-hydroxylase domain containing 2 |
| chr5_-_39650894 | 2.15 |
ENSRNOT00000010421
ENSRNOT00000089522 |
Ufl1
|
Ufm1-specific ligase 1 |
| chr7_-_123193761 | 2.13 |
ENSRNOT00000007164
|
Pmm1
|
phosphomannomutase 1 |
| chr18_+_58325319 | 2.07 |
ENSRNOT00000065802
ENSRNOT00000077726 |
Napg
|
NSF attachment protein gamma |
| chr7_-_11001933 | 2.00 |
ENSRNOT00000084006
|
Tle2
|
transducin-like enhancer of split 2 |
| chr1_-_221420115 | 1.99 |
ENSRNOT00000028475
|
Mrpl49
|
mitochondrial ribosomal protein L49 |
| chr20_-_848229 | 1.93 |
ENSRNOT00000000974
|
Olr1694
|
olfactory receptor 1694 |
| chr14_-_37108341 | 1.93 |
ENSRNOT00000002899
|
Spata18
|
spermatogenesis associated 18 |
| chr10_+_58784660 | 1.89 |
ENSRNOT00000019925
|
LOC100912483
|
uncharacterized LOC100912483 |
| chr7_+_70580198 | 1.88 |
ENSRNOT00000083472
ENSRNOT00000008941 |
Ddit3
|
DNA-damage inducible transcript 3 |
| chr13_-_90467235 | 1.86 |
ENSRNOT00000081534
ENSRNOT00000008150 |
Ncstn
|
nicastrin |
| chr3_-_124461332 | 1.82 |
ENSRNOT00000073088
|
LOC103691893
|
putative ERV-F(c)1 provirus ancestral Env polyprotein |
| chr6_+_70276227 | 1.82 |
ENSRNOT00000078958
|
AABR07064231.1
|
|
| chr7_-_130408187 | 1.82 |
ENSRNOT00000015374
|
Chkb
|
choline kinase beta |
| chr1_+_101859346 | 1.78 |
ENSRNOT00000028627
|
Kdelr1
|
KDEL endoplasmic reticulum protein retention receptor 1 |
| chr20_+_33527932 | 1.61 |
ENSRNOT00000066492
|
Nepn
|
nephrocan |
| chr10_-_56530842 | 1.61 |
ENSRNOT00000077451
|
AABR07029863.3
|
|
| chr4_+_120411991 | 1.59 |
ENSRNOT00000090875
|
Ruvbl1
|
RuvB-like AAA ATPase 1 |
| chr16_+_20704807 | 1.59 |
ENSRNOT00000027241
|
Klhl26
|
kelch-like family member 26 |
| chr4_+_108301129 | 1.50 |
ENSRNOT00000007993
|
LRRTM1
|
leucine rich repeat transmembrane neuronal 1 |
| chr12_-_8759599 | 1.43 |
ENSRNOT00000073155
|
Pomp
|
proteasome maturation protein |
| chr3_+_138504214 | 1.33 |
ENSRNOT00000091529
|
Kat14
|
lysine acetyltransferase 14 |
| chr7_+_11295892 | 1.32 |
ENSRNOT00000089004
|
Tjp3
|
tight junction protein 3 |
| chr9_+_61810859 | 1.30 |
ENSRNOT00000079058
|
AABR07067763.1
|
|
| chr18_-_56534415 | 1.29 |
ENSRNOT00000024374
|
Slc26a2
|
solute carrier family 26 member 2 |
| chr6_+_52459946 | 1.23 |
ENSRNOT00000073277
ENSRNOT00000013474 |
Atxn7l1
|
ataxin 7-like 1 |
| chr9_+_121456623 | 1.21 |
ENSRNOT00000056255
|
Ppidl1
|
peptidylprolyl isomerase D-like 1 |
| chr10_-_84789832 | 1.17 |
ENSRNOT00000071719
|
Cdk5rap3
|
CDK5 regulatory subunit associated protein 3 |
| chr16_-_73670482 | 1.15 |
ENSRNOT00000024532
|
Nkx6-3
|
NK6 homeobox 3 |
| chr2_+_144591755 | 1.14 |
ENSRNOT00000044424
|
Sohlh2
|
spermatogenesis and oogenesis specific basic helix-loop-helix 2 |
| chrX_-_156999650 | 1.12 |
ENSRNOT00000083557
|
Ssr4
|
signal sequence receptor subunit 4 |
| chr5_-_62001196 | 1.11 |
ENSRNOT00000012602
|
Trmo
|
tRNA methyltransferase O |
| chr10_+_55687050 | 1.05 |
ENSRNOT00000057136
|
Per1
|
period circadian clock 1 |
| chr18_+_27114822 | 1.02 |
ENSRNOT00000027418
|
Srp19
|
signal recognition particle 19 |
| chr6_+_72124417 | 1.02 |
ENSRNOT00000040548
|
Scfd1
|
sec1 family domain containing 1 |
| chr12_-_52676608 | 0.94 |
ENSRNOT00000072507
|
Plcxd1
|
phosphatidylinositol-specific phospholipase C, X domain containing 1 |
| chr4_+_176565694 | 0.89 |
ENSRNOT00000016794
|
Pyroxd1
|
pyridine nucleotide-disulphide oxidoreductase domain 1 |
| chr10_+_88356615 | 0.86 |
ENSRNOT00000022687
|
Klhl10
|
kelch-like family member 10 |
| chr2_+_178354890 | 0.85 |
ENSRNOT00000037890
|
Ppid
|
peptidylprolyl isomerase D |
| chr13_-_91737053 | 0.80 |
ENSRNOT00000083561
|
Fcer1a
|
Fc fragment of IgE receptor Ia |
| chr2_+_124149872 | 0.80 |
ENSRNOT00000023584
|
Spata5
|
spermatogenesis associated 5 |
| chr1_+_161922141 | 0.79 |
ENSRNOT00000078300
ENSRNOT00000015784 |
Nars2
|
asparaginyl-tRNA synthetase 2 (mitochondrial)(putative) |
| chr5_-_152227677 | 0.77 |
ENSRNOT00000020051
|
Dhdds
|
dehydrodolichyl diphosphate synthase subunit |
| chr15_+_36609296 | 0.77 |
ENSRNOT00000010795
|
Rnf17
|
ring finger protein 17 |
| chr4_+_181628276 | 0.66 |
ENSRNOT00000077332
|
AABR07062539.1
|
|
| chr13_+_90467265 | 0.66 |
ENSRNOT00000008518
|
Copa
|
coatomer protein complex subunit alpha |
| chr7_-_64341207 | 0.64 |
ENSRNOT00000006051
|
Tmem5
|
transmembrane protein 5 |
| chr1_+_47162394 | 0.64 |
ENSRNOT00000068457
|
Tmem181
|
transmembrane protein 181 |
| chr1_-_263718745 | 0.55 |
ENSRNOT00000074810
|
Dnmbp
|
dynamin binding protein |
| chr14_+_42007312 | 0.44 |
ENSRNOT00000063985
|
Atp8a1
|
ATPase phospholipid transporting 8A1 |
| chr5_-_59063592 | 0.44 |
ENSRNOT00000022400
|
Tln1
|
talin 1 |
| chr20_+_3588497 | 0.37 |
ENSRNOT00000048103
|
Vars2
|
valyl-tRNA synthetase 2, mitochondrial |
| chr2_-_211352540 | 0.32 |
ENSRNOT00000023728
|
LOC108349010
|
protein kish-B |
| chr6_-_88232252 | 0.30 |
ENSRNOT00000047597
|
Rpl10l
|
ribosomal protein L10-like |
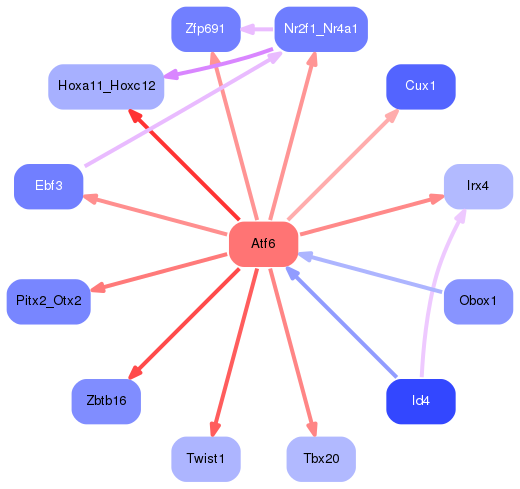
Network of associatons between targets according to the STRING database.

First level regulatory network of Atf6
Gene Ontology Analysis
Gene overrepresentation in biological process category:
| Log-likelihood per target | Total log-likelihood | Term | Description |
|---|---|---|---|
| 16.7 | 50.2 | GO:0072209 | mesangial cell-matrix adhesion(GO:0035759) positive regulation of granulocyte colony-stimulating factor production(GO:0071657) metanephric mesangial cell differentiation(GO:0072209) metanephric glomerular mesangial cell differentiation(GO:0072254) positive regulation of macrophage colony-stimulating factor production(GO:1901258) |
| 11.8 | 35.3 | GO:1903445 | protein transport from ciliary membrane to plasma membrane(GO:1903445) |
| 11.7 | 35.2 | GO:2000118 | regulation of sodium-dependent phosphate transport(GO:2000118) |
| 10.1 | 30.2 | GO:0060577 | pulmonary vein morphogenesis(GO:0060577) |
| 9.5 | 47.7 | GO:0030070 | insulin processing(GO:0030070) negative regulation of branching morphogenesis of a nerve(GO:2000173) |
| 7.3 | 21.9 | GO:0033128 | negative regulation of histone phosphorylation(GO:0033128) negative regulation of peroxisome proliferator activated receptor signaling pathway(GO:0035359) |
| 5.1 | 25.6 | GO:0048133 | germ-line stem cell division(GO:0042078) male germ-line stem cell asymmetric division(GO:0048133) germline stem cell asymmetric division(GO:0098728) |
| 4.4 | 13.3 | GO:0048560 | establishment of anatomical structure orientation(GO:0048560) |
| 3.9 | 11.8 | GO:0071387 | cellular response to cortisol stimulus(GO:0071387) |
| 3.9 | 15.5 | GO:0036371 | protein localization to M-band(GO:0036309) protein localization to T-tubule(GO:0036371) |
| 3.8 | 26.7 | GO:0006621 | protein retention in ER lumen(GO:0006621) |
| 3.6 | 10.8 | GO:0006083 | acetate metabolic process(GO:0006083) propionate metabolic process(GO:0019541) |
| 3.5 | 21.1 | GO:0033227 | dsRNA transport(GO:0033227) |
| 3.5 | 48.6 | GO:0060272 | embryonic skeletal joint morphogenesis(GO:0060272) |
| 3.0 | 26.8 | GO:0044351 | macropinocytosis(GO:0044351) |
| 2.9 | 17.3 | GO:0006102 | isocitrate metabolic process(GO:0006102) |
| 2.4 | 14.3 | GO:0045113 | regulation of integrin biosynthetic process(GO:0045113) |
| 2.4 | 9.5 | GO:1990523 | bone regeneration(GO:1990523) |
| 2.3 | 13.9 | GO:0042851 | L-alanine metabolic process(GO:0042851) |
| 2.2 | 11.0 | GO:0021914 | negative regulation of smoothened signaling pathway involved in ventral spinal cord patterning(GO:0021914) |
| 2.1 | 157.5 | GO:0048747 | muscle fiber development(GO:0048747) |
| 2.0 | 5.9 | GO:0070681 | glutaminyl-tRNAGln biosynthesis via transamidation(GO:0070681) |
| 1.8 | 10.9 | GO:0043435 | response to corticotropin-releasing hormone(GO:0043435) cellular response to corticotropin-releasing hormone stimulus(GO:0071376) |
| 1.8 | 5.4 | GO:2000158 | flavin-containing compound metabolic process(GO:0042726) positive regulation of ubiquitin-specific protease activity(GO:2000158) |
| 1.7 | 6.8 | GO:0000393 | spliceosomal conformational changes to generate catalytic conformation(GO:0000393) |
| 1.7 | 26.5 | GO:1901663 | ubiquinone biosynthetic process(GO:0006744) quinone biosynthetic process(GO:1901663) |
| 1.5 | 14.7 | GO:2000643 | positive regulation of early endosome to late endosome transport(GO:2000643) |
| 1.5 | 5.8 | GO:0035494 | SNARE complex disassembly(GO:0035494) |
| 1.4 | 27.9 | GO:0097201 | negative regulation of transcription from RNA polymerase II promoter in response to stress(GO:0097201) |
| 1.3 | 3.8 | GO:2000383 | regulation of ectoderm development(GO:2000383) negative regulation of ectoderm development(GO:2000384) |
| 1.2 | 20.4 | GO:0048642 | negative regulation of skeletal muscle tissue development(GO:0048642) positive regulation of skeletal muscle tissue development(GO:0048643) |
| 1.2 | 41.5 | GO:0006506 | GPI anchor biosynthetic process(GO:0006506) |
| 1.1 | 25.9 | GO:0042347 | negative regulation of NF-kappaB import into nucleus(GO:0042347) |
| 1.1 | 17.5 | GO:0033591 | response to L-ascorbic acid(GO:0033591) |
| 1.1 | 3.2 | GO:0015864 | pyrimidine nucleoside transport(GO:0015864) |
| 1.1 | 3.2 | GO:0006990 | positive regulation of transcription from RNA polymerase II promoter involved in unfolded protein response(GO:0006990) |
| 0.9 | 8.3 | GO:0050957 | equilibrioception(GO:0050957) |
| 0.9 | 10.2 | GO:0000338 | protein deneddylation(GO:0000338) |
| 0.8 | 6.8 | GO:0090261 | positive regulation of inclusion body assembly(GO:0090261) |
| 0.8 | 2.5 | GO:0072107 | regulation of ureteric bud formation(GO:0072106) positive regulation of ureteric bud formation(GO:0072107) |
| 0.8 | 9.1 | GO:0051255 | spindle midzone assembly(GO:0051255) |
| 0.8 | 3.3 | GO:0035965 | cardiolipin acyl-chain remodeling(GO:0035965) |
| 0.8 | 5.7 | GO:1903608 | protein localization to cytoplasmic stress granule(GO:1903608) |
| 0.7 | 5.0 | GO:0006048 | UDP-N-acetylglucosamine biosynthetic process(GO:0006048) |
| 0.6 | 2.6 | GO:1904426 | positive regulation of GTP binding(GO:1904426) |
| 0.6 | 4.3 | GO:0002238 | response to molecule of fungal origin(GO:0002238) |
| 0.6 | 8.0 | GO:0097577 | intracellular sequestering of iron ion(GO:0006880) sequestering of iron ion(GO:0097577) |
| 0.6 | 9.7 | GO:0014012 | peripheral nervous system axon regeneration(GO:0014012) |
| 0.6 | 18.7 | GO:0031577 | mitotic spindle assembly checkpoint(GO:0007094) spindle checkpoint(GO:0031577) spindle assembly checkpoint(GO:0071173) mitotic spindle checkpoint(GO:0071174) |
| 0.6 | 15.0 | GO:0010842 | retina layer formation(GO:0010842) |
| 0.6 | 8.7 | GO:0090036 | regulation of protein kinase C signaling(GO:0090036) |
| 0.6 | 31.2 | GO:0021762 | substantia nigra development(GO:0021762) |
| 0.6 | 6.3 | GO:2001256 | regulation of store-operated calcium entry(GO:2001256) |
| 0.6 | 3.3 | GO:0071569 | protein ufmylation(GO:0071569) |
| 0.5 | 3.7 | GO:0015670 | carbon dioxide transport(GO:0015670) |
| 0.5 | 8.5 | GO:0032482 | Rab protein signal transduction(GO:0032482) |
| 0.5 | 3.4 | GO:0044828 | negative regulation by host of viral genome replication(GO:0044828) |
| 0.5 | 1.9 | GO:0035694 | mitochondrial protein catabolic process(GO:0035694) |
| 0.5 | 8.7 | GO:0051967 | negative regulation of synaptic transmission, glutamatergic(GO:0051967) |
| 0.5 | 3.7 | GO:0071409 | cellular response to cycloheximide(GO:0071409) |
| 0.5 | 8.1 | GO:0007252 | I-kappaB phosphorylation(GO:0007252) |
| 0.4 | 2.1 | GO:0009298 | GDP-mannose biosynthetic process(GO:0009298) |
| 0.4 | 2.5 | GO:1904263 | positive regulation of TORC1 signaling(GO:1904263) cellular response to leucine starvation(GO:1990253) |
| 0.4 | 19.8 | GO:0006739 | NADP metabolic process(GO:0006739) |
| 0.4 | 0.8 | GO:0045425 | positive regulation of interleukin-3 production(GO:0032752) interleukin-3 biosynthetic process(GO:0042223) regulation of interleukin-3 biosynthetic process(GO:0045399) positive regulation of interleukin-3 biosynthetic process(GO:0045401) positive regulation of granulocyte macrophage colony-stimulating factor biosynthetic process(GO:0045425) |
| 0.4 | 12.7 | GO:0035025 | positive regulation of Rho protein signal transduction(GO:0035025) |
| 0.4 | 2.8 | GO:0035879 | plasma membrane lactate transport(GO:0035879) |
| 0.4 | 1.1 | GO:0001545 | primary ovarian follicle growth(GO:0001545) |
| 0.4 | 1.9 | GO:0071500 | cellular response to nitrosative stress(GO:0071500) regulation of determination of dorsal identity(GO:2000015) |
| 0.3 | 22.0 | GO:0032088 | negative regulation of NF-kappaB transcription factor activity(GO:0032088) |
| 0.3 | 10.4 | GO:0035458 | cellular response to interferon-beta(GO:0035458) |
| 0.3 | 3.5 | GO:0007614 | short-term memory(GO:0007614) |
| 0.3 | 4.0 | GO:0051044 | positive regulation of membrane protein ectodomain proteolysis(GO:0051044) |
| 0.3 | 1.1 | GO:0097167 | circadian regulation of translation(GO:0097167) |
| 0.3 | 0.8 | GO:0006421 | asparaginyl-tRNA aminoacylation(GO:0006421) |
| 0.3 | 0.8 | GO:0016094 | polyprenol biosynthetic process(GO:0016094) |
| 0.3 | 1.0 | GO:0006616 | SRP-dependent cotranslational protein targeting to membrane, translocation(GO:0006616) |
| 0.3 | 3.8 | GO:0043248 | proteasome assembly(GO:0043248) |
| 0.3 | 3.0 | GO:0007250 | activation of NF-kappaB-inducing kinase activity(GO:0007250) |
| 0.3 | 4.0 | GO:0009404 | toxin metabolic process(GO:0009404) |
| 0.2 | 1.5 | GO:0002091 | negative regulation of receptor internalization(GO:0002091) |
| 0.2 | 3.4 | GO:1900119 | positive regulation of execution phase of apoptosis(GO:1900119) |
| 0.2 | 0.4 | GO:0061091 | regulation of phospholipid translocation(GO:0061091) positive regulation of phospholipid translocation(GO:0061092) |
| 0.2 | 0.9 | GO:0048808 | male genitalia morphogenesis(GO:0048808) male anatomical structure morphogenesis(GO:0090598) |
| 0.2 | 5.1 | GO:0031572 | mitotic G2 DNA damage checkpoint(GO:0007095) G2 DNA damage checkpoint(GO:0031572) |
| 0.2 | 0.8 | GO:0071492 | cellular response to UV-A(GO:0071492) |
| 0.2 | 4.6 | GO:0033169 | histone H3-K9 demethylation(GO:0033169) |
| 0.2 | 1.9 | GO:0007220 | Notch receptor processing(GO:0007220) |
| 0.2 | 0.4 | GO:0006438 | valyl-tRNA aminoacylation(GO:0006438) |
| 0.2 | 1.8 | GO:0006657 | CDP-choline pathway(GO:0006657) |
| 0.2 | 15.9 | GO:0051225 | spindle assembly(GO:0051225) |
| 0.2 | 2.9 | GO:0090190 | positive regulation of branching involved in ureteric bud morphogenesis(GO:0090190) |
| 0.2 | 3.0 | GO:0061099 | negative regulation of protein tyrosine kinase activity(GO:0061099) |
| 0.2 | 10.7 | GO:0042058 | regulation of epidermal growth factor receptor signaling pathway(GO:0042058) |
| 0.2 | 13.4 | GO:0007088 | regulation of mitotic nuclear division(GO:0007088) |
| 0.1 | 1.6 | GO:0010756 | positive regulation of plasminogen activation(GO:0010756) |
| 0.1 | 7.3 | GO:0000381 | regulation of alternative mRNA splicing, via spliceosome(GO:0000381) |
| 0.1 | 6.4 | GO:0042491 | auditory receptor cell differentiation(GO:0042491) |
| 0.1 | 0.6 | GO:0009405 | pathogenesis(GO:0009405) |
| 0.1 | 3.2 | GO:0032008 | positive regulation of TOR signaling(GO:0032008) |
| 0.1 | 6.9 | GO:0045740 | positive regulation of DNA replication(GO:0045740) |
| 0.1 | 1.3 | GO:0019532 | oxalate transport(GO:0019532) |
| 0.1 | 2.4 | GO:0006270 | DNA replication initiation(GO:0006270) |
| 0.1 | 0.2 | GO:0035408 | histone H3-T6 phosphorylation(GO:0035408) |
| 0.1 | 9.2 | GO:0030308 | negative regulation of cell growth(GO:0030308) |
| 0.1 | 8.3 | GO:1903169 | regulation of calcium ion transmembrane transport(GO:1903169) |
| 0.1 | 3.1 | GO:0070936 | protein K48-linked ubiquitination(GO:0070936) |
| 0.1 | 2.5 | GO:0045739 | positive regulation of DNA repair(GO:0045739) |
| 0.1 | 0.6 | GO:0035269 | protein O-linked mannosylation(GO:0035269) |
| 0.1 | 2.8 | GO:0050982 | detection of mechanical stimulus(GO:0050982) |
| 0.0 | 9.7 | GO:0010506 | regulation of autophagy(GO:0010506) |
| 0.0 | 0.7 | GO:0030157 | pancreatic juice secretion(GO:0030157) |
| 0.0 | 1.1 | GO:0030488 | tRNA methylation(GO:0030488) |
| 0.0 | 1.6 | GO:0030512 | negative regulation of transforming growth factor beta receptor signaling pathway(GO:0030512) |
| 0.0 | 11.0 | GO:0061448 | connective tissue development(GO:0061448) |
| 0.0 | 1.2 | GO:0030857 | negative regulation of epithelial cell differentiation(GO:0030857) |
| 0.0 | 0.4 | GO:0007016 | cytoskeletal anchoring at plasma membrane(GO:0007016) |
| 0.0 | 8.2 | GO:0007517 | muscle organ development(GO:0007517) |
| 0.0 | 1.2 | GO:0000413 | protein peptidyl-prolyl isomerization(GO:0000413) |
| 0.0 | 0.2 | GO:0042746 | regulation of circadian sleep/wake cycle, wakefulness(GO:0010840) circadian sleep/wake cycle, wakefulness(GO:0042746) |
| 0.0 | 9.7 | GO:0010038 | response to metal ion(GO:0010038) |
| 0.0 | 2.3 | GO:0016579 | protein deubiquitination(GO:0016579) |
| 0.0 | 1.3 | GO:0000086 | G2/M transition of mitotic cell cycle(GO:0000086) |
| 0.0 | 1.6 | GO:0046546 | male gonad development(GO:0008584) development of primary male sexual characteristics(GO:0046546) |
| 0.0 | 0.3 | GO:0000027 | ribosomal large subunit assembly(GO:0000027) |
Gene overrepresentation in cellular component category:
| Log-likelihood per target | Total log-likelihood | Term | Description |
|---|---|---|---|
| 12.5 | 37.4 | GO:0014701 | junctional sarcoplasmic reticulum membrane(GO:0014701) |
| 5.8 | 17.3 | GO:0045242 | mitochondrial isocitrate dehydrogenase complex (NAD+)(GO:0005962) isocitrate dehydrogenase complex (NAD+)(GO:0045242) |
| 5.2 | 25.9 | GO:0043293 | apoptosome(GO:0043293) |
| 4.9 | 14.7 | GO:0010009 | cytoplasmic side of endosome membrane(GO:0010009) |
| 4.6 | 41.5 | GO:0000506 | glycosylphosphatidylinositol-N-acetylglucosaminyltransferase (GPI-GnT) complex(GO:0000506) |
| 4.4 | 17.5 | GO:0031092 | platelet alpha granule membrane(GO:0031092) |
| 4.1 | 178.4 | GO:0043034 | costamere(GO:0043034) |
| 3.3 | 19.7 | GO:1990393 | 3M complex(GO:1990393) |
| 3.0 | 47.7 | GO:0031045 | dense core granule(GO:0031045) |
| 2.7 | 18.7 | GO:0005827 | polar microtubule(GO:0005827) |
| 2.4 | 9.7 | GO:0033018 | sarcoplasmic reticulum lumen(GO:0033018) |
| 2.3 | 6.8 | GO:0071006 | U2-type catalytic step 1 spliceosome(GO:0071006) |
| 2.0 | 5.9 | GO:0030956 | glutamyl-tRNA(Gln) amidotransferase complex(GO:0030956) |
| 1.8 | 5.4 | GO:1990730 | VCP-NSFL1C complex(GO:1990730) |
| 1.7 | 10.0 | GO:0032983 | kainate selective glutamate receptor complex(GO:0032983) |
| 1.4 | 31.2 | GO:0030285 | integral component of synaptic vesicle membrane(GO:0030285) intrinsic component of synaptic vesicle membrane(GO:0098563) |
| 1.4 | 50.2 | GO:0046930 | pore complex(GO:0046930) |
| 1.2 | 10.7 | GO:0000813 | ESCRT I complex(GO:0000813) |
| 1.2 | 5.8 | GO:0070044 | synaptobrevin 2-SNAP-25-syntaxin-1a complex(GO:0070044) |
| 0.9 | 3.8 | GO:0045298 | tubulin complex(GO:0045298) |
| 0.9 | 2.6 | GO:1990796 | photoreceptor cell terminal bouton(GO:1990796) |
| 0.8 | 6.8 | GO:0031595 | nuclear proteasome complex(GO:0031595) |
| 0.8 | 5.7 | GO:0042406 | extrinsic component of endoplasmic reticulum membrane(GO:0042406) |
| 0.7 | 10.4 | GO:0030127 | COPII vesicle coat(GO:0030127) |
| 0.7 | 5.7 | GO:0072669 | tRNA-splicing ligase complex(GO:0072669) |
| 0.6 | 8.1 | GO:0008385 | IkappaB kinase complex(GO:0008385) |
| 0.6 | 1.9 | GO:1990622 | CHOP-C/EBP complex(GO:0036488) CHOP-ATF3 complex(GO:1990622) |
| 0.6 | 8.3 | GO:0032426 | stereocilium tip(GO:0032426) |
| 0.5 | 9.5 | GO:0031527 | filopodium membrane(GO:0031527) |
| 0.5 | 2.5 | GO:0070552 | BRISC complex(GO:0070552) |
| 0.5 | 1.9 | GO:0070765 | gamma-secretase complex(GO:0070765) |
| 0.4 | 21.2 | GO:0005762 | organellar large ribosomal subunit(GO:0000315) mitochondrial large ribosomal subunit(GO:0005762) |
| 0.3 | 2.3 | GO:0033290 | eukaryotic 43S preinitiation complex(GO:0016282) eukaryotic 48S preinitiation complex(GO:0033290) |
| 0.3 | 25.6 | GO:0017053 | transcriptional repressor complex(GO:0017053) |
| 0.3 | 1.6 | GO:0097255 | R2TP complex(GO:0097255) |
| 0.2 | 3.3 | GO:0017119 | Golgi transport complex(GO:0017119) |
| 0.2 | 15.9 | GO:0005871 | kinesin complex(GO:0005871) |
| 0.2 | 29.6 | GO:0036064 | ciliary basal body(GO:0036064) |
| 0.2 | 1.1 | GO:0071256 | Sec61 translocon complex(GO:0005784) translocon complex(GO:0071256) |
| 0.2 | 3.4 | GO:0070971 | endoplasmic reticulum exit site(GO:0070971) |
| 0.2 | 12.1 | GO:0031463 | Cul3-RING ubiquitin ligase complex(GO:0031463) |
| 0.2 | 38.2 | GO:0032993 | protein-DNA complex(GO:0032993) |
| 0.1 | 6.2 | GO:0000118 | histone deacetylase complex(GO:0000118) |
| 0.1 | 6.4 | GO:0030173 | integral component of Golgi membrane(GO:0030173) |
| 0.1 | 1.0 | GO:0005786 | signal recognition particle, endoplasmic reticulum targeting(GO:0005786) |
| 0.1 | 26.0 | GO:0030027 | lamellipodium(GO:0030027) |
| 0.1 | 15.1 | GO:0030018 | Z disc(GO:0030018) |
| 0.1 | 2.9 | GO:0033116 | endoplasmic reticulum-Golgi intermediate compartment membrane(GO:0033116) |
| 0.1 | 48.1 | GO:0005813 | centrosome(GO:0005813) |
| 0.1 | 1.6 | GO:0005614 | interstitial matrix(GO:0005614) |
| 0.1 | 1.3 | GO:0005671 | Ada2/Gcn5/Ada3 transcription activator complex(GO:0005671) |
| 0.1 | 1.8 | GO:0019028 | viral capsid(GO:0019028) |
| 0.1 | 6.4 | GO:0005815 | microtubule organizing center(GO:0005815) |
| 0.1 | 2.4 | GO:0008180 | COP9 signalosome(GO:0008180) |
| 0.1 | 3.4 | GO:0030864 | cortical actin cytoskeleton(GO:0030864) |
| 0.1 | 3.7 | GO:0005902 | microvillus(GO:0005902) |
| 0.1 | 3.8 | GO:0000502 | proteasome complex(GO:0000502) |
| 0.1 | 72.2 | GO:0005615 | extracellular space(GO:0005615) |
| 0.1 | 19.0 | GO:0098857 | membrane raft(GO:0045121) membrane microdomain(GO:0098857) |
| 0.0 | 15.3 | GO:0005743 | mitochondrial inner membrane(GO:0005743) |
| 0.0 | 3.2 | GO:0030176 | integral component of endoplasmic reticulum membrane(GO:0030176) |
| 0.0 | 2.5 | GO:0000932 | cytoplasmic mRNA processing body(GO:0000932) |
| 0.0 | 7.1 | GO:0005667 | transcription factor complex(GO:0005667) |
| 0.0 | 3.2 | GO:0005759 | mitochondrial matrix(GO:0005759) |
| 0.0 | 2.1 | GO:0043209 | myelin sheath(GO:0043209) |
| 0.0 | 16.2 | GO:0005739 | mitochondrion(GO:0005739) |
| 0.0 | 1.6 | GO:0005802 | trans-Golgi network(GO:0005802) |
| 0.0 | 3.8 | GO:0048471 | perinuclear region of cytoplasm(GO:0048471) |
Gene overrepresentation in molecular function category:
| Log-likelihood per target | Total log-likelihood | Term | Description |
|---|---|---|---|
| 6.9 | 41.5 | GO:0017176 | phosphatidylinositol N-acetylglucosaminyltransferase activity(GO:0017176) |
| 6.3 | 50.2 | GO:0043199 | sulfate binding(GO:0043199) |
| 5.3 | 26.7 | GO:0046923 | ER retention sequence binding(GO:0046923) |
| 4.6 | 13.9 | GO:0047635 | L-alanine:2-oxoglutarate aminotransferase activity(GO:0004021) alanine-oxo-acid transaminase activity(GO:0047635) |
| 4.4 | 26.5 | GO:0048039 | ubiquinone binding(GO:0048039) |
| 4.3 | 17.3 | GO:0004449 | isocitrate dehydrogenase (NAD+) activity(GO:0004449) |
| 4.2 | 162.9 | GO:0030506 | ankyrin binding(GO:0030506) |
| 4.0 | 47.7 | GO:0050897 | cobalt ion binding(GO:0050897) |
| 3.5 | 35.3 | GO:0051959 | dynein light intermediate chain binding(GO:0051959) |
| 2.8 | 27.9 | GO:0000774 | adenyl-nucleotide exchange factor activity(GO:0000774) |
| 2.7 | 10.8 | GO:0003987 | acetate-CoA ligase activity(GO:0003987) |
| 2.6 | 7.9 | GO:0005483 | soluble NSF attachment protein activity(GO:0005483) |
| 2.3 | 6.8 | GO:0031531 | thyrotropin-releasing hormone receptor binding(GO:0031531) |
| 2.3 | 27.0 | GO:0009931 | calcium-dependent protein serine/threonine kinase activity(GO:0009931) |
| 2.0 | 5.9 | GO:0004040 | amidase activity(GO:0004040) glutaminyl-tRNA synthase (glutamine-hydrolyzing) activity(GO:0050567) |
| 1.8 | 25.6 | GO:0001206 | transcriptional repressor activity, RNA polymerase II distal enhancer sequence-specific binding(GO:0001206) |
| 1.8 | 5.4 | GO:0035800 | deubiquitinase activator activity(GO:0035800) |
| 1.7 | 5.1 | GO:0008263 | pyrimidine-specific mismatch base pair DNA N-glycosylase activity(GO:0008263) |
| 1.7 | 15.0 | GO:0005001 | transmembrane receptor protein tyrosine phosphatase activity(GO:0005001) transmembrane receptor protein phosphatase activity(GO:0019198) |
| 1.5 | 44.7 | GO:0017147 | Wnt-protein binding(GO:0017147) |
| 1.5 | 11.7 | GO:0045545 | syndecan binding(GO:0045545) |
| 1.2 | 8.7 | GO:0015277 | kainate selective glutamate receptor activity(GO:0015277) |
| 1.1 | 3.2 | GO:0015389 | pyrimidine- and adenine-specific:sodium symporter activity(GO:0015389) |
| 0.9 | 30.7 | GO:0008307 | structural constituent of muscle(GO:0008307) |
| 0.9 | 3.4 | GO:0033149 | FFAT motif binding(GO:0033149) |
| 0.7 | 21.6 | GO:0030332 | cyclin binding(GO:0030332) |
| 0.6 | 3.2 | GO:0031726 | CCR1 chemokine receptor binding(GO:0031726) |
| 0.6 | 7.6 | GO:0042809 | vitamin D receptor binding(GO:0042809) |
| 0.6 | 5.0 | GO:0070569 | uridylyltransferase activity(GO:0070569) |
| 0.6 | 4.8 | GO:0004035 | alkaline phosphatase activity(GO:0004035) |
| 0.6 | 6.8 | GO:0034450 | ubiquitin-ubiquitin ligase activity(GO:0034450) |
| 0.5 | 4.3 | GO:0008430 | selenium binding(GO:0008430) |
| 0.5 | 18.7 | GO:0043425 | bHLH transcription factor binding(GO:0043425) |
| 0.5 | 26.8 | GO:0001105 | RNA polymerase II transcription coactivator activity(GO:0001105) |
| 0.5 | 12.7 | GO:0005545 | 1-phosphatidylinositol binding(GO:0005545) |
| 0.5 | 10.9 | GO:0035259 | glucocorticoid receptor binding(GO:0035259) |
| 0.4 | 3.3 | GO:0047499 | calcium-independent phospholipase A2 activity(GO:0047499) |
| 0.4 | 8.0 | GO:0008199 | ferric iron binding(GO:0008199) |
| 0.4 | 1.8 | GO:0004103 | choline kinase activity(GO:0004103) |
| 0.4 | 8.2 | GO:0003950 | NAD+ ADP-ribosyltransferase activity(GO:0003950) |
| 0.3 | 2.8 | GO:0015129 | lactate transmembrane transporter activity(GO:0015129) |
| 0.3 | 15.5 | GO:0030507 | spectrin binding(GO:0030507) |
| 0.3 | 19.9 | GO:0019003 | GDP binding(GO:0019003) |
| 0.3 | 3.9 | GO:0017166 | vinculin binding(GO:0017166) |
| 0.3 | 2.6 | GO:0017034 | Rap guanyl-nucleotide exchange factor activity(GO:0017034) |
| 0.3 | 1.1 | GO:0016426 | tRNA (adenine) methyltransferase activity(GO:0016426) |
| 0.3 | 17.5 | GO:0050840 | extracellular matrix binding(GO:0050840) |
| 0.3 | 18.6 | GO:0005507 | copper ion binding(GO:0005507) |
| 0.3 | 3.7 | GO:0015250 | water channel activity(GO:0015250) |
| 0.3 | 1.6 | GO:0043141 | ATP-dependent 5'-3' DNA helicase activity(GO:0043141) |
| 0.3 | 5.3 | GO:0017049 | GTP-Rho binding(GO:0017049) |
| 0.2 | 13.1 | GO:0050661 | NADP binding(GO:0050661) |
| 0.2 | 0.8 | GO:0019863 | IgE binding(GO:0019863) |
| 0.2 | 15.9 | GO:0003777 | microtubule motor activity(GO:0003777) |
| 0.2 | 13.5 | GO:0003724 | RNA helicase activity(GO:0003724) ATP-dependent RNA helicase activity(GO:0004004) |
| 0.2 | 6.4 | GO:0001205 | transcriptional activator activity, RNA polymerase II distal enhancer sequence-specific binding(GO:0001205) |
| 0.2 | 2.1 | GO:0016868 | intramolecular transferase activity, phosphotransferases(GO:0016868) |
| 0.2 | 1.9 | GO:0043522 | leucine zipper domain binding(GO:0043522) |
| 0.2 | 6.9 | GO:0005246 | calcium channel regulator activity(GO:0005246) |
| 0.1 | 4.2 | GO:0070566 | adenylyltransferase activity(GO:0070566) |
| 0.1 | 1.0 | GO:0008312 | 7S RNA binding(GO:0008312) |
| 0.1 | 2.5 | GO:0048018 | receptor agonist activity(GO:0048018) |
| 0.1 | 0.4 | GO:0004832 | valine-tRNA ligase activity(GO:0004832) |
| 0.1 | 0.8 | GO:0016018 | cyclosporin A binding(GO:0016018) |
| 0.1 | 11.7 | GO:0043130 | ubiquitin binding(GO:0043130) |
| 0.1 | 1.3 | GO:0019531 | oxalate transmembrane transporter activity(GO:0019531) |
| 0.1 | 55.0 | GO:0005509 | calcium ion binding(GO:0005509) |
| 0.1 | 8.1 | GO:0030165 | PDZ domain binding(GO:0030165) |
| 0.1 | 4.5 | GO:0004860 | protein kinase inhibitor activity(GO:0004860) |
| 0.1 | 14.1 | GO:0003735 | structural constituent of ribosome(GO:0003735) |
| 0.0 | 1.5 | GO:0061650 | ubiquitin conjugating enzyme activity(GO:0061631) ubiquitin-like protein conjugating enzyme activity(GO:0061650) |
| 0.0 | 0.8 | GO:0004659 | prenyltransferase activity(GO:0004659) |
| 0.0 | 1.2 | GO:0031369 | translation initiation factor binding(GO:0031369) |
| 0.0 | 1.2 | GO:0003755 | peptidyl-prolyl cis-trans isomerase activity(GO:0003755) |
| 0.0 | 0.6 | GO:0015643 | toxic substance binding(GO:0015643) |
| 0.0 | 1.1 | GO:0070888 | E-box binding(GO:0070888) |
| 0.0 | 2.2 | GO:0051213 | dioxygenase activity(GO:0051213) |
| 0.0 | 1.3 | GO:0004402 | histone acetyltransferase activity(GO:0004402) |
| 0.0 | 0.4 | GO:0004012 | phospholipid-translocating ATPase activity(GO:0004012) |
| 0.0 | 0.8 | GO:0016875 | aminoacyl-tRNA ligase activity(GO:0004812) ligase activity, forming carbon-oxygen bonds(GO:0016875) ligase activity, forming aminoacyl-tRNA and related compounds(GO:0016876) |
| 0.0 | 1.3 | GO:0004222 | metalloendopeptidase activity(GO:0004222) |
| 0.0 | 0.9 | GO:0008081 | phosphoric diester hydrolase activity(GO:0008081) |
| 0.0 | 4.4 | GO:0004842 | ubiquitin-protein transferase activity(GO:0004842) |
Gene overrepresentation in curated gene sets: canonical pathways category:
| Log-likelihood per target | Total log-likelihood | Term | Description |
|---|---|---|---|
| 3.1 | 152.3 | SIG REGULATION OF THE ACTIN CYTOSKELETON BY RHO GTPASES | Genes related to regulation of the actin cytoskeleton |
| 1.2 | 9.5 | PID WNT SIGNALING PATHWAY | Wnt signaling network |
| 0.8 | 47.7 | PID ARF6 TRAFFICKING PATHWAY | Arf6 trafficking events |
| 0.7 | 18.4 | PID P38 MK2 PATHWAY | p38 signaling mediated by MAPKAP kinases |
| 0.7 | 4.7 | SA G2 AND M PHASES | Cdc25 activates the cdc2/cyclin B complex to induce the G2/M transition. |
| 0.6 | 16.2 | SIG CHEMOTAXIS | Genes related to chemotaxis |
| 0.6 | 15.5 | PID NECTIN PATHWAY | Nectin adhesion pathway |
| 0.5 | 21.9 | PID HIF2PATHWAY | HIF-2-alpha transcription factor network |
| 0.5 | 51.7 | PID CMYB PATHWAY | C-MYB transcription factor network |
| 0.5 | 13.3 | PID CDC42 REG PATHWAY | Regulation of CDC42 activity |
| 0.4 | 10.8 | PID HDAC CLASSIII PATHWAY | Signaling events mediated by HDAC Class III |
| 0.4 | 34.8 | WNT SIGNALING | Genes related to Wnt-mediated signal transduction |
| 0.4 | 5.8 | ST G ALPHA S PATHWAY | G alpha s Pathway |
| 0.3 | 8.4 | PID NFKAPPAB CANONICAL PATHWAY | Canonical NF-kappaB pathway |
| 0.3 | 11.7 | PID BMP PATHWAY | BMP receptor signaling |
| 0.3 | 10.9 | PID RXR VDR PATHWAY | RXR and RAR heterodimerization with other nuclear receptor |
| 0.3 | 16.2 | PID MYC REPRESS PATHWAY | Validated targets of C-MYC transcriptional repression |
| 0.2 | 3.7 | ST ERK1 ERK2 MAPK PATHWAY | ERK1/ERK2 MAPK Pathway |
| 0.2 | 31.7 | NABA ECM AFFILIATED | Genes encoding proteins affiliated structurally or functionally to extracellular matrix proteins |
| 0.1 | 1.9 | PID PS1 PATHWAY | Presenilin action in Notch and Wnt signaling |
| 0.1 | 3.7 | PID ECADHERIN STABILIZATION PATHWAY | Stabilization and expansion of the E-cadherin adherens junction |
| 0.1 | 3.8 | PID PLK1 PATHWAY | PLK1 signaling events |
| 0.1 | 17.5 | NABA ECM GLYCOPROTEINS | Genes encoding structural ECM glycoproteins |
| 0.1 | 1.6 | PID MYC PATHWAY | C-MYC pathway |
| 0.1 | 1.1 | PID CIRCADIAN PATHWAY | Circadian rhythm pathway |
| 0.1 | 0.8 | PID FCER1 PATHWAY | Fc-epsilon receptor I signaling in mast cells |
| 0.0 | 1.9 | PID TAP63 PATHWAY | Validated transcriptional targets of TAp63 isoforms |
| 0.0 | 2.0 | PID MTOR 4PATHWAY | mTOR signaling pathway |
| 0.0 | 5.6 | NABA ECM REGULATORS | Genes encoding enzymes and their regulators involved in the remodeling of the extracellular matrix |
| 0.0 | 5.6 | NABA MATRISOME ASSOCIATED | Ensemble of genes encoding ECM-associated proteins including ECM-affilaited proteins, ECM regulators and secreted factors |
Gene overrepresentation in curated gene sets: REACTOME pathways category:
| Log-likelihood per target | Total log-likelihood | Term | Description |
|---|---|---|---|
| 9.6 | 162.9 | REACTOME CELL EXTRACELLULAR MATRIX INTERACTIONS | Genes involved in Cell-extracellular matrix interactions |
| 2.2 | 41.5 | REACTOME SYNTHESIS OF GLYCOSYLPHOSPHATIDYLINOSITOL GPI | Genes involved in Synthesis of glycosylphosphatidylinositol (GPI) |
| 2.1 | 37.0 | REACTOME CITRIC ACID CYCLE TCA CYCLE | Genes involved in Citric acid cycle (TCA cycle) |
| 1.8 | 26.8 | REACTOME P38MAPK EVENTS | Genes involved in p38MAPK events |
| 1.6 | 40.6 | REACTOME INSULIN SYNTHESIS AND PROCESSING | Genes involved in Insulin Synthesis and Processing |
| 1.3 | 10.8 | REACTOME ETHANOL OXIDATION | Genes involved in Ethanol oxidation |
| 1.0 | 50.2 | REACTOME IMMUNOREGULATORY INTERACTIONS BETWEEN A LYMPHOID AND A NON LYMPHOID CELL | Genes involved in Immunoregulatory interactions between a Lymphoid and a non-Lymphoid cell |
| 0.9 | 15.2 | REACTOME ANTIGEN PRESENTATION FOLDING ASSEMBLY AND PEPTIDE LOADING OF CLASS I MHC | Genes involved in Antigen Presentation: Folding, assembly and peptide loading of class I MHC |
| 0.8 | 13.9 | REACTOME AMINO ACID SYNTHESIS AND INTERCONVERSION TRANSAMINATION | Genes involved in Amino acid synthesis and interconversion (transamination) |
| 0.5 | 8.7 | REACTOME IONOTROPIC ACTIVITY OF KAINATE RECEPTORS | Genes involved in Ionotropic activity of Kainate Receptors |
| 0.4 | 4.7 | REACTOME G2 M DNA DAMAGE CHECKPOINT | Genes involved in G2/M DNA damage checkpoint |
| 0.4 | 5.1 | REACTOME BASE FREE SUGAR PHOSPHATE REMOVAL VIA THE SINGLE NUCLEOTIDE REPLACEMENT PATHWAY | Genes involved in Base-free sugar-phosphate removal via the single-nucleotide replacement pathway |
| 0.3 | 3.7 | REACTOME PASSIVE TRANSPORT BY AQUAPORINS | Genes involved in Passive Transport by Aquaporins |
| 0.3 | 27.9 | REACTOME RESPONSE TO ELEVATED PLATELET CYTOSOLIC CA2 | Genes involved in Response to elevated platelet cytosolic Ca2+ |
| 0.2 | 1.9 | REACTOME ACTIVATION OF CHAPERONE GENES BY ATF6 ALPHA | Genes involved in Activation of Chaperone Genes by ATF6-alpha |
| 0.2 | 2.8 | REACTOME BILE SALT AND ORGANIC ANION SLC TRANSPORTERS | Genes involved in Bile salt and organic anion SLC transporters |
| 0.2 | 1.9 | REACTOME REGULATED PROTEOLYSIS OF P75NTR | Genes involved in Regulated proteolysis of p75NTR |
| 0.2 | 5.8 | REACTOME PIP3 ACTIVATES AKT SIGNALING | Genes involved in PIP3 activates AKT signaling |
| 0.2 | 6.8 | REACTOME ACTIVATION OF CHAPERONE GENES BY XBP1S | Genes involved in Activation of Chaperone Genes by XBP1(S) |
| 0.2 | 2.6 | REACTOME RAP1 SIGNALLING | Genes involved in Rap1 signalling |
| 0.1 | 2.1 | REACTOME SYNTHESIS OF SUBSTRATES IN N GLYCAN BIOSYTHESIS | Genes involved in Synthesis of substrates in N-glycan biosythesis |
| 0.1 | 6.8 | REACTOME P53 INDEPENDENT G1 S DNA DAMAGE CHECKPOINT | Genes involved in p53-Independent G1/S DNA damage checkpoint |
| 0.1 | 1.8 | REACTOME SYNTHESIS OF PE | Genes involved in Synthesis of PE |
| 0.1 | 3.2 | REACTOME TRANSPORT OF VITAMINS NUCLEOSIDES AND RELATED MOLECULES | Genes involved in Transport of vitamins, nucleosides, and related molecules |
| 0.1 | 3.4 | REACTOME SPHINGOLIPID DE NOVO BIOSYNTHESIS | Genes involved in Sphingolipid de novo biosynthesis |
| 0.1 | 8.1 | REACTOME CLASS B 2 SECRETIN FAMILY RECEPTORS | Genes involved in Class B/2 (Secretin family receptors) |
| 0.1 | 2.5 | REACTOME NCAM1 INTERACTIONS | Genes involved in NCAM1 interactions |
| 0.1 | 1.5 | REACTOME ACYL CHAIN REMODELLING OF PE | Genes involved in Acyl chain remodelling of PE |
| 0.1 | 9.8 | REACTOME ANTIGEN PROCESSING UBIQUITINATION PROTEASOME DEGRADATION | Genes involved in Antigen processing: Ubiquitination & Proteasome degradation |
| 0.0 | 1.6 | REACTOME EXTENSION OF TELOMERES | Genes involved in Extension of Telomeres |
| 0.0 | 2.0 | REACTOME NOTCH1 INTRACELLULAR DOMAIN REGULATES TRANSCRIPTION | Genes involved in NOTCH1 Intracellular Domain Regulates Transcription |
| 0.0 | 1.1 | REACTOME BMAL1 CLOCK NPAS2 ACTIVATES CIRCADIAN EXPRESSION | Genes involved in BMAL1:CLOCK/NPAS2 Activates Circadian Expression |
| 0.0 | 0.4 | REACTOME MITOCHONDRIAL TRNA AMINOACYLATION | Genes involved in Mitochondrial tRNA aminoacylation |
| 0.0 | 1.3 | REACTOME TRANSPORT OF INORGANIC CATIONS ANIONS AND AMINO ACIDS OLIGOPEPTIDES | Genes involved in Transport of inorganic cations/anions and amino acids/oligopeptides |