Project
GSE53960: rat RNA-Seq transcriptomic Bodymap
Navigation
Downloads
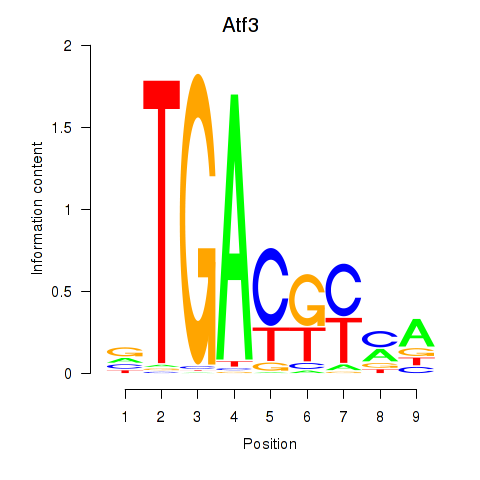
Results for Atf3
Z-value: 1.11
Motif logo
Transcription factors associated with Atf3
| Gene Symbol | Gene ID | Gene Info |
|---|---|---|
|
Atf3
|
ENSRNOG00000003745 | activating transcription factor 3 |
Activity-expression correlation:
| Gene | Promoter | Pearson corr. coef. | P-value | Plot |
|---|---|---|---|---|
| Atf3 | rn6_v1_chr13_-_109844359_109844359 | -0.36 | 4.2e-11 | Click! |
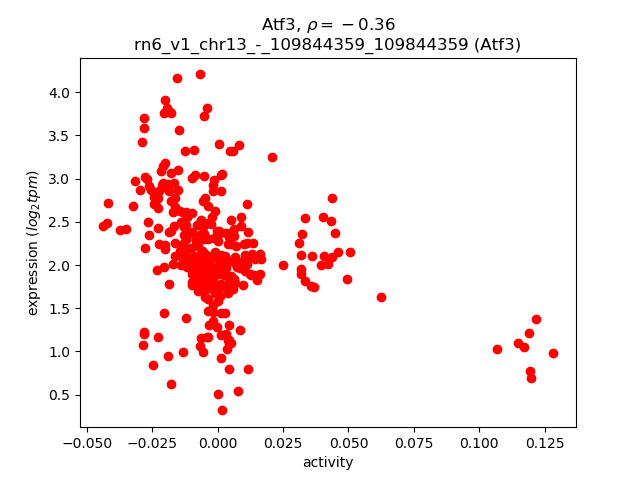
Activity profile of Atf3 motif
Sorted Z-values of Atf3 motif
| Promoter | Log-likelihood | Transcript | Gene | Gene Info |
|---|---|---|---|---|
| chr10_+_82775691 | 34.40 |
ENSRNOT00000030737
|
Hils1
|
histone linker H1 domain, spermatid-specific 1 |
| chr2_-_127778202 | 30.53 |
ENSRNOT00000092191
ENSRNOT00000093683 |
LOC365778
|
similar to RIKEN cDNA 1700034I23 |
| chr4_+_79055280 | 29.01 |
ENSRNOT00000086307
|
Stk31
|
serine threonine kinase 31 |
| chr14_-_21748356 | 28.23 |
ENSRNOT00000002670
|
Cabs1
|
calcium binding protein, spermatid associated 1 |
| chr4_+_70977556 | 26.36 |
ENSRNOT00000031984
|
LOC680112
|
hypothetical protein LOC680112 |
| chr8_-_115263484 | 25.53 |
ENSRNOT00000039696
ENSRNOT00000081138 |
Iqcf3
|
IQ motif containing F3 |
| chr5_+_131719922 | 23.27 |
ENSRNOT00000010524
|
Spata6
|
spermatogenesis associated 6 |
| chr8_-_115274165 | 22.84 |
ENSRNOT00000056386
|
LOC102550160
|
IQ domain-containing protein F5-like |
| chr3_+_143129248 | 22.42 |
ENSRNOT00000006667
|
Cst8
|
cystatin 8 |
| chr7_+_20462081 | 22.14 |
ENSRNOT00000088383
|
AABR07056131.1
|
|
| chr17_-_10622226 | 22.03 |
ENSRNOT00000044559
|
Simc1
|
SUMO-interacting motifs containing 1 |
| chr1_-_206394346 | 21.89 |
ENSRNOT00000038122
|
LOC100302465
|
hypothetical LOC100302465 |
| chr9_-_104467973 | 21.89 |
ENSRNOT00000026099
|
Slco6b1
|
solute carrier organic anion transporter family member 6B1 |
| chr14_+_96499520 | 21.30 |
ENSRNOT00000074692
|
AABR07016310.1
|
|
| chrX_-_63999622 | 21.01 |
ENSRNOT00000090902
|
LOC103694487
|
protein gar2-like |
| chr3_+_108544931 | 20.76 |
ENSRNOT00000006809
|
Tmco5a
|
transmembrane and coiled-coil domains 5A |
| chr2_+_30664639 | 19.51 |
ENSRNOT00000076372
ENSRNOT00000076294 ENSRNOT00000076434 ENSRNOT00000076484 |
Taf9
|
TATA-box binding protein associated factor 9 |
| chr16_-_82288022 | 19.19 |
ENSRNOT00000078609
|
Spaca7
|
sperm acrosome associated 7 |
| chr6_+_136536736 | 18.71 |
ENSRNOT00000086594
|
Tdrd9
|
tudor domain containing 9 |
| chr13_-_90641772 | 18.24 |
ENSRNOT00000064601
|
Atp1a4
|
ATPase Na+/K+ transporting subunit alpha 4 |
| chr1_+_100501676 | 18.10 |
ENSRNOT00000043724
|
Fam71e1
|
family with sequence similarity 71, member E1 |
| chr11_-_60251415 | 17.50 |
ENSRNOT00000080148
ENSRNOT00000086602 |
Slc9c1
|
solute carrier family 9 member C1 |
| chr3_-_119247449 | 17.25 |
ENSRNOT00000015238
|
Usp50
|
ubiquitin specific peptidase 50 |
| chr9_-_80295446 | 17.22 |
ENSRNOT00000023769
|
Tnp1
|
transition protein 1 |
| chr1_-_227457629 | 17.05 |
ENSRNOT00000035910
ENSRNOT00000073770 |
Ms4a5
|
membrane spanning 4-domains A5 |
| chr4_+_120156659 | 16.66 |
ENSRNOT00000050584
|
Dnajb8
|
DnaJ heat shock protein family (Hsp40) member B8 |
| chr9_-_113358526 | 16.43 |
ENSRNOT00000065073
|
Txndc2
|
thioredoxin domain containing 2 |
| chr16_+_90613870 | 16.19 |
ENSRNOT00000079334
|
Shcbp1
|
SHC binding and spindle associated 1 |
| chr16_+_12955826 | 15.99 |
ENSRNOT00000060751
|
4930596D02Rik
|
RIKEN cDNA 4930596D02 gene |
| chr16_+_20121352 | 15.82 |
ENSRNOT00000025347
|
Insl3
|
insulin-like 3 |
| chr1_-_206417143 | 15.82 |
ENSRNOT00000091863
ENSRNOT00000073836 |
LOC100302465
|
hypothetical LOC100302465 |
| chr1_-_169344306 | 15.72 |
ENSRNOT00000022852
|
Ubqlnl
|
ubiquilin-like |
| chr1_-_169321075 | 15.66 |
ENSRNOT00000055216
|
RGD1562433
|
similar to ubiquilin 1 isoform 2 |
| chr11_+_54137639 | 15.35 |
ENSRNOT00000066343
|
LOC100909977
|
leukocyte surface antigen CD47-like |
| chr5_+_73496027 | 15.26 |
ENSRNOT00000022395
|
Actl7a
|
actin-like 7a |
| chr7_+_143096874 | 15.12 |
ENSRNOT00000010881
|
RGD1305207
|
similar to RIKEN cDNA 1700011A15 |
| chr10_-_91581232 | 14.77 |
ENSRNOT00000066453
ENSRNOT00000068686 |
AABR07030520.1
|
|
| chrX_+_63897664 | 14.68 |
ENSRNOT00000089271
|
LOC103694487
|
protein gar2-like |
| chr1_+_277641512 | 14.50 |
ENSRNOT00000084861
ENSRNOT00000023024 |
Tdrd1
|
tudor domain containing 1 |
| chr17_+_85382116 | 14.39 |
ENSRNOT00000002513
|
Spag6
|
sperm associated antigen 6 |
| chr20_+_30791422 | 14.18 |
ENSRNOT00000047394
ENSRNOT00000000683 |
Tbata
|
thymus, brain and testes associated |
| chr1_+_22332090 | 14.11 |
ENSRNOT00000091252
|
AABR07000663.1
|
trace amine-associated receptor 8c (Taar8c), mRNA |
| chr5_-_58163584 | 14.10 |
ENSRNOT00000060594
|
Ccl27
|
C-C motif chemokine ligand 27 |
| chr1_+_72644333 | 14.05 |
ENSRNOT00000048976
ENSRNOT00000065051 |
Fam71e2
|
family with sequence similarity 71, member E2 |
| chr2_+_93758919 | 14.02 |
ENSRNOT00000077782
|
Fabp12
|
fatty acid binding protein 12 |
| chrX_+_583925 | 14.02 |
ENSRNOT00000075665
|
AABR07036698.1
|
|
| chr17_-_43675934 | 13.93 |
ENSRNOT00000081345
|
Hist1h1t
|
histone cluster 1 H1 family member t |
| chr5_-_49439358 | 13.83 |
ENSRNOT00000010909
|
Spaca1
|
sperm acrosome associated 1 |
| chr5_-_17399801 | 13.82 |
ENSRNOT00000011900
|
RGD1563405
|
similar to protein tyrosine phosphatase 4a2 |
| chr9_-_54457753 | 13.81 |
ENSRNOT00000020032
|
Stat1
|
signal transducer and activator of transcription 1 |
| chr4_+_114854458 | 13.77 |
ENSRNOT00000013312
|
LOC500227
|
hypothetical gene supported by BC079424 |
| chr15_+_28319136 | 13.77 |
ENSRNOT00000048723
|
Tppp2
|
tubulin polymerization-promoting protein family member 2 |
| chr1_-_7322424 | 13.69 |
ENSRNOT00000066725
ENSRNOT00000081112 |
Zc2hc1b
|
zinc finger, C2HC-type containing 1B |
| chr4_+_174181644 | 13.64 |
ENSRNOT00000011555
|
Capza3
|
capping actin protein of muscle Z-line alpha subunit 3 |
| chr3_+_170996193 | 13.59 |
ENSRNOT00000008959
|
Spo11
|
SPO11, initiator of meiotic double stranded breaks |
| chr2_-_44504354 | 13.44 |
ENSRNOT00000013035
|
Ddx4
|
DEAD-box helicase 4 |
| chr3_+_151609602 | 13.23 |
ENSRNOT00000065052
|
Spag4
|
sperm associated antigen 4 |
| chr4_-_169036950 | 13.21 |
ENSRNOT00000011295
|
Gsg1
|
germ cell associated 1 |
| chr3_+_2504694 | 13.11 |
ENSRNOT00000061987
|
Tmem210
|
transmembrane protein 210 |
| chr10_+_74436534 | 13.08 |
ENSRNOT00000008298
|
Trim37
|
tripartite motif-containing 37 |
| chr19_-_26082719 | 13.06 |
ENSRNOT00000083159
|
Rnaseh2a
|
ribonuclease H2, subunit A |
| chr9_-_16095007 | 13.04 |
ENSRNOT00000073333
|
AABR07066782.1
|
|
| chr1_+_224938801 | 13.04 |
ENSRNOT00000073052
|
1700092M07Rik
|
RIKEN cDNA 1700092M07 gene |
| chr9_-_14906410 | 12.93 |
ENSRNOT00000061674
|
LOC680955
|
hypothetical protein LOC680955 |
| chr10_+_5352933 | 12.91 |
ENSRNOT00000003465
|
Tekt5
|
tektin 5 |
| chr5_+_59452348 | 12.79 |
ENSRNOT00000019887
|
Ccin
|
calicin |
| chr3_+_152143811 | 12.71 |
ENSRNOT00000026578
|
LOC100911109
|
sperm-associated antigen 4 protein-like |
| chr3_+_54734015 | 12.70 |
ENSRNOT00000034341
|
LOC685184
|
similar to protein expressed in prostate, ovary, testis, and placenta 8 isoform 2 |
| chr19_+_880024 | 12.69 |
ENSRNOT00000061648
|
Cmtm2a
|
CKLF-like MARVEL transmembrane domain containing 2A |
| chrX_+_130007087 | 12.46 |
ENSRNOT00000074996
|
Tex13c
|
TEX13 family member C |
| chr4_-_114853868 | 12.42 |
ENSRNOT00000090828
|
Wdr54
|
WD repeat domain 54 |
| chr5_-_129175597 | 12.34 |
ENSRNOT00000012112
|
LOC689589
|
hypothetical protein LOC689589 |
| chr17_-_43614844 | 12.30 |
ENSRNOT00000023054
|
Hist1h1a
|
histone cluster 1 H1 family member a |
| chr9_+_23503236 | 12.19 |
ENSRNOT00000017996
|
Crisp2
|
cysteine-rich secretory protein 2 |
| chr1_-_213534641 | 12.14 |
ENSRNOT00000033074
|
Syce1
|
synaptonemal complex central element protein 1 |
| chr4_-_156945126 | 12.13 |
ENSRNOT00000064853
|
RGD1307916
|
LOC362433 |
| chr1_-_24604400 | 12.13 |
ENSRNOT00000081175
|
1700020N01Rik
|
RIKEN cDNA 1700020N01 gene |
| chr6_+_12415805 | 12.11 |
ENSRNOT00000022380
|
Gtf2a1l
|
general transcription factor 2A subunit 1 like |
| chr3_+_8453609 | 12.09 |
ENSRNOT00000041921
|
Odf2
|
outer dense fiber of sperm tails 2 |
| chr16_-_81309954 | 12.06 |
ENSRNOT00000092361
|
LOC290876
|
similar to RIKEN cDNA 1700029H14 |
| chr10_+_59893067 | 12.05 |
ENSRNOT00000056443
|
Spata22
|
spermatogenesis associated 22 |
| chr8_-_16486419 | 12.01 |
ENSRNOT00000033223
|
LOC690235
|
similar to MAP/microtubule affinity-regulating kinase 4 (MAP/microtubule affinity-regulating kinase-like 1) |
| chr9_-_119871382 | 12.00 |
ENSRNOT00000018644
|
Ndc80
|
NDC80 kinetochore complex component |
| chr20_-_44220702 | 11.97 |
ENSRNOT00000036853
|
Fam229b
|
family with sequence similarity 229, member B |
| chr2_-_84531192 | 11.93 |
ENSRNOT00000065312
ENSRNOT00000090540 |
Ropn1l
|
rhophilin associated tail protein 1-like |
| chr9_-_114282799 | 11.82 |
ENSRNOT00000090539
|
LOC102555328
|
uncharacterized LOC102555328 |
| chr10_+_4945911 | 11.81 |
ENSRNOT00000003420
|
Prm1
|
protamine 1 |
| chr7_-_20070772 | 11.79 |
ENSRNOT00000071008
|
LOC102551633
|
sperm motility kinase W-like |
| chr19_-_42180362 | 11.74 |
ENSRNOT00000089515
|
Pmfbp1
|
polyamine modulated factor 1 binding protein 1 |
| chr1_-_201702963 | 11.61 |
ENSRNOT00000031258
|
LOC499276
|
similar to RIKEN cDNA 1700022C21 |
| chr2_-_132551235 | 11.57 |
ENSRNOT00000058250
|
LOC100365525
|
rCG65904-like |
| chr10_+_88356615 | 11.54 |
ENSRNOT00000022687
|
Klhl10
|
kelch-like family member 10 |
| chr16_-_70998575 | 11.54 |
ENSRNOT00000019935
|
Kcnu1
|
potassium calcium-activated channel subfamily U member 1 |
| chr1_-_227486976 | 11.53 |
ENSRNOT00000035812
|
Ms4a14
|
membrane spanning 4-domains A14 |
| chr16_+_19097391 | 11.50 |
ENSRNOT00000018018
|
Calr3
|
calreticulin 3 |
| chr10_+_103992309 | 11.44 |
ENSRNOT00000065292
|
Trim80
|
tripartite motif protein 80 |
| chr10_-_105412627 | 11.40 |
ENSRNOT00000034817
|
Qrich2
|
glutamine rich 2 |
| chr4_-_6062641 | 11.39 |
ENSRNOT00000074846
|
Cct8l1
|
chaperonin containing TCP1, subunit 8 (theta)-like 1 |
| chr9_-_50820290 | 11.36 |
ENSRNOT00000050748
|
LOC102548013
|
uncharacterized LOC102548013 |
| chr4_+_157563990 | 11.35 |
ENSRNOT00000024618
|
Acrbp
|
acrosin binding protein |
| chr10_+_57239993 | 11.27 |
ENSRNOT00000067919
|
LOC687707
|
hypothetical protein LOC687707 |
| chr17_+_2804307 | 11.27 |
ENSRNOT00000061701
|
LOC502109
|
similar to FLJ46321 protein |
| chr7_+_20262680 | 11.24 |
ENSRNOT00000046378
|
LOC300308
|
similar to hypothetical protein 4930509O22 |
| chr10_-_43891885 | 11.22 |
ENSRNOT00000084984
|
LOC691286
|
similar to RIKEN cDNA 4930504O13 |
| chrY_+_422855 | 11.21 |
ENSRNOT00000092178
|
Uba1y
|
ubiquitin-activating enzyme, Chr Y |
| chrX_+_62282212 | 11.15 |
ENSRNOT00000039568
|
AABR07038837.1
|
|
| chr4_+_52199416 | 11.12 |
ENSRNOT00000009537
|
Spam1
|
sperm adhesion molecule 1 |
| chr4_+_123801174 | 11.11 |
ENSRNOT00000029055
|
RGD1560289
|
similar to chromosome 3 open reading frame 20 |
| chr15_+_36609296 | 11.07 |
ENSRNOT00000010795
|
Rnf17
|
ring finger protein 17 |
| chr1_-_14117021 | 11.02 |
ENSRNOT00000004344
|
RGD1560303
|
similar to hypothetical protein 4933423E17 |
| chr8_-_36760742 | 10.97 |
ENSRNOT00000017307
|
Ddx25
|
DEAD-box helicase 25 |
| chr19_+_9895121 | 10.93 |
ENSRNOT00000033953
|
Prss54
|
protease, serine, 54 |
| chr19_-_42180981 | 10.92 |
ENSRNOT00000019577
|
Pmfbp1
|
polyamine modulated factor 1 binding protein 1 |
| chr10_+_74436208 | 10.89 |
ENSRNOT00000090921
ENSRNOT00000091163 |
Trim37
|
tripartite motif-containing 37 |
| chr19_-_49518721 | 10.87 |
ENSRNOT00000071332
|
LOC687399
|
hypothetical protein LOC687399 |
| chr13_+_93751759 | 10.84 |
ENSRNOT00000065706
|
Wdr64
|
WD repeat domain 64 |
| chrX_+_13441558 | 10.82 |
ENSRNOT00000030170
|
RGD1561661
|
similar to Ferritin light chain (Ferritin L subunit) |
| chr7_-_20118466 | 10.81 |
ENSRNOT00000080523
|
RGD1565071
|
similar to hypothetical protein 4930509O22 |
| chr10_-_56511583 | 10.79 |
ENSRNOT00000021402
|
LOC497940
|
similar to RIKEN cDNA 2810408A11 |
| chrX_+_57866709 | 10.77 |
ENSRNOT00000040923
|
Ppp4r3c
|
protein phosphatase 4 regulatory subunit 3C |
| chr1_+_100086520 | 10.72 |
ENSRNOT00000025723
|
Klk1
|
kallikrein 1 |
| chr1_-_98490315 | 10.72 |
ENSRNOT00000056490
|
Cldnd2
|
claudin domain containing 2 |
| chr19_+_49457677 | 10.68 |
ENSRNOT00000084445
|
Cenpn
|
centromere protein N |
| chr20_+_17750744 | 10.68 |
ENSRNOT00000000745
|
RGD1559903
|
similar to RIKEN cDNA 1700049L16 |
| chr1_-_101708286 | 10.67 |
ENSRNOT00000028558
|
Spaca4
|
sperm acrosome associated 4 |
| chr14_-_108284619 | 10.65 |
ENSRNOT00000078814
|
LOC690352
|
hypothetical protein LOC690352 |
| chr2_+_27905535 | 10.65 |
ENSRNOT00000022120
|
Fam169a
|
family with sequence similarity 169, member A |
| chr8_-_111850075 | 10.63 |
ENSRNOT00000082097
|
Cdv3
|
CDV3 homolog |
| chr4_-_181348038 | 10.58 |
ENSRNOT00000082879
|
LOC690784
|
hypothetical protein LOC690783 |
| chr10_-_98124743 | 10.52 |
ENSRNOT00000037415
|
RGD1559578
|
RGD1559578 |
| chr9_+_53013413 | 10.50 |
ENSRNOT00000005313
|
Ankar
|
ankyrin and armadillo repeat containing |
| chr9_-_114327767 | 10.48 |
ENSRNOT00000085481
|
AABR07068674.1
|
|
| chr4_+_96831880 | 10.43 |
ENSRNOT00000068400
|
RSA-14-44
|
RSA-14-44 protein |
| chr17_+_5342829 | 10.42 |
ENSRNOT00000079938
|
Spata31d3
|
SPATA31 subfamily D, member 3 |
| chr13_+_53351717 | 10.41 |
ENSRNOT00000012038
|
Kif14
|
kinesin family member 14 |
| chr18_+_4084228 | 10.34 |
ENSRNOT00000071392
|
Cabyr
|
calcium binding tyrosine phosphorylation regulated |
| chr1_+_101265272 | 10.31 |
ENSRNOT00000051280
|
RGD1562492
|
similar to Orphan sodium- and chloride-dependent neurotransmitter transporter NTT5 (Solute carrier family 6 member 16) |
| chr16_-_75648538 | 10.30 |
ENSRNOT00000048414
|
Defb14
|
defensin beta 14 |
| chr13_-_79890134 | 10.25 |
ENSRNOT00000083043
|
RGD1309106
|
similar to hypothetical protein |
| chr4_-_6046477 | 10.23 |
ENSRNOT00000073925
|
Cct8l1
|
chaperonin containing TCP1, subunit 8 (theta)-like 1 |
| chrX_-_17486721 | 10.22 |
ENSRNOT00000014611
|
Smptb
|
polypyrimidine tract-binding protein |
| chr10_+_14519164 | 10.20 |
ENSRNOT00000079543
ENSRNOT00000046884 |
Ccdc154
|
coiled-coil domain containing 154 |
| chr3_+_143119687 | 10.17 |
ENSRNOT00000006608
|
Cst12
|
cystatin 12 |
| chr5_-_146446227 | 10.17 |
ENSRNOT00000044868
|
Hmgb4
|
high-mobility group box 4 |
| chr5_+_172275734 | 10.17 |
ENSRNOT00000064266
|
Mmel1
|
membrane metallo-endopeptidase-like 1 |
| chr3_+_170475831 | 10.15 |
ENSRNOT00000006949
|
Fam209a
|
family with sequence similarity 209, member A |
| chr6_+_109110534 | 10.15 |
ENSRNOT00000009156
|
Zc2hc1c
|
zinc finger, C2HC-type containing 1C |
| chr10_-_62191512 | 10.12 |
ENSRNOT00000090262
|
Rpa1
|
replication protein A1 |
| chr6_+_36089433 | 10.11 |
ENSRNOT00000090438
ENSRNOT00000005731 |
Nt5c1b
|
5'-nucleotidase, cytosolic IB |
| chr18_+_25749098 | 10.07 |
ENSRNOT00000027771
|
Camk4
|
calcium/calmodulin-dependent protein kinase IV |
| chr14_-_108285008 | 10.07 |
ENSRNOT00000087501
|
LOC690352
|
hypothetical protein LOC690352 |
| chr14_+_39368530 | 10.07 |
ENSRNOT00000084367
|
Cox7b2
|
cytochrome c oxidase subunit 7B2 |
| chr15_+_90364605 | 10.06 |
ENSRNOT00000020876
|
Trim52
|
tripartite motif-containing 52 |
| chr16_+_51730452 | 10.04 |
ENSRNOT00000078614
|
Adam34l
|
a disintegrin and metalloprotease domain 34-like |
| chr16_+_71241335 | 10.00 |
ENSRNOT00000066144
|
Letm2
|
leucine zipper and EF-hand containing transmembrane protein 2 |
| chr15_-_47338976 | 9.99 |
ENSRNOT00000016562
|
RGD1565212
|
similar to 4930578I06Rik protein |
| chr10_+_70242874 | 9.98 |
ENSRNOT00000010924
|
Fndc8
|
fibronectin type III domain containing 8 |
| chr5_-_39611053 | 9.98 |
ENSRNOT00000046595
|
Fhl5
|
four and a half LIM domains 5 |
| chr2_+_264704769 | 9.96 |
ENSRNOT00000012667
|
Depdc1
|
DEP domain containing 1 |
| chr10_+_45307007 | 9.96 |
ENSRNOT00000003885
|
Trim17
|
tripartite motif-containing 17 |
| chr5_-_140024176 | 9.90 |
ENSRNOT00000016492
|
Tmco2
|
transmembrane and coiled-coil domains 2 |
| chr1_-_56942556 | 9.89 |
ENSRNOT00000021141
|
Wdr27
|
WD repeat domain 27 |
| chr19_-_860493 | 9.88 |
ENSRNOT00000078469
|
LOC102554842
|
CKLF-like MARVEL transmembrane domain-containing protein 2B-like |
| chr3_-_173947018 | 9.88 |
ENSRNOT00000078047
|
Sycp2
|
synaptonemal complex protein 2 |
| chrX_-_97262013 | 9.85 |
ENSRNOT00000040168
|
Cldn34c4
|
claudin 34C4 |
| chr15_+_80040842 | 9.83 |
ENSRNOT00000043065
|
RGD1306441
|
similar to RIKEN cDNA 4921530L21 |
| chr9_-_100479868 | 9.83 |
ENSRNOT00000022748
|
Pask
|
PAS domain containing serine/threonine kinase |
| chr17_-_30865419 | 9.82 |
ENSRNOT00000022929
|
Fam50b
|
family with sequence similarity 50, member B |
| chr10_+_62981297 | 9.72 |
ENSRNOT00000031618
|
Efcab5
|
EF-hand calcium binding domain 5 |
| chr4_-_34780193 | 9.71 |
ENSRNOT00000011651
|
Ica1
|
islet cell autoantigen 1 |
| chr3_+_176985900 | 9.70 |
ENSRNOT00000020210
|
Abhd16b
|
abhydrolase domain containing 16B |
| chr6_+_101288951 | 9.70 |
ENSRNOT00000046901
|
RGD1562540
|
RGD1562540 |
| chr15_-_44411004 | 9.70 |
ENSRNOT00000031163
|
Cdca2
|
cell division cycle associated 2 |
| chr18_+_47294292 | 9.66 |
ENSRNOT00000020109
|
Ftmt
|
ferritin mitochondrial |
| chr19_+_55300395 | 9.61 |
ENSRNOT00000092169
|
Ctu2
|
cytosolic thiouridylase subunit 2 |
| chr17_-_14373983 | 9.55 |
ENSRNOT00000071112
|
AABR07027098.1
|
|
| chr1_-_54854353 | 9.54 |
ENSRNOT00000072895
|
Smok2a
|
sperm motility kinase 2A |
| chr17_+_56935451 | 9.52 |
ENSRNOT00000058966
|
RGD1564129
|
similar to hypothetical protein 4930474N05 |
| chr1_+_211582077 | 9.51 |
ENSRNOT00000023619
|
Pwwp2b
|
PWWP domain containing 2B |
| chr10_-_82252720 | 9.49 |
ENSRNOT00000066132
ENSRNOT00000075795 |
Mycbpap
|
Mycbp associated protein |
| chr12_-_50213400 | 9.48 |
ENSRNOT00000048541
|
LOC102552378
|
trichohyalin-like |
| chr1_+_196737627 | 9.48 |
ENSRNOT00000066652
|
LOC100271845
|
hypothetical protein LOC100271845 |
| chr17_+_15429708 | 9.43 |
ENSRNOT00000093261
|
LOC679342
|
hypothetical protein LOC679342 |
| chr1_-_262047332 | 9.40 |
ENSRNOT00000067274
|
Hpse2
|
heparanase 2 (inactive) |
| chr1_+_220096422 | 9.40 |
ENSRNOT00000034771
|
Ccdc87
|
coiled-coil domain containing 87 |
| chrX_-_147472677 | 9.39 |
ENSRNOT00000072063
|
Gm6760
|
predicted gene 6760 |
| chr1_-_226526959 | 9.37 |
ENSRNOT00000028003
|
Ppp1r32
|
protein phosphatase 1, regulatory subunit 32 |
| chr6_-_47848026 | 9.35 |
ENSRNOT00000011048
ENSRNOT00000090017 |
Allc
|
allantoicase |
| chr7_-_140951071 | 9.35 |
ENSRNOT00000082521
|
Fam186b
|
family with sequence similarity 186, member B |
| chr20_-_29990111 | 9.34 |
ENSRNOT00000048029
|
Cdh23
|
cadherin-related 23 |
| chr10_-_82252963 | 9.34 |
ENSRNOT00000086261
|
Mycbpap
|
Mycbp associated protein |
| chr20_+_5619012 | 9.29 |
ENSRNOT00000000577
|
Ggnbp1
|
gametogenetin binding protein 1 |
| chr1_-_141349881 | 9.29 |
ENSRNOT00000021109
|
Rhcg
|
Rh family, C glycoprotein |
| chr16_+_68633720 | 9.28 |
ENSRNOT00000081838
|
LOC100911229
|
sperm motility kinase-like |
| chr4_-_50693869 | 9.27 |
ENSRNOT00000064228
|
Rnf148
|
ring finger protein 148 |
| chrX_-_144001727 | 9.26 |
ENSRNOT00000078404
|
RGD1560585
|
similar to RIKEN cDNA 1700001F22 |
| chr14_+_1469748 | 9.23 |
ENSRNOT00000071648
|
Ppp2r3b
|
protein phosphatase 2, regulatory subunit B'', beta |
| chr1_+_221448661 | 9.23 |
ENSRNOT00000072493
|
LOC100910252
|
sororin-like |
| chr3_+_94035905 | 9.23 |
ENSRNOT00000014767
|
RGD1563222
|
similar to RIKEN cDNA A930018P22 |
| chr1_-_81733957 | 9.22 |
ENSRNOT00000027226
|
Lypd4
|
Ly6/Plaur domain containing 4 |
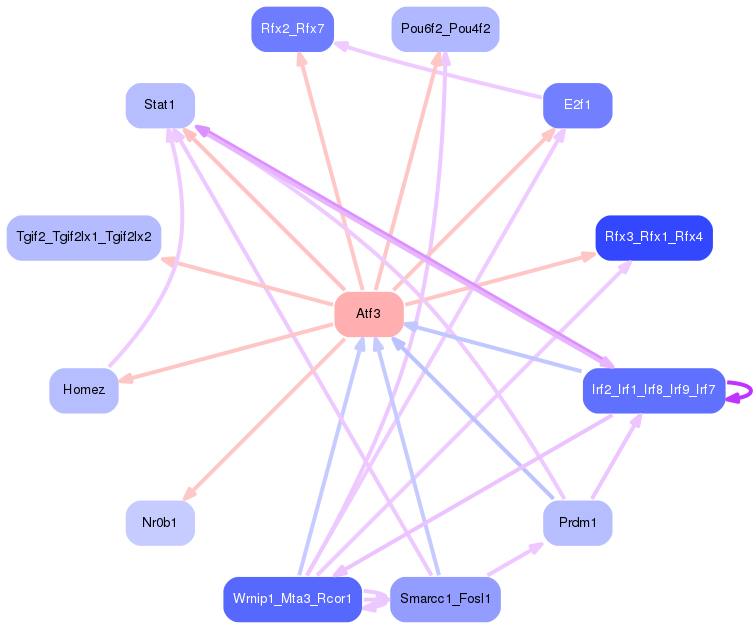
Network of associatons between targets according to the STRING database.

First level regulatory network of Atf3
Gene Ontology Analysis
Gene overrepresentation in biological process category:
| Log-likelihood per target | Total log-likelihood | Term | Description |
|---|---|---|---|
| 6.0 | 24.0 | GO:0036353 | histone H2A-K119 monoubiquitination(GO:0036353) |
| 5.4 | 21.5 | GO:0034240 | negative regulation of macrophage fusion(GO:0034240) |
| 5.2 | 15.7 | GO:0043605 | cellular amide catabolic process(GO:0043605) |
| 4.7 | 23.7 | GO:1990918 | double-strand break repair involved in meiotic recombination(GO:1990918) |
| 4.5 | 13.4 | GO:2001034 | positive regulation of double-strand break repair via nonhomologous end joining(GO:2001034) |
| 4.3 | 85.4 | GO:0035404 | histone-serine phosphorylation(GO:0035404) |
| 3.6 | 10.8 | GO:0000738 | DNA catabolic process, exonucleolytic(GO:0000738) |
| 3.6 | 36.0 | GO:2000344 | positive regulation of acrosome reaction(GO:2000344) |
| 3.6 | 21.4 | GO:0048808 | male genitalia morphogenesis(GO:0048808) male anatomical structure morphogenesis(GO:0090598) |
| 3.5 | 24.7 | GO:0000492 | box C/D snoRNP assembly(GO:0000492) |
| 3.5 | 10.4 | GO:0097498 | endothelial tube lumen extension(GO:0097498) |
| 3.5 | 10.4 | GO:0021698 | cerebellar cortex structural organization(GO:0021698) |
| 3.2 | 9.6 | GO:0002143 | tRNA wobble position uridine thiolation(GO:0002143) |
| 3.2 | 12.7 | GO:2000224 | regulation of testosterone biosynthetic process(GO:2000224) |
| 3.1 | 9.3 | GO:0070634 | transepithelial ammonium transport(GO:0070634) |
| 2.9 | 49.2 | GO:0034587 | piRNA metabolic process(GO:0034587) |
| 2.8 | 19.6 | GO:0007290 | spermatid nucleus elongation(GO:0007290) |
| 2.8 | 30.7 | GO:0051315 | attachment of mitotic spindle microtubules to kinetochore(GO:0051315) |
| 2.8 | 2.8 | GO:1903566 | positive regulation of protein localization to cilium(GO:1903566) |
| 2.7 | 10.7 | GO:1904158 | axonemal central apparatus assembly(GO:1904158) |
| 2.6 | 7.8 | GO:0051012 | microtubule sliding(GO:0051012) |
| 2.5 | 7.5 | GO:2000688 | positive regulation of rubidium ion transport(GO:2000682) positive regulation of rubidium ion transmembrane transporter activity(GO:2000688) |
| 2.5 | 32.1 | GO:0097577 | intracellular sequestering of iron ion(GO:0006880) sequestering of iron ion(GO:0097577) |
| 2.4 | 7.3 | GO:0060478 | acrosomal vesicle exocytosis(GO:0060478) |
| 2.4 | 2.4 | GO:0007066 | female meiosis sister chromatid cohesion(GO:0007066) |
| 2.3 | 11.7 | GO:0008292 | acetylcholine biosynthetic process(GO:0008292) acetate ester biosynthetic process(GO:1900620) |
| 2.3 | 9.3 | GO:0035519 | protein K29-linked ubiquitination(GO:0035519) |
| 2.3 | 6.9 | GO:0019244 | lactate biosynthetic process from pyruvate(GO:0019244) |
| 2.3 | 2.3 | GO:0030186 | melatonin metabolic process(GO:0030186) |
| 2.2 | 4.5 | GO:0009106 | lipoate metabolic process(GO:0009106) |
| 2.2 | 6.7 | GO:0002426 | immunoglobulin production in mucosal tissue(GO:0002426) |
| 2.2 | 6.5 | GO:0016062 | adaptation of rhodopsin mediated signaling(GO:0016062) light adaption(GO:0036367) |
| 2.1 | 6.4 | GO:0090370 | negative regulation of cholesterol efflux(GO:0090370) |
| 2.1 | 6.2 | GO:1902102 | metaphase/anaphase transition of meiotic cell cycle(GO:0044785) regulation of metaphase/anaphase transition of meiotic cell cycle(GO:1902102) negative regulation of metaphase/anaphase transition of meiotic cell cycle(GO:1902103) regulation of meiotic chromosome separation(GO:1905132) negative regulation of meiotic chromosome separation(GO:1905133) |
| 2.1 | 6.2 | GO:0006532 | aspartate biosynthetic process(GO:0006532) |
| 2.1 | 4.1 | GO:1902019 | regulation of cilium movement involved in cell motility(GO:0060295) regulation of cilium beat frequency involved in ciliary motility(GO:0060296) regulation of cilium-dependent cell motility(GO:1902019) |
| 2.1 | 4.1 | GO:0072034 | renal vesicle induction(GO:0072034) |
| 2.0 | 6.1 | GO:1905218 | cellular response to astaxanthin(GO:1905218) |
| 2.0 | 5.9 | GO:0036123 | histone H3-K9 dimethylation(GO:0036123) |
| 1.9 | 5.7 | GO:0036115 | fatty-acyl-CoA catabolic process(GO:0036115) |
| 1.9 | 3.8 | GO:0002331 | pre-B cell allelic exclusion(GO:0002331) |
| 1.9 | 11.3 | GO:0010825 | positive regulation of centrosome duplication(GO:0010825) |
| 1.9 | 13.0 | GO:0045719 | negative regulation of glycogen biosynthetic process(GO:0045719) |
| 1.8 | 11.0 | GO:0006287 | base-excision repair, gap-filling(GO:0006287) |
| 1.8 | 9.0 | GO:0044571 | [2Fe-2S] cluster assembly(GO:0044571) |
| 1.8 | 7.2 | GO:0045091 | single stranded viral RNA replication via double stranded DNA intermediate(GO:0039692) regulation of single stranded viral RNA replication via double stranded DNA intermediate(GO:0045091) |
| 1.8 | 7.2 | GO:0034080 | CENP-A containing nucleosome assembly(GO:0034080) CENP-A containing chromatin organization(GO:0061641) |
| 1.8 | 52.0 | GO:0030261 | chromosome condensation(GO:0030261) |
| 1.7 | 8.6 | GO:0070318 | positive regulation of G0 to G1 transition(GO:0070318) |
| 1.7 | 12.0 | GO:0000711 | meiotic DNA repair synthesis(GO:0000711) |
| 1.7 | 17.0 | GO:0034501 | protein localization to kinetochore(GO:0034501) |
| 1.7 | 13.2 | GO:0090286 | cytoskeletal anchoring at nuclear membrane(GO:0090286) |
| 1.6 | 18.1 | GO:0090084 | negative regulation of inclusion body assembly(GO:0090084) |
| 1.6 | 6.4 | GO:0010499 | proteasomal ubiquitin-independent protein catabolic process(GO:0010499) |
| 1.6 | 7.9 | GO:0021914 | negative regulation of smoothened signaling pathway involved in ventral spinal cord patterning(GO:0021914) |
| 1.6 | 14.1 | GO:0010820 | positive regulation of T cell chemotaxis(GO:0010820) |
| 1.5 | 6.2 | GO:0090521 | glomerular visceral epithelial cell migration(GO:0090521) |
| 1.5 | 6.1 | GO:1904781 | positive regulation of protein localization to centrosome(GO:1904781) |
| 1.5 | 13.7 | GO:0044821 | meiotic telomere tethering at nuclear periphery(GO:0044821) meiotic attachment of telomere to nuclear envelope(GO:0070197) chromosome attachment to the nuclear envelope(GO:0097240) |
| 1.5 | 4.6 | GO:1902303 | negative regulation of potassium ion export(GO:1902303) |
| 1.5 | 36.2 | GO:0031572 | mitotic G2 DNA damage checkpoint(GO:0007095) G2 DNA damage checkpoint(GO:0031572) |
| 1.5 | 4.5 | GO:1901421 | positive regulation of response to alcohol(GO:1901421) |
| 1.5 | 27.0 | GO:0001675 | acrosome assembly(GO:0001675) |
| 1.5 | 7.5 | GO:0046600 | negative regulation of centriole replication(GO:0046600) |
| 1.5 | 3.0 | GO:0090172 | microtubule cytoskeleton organization involved in homologous chromosome segregation(GO:0090172) |
| 1.5 | 7.4 | GO:0071930 | negative regulation of transcription involved in G1/S transition of mitotic cell cycle(GO:0071930) |
| 1.5 | 4.4 | GO:0001545 | primary ovarian follicle growth(GO:0001545) |
| 1.5 | 4.4 | GO:0031632 | positive regulation of synaptic vesicle fusion to presynaptic membrane(GO:0031632) |
| 1.4 | 14.0 | GO:0070837 | dehydroascorbic acid transport(GO:0070837) |
| 1.4 | 4.1 | GO:2001245 | regulation of phosphatidylcholine biosynthetic process(GO:2001245) |
| 1.4 | 4.1 | GO:0061091 | regulation of phospholipid translocation(GO:0061091) positive regulation of phospholipid translocation(GO:0061092) |
| 1.4 | 4.1 | GO:0007079 | mitotic chromosome movement towards spindle pole(GO:0007079) |
| 1.4 | 6.9 | GO:0009181 | purine nucleoside diphosphate catabolic process(GO:0009137) purine ribonucleoside diphosphate catabolic process(GO:0009181) |
| 1.4 | 31.5 | GO:0007130 | synaptonemal complex assembly(GO:0007130) |
| 1.4 | 4.1 | GO:0051867 | general adaptation syndrome, behavioral process(GO:0051867) |
| 1.3 | 3.9 | GO:0060830 | ciliary receptor clustering involved in smoothened signaling pathway(GO:0060830) |
| 1.3 | 5.2 | GO:2000255 | negative regulation of male germ cell proliferation(GO:2000255) |
| 1.3 | 14.1 | GO:0046085 | adenosine metabolic process(GO:0046085) |
| 1.3 | 29.2 | GO:0044458 | motile cilium assembly(GO:0044458) |
| 1.3 | 3.8 | GO:0048749 | compound eye development(GO:0048749) |
| 1.3 | 13.9 | GO:2000018 | regulation of male gonad development(GO:2000018) |
| 1.3 | 6.3 | GO:0001552 | ovarian follicle atresia(GO:0001552) |
| 1.3 | 7.6 | GO:0097211 | response to gonadotropin-releasing hormone(GO:0097210) cellular response to gonadotropin-releasing hormone(GO:0097211) |
| 1.2 | 11.2 | GO:0075522 | IRES-dependent viral translational initiation(GO:0075522) |
| 1.2 | 3.7 | GO:0017143 | insecticide metabolic process(GO:0017143) |
| 1.2 | 3.7 | GO:0000707 | meiotic DNA recombinase assembly(GO:0000707) |
| 1.2 | 4.9 | GO:1902534 | single-organism membrane invagination(GO:1902534) |
| 1.2 | 6.1 | GO:0033563 | dorsal/ventral axon guidance(GO:0033563) |
| 1.2 | 4.7 | GO:0007060 | male meiosis chromosome segregation(GO:0007060) |
| 1.2 | 99.9 | GO:0030317 | sperm motility(GO:0030317) |
| 1.2 | 21.1 | GO:0034508 | centromere complex assembly(GO:0034508) |
| 1.2 | 7.0 | GO:0090238 | positive regulation of arachidonic acid secretion(GO:0090238) |
| 1.2 | 3.5 | GO:0043382 | positive regulation of memory T cell differentiation(GO:0043382) |
| 1.1 | 10.3 | GO:0050957 | equilibrioception(GO:0050957) |
| 1.1 | 8.8 | GO:1900264 | regulation of DNA-directed DNA polymerase activity(GO:1900262) positive regulation of DNA-directed DNA polymerase activity(GO:1900264) |
| 1.1 | 25.2 | GO:0006298 | mismatch repair(GO:0006298) |
| 1.1 | 10.8 | GO:1902570 | protein localization to nucleolus(GO:1902570) |
| 1.1 | 3.2 | GO:0032053 | ciliary basal body organization(GO:0032053) |
| 1.1 | 8.4 | GO:0019852 | L-ascorbic acid metabolic process(GO:0019852) |
| 1.0 | 3.1 | GO:0071283 | cellular response to iron(III) ion(GO:0071283) |
| 1.0 | 6.2 | GO:0036158 | outer dynein arm assembly(GO:0036158) |
| 1.0 | 4.1 | GO:0039534 | negative regulation of MDA-5 signaling pathway(GO:0039534) |
| 1.0 | 5.1 | GO:0006216 | cytidine catabolic process(GO:0006216) cytidine deamination(GO:0009972) cytidine metabolic process(GO:0046087) |
| 1.0 | 6.1 | GO:0085020 | protein K6-linked ubiquitination(GO:0085020) |
| 1.0 | 2.0 | GO:0006083 | acetate metabolic process(GO:0006083) |
| 1.0 | 2.0 | GO:0035722 | interleukin-12-mediated signaling pathway(GO:0035722) cellular response to interleukin-12(GO:0071349) |
| 1.0 | 7.1 | GO:0000972 | transcription-dependent tethering of RNA polymerase II gene DNA at nuclear periphery(GO:0000972) |
| 1.0 | 2.0 | GO:0010481 | epidermal cell division(GO:0010481) regulation of epidermal cell division(GO:0010482) |
| 1.0 | 1.9 | GO:0006478 | peptidyl-tyrosine sulfation(GO:0006478) |
| 1.0 | 1.9 | GO:0075525 | viral translational termination-reinitiation(GO:0075525) |
| 1.0 | 4.8 | GO:0035627 | ceramide transport(GO:0035627) |
| 1.0 | 2.9 | GO:0015942 | formate metabolic process(GO:0015942) |
| 0.9 | 2.8 | GO:1902949 | regulation of neuronal signal transduction(GO:1902847) positive regulation of tau-protein kinase activity(GO:1902949) neurofibrillary tangle assembly(GO:1902988) regulation of neurofibrillary tangle assembly(GO:1902996) positive regulation of neurofibrillary tangle assembly(GO:1902998) |
| 0.9 | 3.8 | GO:0090204 | protein localization to nuclear pore(GO:0090204) |
| 0.9 | 7.5 | GO:0090315 | negative regulation of protein targeting to membrane(GO:0090315) |
| 0.9 | 2.8 | GO:0000962 | mitochondrial mRNA catabolic process(GO:0000958) positive regulation of mitochondrial RNA catabolic process(GO:0000962) |
| 0.9 | 2.8 | GO:0035600 | tRNA methylthiolation(GO:0035600) |
| 0.9 | 8.3 | GO:0035608 | protein deglutamylation(GO:0035608) |
| 0.9 | 2.7 | GO:0032298 | positive regulation of DNA-dependent DNA replication initiation(GO:0032298) |
| 0.9 | 4.6 | GO:0001844 | protein insertion into mitochondrial membrane involved in apoptotic signaling pathway(GO:0001844) |
| 0.9 | 4.4 | GO:0071694 | protein localization to extracellular region(GO:0071692) maintenance of protein location in extracellular region(GO:0071694) |
| 0.9 | 3.5 | GO:0071543 | diadenosine polyphosphate catabolic process(GO:0015961) diphosphoinositol polyphosphate metabolic process(GO:0071543) diadenosine pentaphosphate metabolic process(GO:1901906) diadenosine pentaphosphate catabolic process(GO:1901907) diadenosine hexaphosphate metabolic process(GO:1901908) diadenosine hexaphosphate catabolic process(GO:1901909) adenosine 5'-(hexahydrogen pentaphosphate) metabolic process(GO:1901910) adenosine 5'-(hexahydrogen pentaphosphate) catabolic process(GO:1901911) |
| 0.9 | 2.6 | GO:0002071 | glandular epithelial cell maturation(GO:0002071) positive regulation of type B pancreatic cell development(GO:2000078) |
| 0.9 | 1.7 | GO:0000491 | small nucleolar ribonucleoprotein complex assembly(GO:0000491) |
| 0.8 | 3.4 | GO:0060460 | left lung development(GO:0060459) left lung morphogenesis(GO:0060460) |
| 0.8 | 0.8 | GO:0000706 | meiotic DNA double-strand break processing(GO:0000706) |
| 0.8 | 4.1 | GO:0061709 | reticulophagy(GO:0061709) |
| 0.8 | 9.0 | GO:0007342 | fusion of sperm to egg plasma membrane(GO:0007342) |
| 0.8 | 2.5 | GO:0044778 | meiotic DNA integrity checkpoint(GO:0044778) |
| 0.8 | 2.5 | GO:0031860 | telomeric 3' overhang formation(GO:0031860) |
| 0.8 | 5.7 | GO:0002318 | myeloid progenitor cell differentiation(GO:0002318) |
| 0.8 | 2.4 | GO:0045959 | negative regulation of complement activation, classical pathway(GO:0045959) |
| 0.8 | 4.9 | GO:0006398 | mRNA 3'-end processing by stem-loop binding and cleavage(GO:0006398) |
| 0.8 | 4.9 | GO:1903546 | protein localization to photoreceptor outer segment(GO:1903546) |
| 0.8 | 3.2 | GO:0090666 | scaRNA localization to Cajal body(GO:0090666) |
| 0.8 | 4.8 | GO:0070973 | protein localization to endoplasmic reticulum exit site(GO:0070973) |
| 0.8 | 9.6 | GO:0048240 | sperm capacitation(GO:0048240) |
| 0.8 | 8.8 | GO:0006013 | mannose metabolic process(GO:0006013) |
| 0.8 | 2.4 | GO:0002780 | antimicrobial peptide biosynthetic process(GO:0002777) antibacterial peptide biosynthetic process(GO:0002780) |
| 0.8 | 11.0 | GO:0072520 | seminiferous tubule development(GO:0072520) |
| 0.8 | 5.5 | GO:0035721 | intraciliary retrograde transport(GO:0035721) |
| 0.8 | 2.3 | GO:0060060 | post-embryonic retina morphogenesis in camera-type eye(GO:0060060) |
| 0.8 | 81.9 | GO:0007286 | spermatid development(GO:0007286) |
| 0.8 | 3.1 | GO:2000813 | negative regulation of barbed-end actin filament capping(GO:2000813) |
| 0.8 | 5.4 | GO:0061484 | hematopoietic stem cell homeostasis(GO:0061484) |
| 0.8 | 3.9 | GO:0060763 | histone H3-K4 demethylation, trimethyl-H3-K4-specific(GO:0034721) mammary duct terminal end bud growth(GO:0060763) |
| 0.8 | 6.9 | GO:0007140 | male meiosis(GO:0007140) |
| 0.8 | 3.1 | GO:0090261 | positive regulation of inclusion body assembly(GO:0090261) |
| 0.8 | 4.6 | GO:0036159 | inner dynein arm assembly(GO:0036159) |
| 0.8 | 2.3 | GO:0014739 | positive regulation of muscle hyperplasia(GO:0014739) |
| 0.8 | 2.3 | GO:0018916 | nitrobenzene metabolic process(GO:0018916) |
| 0.7 | 4.5 | GO:0030046 | parallel actin filament bundle assembly(GO:0030046) |
| 0.7 | 1.5 | GO:0099545 | trans-synaptic signaling by trans-synaptic complex(GO:0099545) |
| 0.7 | 7.4 | GO:0002371 | dendritic cell cytokine production(GO:0002371) |
| 0.7 | 2.2 | GO:1900108 | negative regulation of nodal signaling pathway(GO:1900108) |
| 0.7 | 4.3 | GO:2001271 | negative regulation of cysteine-type endopeptidase activity involved in execution phase of apoptosis(GO:2001271) |
| 0.7 | 2.1 | GO:0046136 | positive regulation of vitamin metabolic process(GO:0046136) positive regulation of vitamin D biosynthetic process(GO:0060557) positive regulation of calcidiol 1-monooxygenase activity(GO:0060559) |
| 0.7 | 7.1 | GO:0051457 | maintenance of protein location in nucleus(GO:0051457) |
| 0.7 | 2.1 | GO:0002225 | positive regulation of antimicrobial peptide production(GO:0002225) positive regulation of antibacterial peptide production(GO:0002803) |
| 0.7 | 2.1 | GO:0071314 | cellular response to cocaine(GO:0071314) |
| 0.7 | 2.8 | GO:0048296 | isotype switching to IgA isotypes(GO:0048290) regulation of isotype switching to IgA isotypes(GO:0048296) |
| 0.7 | 8.9 | GO:0042135 | neurotransmitter catabolic process(GO:0042135) |
| 0.7 | 7.5 | GO:0051013 | microtubule severing(GO:0051013) |
| 0.7 | 2.7 | GO:0016998 | cell wall macromolecule catabolic process(GO:0016998) |
| 0.7 | 2.0 | GO:1903774 | positive regulation of viral budding via host ESCRT complex(GO:1903774) |
| 0.7 | 7.4 | GO:0051988 | regulation of attachment of spindle microtubules to kinetochore(GO:0051988) |
| 0.7 | 2.0 | GO:1902211 | regulation of prolactin signaling pathway(GO:1902211) |
| 0.7 | 4.0 | GO:0016191 | synaptic vesicle uncoating(GO:0016191) |
| 0.7 | 2.6 | GO:0035616 | histone H2B conserved C-terminal lysine deubiquitination(GO:0035616) |
| 0.7 | 6.6 | GO:2000271 | positive regulation of fibroblast apoptotic process(GO:2000271) |
| 0.7 | 8.5 | GO:0046069 | cGMP catabolic process(GO:0046069) |
| 0.6 | 3.2 | GO:0070535 | histone H2A K63-linked ubiquitination(GO:0070535) |
| 0.6 | 0.6 | GO:0000957 | mitochondrial RNA catabolic process(GO:0000957) regulation of mitochondrial RNA catabolic process(GO:0000960) |
| 0.6 | 7.0 | GO:0006702 | androgen biosynthetic process(GO:0006702) |
| 0.6 | 3.2 | GO:1904668 | positive regulation of ubiquitin protein ligase activity(GO:1904668) |
| 0.6 | 2.5 | GO:0048023 | positive regulation of melanin biosynthetic process(GO:0048023) positive regulation of secondary metabolite biosynthetic process(GO:1900378) |
| 0.6 | 3.8 | GO:0033387 | putrescine biosynthetic process from ornithine(GO:0033387) |
| 0.6 | 3.1 | GO:0006681 | galactosylceramide metabolic process(GO:0006681) |
| 0.6 | 1.2 | GO:0018312 | peptidyl-serine ADP-ribosylation(GO:0018312) |
| 0.6 | 10.3 | GO:0042487 | regulation of odontogenesis of dentin-containing tooth(GO:0042487) |
| 0.6 | 1.8 | GO:0071691 | cardiac muscle thin filament assembly(GO:0071691) |
| 0.6 | 1.8 | GO:0051255 | mitotic spindle elongation(GO:0000022) spindle midzone assembly(GO:0051255) mitotic spindle midzone assembly(GO:0051256) |
| 0.6 | 3.6 | GO:0071918 | urea transmembrane transport(GO:0071918) |
| 0.6 | 1.2 | GO:0014057 | positive regulation of acetylcholine secretion, neurotransmission(GO:0014057) |
| 0.6 | 3.0 | GO:1905098 | negative regulation of guanyl-nucleotide exchange factor activity(GO:1905098) |
| 0.6 | 1.8 | GO:0090481 | pyrimidine nucleotide-sugar transmembrane transport(GO:0090481) |
| 0.6 | 2.4 | GO:0034653 | diterpenoid catabolic process(GO:0016103) retinoic acid catabolic process(GO:0034653) |
| 0.6 | 1.8 | GO:0018924 | mandelate metabolic process(GO:0018924) |
| 0.6 | 3.5 | GO:0035740 | CD8-positive, alpha-beta T cell proliferation(GO:0035740) |
| 0.6 | 4.1 | GO:2000382 | positive regulation of mesoderm development(GO:2000382) |
| 0.6 | 1.7 | GO:0045590 | negative regulation of regulatory T cell differentiation(GO:0045590) |
| 0.6 | 1.7 | GO:1900095 | random inactivation of X chromosome(GO:0060816) regulation of dosage compensation by inactivation of X chromosome(GO:1900095) |
| 0.6 | 1.7 | GO:1903999 | negative regulation of eating behavior(GO:1903999) |
| 0.6 | 4.6 | GO:0006655 | phosphatidylglycerol biosynthetic process(GO:0006655) |
| 0.6 | 1.7 | GO:1903445 | protein transport from ciliary membrane to plasma membrane(GO:1903445) |
| 0.6 | 4.6 | GO:1902018 | negative regulation of cilium assembly(GO:1902018) |
| 0.6 | 0.6 | GO:0009191 | ribonucleoside diphosphate catabolic process(GO:0009191) |
| 0.6 | 2.8 | GO:0000066 | mitochondrial ornithine transport(GO:0000066) |
| 0.6 | 1.7 | GO:0045842 | positive regulation of mitotic metaphase/anaphase transition(GO:0045842) positive regulation of mitotic sister chromatid separation(GO:1901970) positive regulation of metaphase/anaphase transition of cell cycle(GO:1902101) |
| 0.6 | 1.1 | GO:0006059 | hexitol metabolic process(GO:0006059) |
| 0.6 | 3.9 | GO:2000809 | positive regulation of synaptic vesicle clustering(GO:2000809) |
| 0.6 | 164.2 | GO:0007283 | spermatogenesis(GO:0007283) |
| 0.6 | 3.3 | GO:0006642 | triglyceride mobilization(GO:0006642) |
| 0.6 | 3.3 | GO:0035509 | negative regulation of myosin-light-chain-phosphatase activity(GO:0035509) |
| 0.6 | 2.2 | GO:0000414 | regulation of histone H3-K36 methylation(GO:0000414) |
| 0.6 | 13.3 | GO:0045475 | locomotor rhythm(GO:0045475) |
| 0.6 | 12.1 | GO:0000301 | retrograde transport, vesicle recycling within Golgi(GO:0000301) |
| 0.6 | 2.8 | GO:0070094 | positive regulation of glucagon secretion(GO:0070094) |
| 0.5 | 1.6 | GO:0033505 | ventral midline development(GO:0007418) floor plate formation(GO:0021508) floor plate morphogenesis(GO:0033505) |
| 0.5 | 2.7 | GO:0035063 | nuclear speck organization(GO:0035063) |
| 0.5 | 0.5 | GO:0043578 | nuclear matrix organization(GO:0043578) |
| 0.5 | 0.5 | GO:0032639 | TRAIL production(GO:0032639) regulation of TRAIL production(GO:0032679) positive regulation of TRAIL production(GO:0032759) |
| 0.5 | 1.6 | GO:0021524 | visceral motor neuron differentiation(GO:0021524) |
| 0.5 | 3.8 | GO:0043486 | histone exchange(GO:0043486) |
| 0.5 | 8.0 | GO:0007339 | binding of sperm to zona pellucida(GO:0007339) |
| 0.5 | 6.3 | GO:0000920 | cell separation after cytokinesis(GO:0000920) |
| 0.5 | 2.1 | GO:1990375 | baculum development(GO:1990375) |
| 0.5 | 3.0 | GO:0045040 | protein import into mitochondrial outer membrane(GO:0045040) |
| 0.5 | 3.0 | GO:0010815 | bradykinin catabolic process(GO:0010815) |
| 0.5 | 4.0 | GO:0007258 | JUN phosphorylation(GO:0007258) |
| 0.5 | 15.1 | GO:0006458 | 'de novo' protein folding(GO:0006458) |
| 0.5 | 5.5 | GO:0032119 | sequestering of zinc ion(GO:0032119) regulation of sequestering of zinc ion(GO:0061088) |
| 0.5 | 1.0 | GO:0009446 | putrescine biosynthetic process(GO:0009446) |
| 0.5 | 6.8 | GO:0030150 | protein import into mitochondrial matrix(GO:0030150) |
| 0.5 | 1.4 | GO:2000645 | negative regulation of receptor catabolic process(GO:2000645) |
| 0.5 | 4.8 | GO:0051798 | positive regulation of hair cycle(GO:0042635) positive regulation of hair follicle development(GO:0051798) |
| 0.5 | 1.4 | GO:0051661 | maintenance of centrosome location(GO:0051661) |
| 0.5 | 1.4 | GO:0044376 | RNA polymerase II complex import to nucleus(GO:0044376) RNA polymerase III complex localization to nucleus(GO:1990022) |
| 0.5 | 9.4 | GO:0071218 | cellular response to misfolded protein(GO:0071218) |
| 0.5 | 3.8 | GO:0000012 | single strand break repair(GO:0000012) |
| 0.5 | 3.7 | GO:0014054 | positive regulation of gamma-aminobutyric acid secretion(GO:0014054) |
| 0.5 | 5.1 | GO:0035871 | protein K11-linked deubiquitination(GO:0035871) |
| 0.5 | 1.4 | GO:0032218 | riboflavin transport(GO:0032218) |
| 0.5 | 2.7 | GO:1903608 | protein localization to cytoplasmic stress granule(GO:1903608) |
| 0.5 | 2.3 | GO:0050955 | thermoception(GO:0050955) |
| 0.5 | 2.3 | GO:0070889 | platelet alpha granule organization(GO:0070889) |
| 0.4 | 10.3 | GO:1904659 | hexose transmembrane transport(GO:0035428) glucose transmembrane transport(GO:1904659) |
| 0.4 | 4.9 | GO:0016973 | poly(A)+ mRNA export from nucleus(GO:0016973) |
| 0.4 | 9.3 | GO:0045736 | negative regulation of cyclin-dependent protein serine/threonine kinase activity(GO:0045736) |
| 0.4 | 4.7 | GO:0046784 | viral mRNA export from host cell nucleus(GO:0046784) |
| 0.4 | 0.8 | GO:0001807 | regulation of type IV hypersensitivity(GO:0001807) |
| 0.4 | 1.7 | GO:0043046 | DNA methylation involved in gamete generation(GO:0043046) |
| 0.4 | 4.6 | GO:0022027 | interkinetic nuclear migration(GO:0022027) |
| 0.4 | 6.3 | GO:0031167 | rRNA methylation(GO:0031167) |
| 0.4 | 0.8 | GO:1902953 | positive regulation of ER to Golgi vesicle-mediated transport(GO:1902953) |
| 0.4 | 2.5 | GO:0046490 | isopentenyl diphosphate biosynthetic process(GO:0009240) isopentenyl diphosphate metabolic process(GO:0046490) |
| 0.4 | 0.8 | GO:0099552 | trans-synaptic signaling by lipid, modulating synaptic transmission(GO:0099552) trans-synaptic signaling by endocannabinoid, modulating synaptic transmission(GO:0099553) |
| 0.4 | 1.6 | GO:1900147 | Schwann cell migration(GO:0036135) regulation of Schwann cell migration(GO:1900147) |
| 0.4 | 1.2 | GO:1901844 | regulation of cell communication by electrical coupling involved in cardiac conduction(GO:1901844) |
| 0.4 | 1.6 | GO:0002023 | reduction of food intake in response to dietary excess(GO:0002023) |
| 0.4 | 2.4 | GO:0051490 | negative regulation of filopodium assembly(GO:0051490) |
| 0.4 | 1.9 | GO:0031053 | primary miRNA processing(GO:0031053) |
| 0.4 | 2.7 | GO:0043686 | co-translational protein modification(GO:0043686) |
| 0.4 | 3.1 | GO:0015705 | iodide transport(GO:0015705) |
| 0.4 | 0.8 | GO:0034140 | negative regulation of toll-like receptor 3 signaling pathway(GO:0034140) |
| 0.4 | 1.1 | GO:2000286 | receptor internalization involved in canonical Wnt signaling pathway(GO:2000286) |
| 0.4 | 1.1 | GO:0031635 | adenylate cyclase-inhibiting opioid receptor signaling pathway(GO:0031635) |
| 0.4 | 1.1 | GO:0097156 | fasciculation of motor neuron axon(GO:0097156) |
| 0.4 | 10.4 | GO:0001580 | detection of chemical stimulus involved in sensory perception of bitter taste(GO:0001580) |
| 0.4 | 1.5 | GO:0001777 | T cell homeostatic proliferation(GO:0001777) interleukin-2-mediated signaling pathway(GO:0038110) regulation of T cell homeostatic proliferation(GO:0046013) |
| 0.4 | 1.5 | GO:1901423 | response to benzene(GO:1901423) |
| 0.4 | 7.0 | GO:0006020 | inositol metabolic process(GO:0006020) |
| 0.4 | 2.2 | GO:0035331 | negative regulation of hippo signaling(GO:0035331) |
| 0.4 | 3.6 | GO:0000290 | deadenylation-dependent decapping of nuclear-transcribed mRNA(GO:0000290) |
| 0.4 | 1.1 | GO:0019303 | D-ribose catabolic process(GO:0019303) |
| 0.4 | 1.4 | GO:0098705 | copper ion import across plasma membrane(GO:0098705) copper ion import into cell(GO:1902861) |
| 0.4 | 1.4 | GO:0070842 | aggresome assembly(GO:0070842) |
| 0.3 | 3.1 | GO:0021942 | radial glia guided migration of Purkinje cell(GO:0021942) |
| 0.3 | 1.4 | GO:0042776 | mitochondrial ATP synthesis coupled proton transport(GO:0042776) |
| 0.3 | 1.7 | GO:0060528 | secretory columnal luminar epithelial cell differentiation involved in prostate glandular acinus development(GO:0060528) |
| 0.3 | 3.8 | GO:0006654 | phosphatidic acid biosynthetic process(GO:0006654) |
| 0.3 | 1.4 | GO:0060051 | negative regulation of protein glycosylation(GO:0060051) |
| 0.3 | 2.0 | GO:1901030 | positive regulation of mitochondrial outer membrane permeabilization involved in apoptotic signaling pathway(GO:1901030) |
| 0.3 | 5.7 | GO:0010458 | exit from mitosis(GO:0010458) |
| 0.3 | 7.0 | GO:0043496 | regulation of protein homodimerization activity(GO:0043496) |
| 0.3 | 1.0 | GO:0019389 | glucuronoside metabolic process(GO:0019389) |
| 0.3 | 9.5 | GO:0007271 | synaptic transmission, cholinergic(GO:0007271) |
| 0.3 | 2.0 | GO:2000381 | negative regulation of mesoderm development(GO:2000381) |
| 0.3 | 0.6 | GO:2000851 | positive regulation of glucocorticoid secretion(GO:2000851) |
| 0.3 | 1.0 | GO:1900194 | negative regulation of oocyte maturation(GO:1900194) |
| 0.3 | 0.3 | GO:0006408 | snRNA export from nucleus(GO:0006408) |
| 0.3 | 6.9 | GO:0001696 | gastric acid secretion(GO:0001696) |
| 0.3 | 2.5 | GO:0019240 | citrulline biosynthetic process(GO:0019240) |
| 0.3 | 1.9 | GO:0006863 | purine nucleobase transport(GO:0006863) nucleobase transport(GO:0015851) |
| 0.3 | 0.9 | GO:1905245 | regulation of aspartic-type endopeptidase activity involved in amyloid precursor protein catabolic process(GO:1902959) positive regulation of aspartic-type endopeptidase activity involved in amyloid precursor protein catabolic process(GO:1902961) regulation of metalloendopeptidase activity involved in amyloid precursor protein catabolic process(GO:1902962) negative regulation of metalloendopeptidase activity involved in amyloid precursor protein catabolic process(GO:1902963) regulation of aspartic-type peptidase activity(GO:1905245) positive regulation of aspartic-type peptidase activity(GO:1905247) |
| 0.3 | 5.8 | GO:0045760 | positive regulation of action potential(GO:0045760) |
| 0.3 | 4.0 | GO:0033089 | positive regulation of T cell differentiation in thymus(GO:0033089) positive regulation of thymocyte aggregation(GO:2000400) |
| 0.3 | 2.1 | GO:0002903 | negative regulation of B cell apoptotic process(GO:0002903) |
| 0.3 | 4.6 | GO:0071108 | protein K48-linked deubiquitination(GO:0071108) |
| 0.3 | 18.1 | GO:0009566 | fertilization(GO:0009566) |
| 0.3 | 1.2 | GO:0042985 | negative regulation of amyloid precursor protein biosynthetic process(GO:0042985) |
| 0.3 | 0.9 | GO:0051595 | histone H3-K27 acetylation(GO:0043974) response to methylglyoxal(GO:0051595) regulation of histone H3-K27 acetylation(GO:1901674) |
| 0.3 | 5.0 | GO:0003417 | growth plate cartilage development(GO:0003417) |
| 0.3 | 1.7 | GO:0070966 | nuclear-transcribed mRNA catabolic process, no-go decay(GO:0070966) |
| 0.3 | 2.8 | GO:0018298 | protein-chromophore linkage(GO:0018298) |
| 0.3 | 1.1 | GO:0001712 | ectodermal cell fate commitment(GO:0001712) |
| 0.3 | 0.8 | GO:0032911 | negative regulation of transforming growth factor beta1 production(GO:0032911) |
| 0.3 | 1.6 | GO:0008635 | activation of cysteine-type endopeptidase activity involved in apoptotic process by cytochrome c(GO:0008635) |
| 0.3 | 2.1 | GO:0015712 | hexose phosphate transport(GO:0015712) glucose-6-phosphate transport(GO:0015760) |
| 0.3 | 1.0 | GO:0002084 | protein depalmitoylation(GO:0002084) |
| 0.3 | 0.5 | GO:0002215 | defense response to nematode(GO:0002215) |
| 0.2 | 1.0 | GO:0045200 | establishment or maintenance of neuroblast polarity(GO:0045196) establishment of neuroblast polarity(GO:0045200) |
| 0.2 | 3.4 | GO:0043518 | negative regulation of DNA damage response, signal transduction by p53 class mediator(GO:0043518) |
| 0.2 | 0.2 | GO:0060157 | urinary bladder development(GO:0060157) |
| 0.2 | 0.7 | GO:0042350 | GDP-L-fucose biosynthetic process(GO:0042350) |
| 0.2 | 2.3 | GO:0006999 | nuclear pore organization(GO:0006999) |
| 0.2 | 0.9 | GO:0002184 | cytoplasmic translational termination(GO:0002184) |
| 0.2 | 1.8 | GO:0050916 | sensory perception of sweet taste(GO:0050916) |
| 0.2 | 3.6 | GO:0045116 | protein neddylation(GO:0045116) |
| 0.2 | 0.4 | GO:0019747 | regulation of isoprenoid metabolic process(GO:0019747) |
| 0.2 | 2.2 | GO:0007196 | adenylate cyclase-inhibiting G-protein coupled glutamate receptor signaling pathway(GO:0007196) |
| 0.2 | 3.8 | GO:0043968 | histone H2A acetylation(GO:0043968) |
| 0.2 | 1.5 | GO:2000291 | regulation of myoblast proliferation(GO:2000291) |
| 0.2 | 0.6 | GO:0099525 | presynaptic dense core granule exocytosis(GO:0099525) |
| 0.2 | 0.6 | GO:0044806 | G-quadruplex DNA unwinding(GO:0044806) |
| 0.2 | 1.0 | GO:0060633 | negative regulation of transcription initiation from RNA polymerase II promoter(GO:0060633) negative regulation of DNA-templated transcription, initiation(GO:2000143) |
| 0.2 | 3.1 | GO:0071539 | protein localization to centrosome(GO:0071539) |
| 0.2 | 1.2 | GO:0007198 | adenylate cyclase-inhibiting serotonin receptor signaling pathway(GO:0007198) |
| 0.2 | 0.8 | GO:1900063 | regulation of peroxisome organization(GO:1900063) |
| 0.2 | 0.6 | GO:0003406 | retinal pigment epithelium development(GO:0003406) |
| 0.2 | 1.0 | GO:0043654 | recognition of apoptotic cell(GO:0043654) |
| 0.2 | 2.0 | GO:0031573 | intra-S DNA damage checkpoint(GO:0031573) |
| 0.2 | 1.0 | GO:0070164 | negative regulation of adiponectin secretion(GO:0070164) |
| 0.2 | 1.0 | GO:0071850 | mitotic cell cycle arrest(GO:0071850) |
| 0.2 | 2.6 | GO:1904666 | regulation of ubiquitin protein ligase activity(GO:1904666) |
| 0.2 | 0.6 | GO:0046726 | positive regulation by virus of viral protein levels in host cell(GO:0046726) |
| 0.2 | 1.2 | GO:0060722 | spongiotrophoblast cell proliferation(GO:0060720) regulation of spongiotrophoblast cell proliferation(GO:0060721) cell proliferation involved in embryonic placenta development(GO:0060722) regulation of cell proliferation involved in embryonic placenta development(GO:0060723) |
| 0.2 | 1.6 | GO:1900042 | positive regulation of interleukin-2 secretion(GO:1900042) |
| 0.2 | 1.0 | GO:1904526 | regulation of microtubule binding(GO:1904526) positive regulation of microtubule binding(GO:1904528) |
| 0.2 | 1.0 | GO:0060743 | epithelial cell maturation involved in prostate gland development(GO:0060743) |
| 0.2 | 1.5 | GO:1903232 | melanosome assembly(GO:1903232) |
| 0.2 | 1.0 | GO:0052055 | modulation by symbiont of host molecular function(GO:0052055) |
| 0.2 | 0.6 | GO:1902608 | regulation of large conductance calcium-activated potassium channel activity(GO:1902606) positive regulation of large conductance calcium-activated potassium channel activity(GO:1902608) |
| 0.2 | 3.0 | GO:0045540 | regulation of cholesterol biosynthetic process(GO:0045540) |
| 0.2 | 4.9 | GO:0034723 | DNA replication-dependent nucleosome assembly(GO:0006335) DNA replication-dependent nucleosome organization(GO:0034723) |
| 0.2 | 6.0 | GO:0010165 | response to X-ray(GO:0010165) |
| 0.2 | 1.5 | GO:0097411 | hypoxia-inducible factor-1alpha signaling pathway(GO:0097411) |
| 0.2 | 3.9 | GO:0070816 | phosphorylation of RNA polymerase II C-terminal domain(GO:0070816) |
| 0.2 | 1.3 | GO:2000601 | positive regulation of Arp2/3 complex-mediated actin nucleation(GO:2000601) |
| 0.2 | 1.3 | GO:0006627 | protein processing involved in protein targeting to mitochondrion(GO:0006627) |
| 0.2 | 2.8 | GO:0001553 | luteinization(GO:0001553) |
| 0.2 | 0.9 | GO:0045901 | positive regulation of translational elongation(GO:0045901) |
| 0.2 | 2.3 | GO:0061003 | positive regulation of dendritic spine morphogenesis(GO:0061003) |
| 0.2 | 1.0 | GO:0007216 | G-protein coupled glutamate receptor signaling pathway(GO:0007216) |
| 0.2 | 1.3 | GO:0035520 | monoubiquitinated protein deubiquitination(GO:0035520) |
| 0.2 | 0.5 | GO:0006713 | glucocorticoid catabolic process(GO:0006713) |
| 0.2 | 1.1 | GO:2000821 | regulation of grooming behavior(GO:2000821) |
| 0.2 | 2.6 | GO:0086069 | bundle of His cell to Purkinje myocyte communication(GO:0086069) |
| 0.2 | 1.6 | GO:0014807 | regulation of somitogenesis(GO:0014807) |
| 0.2 | 0.3 | GO:0033567 | DNA replication, Okazaki fragment processing(GO:0033567) |
| 0.2 | 0.5 | GO:0021747 | cochlear nucleus development(GO:0021747) protein localization to adherens junction(GO:0071896) |
| 0.2 | 2.4 | GO:0031297 | replication fork processing(GO:0031297) |
| 0.2 | 1.4 | GO:0098828 | positive regulation of inhibitory postsynaptic potential(GO:0097151) modulation of inhibitory postsynaptic potential(GO:0098828) |
| 0.2 | 0.6 | GO:0035565 | regulation of pronephros size(GO:0035565) |
| 0.2 | 0.6 | GO:0097052 | L-kynurenine metabolic process(GO:0097052) |
| 0.2 | 1.1 | GO:0016584 | nucleosome positioning(GO:0016584) |
| 0.2 | 1.8 | GO:0034498 | early endosome to Golgi transport(GO:0034498) |
| 0.2 | 1.8 | GO:0016322 | neuron remodeling(GO:0016322) |
| 0.2 | 0.6 | GO:0097401 | synaptic vesicle lumen acidification(GO:0097401) |
| 0.2 | 2.6 | GO:0031163 | iron-sulfur cluster assembly(GO:0016226) metallo-sulfur cluster assembly(GO:0031163) |
| 0.2 | 0.8 | GO:1990910 | response to hypobaric hypoxia(GO:1990910) |
| 0.2 | 0.9 | GO:0031120 | snRNA pseudouridine synthesis(GO:0031120) |
| 0.2 | 2.0 | GO:0090036 | regulation of protein kinase C signaling(GO:0090036) |
| 0.1 | 0.6 | GO:0009597 | detection of virus(GO:0009597) |
| 0.1 | 3.4 | GO:0071427 | mRNA export from nucleus(GO:0006406) mRNA-containing ribonucleoprotein complex export from nucleus(GO:0071427) |
| 0.1 | 0.7 | GO:0008608 | attachment of spindle microtubules to kinetochore(GO:0008608) |
| 0.1 | 1.3 | GO:0000463 | maturation of LSU-rRNA from tricistronic rRNA transcript (SSU-rRNA, 5.8S rRNA, LSU-rRNA)(GO:0000463) |
| 0.1 | 1.2 | GO:0021796 | cerebral cortex regionalization(GO:0021796) |
| 0.1 | 3.1 | GO:0097503 | sialylation(GO:0097503) |
| 0.1 | 1.6 | GO:0030206 | chondroitin sulfate biosynthetic process(GO:0030206) |
| 0.1 | 2.1 | GO:0043982 | histone H4-K5 acetylation(GO:0043981) histone H4-K8 acetylation(GO:0043982) |
| 0.1 | 2.2 | GO:0060124 | positive regulation of growth hormone secretion(GO:0060124) |
| 0.1 | 3.6 | GO:0045880 | positive regulation of smoothened signaling pathway(GO:0045880) |
| 0.1 | 3.1 | GO:0045662 | negative regulation of myoblast differentiation(GO:0045662) |
| 0.1 | 0.4 | GO:2000574 | regulation of microtubule motor activity(GO:2000574) |
| 0.1 | 8.9 | GO:0008543 | fibroblast growth factor receptor signaling pathway(GO:0008543) |
| 0.1 | 13.0 | GO:0050821 | protein stabilization(GO:0050821) |
| 0.1 | 0.5 | GO:1900363 | regulation of mRNA polyadenylation(GO:1900363) |
| 0.1 | 0.9 | GO:0010727 | negative regulation of hydrogen peroxide metabolic process(GO:0010727) |
| 0.1 | 2.4 | GO:0005513 | detection of calcium ion(GO:0005513) |
| 0.1 | 0.8 | GO:0017196 | N-terminal peptidyl-methionine acetylation(GO:0017196) |
| 0.1 | 0.9 | GO:0007256 | activation of JNKK activity(GO:0007256) |
| 0.1 | 1.3 | GO:0000338 | protein deneddylation(GO:0000338) |
| 0.1 | 0.4 | GO:0007210 | serotonin receptor signaling pathway(GO:0007210) |
| 0.1 | 0.5 | GO:0071839 | apoptotic process in bone marrow(GO:0071839) |
| 0.1 | 1.2 | GO:0034205 | beta-amyloid formation(GO:0034205) |
| 0.1 | 2.5 | GO:0007635 | chemosensory behavior(GO:0007635) |
| 0.1 | 0.9 | GO:0006977 | DNA damage response, signal transduction by p53 class mediator resulting in cell cycle arrest(GO:0006977) |
| 0.1 | 0.7 | GO:0061087 | positive regulation of histone H3-K27 methylation(GO:0061087) |
| 0.1 | 2.2 | GO:0045737 | positive regulation of cyclin-dependent protein serine/threonine kinase activity(GO:0045737) |
| 0.1 | 0.5 | GO:0021526 | medial motor column neuron differentiation(GO:0021526) |
| 0.1 | 0.9 | GO:1901727 | regulation of histone deacetylase activity(GO:1901725) positive regulation of histone deacetylase activity(GO:1901727) |
| 0.1 | 1.7 | GO:0015937 | coenzyme A biosynthetic process(GO:0015937) |
| 0.1 | 1.9 | GO:1902236 | negative regulation of endoplasmic reticulum stress-induced intrinsic apoptotic signaling pathway(GO:1902236) |
| 0.1 | 1.2 | GO:0033141 | regulation of peptidyl-serine phosphorylation of STAT protein(GO:0033139) positive regulation of peptidyl-serine phosphorylation of STAT protein(GO:0033141) serine phosphorylation of STAT protein(GO:0042501) |
| 0.1 | 1.3 | GO:0031284 | positive regulation of guanylate cyclase activity(GO:0031284) |
| 0.1 | 0.8 | GO:0006868 | glutamine transport(GO:0006868) |
| 0.1 | 5.1 | GO:0051865 | protein autoubiquitination(GO:0051865) |
| 0.1 | 0.4 | GO:0006207 | 'de novo' pyrimidine nucleobase biosynthetic process(GO:0006207) pyrimidine nucleobase biosynthetic process(GO:0019856) |
| 0.1 | 1.4 | GO:0060396 | growth hormone receptor signaling pathway(GO:0060396) |
| 0.1 | 1.0 | GO:0055015 | ventricular cardiac muscle cell development(GO:0055015) |
| 0.1 | 0.8 | GO:0035372 | protein localization to microtubule(GO:0035372) |
| 0.1 | 1.3 | GO:0006359 | regulation of transcription from RNA polymerase III promoter(GO:0006359) |
| 0.1 | 0.6 | GO:0042796 | snRNA transcription from RNA polymerase III promoter(GO:0042796) |
| 0.1 | 0.2 | GO:0039702 | viral budding via host ESCRT complex(GO:0039702) |
| 0.1 | 0.7 | GO:0035562 | negative regulation of chromatin binding(GO:0035562) |
| 0.1 | 1.0 | GO:0061302 | smooth muscle cell-matrix adhesion(GO:0061302) |
| 0.1 | 0.6 | GO:0070314 | G1 to G0 transition(GO:0070314) |
| 0.1 | 1.1 | GO:0051044 | positive regulation of membrane protein ectodomain proteolysis(GO:0051044) |
| 0.1 | 0.5 | GO:0070125 | mitochondrial translational elongation(GO:0070125) |
| 0.1 | 0.8 | GO:0040020 | regulation of meiotic nuclear division(GO:0040020) |
| 0.1 | 2.3 | GO:0010664 | negative regulation of striated muscle cell apoptotic process(GO:0010664) |
| 0.1 | 1.2 | GO:0033235 | positive regulation of protein sumoylation(GO:0033235) |
| 0.1 | 1.2 | GO:0051967 | negative regulation of synaptic transmission, glutamatergic(GO:0051967) |
| 0.1 | 2.4 | GO:0051281 | positive regulation of release of sequestered calcium ion into cytosol(GO:0051281) |
| 0.1 | 1.0 | GO:2000480 | negative regulation of cAMP-dependent protein kinase activity(GO:2000480) |
| 0.1 | 1.4 | GO:0006198 | cAMP catabolic process(GO:0006198) |
| 0.1 | 0.7 | GO:0097499 | protein localization to nonmotile primary cilium(GO:0097499) |
| 0.1 | 2.5 | GO:0001578 | microtubule bundle formation(GO:0001578) |
| 0.1 | 0.1 | GO:0019918 | peptidyl-arginine methylation, to symmetrical-dimethyl arginine(GO:0019918) |
| 0.1 | 1.1 | GO:0042407 | cristae formation(GO:0042407) |
| 0.1 | 10.0 | GO:0006401 | RNA catabolic process(GO:0006401) |
| 0.1 | 5.0 | GO:0016579 | protein deubiquitination(GO:0016579) |
| 0.1 | 1.5 | GO:0042073 | intraciliary transport(GO:0042073) |
| 0.1 | 0.4 | GO:0060023 | soft palate development(GO:0060023) |
| 0.1 | 0.6 | GO:0060017 | parathyroid gland development(GO:0060017) |
| 0.1 | 10.3 | GO:0000209 | protein polyubiquitination(GO:0000209) |
| 0.1 | 0.2 | GO:0051562 | negative regulation of mitochondrial calcium ion concentration(GO:0051562) |
| 0.1 | 1.1 | GO:0034453 | microtubule anchoring(GO:0034453) |
| 0.1 | 0.8 | GO:0048681 | negative regulation of axon regeneration(GO:0048681) |
| 0.1 | 0.7 | GO:0045086 | positive regulation of interleukin-2 biosynthetic process(GO:0045086) |
| 0.1 | 1.1 | GO:0006089 | lactate metabolic process(GO:0006089) |
| 0.1 | 0.3 | GO:0060591 | chondroblast differentiation(GO:0060591) |
| 0.1 | 0.2 | GO:2001183 | negative regulation of interleukin-12 secretion(GO:2001183) |
| 0.1 | 1.6 | GO:0000387 | spliceosomal snRNP assembly(GO:0000387) |
| 0.1 | 0.8 | GO:0061179 | negative regulation of insulin secretion involved in cellular response to glucose stimulus(GO:0061179) |
| 0.1 | 0.3 | GO:0052651 | monoacylglycerol metabolic process(GO:0046462) monoacylglycerol catabolic process(GO:0052651) |
| 0.1 | 0.6 | GO:0031936 | negative regulation of chromatin silencing(GO:0031936) |
| 0.1 | 0.4 | GO:1990253 | cellular response to leucine starvation(GO:1990253) |
| 0.1 | 0.8 | GO:0046485 | ether lipid metabolic process(GO:0046485) |
| 0.1 | 0.5 | GO:0070536 | protein K63-linked deubiquitination(GO:0070536) |
| 0.1 | 2.2 | GO:0000245 | spliceosomal complex assembly(GO:0000245) |
| 0.1 | 0.9 | GO:0051601 | exocyst localization(GO:0051601) |
| 0.1 | 3.5 | GO:0006367 | transcription initiation from RNA polymerase II promoter(GO:0006367) |
| 0.1 | 0.7 | GO:1900028 | negative regulation of ruffle assembly(GO:1900028) |
| 0.1 | 0.7 | GO:0055003 | cardiac myofibril assembly(GO:0055003) |
| 0.1 | 0.8 | GO:0050966 | detection of mechanical stimulus involved in sensory perception of pain(GO:0050966) |
| 0.1 | 0.3 | GO:0048387 | negative regulation of retinoic acid receptor signaling pathway(GO:0048387) |
| 0.1 | 1.0 | GO:0045109 | intermediate filament organization(GO:0045109) |
| 0.1 | 0.8 | GO:0097150 | neuronal stem cell population maintenance(GO:0097150) |
| 0.1 | 0.3 | GO:0007143 | female meiotic division(GO:0007143) |
| 0.1 | 1.1 | GO:0045292 | mRNA cis splicing, via spliceosome(GO:0045292) |
| 0.1 | 2.1 | GO:0051568 | histone H3-K4 methylation(GO:0051568) |
| 0.1 | 0.4 | GO:0060040 | retinal bipolar neuron differentiation(GO:0060040) |
| 0.1 | 0.2 | GO:0015074 | DNA integration(GO:0015074) |
| 0.1 | 0.4 | GO:0055064 | chloride ion homeostasis(GO:0055064) |
| 0.1 | 0.1 | GO:0010265 | SCF complex assembly(GO:0010265) |
| 0.1 | 0.6 | GO:0006390 | transcription from mitochondrial promoter(GO:0006390) |
| 0.1 | 0.7 | GO:0032467 | positive regulation of cytokinesis(GO:0032467) |
| 0.0 | 1.4 | GO:0010501 | RNA secondary structure unwinding(GO:0010501) |
| 0.0 | 0.0 | GO:0071440 | histone H3-K14 acetylation(GO:0044154) regulation of histone H3-K14 acetylation(GO:0071440) |
| 0.0 | 2.4 | GO:0006334 | nucleosome assembly(GO:0006334) |
| 0.0 | 0.2 | GO:0099590 | neurotransmitter receptor internalization(GO:0099590) |
| 0.0 | 5.6 | GO:0007018 | microtubule-based movement(GO:0007018) |
| 0.0 | 0.2 | GO:0070350 | white fat cell proliferation(GO:0070343) regulation of white fat cell proliferation(GO:0070350) |
| 0.0 | 0.8 | GO:0009649 | entrainment of circadian clock(GO:0009649) |
| 0.0 | 0.2 | GO:0000480 | endonucleolytic cleavage in 5'-ETS of tricistronic rRNA transcript (SSU-rRNA, 5.8S rRNA, LSU-rRNA)(GO:0000480) |
| 0.0 | 0.2 | GO:0006610 | ribosomal protein import into nucleus(GO:0006610) |
| 0.0 | 3.2 | GO:0007059 | chromosome segregation(GO:0007059) |
| 0.0 | 0.1 | GO:1900118 | negative regulation of execution phase of apoptosis(GO:1900118) |
| 0.0 | 0.1 | GO:0051204 | protein insertion into mitochondrial membrane(GO:0051204) |
| 0.0 | 0.3 | GO:0015884 | folic acid transport(GO:0015884) |
| 0.0 | 0.3 | GO:0061512 | protein localization to cilium(GO:0061512) |
| 0.0 | 0.8 | GO:0000381 | regulation of alternative mRNA splicing, via spliceosome(GO:0000381) |
| 0.0 | 0.5 | GO:0006471 | protein ADP-ribosylation(GO:0006471) |
| 0.0 | 0.1 | GO:0009438 | methylglyoxal metabolic process(GO:0009438) |
| 0.0 | 0.1 | GO:0072033 | renal vesicle formation(GO:0072033) |
| 0.0 | 0.3 | GO:0035269 | protein O-linked mannosylation(GO:0035269) |
| 0.0 | 0.7 | GO:0090162 | establishment of epithelial cell polarity(GO:0090162) |
| 0.0 | 0.1 | GO:0000056 | ribosomal small subunit export from nucleus(GO:0000056) |
| 0.0 | 0.4 | GO:0001709 | cell fate determination(GO:0001709) |
| 0.0 | 0.0 | GO:0030718 | germ-line stem cell population maintenance(GO:0030718) |
| 0.0 | 0.0 | GO:0033182 | regulation of histone ubiquitination(GO:0033182) positive regulation of histone ubiquitination(GO:0033184) |
| 0.0 | 0.1 | GO:0000478 | endonucleolytic cleavage involved in rRNA processing(GO:0000478) endonucleolytic cleavage of tricistronic rRNA transcript (SSU-rRNA, 5.8S rRNA, LSU-rRNA)(GO:0000479) |
| 0.0 | 0.1 | GO:0099562 | maintenance of postsynaptic specialization structure(GO:0098880) maintenance of postsynaptic density structure(GO:0099562) |
| 0.0 | 0.8 | GO:0042273 | ribosomal large subunit biogenesis(GO:0042273) |
| 0.0 | 0.2 | GO:0045725 | positive regulation of glycogen biosynthetic process(GO:0045725) |
| 0.0 | 0.3 | GO:0007212 | dopamine receptor signaling pathway(GO:0007212) |
Gene overrepresentation in cellular component category:
| Log-likelihood per target | Total log-likelihood | Term | Description |
|---|---|---|---|
| 5.2 | 31.0 | GO:0071547 | piP-body(GO:0071547) |
| 4.9 | 24.7 | GO:0000942 | condensed nuclear chromosome outer kinetochore(GO:0000942) |
| 4.4 | 21.9 | GO:1990716 | axonemal central apparatus(GO:1990716) |
| 4.4 | 26.3 | GO:0000125 | PCAF complex(GO:0000125) |
| 4.2 | 76.3 | GO:0031588 | nucleotide-activated protein kinase complex(GO:0031588) |
| 3.7 | 88.6 | GO:0001673 | male germ cell nucleus(GO:0001673) |
| 3.3 | 13.1 | GO:0032299 | ribonuclease H2 complex(GO:0032299) |
| 2.9 | 17.5 | GO:0005672 | transcription factor TFIIA complex(GO:0005672) |
| 2.7 | 51.2 | GO:0001520 | outer dense fiber(GO:0001520) |
| 2.6 | 10.5 | GO:0002079 | inner acrosomal membrane(GO:0002079) |
| 2.4 | 14.5 | GO:0071546 | pi-body(GO:0071546) |
| 2.3 | 4.6 | GO:0036156 | inner dynein arm(GO:0036156) |
| 2.1 | 10.7 | GO:0002199 | zona pellucida receptor complex(GO:0002199) |
| 1.9 | 7.6 | GO:0097196 | Shu complex(GO:0097196) |
| 1.9 | 7.5 | GO:0072487 | MSL complex(GO:0072487) |
| 1.8 | 5.4 | GO:0031262 | Ndc80 complex(GO:0031262) |
| 1.8 | 7.2 | GO:0009330 | DNA topoisomerase complex (ATP-hydrolyzing)(GO:0009330) |
| 1.8 | 24.8 | GO:0005832 | chaperonin-containing T-complex(GO:0005832) |
| 1.8 | 40.3 | GO:0002080 | acrosomal membrane(GO:0002080) |
| 1.7 | 13.9 | GO:0000940 | condensed chromosome outer kinetochore(GO:0000940) |
| 1.6 | 4.9 | GO:1990423 | RZZ complex(GO:1990423) |
| 1.6 | 6.3 | GO:0002177 | manchette(GO:0002177) |
| 1.6 | 14.0 | GO:0097539 | ciliary transition fiber(GO:0097539) |
| 1.5 | 4.6 | GO:0097124 | cyclin A2-CDK2 complex(GO:0097124) |
| 1.5 | 17.6 | GO:0005890 | sodium:potassium-exchanging ATPase complex(GO:0005890) |
| 1.5 | 5.8 | GO:0031436 | BRCA1-BARD1 complex(GO:0031436) |
| 1.5 | 7.3 | GO:0033063 | Rad51B-Rad51C-Rad51D-XRCC2 complex(GO:0033063) |
| 1.4 | 8.3 | GO:1990111 | spermatoproteasome complex(GO:1990111) |
| 1.4 | 5.5 | GO:0033503 | HULC complex(GO:0033503) |
| 1.4 | 13.6 | GO:0008290 | F-actin capping protein complex(GO:0008290) |
| 1.4 | 8.1 | GO:0005663 | DNA replication factor C complex(GO:0005663) |
| 1.3 | 9.4 | GO:0030991 | intraciliary transport particle A(GO:0030991) |
| 1.3 | 15.9 | GO:0000801 | central element(GO:0000801) |
| 1.3 | 3.9 | GO:0044302 | dentate gyrus mossy fiber(GO:0044302) |
| 1.3 | 6.3 | GO:1990726 | Lsm1-7-Pat1 complex(GO:1990726) |
| 1.2 | 14.9 | GO:0042405 | nuclear inclusion body(GO:0042405) |
| 1.2 | 7.4 | GO:0035189 | Rb-E2F complex(GO:0035189) |
| 1.2 | 166.2 | GO:0031514 | motile cilium(GO:0031514) |
| 1.2 | 3.5 | GO:0070557 | PCNA-p21 complex(GO:0070557) |
| 1.2 | 4.7 | GO:0001405 | presequence translocase-associated import motor(GO:0001405) |
| 1.2 | 12.8 | GO:0000800 | lateral element(GO:0000800) |
| 1.2 | 129.6 | GO:0001669 | acrosomal vesicle(GO:0001669) |
| 1.2 | 9.2 | GO:0005850 | eukaryotic translation initiation factor 2 complex(GO:0005850) |
| 1.2 | 23.0 | GO:0035098 | ESC/E(Z) complex(GO:0035098) |
| 1.1 | 4.5 | GO:1990584 | cardiac Troponin complex(GO:1990584) |
| 1.1 | 14.5 | GO:0033391 | chromatoid body(GO:0033391) |
| 1.1 | 5.4 | GO:0098536 | deuterosome(GO:0098536) |
| 1.1 | 4.3 | GO:0002947 | tumor necrosis factor receptor superfamily complex(GO:0002947) |
| 1.1 | 5.3 | GO:0042719 | mitochondrial intermembrane space protein transporter complex(GO:0042719) |
| 1.0 | 9.9 | GO:0070652 | HAUS complex(GO:0070652) |
| 0.9 | 8.5 | GO:0070187 | telosome(GO:0070187) |
| 0.9 | 2.8 | GO:0045025 | mitochondrial degradosome(GO:0045025) |
| 0.9 | 3.7 | GO:0097149 | centralspindlin complex(GO:0097149) |
| 0.9 | 2.8 | GO:0008537 | proteasome activator complex(GO:0008537) |
| 0.9 | 5.4 | GO:0097209 | epidermal lamellar body(GO:0097209) |
| 0.9 | 3.6 | GO:0072379 | BAT3 complex(GO:0071818) ER membrane insertion complex(GO:0072379) |
| 0.9 | 6.1 | GO:0097136 | Bcl-2 family protein complex(GO:0097136) |
| 0.9 | 1.7 | GO:0031021 | interphase microtubule organizing center(GO:0031021) |
| 0.8 | 4.8 | GO:0032983 | kainate selective glutamate receptor complex(GO:0032983) |
| 0.8 | 2.4 | GO:0035101 | FACT complex(GO:0035101) |
| 0.8 | 5.4 | GO:0000796 | condensin complex(GO:0000796) |
| 0.8 | 36.2 | GO:0000777 | condensed chromosome kinetochore(GO:0000777) |
| 0.8 | 7.5 | GO:0000347 | THO complex(GO:0000347) THO complex part of transcription export complex(GO:0000445) |
| 0.7 | 4.5 | GO:0001940 | male pronucleus(GO:0001940) |
| 0.7 | 9.6 | GO:0032426 | stereocilium tip(GO:0032426) |
| 0.7 | 4.4 | GO:0030896 | checkpoint clamp complex(GO:0030896) |
| 0.7 | 4.1 | GO:0032280 | symmetric synapse(GO:0032280) |
| 0.7 | 8.9 | GO:0044666 | MLL3/4 complex(GO:0044666) |
| 0.7 | 2.7 | GO:0032777 | Piccolo NuA4 histone acetyltransferase complex(GO:0032777) |
| 0.7 | 7.5 | GO:0031464 | Cul4A-RING E3 ubiquitin ligase complex(GO:0031464) |
| 0.6 | 2.6 | GO:0043186 | P granule(GO:0043186) pole plasm(GO:0045495) germ plasm(GO:0060293) |
| 0.6 | 5.8 | GO:0042788 | polysomal ribosome(GO:0042788) |
| 0.6 | 3.2 | GO:0043293 | apoptosome(GO:0043293) |
| 0.6 | 0.6 | GO:0070993 | eukaryotic 43S preinitiation complex(GO:0016282) translation preinitiation complex(GO:0070993) |
| 0.6 | 7.9 | GO:0070938 | contractile ring(GO:0070938) |
| 0.6 | 13.4 | GO:0000242 | pericentriolar material(GO:0000242) |
| 0.6 | 53.4 | GO:0044815 | nucleosome(GO:0000786) DNA packaging complex(GO:0044815) |
| 0.6 | 4.6 | GO:0098831 | presynaptic active zone cytoplasmic component(GO:0098831) |
| 0.6 | 2.3 | GO:0072588 | box H/ACA snoRNP complex(GO:0031429) box H/ACA RNP complex(GO:0072588) |
| 0.6 | 19.9 | GO:0032154 | cleavage furrow(GO:0032154) cell surface furrow(GO:0097610) |
| 0.5 | 3.1 | GO:0005828 | kinetochore microtubule(GO:0005828) |
| 0.5 | 4.6 | GO:0000439 | core TFIIH complex(GO:0000439) |
| 0.5 | 4.5 | GO:0000813 | ESCRT I complex(GO:0000813) |
| 0.5 | 2.0 | GO:0044299 | C-fiber(GO:0044299) |
| 0.5 | 0.5 | GO:0034750 | Scrib-APC-beta-catenin complex(GO:0034750) |
| 0.5 | 1.4 | GO:0031510 | SUMO activating enzyme complex(GO:0031510) |
| 0.5 | 6.5 | GO:0042622 | photoreceptor outer segment membrane(GO:0042622) |
| 0.5 | 2.3 | GO:0031467 | Cul7-RING ubiquitin ligase complex(GO:0031467) |
| 0.4 | 4.9 | GO:0001527 | microfibril(GO:0001527) fibril(GO:0043205) |
| 0.4 | 1.8 | GO:0005851 | eukaryotic translation initiation factor 2B complex(GO:0005851) |
| 0.4 | 5.2 | GO:0035631 | CD40 receptor complex(GO:0035631) |
| 0.4 | 8.7 | GO:0005892 | acetylcholine-gated channel complex(GO:0005892) |
| 0.4 | 10.0 | GO:0034451 | centriolar satellite(GO:0034451) |
| 0.4 | 2.1 | GO:0032133 | chromosome passenger complex(GO:0032133) |
| 0.4 | 3.7 | GO:0005641 | nuclear envelope lumen(GO:0005641) |
| 0.4 | 8.2 | GO:0005680 | anaphase-promoting complex(GO:0005680) |
| 0.4 | 2.0 | GO:0071203 | WASH complex(GO:0071203) |
| 0.4 | 3.2 | GO:0072669 | tRNA-splicing ligase complex(GO:0072669) |
| 0.4 | 2.8 | GO:0010369 | chromocenter(GO:0010369) |
| 0.4 | 8.9 | GO:0051233 | spindle midzone(GO:0051233) |
| 0.4 | 3.1 | GO:0031595 | nuclear proteasome complex(GO:0031595) |
| 0.4 | 1.1 | GO:0044611 | nuclear pore inner ring(GO:0044611) |
| 0.4 | 2.6 | GO:0042382 | paraspeckles(GO:0042382) |
| 0.4 | 4.0 | GO:1990635 | proximal dendrite(GO:1990635) |
| 0.4 | 1.8 | GO:0000120 | RNA polymerase I transcription factor complex(GO:0000120) |
| 0.3 | 1.0 | GO:0030877 | beta-catenin destruction complex(GO:0030877) |
| 0.3 | 3.8 | GO:0097418 | neurofibrillary tangle(GO:0097418) |
| 0.3 | 6.2 | GO:1902562 | NuA4 histone acetyltransferase complex(GO:0035267) H4/H2A histone acetyltransferase complex(GO:0043189) H4 histone acetyltransferase complex(GO:1902562) |
| 0.3 | 1.7 | GO:0030915 | Smc5-Smc6 complex(GO:0030915) |
| 0.3 | 1.3 | GO:0000408 | EKC/KEOPS complex(GO:0000408) |
| 0.3 | 9.7 | GO:0035861 | site of double-strand break(GO:0035861) |
| 0.3 | 1.7 | GO:0009331 | glycerol-3-phosphate dehydrogenase complex(GO:0009331) |
| 0.3 | 2.7 | GO:0000808 | origin recognition complex(GO:0000808) nuclear origin of replication recognition complex(GO:0005664) |
| 0.3 | 22.9 | GO:0045095 | keratin filament(GO:0045095) |
| 0.3 | 3.6 | GO:0030688 | preribosome, small subunit precursor(GO:0030688) |
| 0.3 | 1.3 | GO:0034464 | BBSome(GO:0034464) |
| 0.3 | 2.2 | GO:0017071 | intracellular cyclic nucleotide activated cation channel complex(GO:0017071) |
| 0.3 | 12.6 | GO:0045171 | intercellular bridge(GO:0045171) |
| 0.3 | 1.5 | GO:0031085 | BLOC-3 complex(GO:0031085) |
| 0.3 | 1.2 | GO:0044326 | dendritic spine neck(GO:0044326) |
| 0.3 | 1.8 | GO:0030681 | nucleolar ribonuclease P complex(GO:0005655) ribonuclease P complex(GO:0030677) multimeric ribonuclease P complex(GO:0030681) |
| 0.3 | 27.5 | GO:0000781 | chromosome, telomeric region(GO:0000781) |
| 0.3 | 15.5 | GO:0015030 | Cajal body(GO:0015030) |
| 0.3 | 11.8 | GO:0000776 | kinetochore(GO:0000776) |
| 0.3 | 1.4 | GO:0032300 | mismatch repair complex(GO:0032300) |
| 0.3 | 0.8 | GO:0055087 | Ski complex(GO:0055087) |
| 0.3 | 2.1 | GO:0097550 | transcriptional preinitiation complex(GO:0097550) |
| 0.3 | 0.8 | GO:0000322 | storage vacuole(GO:0000322) |
| 0.3 | 4.0 | GO:0030126 | COPI vesicle coat(GO:0030126) |
| 0.3 | 1.3 | GO:0002189 | ribose phosphate diphosphokinase complex(GO:0002189) |
| 0.2 | 6.0 | GO:0097546 | ciliary base(GO:0097546) |
| 0.2 | 2.7 | GO:0032541 | cortical endoplasmic reticulum(GO:0032541) |
| 0.2 | 4.1 | GO:0042581 | specific granule(GO:0042581) |
| 0.2 | 11.1 | GO:0030173 | integral component of Golgi membrane(GO:0030173) |
| 0.2 | 0.9 | GO:0018444 | translation release factor complex(GO:0018444) |
| 0.2 | 1.4 | GO:0089701 | U2AF(GO:0089701) |
| 0.2 | 3.2 | GO:0005686 | U2 snRNP(GO:0005686) |
| 0.2 | 1.1 | GO:0097454 | Schwann cell microvillus(GO:0097454) |
| 0.2 | 0.7 | GO:0031390 | Ctf18 RFC-like complex(GO:0031390) |
| 0.2 | 3.5 | GO:0043240 | Fanconi anaemia nuclear complex(GO:0043240) |
| 0.2 | 0.6 | GO:1990393 | 3M complex(GO:1990393) |
| 0.2 | 1.5 | GO:0061617 | MICOS complex(GO:0061617) |
| 0.2 | 2.3 | GO:0001741 | XY body(GO:0001741) |
| 0.2 | 0.2 | GO:0098830 | presynaptic endosome(GO:0098830) |
| 0.2 | 0.6 | GO:0048787 | presynaptic active zone membrane(GO:0048787) |
| 0.2 | 7.6 | GO:0008180 | COP9 signalosome(GO:0008180) |
| 0.2 | 1.9 | GO:0072687 | meiotic spindle(GO:0072687) |
| 0.2 | 4.8 | GO:0005876 | spindle microtubule(GO:0005876) |
| 0.2 | 1.2 | GO:0070765 | gamma-secretase complex(GO:0070765) |
| 0.2 | 1.6 | GO:0008541 | proteasome regulatory particle, lid subcomplex(GO:0008541) |
| 0.2 | 2.4 | GO:0034709 | methylosome(GO:0034709) |
| 0.2 | 15.7 | GO:0036064 | ciliary basal body(GO:0036064) |
| 0.2 | 10.9 | GO:0030496 | midbody(GO:0030496) |
| 0.2 | 1.0 | GO:1903767 | sweet taste receptor complex(GO:1903767) taste receptor complex(GO:1903768) |
| 0.2 | 1.3 | GO:0000127 | transcription factor TFIIIC complex(GO:0000127) |
| 0.2 | 0.7 | GO:0031597 | cytosolic proteasome complex(GO:0031597) |
| 0.2 | 61.0 | GO:0005813 | centrosome(GO:0005813) |
| 0.2 | 1.2 | GO:0032584 | growth cone membrane(GO:0032584) |
| 0.2 | 0.5 | GO:0034271 | phosphatidylinositol 3-kinase complex, class III, type I(GO:0034271) phosphatidylinositol 3-kinase complex, class III, type II(GO:0034272) |
| 0.2 | 5.2 | GO:0016235 | aggresome(GO:0016235) |
| 0.2 | 15.2 | GO:0008076 | voltage-gated potassium channel complex(GO:0008076) |
| 0.2 | 1.8 | GO:0030008 | TRAPP complex(GO:0030008) |
| 0.1 | 0.9 | GO:0097512 | cardiac myofibril(GO:0097512) |
| 0.1 | 0.9 | GO:0048188 | Set1C/COMPASS complex(GO:0048188) |
| 0.1 | 0.9 | GO:0097441 | basilar dendrite(GO:0097441) |
| 0.1 | 1.8 | GO:0005689 | U12-type spliceosomal complex(GO:0005689) |
| 0.1 | 4.9 | GO:0000118 | histone deacetylase complex(GO:0000118) |
| 0.1 | 0.4 | GO:0005592 | collagen type XI trimer(GO:0005592) |
| 0.1 | 0.7 | GO:0034455 | t-UTP complex(GO:0034455) |
| 0.1 | 1.3 | GO:0031209 | SCAR complex(GO:0031209) |
| 0.1 | 1.4 | GO:0031011 | Ino80 complex(GO:0031011) DNA helicase complex(GO:0033202) |
| 0.1 | 1.0 | GO:0071541 | eukaryotic translation initiation factor 3 complex, eIF3m(GO:0071541) |
| 0.1 | 1.2 | GO:0005685 | U1 snRNP(GO:0005685) |
| 0.1 | 1.3 | GO:0005852 | eukaryotic translation initiation factor 3 complex(GO:0005852) |
| 0.1 | 3.1 | GO:0016592 | mediator complex(GO:0016592) |
| 0.1 | 1.8 | GO:0005671 | Ada2/Gcn5/Ada3 transcription activator complex(GO:0005671) |
| 0.1 | 1.1 | GO:0005697 | telomerase holoenzyme complex(GO:0005697) |
| 0.1 | 2.1 | GO:0005922 | connexon complex(GO:0005922) |
| 0.1 | 2.8 | GO:0030686 | 90S preribosome(GO:0030686) |
| 0.1 | 4.9 | GO:0017053 | transcriptional repressor complex(GO:0017053) |
| 0.1 | 0.6 | GO:0044615 | nuclear pore nuclear basket(GO:0044615) |
| 0.1 | 1.8 | GO:0001891 | phagocytic cup(GO:0001891) |
| 0.1 | 0.4 | GO:0098888 | extrinsic component of presynaptic membrane(GO:0098888) |
| 0.1 | 0.3 | GO:0044609 | DBIRD complex(GO:0044609) |
| 0.1 | 0.8 | GO:0097449 | astrocyte projection(GO:0097449) |
| 0.1 | 0.6 | GO:0045120 | pronucleus(GO:0045120) |
| 0.1 | 0.7 | GO:0005786 | signal recognition particle, endoplasmic reticulum targeting(GO:0005786) |
| 0.1 | 2.3 | GO:0060077 | inhibitory synapse(GO:0060077) |
| 0.1 | 7.8 | GO:0005761 | organellar ribosome(GO:0000313) mitochondrial ribosome(GO:0005761) |
| 0.1 | 1.4 | GO:0030687 | preribosome, large subunit precursor(GO:0030687) |
| 0.1 | 1.1 | GO:0030669 | clathrin-coated endocytic vesicle membrane(GO:0030669) |
| 0.1 | 0.3 | GO:0035985 | senescence-associated heterochromatin focus(GO:0035985) |
| 0.1 | 0.8 | GO:0043202 | lysosomal lumen(GO:0043202) |
| 0.1 | 1.5 | GO:0030014 | CCR4-NOT complex(GO:0030014) |
| 0.1 | 3.2 | GO:0009925 | basal plasma membrane(GO:0009925) |
| 0.1 | 5.4 | GO:0005882 | intermediate filament(GO:0005882) |
| 0.1 | 0.4 | GO:1990769 | proximal neuron projection(GO:1990769) |
| 0.1 | 1.7 | GO:0060170 | ciliary membrane(GO:0060170) |
| 0.1 | 0.2 | GO:0000814 | ESCRT II complex(GO:0000814) |
| 0.1 | 0.8 | GO:0098799 | outer mitochondrial membrane protein complex(GO:0098799) |
| 0.1 | 2.6 | GO:0005643 | nuclear pore(GO:0005643) |
| 0.1 | 0.3 | GO:1990316 | ATG1/ULK1 kinase complex(GO:1990316) |
| 0.1 | 0.2 | GO:0000839 | Hrd1p ubiquitin ligase ERAD-L complex(GO:0000839) |
| 0.1 | 1.2 | GO:0000178 | exosome (RNase complex)(GO:0000178) |
| 0.1 | 0.8 | GO:0031414 | N-terminal protein acetyltransferase complex(GO:0031414) |
| 0.1 | 4.1 | GO:0099501 | synaptic vesicle membrane(GO:0030672) exocytic vesicle membrane(GO:0099501) |
| 0.1 | 0.4 | GO:0031045 | dense core granule(GO:0031045) |
| 0.1 | 1.0 | GO:0030061 | mitochondrial crista(GO:0030061) |
| 0.1 | 13.5 | GO:0000790 | nuclear chromatin(GO:0000790) |
| 0.1 | 0.9 | GO:0045277 | respiratory chain complex IV(GO:0045277) |
| 0.0 | 1.2 | GO:0000159 | protein phosphatase type 2A complex(GO:0000159) |
| 0.0 | 10.4 | GO:0000151 | ubiquitin ligase complex(GO:0000151) |
| 0.0 | 0.2 | GO:0070531 | BRCA1-A complex(GO:0070531) |
| 0.0 | 0.6 | GO:0044665 | MLL1/2 complex(GO:0044665) MLL1 complex(GO:0071339) |
| 0.0 | 0.2 | GO:0000938 | GARP complex(GO:0000938) EARP complex(GO:1990745) |
| 0.0 | 5.0 | GO:0005923 | bicellular tight junction(GO:0005923) |
| 0.0 | 0.4 | GO:0000164 | protein phosphatase type 1 complex(GO:0000164) |
| 0.0 | 1.5 | GO:0001750 | photoreceptor outer segment(GO:0001750) |
| 0.0 | 0.4 | GO:0000145 | exocyst(GO:0000145) |
| 0.0 | 0.2 | GO:0045254 | pyruvate dehydrogenase complex(GO:0045254) |
| 0.0 | 1.0 | GO:0005758 | mitochondrial intermembrane space(GO:0005758) |
| 0.0 | 0.4 | GO:0005881 | cytoplasmic microtubule(GO:0005881) |
Gene overrepresentation in molecular function category:
| Log-likelihood per target | Total log-likelihood | Term | Description |
|---|---|---|---|
| 7.3 | 29.3 | GO:0003918 | DNA topoisomerase type II (ATP-hydrolyzing) activity(GO:0003918) DNA topoisomerase II activity(GO:0061505) |
| 5.1 | 76.3 | GO:0004679 | AMP-activated protein kinase activity(GO:0004679) |
| 4.2 | 12.7 | GO:0004839 | ubiquitin activating enzyme activity(GO:0004839) |
| 3.9 | 23.3 | GO:0032027 | myosin light chain binding(GO:0032027) |
| 3.3 | 9.9 | GO:0004769 | steroid delta-isomerase activity(GO:0004769) |
| 3.2 | 25.5 | GO:0032184 | SUMO polymer binding(GO:0032184) |
| 3.1 | 9.2 | GO:0072590 | N-acetyl-L-aspartate-L-glutamate ligase activity(GO:0072590) |
| 2.9 | 11.5 | GO:0060072 | large conductance calcium-activated potassium channel activity(GO:0060072) |
| 2.8 | 11.1 | GO:0004459 | L-lactate dehydrogenase activity(GO:0004459) |
| 2.7 | 8.1 | GO:0097677 | STAT family protein binding(GO:0097677) |
| 2.7 | 8.0 | GO:0033222 | xylose binding(GO:0033222) |
| 2.5 | 12.3 | GO:0004523 | RNA-DNA hybrid ribonuclease activity(GO:0004523) |
| 2.2 | 15.2 | GO:0030620 | U2 snRNA binding(GO:0030620) |
| 2.1 | 8.4 | GO:0000403 | Y-form DNA binding(GO:0000403) |
| 2.1 | 8.4 | GO:0016672 | oxidoreductase activity, acting on a sulfur group of donors, quinone or similar compound as acceptor(GO:0016672) oxidoreductase activity, acting on phosphorus or arsenic in donors(GO:0030613) oxidoreductase activity, acting on phosphorus or arsenic in donors, disulfide as acceptor(GO:0030614) glutathione dehydrogenase (ascorbate) activity(GO:0045174) methylarsonate reductase activity(GO:0050610) |
| 2.1 | 6.2 | GO:0004069 | L-aspartate:2-oxoglutarate aminotransferase activity(GO:0004069) |
| 2.0 | 6.1 | GO:0004605 | phosphatidate cytidylyltransferase activity(GO:0004605) |
| 2.0 | 6.1 | GO:0016520 | growth hormone-releasing hormone receptor activity(GO:0016520) |
| 1.9 | 7.7 | GO:0061575 | cyclin-dependent protein serine/threonine kinase activator activity(GO:0061575) |
| 1.8 | 7.1 | GO:0000829 | inositol heptakisphosphate kinase activity(GO:0000829) |
| 1.8 | 21.4 | GO:0031730 | CCR5 chemokine receptor binding(GO:0031730) |
| 1.7 | 5.2 | GO:0044715 | 8-oxo-dGDP phosphatase activity(GO:0044715) |
| 1.7 | 5.0 | GO:0004956 | prostaglandin D receptor activity(GO:0004956) |
| 1.7 | 5.0 | GO:0032139 | dinucleotide insertion or deletion binding(GO:0032139) |
| 1.6 | 13.2 | GO:0001075 | transcription factor activity, RNA polymerase II core promoter sequence-specific binding involved in preinitiation complex assembly(GO:0001075) |
| 1.6 | 6.5 | GO:0004365 | glyceraldehyde-3-phosphate dehydrogenase (NAD+) (phosphorylating) activity(GO:0004365) glyceraldehyde-3-phosphate dehydrogenase (NAD(P)+) (phosphorylating) activity(GO:0043891) |
| 1.6 | 32.1 | GO:0008199 | ferric iron binding(GO:0008199) |
| 1.6 | 12.8 | GO:0047134 | protein-disulfide reductase activity(GO:0047134) |
| 1.6 | 26.5 | GO:0001594 | trace-amine receptor activity(GO:0001594) |
| 1.5 | 46.3 | GO:0044183 | protein binding involved in protein folding(GO:0044183) |
| 1.5 | 4.6 | GO:0004040 | amidase activity(GO:0004040) |
| 1.4 | 5.7 | GO:0036042 | long-chain fatty acyl-CoA binding(GO:0036042) |
| 1.4 | 5.6 | GO:0033149 | FFAT motif binding(GO:0033149) |
| 1.4 | 5.6 | GO:0050682 | AF-2 domain binding(GO:0050682) |
| 1.4 | 8.2 | GO:0055056 | D-glucose transmembrane transporter activity(GO:0055056) |
| 1.4 | 9.5 | GO:0004118 | cGMP-stimulated cyclic-nucleotide phosphodiesterase activity(GO:0004118) |
| 1.3 | 5.2 | GO:0004452 | isopentenyl-diphosphate delta-isomerase activity(GO:0004452) |
| 1.3 | 6.5 | GO:0052650 | NADP-retinol dehydrogenase activity(GO:0052650) |
| 1.3 | 18.2 | GO:0005391 | sodium:potassium-exchanging ATPase activity(GO:0005391) |
| 1.3 | 13.9 | GO:0015385 | sodium:proton antiporter activity(GO:0015385) |
| 1.3 | 1.3 | GO:0032427 | GBD domain binding(GO:0032427) |
| 1.2 | 3.7 | GO:0005171 | hepatocyte growth factor receptor binding(GO:0005171) |
| 1.2 | 12.4 | GO:0005412 | glucose:sodium symporter activity(GO:0005412) |
| 1.2 | 4.9 | GO:0008241 | peptidyl-dipeptidase activity(GO:0008241) |
| 1.2 | 10.7 | GO:0043515 | kinetochore binding(GO:0043515) |
| 1.1 | 8.8 | GO:0016413 | O-acetyltransferase activity(GO:0016413) |
| 1.1 | 4.4 | GO:0004963 | follicle-stimulating hormone receptor activity(GO:0004963) |
| 1.1 | 3.2 | GO:0034485 | phosphatidylinositol-3,4,5-trisphosphate 5-phosphatase activity(GO:0034485) |
| 1.0 | 3.1 | GO:0031531 | thyrotropin-releasing hormone receptor binding(GO:0031531) |
| 1.0 | 6.1 | GO:0051434 | BH3 domain binding(GO:0051434) |
| 1.0 | 6.1 | GO:0000150 | recombinase activity(GO:0000150) |
| 1.0 | 11.1 | GO:0016783 | sulfurtransferase activity(GO:0016783) |
| 1.0 | 3.0 | GO:0010484 | H3 histone acetyltransferase activity(GO:0010484) |
| 1.0 | 3.9 | GO:0016774 | phosphotransferase activity, carboxyl group as acceptor(GO:0016774) |
| 1.0 | 15.3 | GO:0008574 | ATP-dependent microtubule motor activity, plus-end-directed(GO:0008574) |
| 0.9 | 2.8 | GO:0050497 | methylthiotransferase activity(GO:0035596) transferase activity, transferring alkylthio groups(GO:0050497) |
| 0.9 | 3.6 | GO:0001083 | transcription factor activity, RNA polymerase II basal transcription factor binding(GO:0001083) |
| 0.9 | 7.2 | GO:0035184 | histone threonine kinase activity(GO:0035184) |
| 0.9 | 3.5 | GO:0034432 | endopolyphosphatase activity(GO:0000298) diphosphoinositol-polyphosphate diphosphatase activity(GO:0008486) bis(5'-adenosyl)-hexaphosphatase activity(GO:0034431) bis(5'-adenosyl)-pentaphosphatase activity(GO:0034432) |
| 0.9 | 8.8 | GO:0033170 | DNA clamp loader activity(GO:0003689) protein-DNA loading ATPase activity(GO:0033170) |
| 0.9 | 4.3 | GO:0042289 | MHC class II protein binding(GO:0042289) |
| 0.9 | 2.6 | GO:0001716 | L-amino-acid oxidase activity(GO:0001716) |
| 0.8 | 5.1 | GO:0004126 | cytidine deaminase activity(GO:0004126) |
| 0.8 | 5.0 | GO:0001515 | opioid peptide activity(GO:0001515) |
| 0.8 | 6.6 | GO:0070697 | activin receptor binding(GO:0070697) |
| 0.8 | 2.4 | GO:0050253 | retinyl-palmitate esterase activity(GO:0050253) |
| 0.8 | 3.2 | GO:0004449 | isocitrate dehydrogenase (NAD+) activity(GO:0004449) |
| 0.8 | 5.6 | GO:0030250 | cyclase activator activity(GO:0010853) guanylate cyclase activator activity(GO:0030250) |
| 0.8 | 12.6 | GO:0008568 | microtubule-severing ATPase activity(GO:0008568) |
| 0.8 | 3.8 | GO:0004969 | histamine receptor activity(GO:0004969) |
| 0.7 | 8.1 | GO:0043996 | histone acetyltransferase activity (H4-K5 specific)(GO:0043995) histone acetyltransferase activity (H4-K8 specific)(GO:0043996) histone acetyltransferase activity (H4-K16 specific)(GO:0046972) |
| 0.7 | 7.0 | GO:0004415 | hyalurononglucosaminidase activity(GO:0004415) |
| 0.7 | 4.9 | GO:0016308 | 1-phosphatidylinositol-4-phosphate 5-kinase activity(GO:0016308) |
| 0.7 | 2.1 | GO:0004586 | ornithine decarboxylase activity(GO:0004586) |
| 0.7 | 4.1 | GO:0070538 | oleic acid binding(GO:0070538) |
| 0.7 | 4.8 | GO:0015277 | kainate selective glutamate receptor activity(GO:0015277) |
| 0.7 | 6.9 | GO:0009931 | calcium-dependent protein serine/threonine kinase activity(GO:0009931) |
| 0.7 | 3.4 | GO:0035374 | chondroitin sulfate binding(GO:0035374) |
| 0.7 | 47.9 | GO:0003724 | RNA helicase activity(GO:0003724) ATP-dependent RNA helicase activity(GO:0004004) |
| 0.7 | 8.6 | GO:0016813 | hydrolase activity, acting on carbon-nitrogen (but not peptide) bonds, in linear amidines(GO:0016813) |
| 0.7 | 9.2 | GO:0031996 | thioesterase binding(GO:0031996) |
| 0.7 | 4.6 | GO:0015204 | urea transmembrane transporter activity(GO:0015204) |
| 0.7 | 5.9 | GO:0046974 | histone methyltransferase activity (H3-K9 specific)(GO:0046974) |
| 0.7 | 4.6 | GO:0000155 | phosphorelay sensor kinase activity(GO:0000155) |
| 0.6 | 3.9 | GO:0034647 | histone demethylase activity (H3-trimethyl-K4 specific)(GO:0034647) |
| 0.6 | 1.9 | GO:0004167 | dopachrome isomerase activity(GO:0004167) |
| 0.6 | 2.5 | GO:0016716 | oxidoreductase activity, acting on paired donors, with incorporation or reduction of molecular oxygen, another compound as one donor, and incorporation of one atom of oxygen(GO:0016716) |
| 0.6 | 3.1 | GO:0022841 | potassium ion leak channel activity(GO:0022841) |
| 0.6 | 2.5 | GO:0008109 | N-acetyllactosaminide beta-1,6-N-acetylglucosaminyltransferase activity(GO:0008109) |
| 0.6 | 2.4 | GO:0035173 | histone kinase activity(GO:0035173) |
| 0.6 | 2.4 | GO:0045134 | uridine-diphosphatase activity(GO:0045134) |
| 0.6 | 4.2 | GO:0005173 | stem cell factor receptor binding(GO:0005173) |
| 0.6 | 2.4 | GO:0034191 | apolipoprotein A-I receptor binding(GO:0034191) |
| 0.6 | 1.8 | GO:0008169 | C-methyltransferase activity(GO:0008169) |
| 0.6 | 10.1 | GO:0008253 | 5'-nucleotidase activity(GO:0008253) |
| 0.6 | 1.8 | GO:0052854 | very-long-chain-(S)-2-hydroxy-acid oxidase activity(GO:0052852) long-chain-(S)-2-hydroxy-long-chain-acid oxidase activity(GO:0052853) medium-chain-(S)-2-hydroxy-acid oxidase activity(GO:0052854) |
| 0.6 | 2.9 | GO:0004140 | dephospho-CoA kinase activity(GO:0004140) |
| 0.6 | 11.6 | GO:0017056 | structural constituent of nuclear pore(GO:0017056) |
| 0.6 | 3.5 | GO:0030911 | TPR domain binding(GO:0030911) |
| 0.6 | 3.5 | GO:0097322 | 7SK snRNA binding(GO:0097322) |
| 0.6 | 2.9 | GO:0004488 | methenyltetrahydrofolate cyclohydrolase activity(GO:0004477) methylenetetrahydrofolate dehydrogenase (NADP+) activity(GO:0004488) |
| 0.6 | 2.8 | GO:0005105 | type 1 fibroblast growth factor receptor binding(GO:0005105) type 2 fibroblast growth factor receptor binding(GO:0005111) |
| 0.6 | 2.8 | GO:0061133 | endopeptidase activator activity(GO:0061133) |
| 0.6 | 1.7 | GO:0042978 | ornithine decarboxylase activator activity(GO:0042978) |
| 0.6 | 1.7 | GO:0052591 | sn-glycerol-3-phosphate:ubiquinone oxidoreductase activity(GO:0052590) sn-glycerol-3-phosphate:ubiquinone-8 oxidoreductase activity(GO:0052591) |
| 0.5 | 7.1 | GO:0016805 | dipeptidase activity(GO:0016805) |
| 0.5 | 2.2 | GO:0001642 | group III metabotropic glutamate receptor activity(GO:0001642) |
| 0.5 | 1.1 | GO:0010521 | telomerase inhibitor activity(GO:0010521) |
| 0.5 | 1.6 | GO:0102390 | mycophenolic acid acyl-glucuronide esterase activity(GO:0102390) |
| 0.5 | 3.2 | GO:0005499 | vitamin D binding(GO:0005499) |
| 0.5 | 4.2 | GO:0044323 | retinoic acid-responsive element binding(GO:0044323) |
| 0.5 | 2.1 | GO:0035174 | histone serine kinase activity(GO:0035174) |
| 0.5 | 35.6 | GO:0004869 | cysteine-type endopeptidase inhibitor activity(GO:0004869) |
| 0.5 | 8.7 | GO:0022848 | acetylcholine-gated cation channel activity(GO:0022848) |
| 0.5 | 9.7 | GO:0070628 | proteasome binding(GO:0070628) |
| 0.5 | 2.0 | GO:0003987 | acetate-CoA ligase activity(GO:0003987) |
| 0.5 | 3.5 | GO:1990446 | U1 snRNP binding(GO:1990446) |
| 0.5 | 2.0 | GO:0005143 | interleukin-12 receptor binding(GO:0005143) |
| 0.5 | 1.5 | GO:0004911 | interleukin-2 receptor activity(GO:0004911) |
| 0.5 | 4.3 | GO:0086080 | protein binding involved in heterotypic cell-cell adhesion(GO:0086080) |
| 0.5 | 8.0 | GO:0032454 | histone demethylase activity (H3-K9 specific)(GO:0032454) |
| 0.5 | 7.9 | GO:0008195 | phosphatidate phosphatase activity(GO:0008195) |
| 0.5 | 9.3 | GO:0005251 | delayed rectifier potassium channel activity(GO:0005251) |
| 0.5 | 4.2 | GO:0008432 | JUN kinase binding(GO:0008432) |
| 0.5 | 2.8 | GO:0051430 | corticotropin-releasing hormone receptor 1 binding(GO:0051430) |
| 0.5 | 8.8 | GO:0016799 | hydrolase activity, hydrolyzing N-glycosyl compounds(GO:0016799) |
| 0.5 | 1.8 | GO:0016428 | tRNA (cytosine-5-)-methyltransferase activity(GO:0016428) |
| 0.5 | 1.4 | GO:0032217 | riboflavin transporter activity(GO:0032217) |
| 0.4 | 3.6 | GO:0047499 | calcium-independent phospholipase A2 activity(GO:0047499) |
| 0.4 | 7.6 | GO:0030159 | receptor signaling complex scaffold activity(GO:0030159) |
| 0.4 | 15.6 | GO:0031624 | ubiquitin conjugating enzyme binding(GO:0031624) |
| 0.4 | 16.9 | GO:0005164 | tumor necrosis factor receptor binding(GO:0005164) |
| 0.4 | 1.3 | GO:0001565 | phorbol ester receptor activity(GO:0001565) |
| 0.4 | 1.8 | GO:0070915 | lysophosphatidic acid receptor activity(GO:0070915) |
| 0.4 | 6.1 | GO:0033038 | bitter taste receptor activity(GO:0033038) |
| 0.4 | 3.0 | GO:0045504 | dynein heavy chain binding(GO:0045504) |
| 0.4 | 4.3 | GO:0102391 | very long-chain fatty acid-CoA ligase activity(GO:0031957) decanoate--CoA ligase activity(GO:0102391) |
| 0.4 | 2.1 | GO:0044547 | DNA topoisomerase binding(GO:0044547) |
| 0.4 | 1.7 | GO:0043262 | adenosine-diphosphatase activity(GO:0043262) |
| 0.4 | 2.1 | GO:0001093 | TFIIB-class transcription factor binding(GO:0001093) |
| 0.4 | 1.6 | GO:0019784 | NEDD8-specific protease activity(GO:0019784) |
| 0.4 | 1.2 | GO:0047045 | testosterone 17-beta-dehydrogenase (NADP+) activity(GO:0047045) |
| 0.4 | 1.6 | GO:0003958 | NADPH-hemoprotein reductase activity(GO:0003958) oxidoreductase activity, acting on NAD(P)H, heme protein as acceptor(GO:0016653) |
| 0.4 | 25.8 | GO:0003777 | microtubule motor activity(GO:0003777) |
| 0.4 | 1.2 | GO:0004995 | tachykinin receptor activity(GO:0004995) |
| 0.4 | 1.2 | GO:0000033 | alpha-1,3-mannosyltransferase activity(GO:0000033) |
| 0.4 | 4.6 | GO:0004861 | cyclin-dependent protein serine/threonine kinase inhibitor activity(GO:0004861) |
| 0.4 | 1.1 | GO:0051880 | G-quadruplex DNA binding(GO:0051880) |
| 0.4 | 1.5 | GO:0004366 | glycerol-3-phosphate O-acyltransferase activity(GO:0004366) |
| 0.4 | 1.5 | GO:0030292 | protein tyrosine kinase inhibitor activity(GO:0030292) |
| 0.4 | 4.0 | GO:0003841 | 1-acylglycerol-3-phosphate O-acyltransferase activity(GO:0003841) |
| 0.4 | 44.3 | GO:0004222 | metalloendopeptidase activity(GO:0004222) |
| 0.4 | 1.8 | GO:0031078 | histone deacetylase activity (H3-K14 specific)(GO:0031078) NAD-dependent histone deacetylase activity (H3-K14 specific)(GO:0032041) |
| 0.4 | 2.8 | GO:0000064 | L-ornithine transmembrane transporter activity(GO:0000064) |
| 0.3 | 11.0 | GO:0061631 | ubiquitin conjugating enzyme activity(GO:0061631) |
| 0.3 | 1.7 | GO:0004726 | non-membrane spanning protein tyrosine phosphatase activity(GO:0004726) |
| 0.3 | 6.0 | GO:0017160 | Ral GTPase binding(GO:0017160) |
| 0.3 | 1.0 | GO:0046592 | polyamine oxidase activity(GO:0046592) |
| 0.3 | 4.6 | GO:0008353 | RNA polymerase II carboxy-terminal domain kinase activity(GO:0008353) |
| 0.3 | 11.3 | GO:0036002 | pre-mRNA binding(GO:0036002) |
| 0.3 | 1.3 | GO:0000995 | transcription factor activity, core RNA polymerase III binding(GO:0000995) |
| 0.3 | 1.9 | GO:0000400 | four-way junction DNA binding(GO:0000400) |
| 0.3 | 2.8 | GO:0009881 | photoreceptor activity(GO:0009881) |
| 0.3 | 0.6 | GO:0070546 | L-phenylalanine aminotransferase activity(GO:0070546) |
| 0.3 | 1.8 | GO:0034046 | poly(G) binding(GO:0034046) |
| 0.3 | 1.8 | GO:0070290 | N-acylphosphatidylethanolamine-specific phospholipase D activity(GO:0070290) |
| 0.3 | 2.4 | GO:0004035 | alkaline phosphatase activity(GO:0004035) |
| 0.3 | 2.1 | GO:0015119 | hexose phosphate transmembrane transporter activity(GO:0015119) organophosphate:inorganic phosphate antiporter activity(GO:0015315) hexose-phosphate:inorganic phosphate antiporter activity(GO:0015526) glucose 6-phosphate:inorganic phosphate antiporter activity(GO:0061513) |
| 0.3 | 56.7 | GO:0042393 | histone binding(GO:0042393) |
| 0.3 | 1.8 | GO:0004128 | cytochrome-b5 reductase activity, acting on NAD(P)H(GO:0004128) |
| 0.3 | 1.2 | GO:0072542 | protein phosphatase activator activity(GO:0072542) |
| 0.3 | 8.6 | GO:0004864 | protein phosphatase inhibitor activity(GO:0004864) |
| 0.3 | 1.8 | GO:0008294 | calcium- and calmodulin-responsive adenylate cyclase activity(GO:0008294) |
| 0.3 | 1.4 | GO:0052629 | phosphatidylinositol-3,5-bisphosphate 3-phosphatase activity(GO:0052629) |
| 0.3 | 9.6 | GO:0004712 | protein serine/threonine/tyrosine kinase activity(GO:0004712) |
| 0.3 | 0.9 | GO:0050733 | RS domain binding(GO:0050733) |
| 0.3 | 1.2 | GO:0005163 | nerve growth factor receptor binding(GO:0005163) |
| 0.3 | 0.8 | GO:0042015 | interleukin-20 binding(GO:0042015) |
| 0.3 | 1.1 | GO:0004305 | ethanolamine kinase activity(GO:0004305) |
| 0.3 | 4.2 | GO:0070182 | DNA polymerase binding(GO:0070182) |
| 0.3 | 5.6 | GO:0015035 | protein disulfide oxidoreductase activity(GO:0015035) |
| 0.3 | 0.8 | GO:0000179 | rRNA (adenine-N6,N6-)-dimethyltransferase activity(GO:0000179) |
| 0.3 | 2.5 | GO:0042974 | retinoic acid receptor binding(GO:0042974) |
| 0.3 | 1.9 | GO:0010340 | carboxyl-O-methyltransferase activity(GO:0010340) protein carboxyl O-methyltransferase activity(GO:0051998) |
| 0.3 | 5.7 | GO:0042800 | histone methyltransferase activity (H3-K4 specific)(GO:0042800) |
| 0.3 | 3.5 | GO:0010314 | phosphatidylinositol-5-phosphate binding(GO:0010314) |
| 0.3 | 1.0 | GO:0070016 | armadillo repeat domain binding(GO:0070016) |
| 0.3 | 2.1 | GO:0004859 | phospholipase inhibitor activity(GO:0004859) |
| 0.3 | 2.8 | GO:0051787 | misfolded protein binding(GO:0051787) |
| 0.3 | 15.0 | GO:0003684 | damaged DNA binding(GO:0003684) |
| 0.3 | 3.8 | GO:0030371 | translation repressor activity(GO:0030371) |
| 0.2 | 1.5 | GO:0005005 | transmembrane-ephrin receptor activity(GO:0005005) |
| 0.2 | 1.0 | GO:0032190 | acrosin binding(GO:0032190) |
| 0.2 | 2.5 | GO:1990380 | Lys48-specific deubiquitinase activity(GO:1990380) |
| 0.2 | 1.0 | GO:0003842 | 1-pyrroline-5-carboxylate dehydrogenase activity(GO:0003842) |
| 0.2 | 9.4 | GO:0070063 | RNA polymerase binding(GO:0070063) |
| 0.2 | 23.4 | GO:0042826 | histone deacetylase binding(GO:0042826) |
| 0.2 | 14.2 | GO:0003743 | translation initiation factor activity(GO:0003743) |
| 0.2 | 1.6 | GO:0033265 | choline binding(GO:0033265) |
| 0.2 | 1.1 | GO:0004977 | melanocortin receptor activity(GO:0004977) |
| 0.2 | 6.1 | GO:0005328 | neurotransmitter:sodium symporter activity(GO:0005328) |
| 0.2 | 2.2 | GO:0005222 | intracellular cAMP activated cation channel activity(GO:0005222) |
| 0.2 | 1.8 | GO:0015562 | efflux transmembrane transporter activity(GO:0015562) |
| 0.2 | 19.4 | GO:0003713 | transcription coactivator activity(GO:0003713) |
| 0.2 | 3.1 | GO:0019531 | oxalate transmembrane transporter activity(GO:0019531) |
| 0.2 | 0.9 | GO:0035368 | selenocysteine insertion sequence binding(GO:0035368) |
| 0.2 | 1.7 | GO:0045505 | dynein intermediate chain binding(GO:0045505) |
| 0.2 | 2.8 | GO:0005225 | volume-sensitive anion channel activity(GO:0005225) |
| 0.2 | 0.8 | GO:0000822 | inositol hexakisphosphate binding(GO:0000822) |
| 0.2 | 0.8 | GO:0099583 | neurotransmitter receptor activity involved in regulation of postsynaptic cytosolic calcium ion concentration(GO:0099583) |
| 0.2 | 1.4 | GO:0001091 | RNA polymerase II basal transcription factor binding(GO:0001091) |
| 0.2 | 1.4 | GO:0044388 | small protein activating enzyme binding(GO:0044388) |
| 0.2 | 0.8 | GO:0015186 | L-glutamine transmembrane transporter activity(GO:0015186) |
| 0.2 | 1.0 | GO:0031802 | type 5 metabotropic glutamate receptor binding(GO:0031802) |
| 0.2 | 1.6 | GO:0097602 | cullin family protein binding(GO:0097602) |
| 0.2 | 1.0 | GO:0004337 | dimethylallyltranstransferase activity(GO:0004161) geranyltranstransferase activity(GO:0004337) |
| 0.2 | 2.0 | GO:0005436 | sodium:phosphate symporter activity(GO:0005436) |
| 0.2 | 1.4 | GO:0003956 | NAD(P)+-protein-arginine ADP-ribosyltransferase activity(GO:0003956) |
| 0.2 | 3.3 | GO:0004806 | triglyceride lipase activity(GO:0004806) |
| 0.2 | 1.5 | GO:0003910 | DNA ligase activity(GO:0003909) DNA ligase (ATP) activity(GO:0003910) |
| 0.2 | 0.6 | GO:0016509 | long-chain-3-hydroxyacyl-CoA dehydrogenase activity(GO:0016509) |
| 0.2 | 1.8 | GO:0034450 | ubiquitin-ubiquitin ligase activity(GO:0034450) |
| 0.2 | 6.5 | GO:0008009 | chemokine activity(GO:0008009) |
| 0.2 | 2.2 | GO:0019869 | chloride channel inhibitor activity(GO:0019869) |
| 0.2 | 0.9 | GO:0004407 | histone deacetylase activity(GO:0004407) |
| 0.2 | 3.3 | GO:0008519 | ammonium transmembrane transporter activity(GO:0008519) |
| 0.2 | 2.6 | GO:0050811 | GABA receptor binding(GO:0050811) |
| 0.2 | 1.0 | GO:0016671 | oxidoreductase activity, acting on a sulfur group of donors, disulfide as acceptor(GO:0016671) |
| 0.2 | 5.9 | GO:0019894 | kinesin binding(GO:0019894) |
| 0.2 | 13.0 | GO:0036459 | thiol-dependent ubiquitinyl hydrolase activity(GO:0036459) ubiquitinyl hydrolase activity(GO:0101005) |
| 0.2 | 1.5 | GO:0098919 | structural constituent of postsynaptic specialization(GO:0098879) structural constituent of postsynaptic density(GO:0098919) |
| 0.2 | 0.8 | GO:0004985 | opioid receptor activity(GO:0004985) |
| 0.2 | 4.1 | GO:0005501 | retinoid binding(GO:0005501) |
| 0.2 | 1.3 | GO:0004749 | ribose phosphate diphosphokinase activity(GO:0004749) |
| 0.2 | 1.7 | GO:0043422 | protein kinase B binding(GO:0043422) |
| 0.2 | 0.9 | GO:0005049 | nuclear export signal receptor activity(GO:0005049) |
| 0.1 | 1.3 | GO:0005487 | nucleocytoplasmic transporter activity(GO:0005487) |
| 0.1 | 1.0 | GO:0017151 | DEAD/H-box RNA helicase binding(GO:0017151) |
| 0.1 | 1.0 | GO:0008474 | palmitoyl-(protein) hydrolase activity(GO:0008474) palmitoyl hydrolase activity(GO:0098599) |
| 0.1 | 9.4 | GO:0051082 | unfolded protein binding(GO:0051082) |
| 0.1 | 1.0 | GO:0038062 | protein tyrosine kinase collagen receptor activity(GO:0038062) |
| 0.1 | 1.0 | GO:0016286 | small conductance calcium-activated potassium channel activity(GO:0016286) |
| 0.1 | 0.6 | GO:0004739 | pyruvate dehydrogenase (acetyl-transferring) activity(GO:0004739) |
| 0.1 | 0.1 | GO:0070878 | primary miRNA binding(GO:0070878) |
| 0.1 | 0.8 | GO:0017108 | 5'-flap endonuclease activity(GO:0017108) |
| 0.1 | 0.6 | GO:0001733 | galactosylceramide sulfotransferase activity(GO:0001733) |
| 0.1 | 3.1 | GO:0008373 | sialyltransferase activity(GO:0008373) |
| 0.1 | 0.7 | GO:0005550 | pheromone binding(GO:0005550) |
| 0.1 | 3.3 | GO:0016667 | oxidoreductase activity, acting on a sulfur group of donors(GO:0016667) |
| 0.1 | 2.3 | GO:0005522 | profilin binding(GO:0005522) |
| 0.1 | 1.6 | GO:0019966 | interleukin-1 binding(GO:0019966) |
| 0.1 | 2.3 | GO:1900750 | glutathione binding(GO:0043295) oligopeptide binding(GO:1900750) |
| 0.1 | 1.2 | GO:0005132 | type I interferon receptor binding(GO:0005132) |
| 0.1 | 1.0 | GO:0051959 | dynein light intermediate chain binding(GO:0051959) |
| 0.1 | 2.2 | GO:0017128 | phospholipid scramblase activity(GO:0017128) |
| 0.1 | 2.4 | GO:0046966 | thyroid hormone receptor binding(GO:0046966) |
| 0.1 | 5.9 | GO:0043022 | ribosome binding(GO:0043022) |
| 0.1 | 1.1 | GO:0005004 | GPI-linked ephrin receptor activity(GO:0005004) |
| 0.1 | 4.1 | GO:0019707 | protein-cysteine S-palmitoyltransferase activity(GO:0019706) protein-cysteine S-acyltransferase activity(GO:0019707) |
| 0.1 | 0.5 | GO:0035259 | glucocorticoid receptor binding(GO:0035259) |
| 0.1 | 2.6 | GO:0098632 | protein binding involved in cell-cell adhesion(GO:0098632) |
| 0.1 | 1.3 | GO:0001206 | transcriptional repressor activity, RNA polymerase II distal enhancer sequence-specific binding(GO:0001206) |
| 0.1 | 0.9 | GO:0032050 | clathrin heavy chain binding(GO:0032050) |
| 0.1 | 4.4 | GO:0070888 | E-box binding(GO:0070888) |
| 0.1 | 2.4 | GO:0016849 | phosphorus-oxygen lyase activity(GO:0016849) |
| 0.1 | 0.9 | GO:0034513 | box H/ACA snoRNA binding(GO:0034513) |
| 0.1 | 1.9 | GO:0070064 | proline-rich region binding(GO:0070064) |
| 0.1 | 0.7 | GO:1990948 | ligase inhibitor activity(GO:0055104) ubiquitin ligase inhibitor activity(GO:1990948) |
| 0.1 | 0.3 | GO:0031721 | hemoglobin alpha binding(GO:0031721) |
| 0.1 | 1.7 | GO:0008327 | methyl-CpG binding(GO:0008327) |
| 0.1 | 1.7 | GO:0043395 | heparan sulfate proteoglycan binding(GO:0043395) |
| 0.1 | 1.4 | GO:0001103 | RNA polymerase II repressing transcription factor binding(GO:0001103) |
| 0.1 | 0.9 | GO:0001591 | dopamine neurotransmitter receptor activity, coupled via Gi/Go(GO:0001591) |
| 0.1 | 0.2 | GO:0097027 | ubiquitin-protein transferase activator activity(GO:0097027) |
| 0.1 | 2.7 | GO:0005385 | zinc ion transmembrane transporter activity(GO:0005385) |
| 0.1 | 0.9 | GO:0071855 | neuropeptide receptor binding(GO:0071855) |
| 0.1 | 15.4 | GO:0005516 | calmodulin binding(GO:0005516) |
| 0.1 | 1.0 | GO:0004862 | cAMP-dependent protein kinase inhibitor activity(GO:0004862) |
| 0.1 | 0.7 | GO:0004705 | JUN kinase activity(GO:0004705) SAP kinase activity(GO:0016909) |
| 0.1 | 0.5 | GO:0048406 | nerve growth factor binding(GO:0048406) |
| 0.1 | 0.3 | GO:0001221 | transcription cofactor binding(GO:0001221) |
| 0.1 | 34.5 | GO:0004842 | ubiquitin-protein transferase activity(GO:0004842) |
| 0.1 | 0.6 | GO:0008479 | queuine tRNA-ribosyltransferase activity(GO:0008479) |
| 0.1 | 0.6 | GO:0015450 | P-P-bond-hydrolysis-driven protein transmembrane transporter activity(GO:0015450) |
| 0.1 | 1.6 | GO:0070273 | phosphatidylinositol-4-phosphate binding(GO:0070273) |
| 0.1 | 1.3 | GO:0015301 | anion:anion antiporter activity(GO:0015301) |
| 0.1 | 1.9 | GO:0017025 | TBP-class protein binding(GO:0017025) |
| 0.1 | 0.6 | GO:0004065 | arylsulfatase activity(GO:0004065) |
| 0.1 | 6.0 | GO:0003682 | chromatin binding(GO:0003682) |
| 0.1 | 0.1 | GO:0032551 | UTP binding(GO:0002134) pyrimidine ribonucleoside binding(GO:0032551) |
| 0.1 | 0.9 | GO:0003747 | translation release factor activity(GO:0003747) translation termination factor activity(GO:0008079) |
| 0.1 | 1.6 | GO:0042056 | chemoattractant activity(GO:0042056) |
| 0.1 | 0.7 | GO:0001135 | transcription factor activity, RNA polymerase II transcription factor recruiting(GO:0001135) |
| 0.1 | 0.8 | GO:0015216 | purine nucleotide transmembrane transporter activity(GO:0015216) |
| 0.1 | 1.3 | GO:0003746 | translation elongation factor activity(GO:0003746) |
| 0.1 | 0.6 | GO:0004966 | galanin receptor activity(GO:0004966) |
| 0.1 | 0.8 | GO:0004596 | peptide alpha-N-acetyltransferase activity(GO:0004596) |
| 0.1 | 1.4 | GO:0042162 | telomeric DNA binding(GO:0042162) |
| 0.1 | 4.6 | GO:0031490 | chromatin DNA binding(GO:0031490) |
| 0.1 | 6.5 | GO:0047485 | protein N-terminus binding(GO:0047485) |
| 0.1 | 0.1 | GO:0019211 | phosphatase activator activity(GO:0019211) |
| 0.1 | 0.3 | GO:0042731 | PH domain binding(GO:0042731) |
| 0.1 | 1.2 | GO:0030544 | Hsp70 protein binding(GO:0030544) |
| 0.1 | 0.5 | GO:0070491 | repressing transcription factor binding(GO:0070491) |
| 0.1 | 0.8 | GO:0005527 | macrolide binding(GO:0005527) FK506 binding(GO:0005528) |
| 0.1 | 7.9 | GO:0004518 | nuclease activity(GO:0004518) |
| 0.1 | 2.8 | GO:0005245 | voltage-gated calcium channel activity(GO:0005245) |
| 0.1 | 0.3 | GO:0004427 | inorganic diphosphatase activity(GO:0004427) |
| 0.1 | 90.9 | GO:0003677 | DNA binding(GO:0003677) |
| 0.1 | 0.5 | GO:0008559 | xenobiotic-transporting ATPase activity(GO:0008559) xenobiotic transporter activity(GO:0042910) |
| 0.1 | 0.6 | GO:0022889 | L-serine transmembrane transporter activity(GO:0015194) serine transmembrane transporter activity(GO:0022889) |
| 0.1 | 0.5 | GO:0005234 | extracellular-glutamate-gated ion channel activity(GO:0005234) |
| 0.1 | 7.3 | GO:0005179 | hormone activity(GO:0005179) |
| 0.0 | 0.7 | GO:0051378 | serotonin binding(GO:0051378) |
| 0.0 | 0.2 | GO:1990381 | ubiquitin-specific protease binding(GO:1990381) |
| 0.0 | 0.2 | GO:0004027 | alcohol sulfotransferase activity(GO:0004027) |
| 0.0 | 0.3 | GO:0004703 | G-protein coupled receptor kinase activity(GO:0004703) |
| 0.0 | 6.2 | GO:0008017 | microtubule binding(GO:0008017) |
| 0.0 | 0.3 | GO:0004332 | fructose-bisphosphate aldolase activity(GO:0004332) |
| 0.0 | 0.7 | GO:0005212 | structural constituent of eye lens(GO:0005212) |
| 0.0 | 0.3 | GO:0015232 | heme transporter activity(GO:0015232) |
| 0.0 | 0.3 | GO:0030332 | cyclin binding(GO:0030332) |
| 0.0 | 0.5 | GO:0008139 | nuclear localization sequence binding(GO:0008139) |
| 0.0 | 0.1 | GO:0035243 | protein-arginine omega-N symmetric methyltransferase activity(GO:0035243) |
| 0.0 | 0.4 | GO:0003950 | NAD+ ADP-ribosyltransferase activity(GO:0003950) |
| 0.0 | 0.1 | GO:0015252 | hydrogen ion channel activity(GO:0015252) |
| 0.0 | 0.3 | GO:0080025 | phosphatidylinositol-3,5-bisphosphate binding(GO:0080025) |
| 0.0 | 0.8 | GO:0042169 | SH2 domain binding(GO:0042169) |
| 0.0 | 0.1 | GO:0004724 | magnesium-dependent protein serine/threonine phosphatase activity(GO:0004724) |
| 0.0 | 0.6 | GO:0003714 | transcription corepressor activity(GO:0003714) |
| 0.0 | 0.3 | GO:0004298 | threonine-type endopeptidase activity(GO:0004298) threonine-type peptidase activity(GO:0070003) |
Gene overrepresentation in curated gene sets: canonical pathways category:
| Log-likelihood per target | Total log-likelihood | Term | Description |
|---|---|---|---|
| 1.7 | 23.6 | ST INTERFERON GAMMA PATHWAY | Interferon gamma pathway. |
| 0.9 | 47.9 | PID FANCONI PATHWAY | Fanconi anemia pathway |
| 0.8 | 12.0 | SA REG CASCADE OF CYCLIN EXPR | Expression of cyclins regulates progression through the cell cycle by activating cyclin-dependent kinases. |
| 0.7 | 24.4 | PID MYC PATHWAY | C-MYC pathway |
| 0.7 | 7.2 | SA G2 AND M PHASES | Cdc25 activates the cdc2/cyclin B complex to induce the G2/M transition. |
| 0.7 | 33.4 | PID PLK1 PATHWAY | PLK1 signaling events |
| 0.5 | 16.3 | PID AURORA A PATHWAY | Aurora A signaling |
| 0.4 | 7.5 | PID BARD1 PATHWAY | BARD1 signaling events |
| 0.4 | 6.1 | SA PROGRAMMED CELL DEATH | Programmed cell death, or apoptosis, eliminates damaged or unneeded cells. |
| 0.3 | 5.6 | PID ERB GENOMIC PATHWAY | Validated nuclear estrogen receptor beta network |
| 0.3 | 4.6 | PID ATR PATHWAY | ATR signaling pathway |
| 0.2 | 9.4 | PID HDAC CLASSII PATHWAY | Signaling events mediated by HDAC Class II |
| 0.2 | 7.2 | PID AURORA B PATHWAY | Aurora B signaling |
| 0.2 | 2.7 | PID TCR JNK PATHWAY | JNK signaling in the CD4+ TCR pathway |
| 0.2 | 0.7 | PID CD40 PATHWAY | CD40/CD40L signaling |
| 0.2 | 8.0 | PID DELTA NP63 PATHWAY | Validated transcriptional targets of deltaNp63 isoforms |
| 0.1 | 1.7 | ST G ALPHA S PATHWAY | G alpha s Pathway |
| 0.1 | 1.6 | PID AR TF PATHWAY | Regulation of Androgen receptor activity |
| 0.1 | 4.4 | PID P53 REGULATION PATHWAY | p53 pathway |
| 0.1 | 3.8 | PID RB 1PATHWAY | Regulation of retinoblastoma protein |
| 0.1 | 0.7 | PID AR NONGENOMIC PATHWAY | Nongenotropic Androgen signaling |
| 0.1 | 1.1 | PID HDAC CLASSIII PATHWAY | Signaling events mediated by HDAC Class III |
| 0.1 | 4.0 | ST FAS SIGNALING PATHWAY | Fas Signaling Pathway |
| 0.1 | 3.5 | PID RHOA PATHWAY | RhoA signaling pathway |
| 0.1 | 2.1 | PID TCR CALCIUM PATHWAY | Calcium signaling in the CD4+ TCR pathway |
| 0.1 | 1.2 | PID ATF2 PATHWAY | ATF-2 transcription factor network |
| 0.1 | 3.6 | PID MYC ACTIV PATHWAY | Validated targets of C-MYC transcriptional activation |
| 0.0 | 0.5 | PID S1P S1P4 PATHWAY | S1P4 pathway |
| 0.0 | 1.0 | PID SYNDECAN 3 PATHWAY | Syndecan-3-mediated signaling events |
| 0.0 | 0.6 | PID RETINOIC ACID PATHWAY | Retinoic acid receptors-mediated signaling |
| 0.0 | 0.5 | PID HIF2PATHWAY | HIF-2-alpha transcription factor network |
| 0.0 | 0.2 | PID ATM PATHWAY | ATM pathway |
Gene overrepresentation in curated gene sets: REACTOME pathways category:
| Log-likelihood per target | Total log-likelihood | Term | Description |
|---|---|---|---|
| 1.3 | 22.3 | REACTOME REPAIR SYNTHESIS FOR GAP FILLING BY DNA POL IN TC NER | Genes involved in Repair synthesis for gap-filling by DNA polymerase in TC-NER |
| 1.2 | 11.1 | REACTOME ANDROGEN BIOSYNTHESIS | Genes involved in Androgen biosynthesis |
| 1.2 | 15.6 | REACTOME IL 6 SIGNALING | Genes involved in Interleukin-6 signaling |
| 1.1 | 12.3 | REACTOME APOPTOSIS INDUCED DNA FRAGMENTATION | Genes involved in Apoptosis induced DNA fragmentation |
| 1.0 | 31.3 | REACTOME MEIOTIC RECOMBINATION | Genes involved in Meiotic Recombination |
| 1.0 | 10.5 | REACTOME HORMONE LIGAND BINDING RECEPTORS | Genes involved in Hormone ligand-binding receptors |
| 0.9 | 14.8 | REACTOME ACETYLCHOLINE NEUROTRANSMITTER RELEASE CYCLE | Genes involved in Acetylcholine Neurotransmitter Release Cycle |
| 0.9 | 10.7 | REACTOME E2F ENABLED INHIBITION OF PRE REPLICATION COMPLEX FORMATION | Genes involved in E2F-enabled inhibition of pre-replication complex formation |
| 0.9 | 38.1 | REACTOME RNA POL II TRANSCRIPTION PRE INITIATION AND PROMOTER OPENING | Genes involved in RNA Polymerase II Transcription Pre-Initiation And Promoter Opening |
| 0.8 | 7.2 | REACTOME CDC6 ASSOCIATION WITH THE ORC ORIGIN COMPLEX | Genes involved in CDC6 association with the ORC:origin complex |
| 0.7 | 8.7 | REACTOME PRESYNAPTIC NICOTINIC ACETYLCHOLINE RECEPTORS | Genes involved in Presynaptic nicotinic acetylcholine receptors |
| 0.7 | 30.2 | REACTOME DEPOSITION OF NEW CENPA CONTAINING NUCLEOSOMES AT THE CENTROMERE | Genes involved in Deposition of New CENPA-containing Nucleosomes at the Centromere |
| 0.7 | 3.6 | REACTOME REGULATION OF THE FANCONI ANEMIA PATHWAY | Genes involved in Regulation of the Fanconi anemia pathway |
| 0.6 | 5.5 | REACTOME CYCLIN A B1 ASSOCIATED EVENTS DURING G2 M TRANSITION | Genes involved in Cyclin A/B1 associated events during G2/M transition |
| 0.6 | 7.5 | REACTOME BASE FREE SUGAR PHOSPHATE REMOVAL VIA THE SINGLE NUCLEOTIDE REPLACEMENT PATHWAY | Genes involved in Base-free sugar-phosphate removal via the single-nucleotide replacement pathway |
| 0.6 | 17.1 | REACTOME KINESINS | Genes involved in Kinesins |
| 0.5 | 3.2 | REACTOME REGULATION OF IFNG SIGNALING | Genes involved in Regulation of IFNG signaling |
| 0.5 | 4.0 | REACTOME PROSTANOID LIGAND RECEPTORS | Genes involved in Prostanoid ligand receptors |
| 0.5 | 26.6 | REACTOME LOSS OF NLP FROM MITOTIC CENTROSOMES | Genes involved in Loss of Nlp from mitotic centrosomes |
| 0.5 | 4.6 | REACTOME INHIBITION OF REPLICATION INITIATION OF DAMAGED DNA BY RB1 E2F1 | Genes involved in Inhibition of replication initiation of damaged DNA by RB1/E2F1 |
| 0.5 | 7.3 | REACTOME TGF BETA RECEPTOR SIGNALING IN EMT EPITHELIAL TO MESENCHYMAL TRANSITION | Genes involved in TGF-beta receptor signaling in EMT (epithelial to mesenchymal transition) |
| 0.4 | 12.5 | REACTOME MEIOTIC SYNAPSIS | Genes involved in Meiotic Synapsis |
| 0.4 | 4.4 | REACTOME PURINE CATABOLISM | Genes involved in Purine catabolism |
| 0.4 | 35.7 | REACTOME MITOTIC PROMETAPHASE | Genes involved in Mitotic Prometaphase |
| 0.4 | 3.9 | REACTOME MEMBRANE BINDING AND TARGETTING OF GAG PROTEINS | Genes involved in Membrane binding and targetting of GAG proteins |
| 0.4 | 7.0 | REACTOME FACILITATIVE NA INDEPENDENT GLUCOSE TRANSPORTERS | Genes involved in Facilitative Na+-independent glucose transporters |
| 0.4 | 5.6 | REACTOME REGULATION OF COMPLEMENT CASCADE | Genes involved in Regulation of Complement cascade |
| 0.4 | 9.6 | REACTOME CGMP EFFECTS | Genes involved in cGMP effects |
| 0.4 | 5.7 | REACTOME MRNA DECAY BY 5 TO 3 EXORIBONUCLEASE | Genes involved in mRNA Decay by 5' to 3' Exoribonuclease |
| 0.4 | 2.9 | REACTOME OPSINS | Genes involved in Opsins |
| 0.3 | 5.5 | REACTOME CELL EXTRACELLULAR MATRIX INTERACTIONS | Genes involved in Cell-extracellular matrix interactions |
| 0.3 | 6.0 | REACTOME TRANSPORT OF RIBONUCLEOPROTEINS INTO THE HOST NUCLEUS | Genes involved in Transport of Ribonucleoproteins into the Host Nucleus |
| 0.3 | 4.8 | REACTOME IONOTROPIC ACTIVITY OF KAINATE RECEPTORS | Genes involved in Ionotropic activity of Kainate Receptors |
| 0.3 | 4.5 | REACTOME FORMATION OF TUBULIN FOLDING INTERMEDIATES BY CCT TRIC | Genes involved in Formation of tubulin folding intermediates by CCT/TriC |
| 0.3 | 65.7 | REACTOME ANTIGEN PROCESSING UBIQUITINATION PROTEASOME DEGRADATION | Genes involved in Antigen processing: Ubiquitination & Proteasome degradation |
| 0.3 | 1.9 | REACTOME REGULATION OF ORNITHINE DECARBOXYLASE ODC | Genes involved in Regulation of ornithine decarboxylase (ODC) |
| 0.3 | 0.8 | REACTOME TRANSPORT OF MATURE MRNA DERIVED FROM AN INTRONLESS TRANSCRIPT | Genes involved in Transport of Mature mRNA Derived from an Intronless Transcript |
| 0.3 | 3.3 | REACTOME G0 AND EARLY G1 | Genes involved in G0 and Early G1 |
| 0.2 | 3.5 | REACTOME SYNTHESIS OF PE | Genes involved in Synthesis of PE |
| 0.2 | 6.6 | REACTOME DAG AND IP3 SIGNALING | Genes involved in DAG and IP3 signaling |
| 0.2 | 2.8 | REACTOME FGFR2C LIGAND BINDING AND ACTIVATION | Genes involved in FGFR2c ligand binding and activation |
| 0.2 | 2.8 | REACTOME PLC BETA MEDIATED EVENTS | Genes involved in PLC beta mediated events |
| 0.2 | 4.0 | REACTOME RNA POL III TRANSCRIPTION INITIATION FROM TYPE 2 PROMOTER | Genes involved in RNA Polymerase III Transcription Initiation From Type 2 Promoter |
| 0.2 | 7.6 | REACTOME ABC FAMILY PROTEINS MEDIATED TRANSPORT | Genes involved in ABC-family proteins mediated transport |
| 0.2 | 0.8 | REACTOME AQUAPORIN MEDIATED TRANSPORT | Genes involved in Aquaporin-mediated transport |
| 0.2 | 5.1 | REACTOME PROCESSING OF CAPPED INTRONLESS PRE MRNA | Genes involved in Processing of Capped Intronless Pre-mRNA |
| 0.2 | 0.8 | REACTOME FORMATION OF THE HIV1 EARLY ELONGATION COMPLEX | Genes involved in Formation of the HIV-1 Early Elongation Complex |
| 0.2 | 5.8 | REACTOME INTRINSIC PATHWAY FOR APOPTOSIS | Genes involved in Intrinsic Pathway for Apoptosis |
| 0.2 | 1.3 | REACTOME ETHANOL OXIDATION | Genes involved in Ethanol oxidation |
| 0.1 | 1.1 | REACTOME FORMATION OF RNA POL II ELONGATION COMPLEX | Genes involved in Formation of RNA Pol II elongation complex |
| 0.1 | 2.5 | REACTOME ZINC TRANSPORTERS | Genes involved in Zinc transporters |
| 0.1 | 3.1 | REACTOME GENERATION OF SECOND MESSENGER MOLECULES | Genes involved in Generation of second messenger molecules |
| 0.1 | 0.9 | REACTOME RNA POL I TRANSCRIPTION TERMINATION | Genes involved in RNA Polymerase I Transcription Termination |
| 0.1 | 4.6 | REACTOME AMINE COMPOUND SLC TRANSPORTERS | Genes involved in Amine compound SLC transporters |
| 0.1 | 1.0 | REACTOME NEF MEDIATED DOWNREGULATION OF MHC CLASS I COMPLEX CELL SURFACE EXPRESSION | Genes involved in Nef mediated downregulation of MHC class I complex cell surface expression |
| 0.1 | 0.6 | REACTOME CROSS PRESENTATION OF SOLUBLE EXOGENOUS ANTIGENS ENDOSOMES | Genes involved in Cross-presentation of soluble exogenous antigens (endosomes) |
| 0.1 | 2.1 | REACTOME GAP JUNCTION ASSEMBLY | Genes involved in Gap junction assembly |
| 0.1 | 1.6 | REACTOME PROLACTIN RECEPTOR SIGNALING | Genes involved in Prolactin receptor signaling |
| 0.1 | 0.7 | REACTOME DIGESTION OF DIETARY CARBOHYDRATE | Genes involved in Digestion of dietary carbohydrate |
| 0.1 | 2.6 | REACTOME CASPASE MEDIATED CLEAVAGE OF CYTOSKELETAL PROTEINS | Genes involved in Caspase-mediated cleavage of cytoskeletal proteins |
| 0.1 | 0.6 | REACTOME ABACAVIR TRANSPORT AND METABOLISM | Genes involved in Abacavir transport and metabolism |
| 0.1 | 1.1 | REACTOME NONSENSE MEDIATED DECAY ENHANCED BY THE EXON JUNCTION COMPLEX | Genes involved in Nonsense Mediated Decay Enhanced by the Exon Junction Complex |
| 0.1 | 2.0 | REACTOME CLASS C 3 METABOTROPIC GLUTAMATE PHEROMONE RECEPTORS | Genes involved in Class C/3 (Metabotropic glutamate/pheromone receptors) |
| 0.1 | 0.8 | REACTOME ACTIVATION OF THE AP1 FAMILY OF TRANSCRIPTION FACTORS | Genes involved in Activation of the AP-1 family of transcription factors |
| 0.1 | 1.0 | REACTOME PASSIVE TRANSPORT BY AQUAPORINS | Genes involved in Passive Transport by Aquaporins |
| 0.1 | 1.3 | REACTOME HS GAG DEGRADATION | Genes involved in HS-GAG degradation |
| 0.1 | 3.2 | REACTOME ION TRANSPORT BY P TYPE ATPASES | Genes involved in Ion transport by P-type ATPases |
| 0.1 | 0.2 | REACTOME SCFSKP2 MEDIATED DEGRADATION OF P27 P21 | Genes involved in SCF(Skp2)-mediated degradation of p27/p21 |
| 0.1 | 0.8 | REACTOME FANCONI ANEMIA PATHWAY | Genes involved in Fanconi Anemia pathway |
| 0.1 | 2.6 | REACTOME O LINKED GLYCOSYLATION OF MUCINS | Genes involved in O-linked glycosylation of mucins |
| 0.0 | 0.4 | REACTOME DSCAM INTERACTIONS | Genes involved in DSCAM interactions |
| 0.0 | 0.3 | REACTOME INTEGRATION OF PROVIRUS | Genes involved in Integration of provirus |
| 0.0 | 0.4 | REACTOME GABA A RECEPTOR ACTIVATION | Genes involved in GABA A receptor activation |
| 0.0 | 0.1 | REACTOME MICRORNA MIRNA BIOGENESIS | Genes involved in MicroRNA (miRNA) Biogenesis |
| 0.0 | 0.3 | REACTOME SEROTONIN RECEPTORS | Genes involved in Serotonin receptors |
| 0.0 | 0.3 | REACTOME CTLA4 INHIBITORY SIGNALING | Genes involved in CTLA4 inhibitory signaling |
| 0.0 | 0.2 | REACTOME ERK MAPK TARGETS | Genes involved in ERK/MAPK targets |