Project
GSE53960: rat RNA-Seq transcriptomic Bodymap
Navigation
Downloads
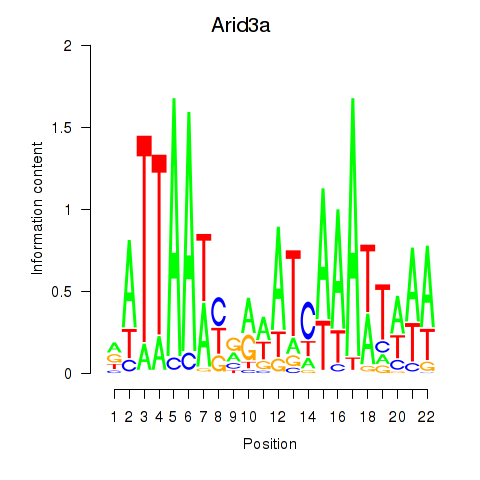
Results for Arid3a
Z-value: 0.93
Motif logo
Transcription factors associated with Arid3a
| Gene Symbol | Gene ID | Gene Info |
|---|---|---|
|
Arid3a
|
ENSRNOG00000026435 | AT-rich interaction domain 3A |
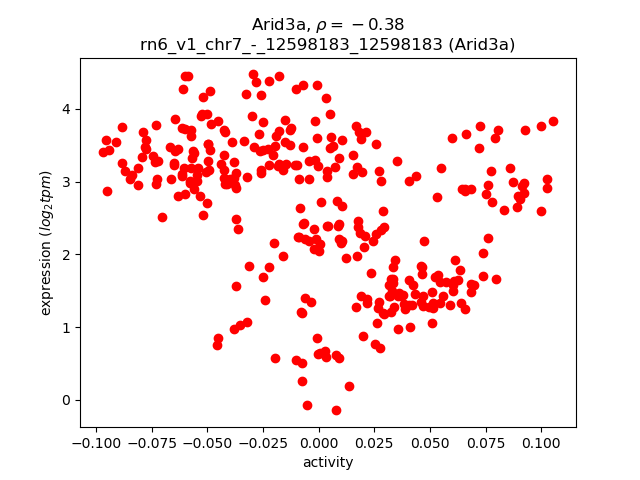
Activity-expression correlation:
| Gene | Promoter | Pearson corr. coef. | P-value | Plot |
|---|---|---|---|---|
| Arid3a | rn6_v1_chr7_-_12598183_12598183 | -0.38 | 2.2e-12 | Click! |
Activity profile of Arid3a motif
Sorted Z-values of Arid3a motif
| Promoter | Log-likelihood | Transcript | Gene | Gene Info |
|---|---|---|---|---|
| chr4_+_61850348 | 35.86 |
ENSRNOT00000013423
|
Akr1b7
|
aldo-keto reductase family 1, member B7 |
| chr1_+_156552328 | 25.92 |
ENSRNOT00000055401
|
Dlg2
|
discs large MAGUK scaffold protein 2 |
| chr10_-_103848035 | 25.79 |
ENSRNOT00000029001
|
Fads6
|
fatty acid desaturase 6 |
| chr15_-_110046687 | 22.23 |
ENSRNOT00000057404
ENSRNOT00000006624 ENSRNOT00000089695 |
Nalcn
|
sodium leak channel, non-selective |
| chr15_-_60056582 | 19.82 |
ENSRNOT00000087569
ENSRNOT00000012530 |
Dnajc15
|
DnaJ heat shock protein family (Hsp40) member C15 |
| chrX_+_106774980 | 19.59 |
ENSRNOT00000046091
|
Tceal7
|
transcription elongation factor A like 7 |
| chrX_-_40086870 | 15.81 |
ENSRNOT00000010027
|
Smpx
|
small muscle protein, X-linked |
| chr2_-_210116038 | 15.50 |
ENSRNOT00000074950
|
LOC684509
|
similar to NADH-ubiquinone oxidoreductase B9 subunit (Complex I-B9) (CI-B9) |
| chr13_-_90641772 | 15.15 |
ENSRNOT00000064601
|
Atp1a4
|
ATPase Na+/K+ transporting subunit alpha 4 |
| chr1_-_277181345 | 14.86 |
ENSRNOT00000038017
ENSRNOT00000038038 |
Nrap
|
nebulin-related anchoring protein |
| chr1_+_70253650 | 14.05 |
ENSRNOT00000087668
|
Zim1
|
zinc finger, imprinted 1 |
| chr2_-_41784929 | 13.82 |
ENSRNOT00000086851
|
Rab3c
|
RAB3C, member RAS oncogene family |
| chr5_-_128333805 | 13.59 |
ENSRNOT00000037523
|
Zfyve9
|
zinc finger FYVE-type containing 9 |
| chr5_+_90338795 | 12.85 |
ENSRNOT00000077864
ENSRNOT00000058882 |
LOC298139
|
similar to RIKEN cDNA 2310003M01 |
| chr20_+_31339787 | 12.22 |
ENSRNOT00000082463
|
Aifm2
|
apoptosis inducing factor, mitochondria associated 2 |
| chr1_-_82409639 | 11.63 |
ENSRNOT00000031326
|
Erich4
|
glutamate-rich 4 |
| chr5_+_2353468 | 11.48 |
ENSRNOT00000090346
|
Stau2
|
staufen double-stranded RNA binding protein 2 |
| chr5_+_165465095 | 11.47 |
ENSRNOT00000031978
|
LOC691354
|
hypothetical protein LOC691354 |
| chr4_-_16669368 | 11.29 |
ENSRNOT00000007608
|
Pclo
|
piccolo (presynaptic cytomatrix protein) |
| chr4_+_30313102 | 11.24 |
ENSRNOT00000012657
|
Asb4
|
ankyrin repeat and SOCS box-containing 4 |
| chr6_-_108120579 | 10.83 |
ENSRNOT00000041163
|
Entpd5
|
ectonucleoside triphosphate diphosphohydrolase 5 |
| chr16_+_29674793 | 10.53 |
ENSRNOT00000059724
|
Anxa10
|
annexin A10 |
| chr11_-_72109964 | 9.93 |
ENSRNOT00000058917
|
AABR07034445.1
|
|
| chrX_-_64726210 | 9.72 |
ENSRNOT00000076012
ENSRNOT00000086265 |
Asb12
|
ankyrin repeat and SOCS box-containing 12 |
| chr16_-_14382641 | 8.95 |
ENSRNOT00000018723
|
Ghitm
|
growth hormone inducible transmembrane protein |
| chr2_-_197878142 | 8.70 |
ENSRNOT00000087052
|
Tars2
|
threonyl-tRNA synthetase 2, mitochondrial (putative) |
| chr14_+_39964588 | 8.68 |
ENSRNOT00000003240
|
Gabrg1
|
gamma-aminobutyric acid type A receptor gamma 1 subunit |
| chr5_+_120340646 | 8.42 |
ENSRNOT00000086259
ENSRNOT00000086539 |
Dnajc6
|
DnaJ heat shock protein family (Hsp40) member C6 |
| chr5_+_162183327 | 8.34 |
ENSRNOT00000037875
|
Pramef8
|
PRAME family member 8 |
| chr2_+_198303168 | 8.31 |
ENSRNOT00000056262
|
Mtmr11
|
myotubularin related protein 11 |
| chr10_+_97771264 | 8.28 |
ENSRNOT00000005257
|
Arsg
|
arylsulfatase G |
| chr9_-_15646846 | 7.85 |
ENSRNOT00000087971
|
Mrps10
|
mitochondrial ribosomal protein S10 |
| chr4_-_98305173 | 7.79 |
ENSRNOT00000010151
|
Il23r
|
interleukin 23 receptor |
| chr8_-_109621408 | 7.72 |
ENSRNOT00000087398
|
Ppp2r3a
|
protein phosphatase 2, regulatory subunit B'', alpha |
| chr14_+_7949239 | 7.71 |
ENSRNOT00000044617
|
Ndufb4l1
|
NADH dehydrogenase (ubiquinone) 1 beta subcomplex, 4-like 1 |
| chr10_+_65272849 | 7.52 |
ENSRNOT00000014386
|
Eral1
|
Era-like 12S mitochondrial rRNA chaperone 1 |
| chr13_+_89243336 | 7.19 |
ENSRNOT00000085688
|
AC111734.2
|
|
| chr3_+_48096954 | 7.10 |
ENSRNOT00000068238
ENSRNOT00000064344 ENSRNOT00000044638 |
Slc4a10
|
solute carrier family 4 member 10 |
| chr8_+_70708873 | 6.47 |
ENSRNOT00000045106
|
Parp16
|
poly (ADP-ribose) polymerase family, member 16 |
| chr11_+_20474483 | 6.39 |
ENSRNOT00000082417
ENSRNOT00000002895 |
Ncam2
|
neural cell adhesion molecule 2 |
| chr8_+_130350510 | 6.38 |
ENSRNOT00000073376
|
Ss18l2
|
SS18 like 2 |
| chr11_-_4332255 | 6.32 |
ENSRNOT00000087133
|
Cadm2
|
cell adhesion molecule 2 |
| chr8_+_70760922 | 6.23 |
ENSRNOT00000044887
|
Cilp
|
cartilage intermediate layer protein |
| chr1_+_225068009 | 6.16 |
ENSRNOT00000026651
|
Ubxn1
|
UBX domain protein 1 |
| chr18_+_16146447 | 6.11 |
ENSRNOT00000022117
|
Galnt1
|
polypeptide N-acetylgalactosaminyltransferase 1 |
| chr17_-_69404323 | 6.00 |
ENSRNOT00000051342
ENSRNOT00000066282 |
Akr1c2
|
aldo-keto reductase family 1, member C2 |
| chr7_-_12432130 | 5.87 |
ENSRNOT00000077301
|
Atp5d
|
ATP synthase, H+ transporting, mitochondrial F1 complex, delta subunit |
| chr14_+_17210733 | 5.47 |
ENSRNOT00000003075
|
Cxcl10
|
C-X-C motif chemokine ligand 10 |
| chr12_-_29919320 | 5.42 |
ENSRNOT00000038092
|
Tyw1
|
tRNA-yW synthesizing protein 1 homolog |
| chr12_-_38916237 | 5.18 |
ENSRNOT00000074517
|
Tmem120b
|
transmembrane protein 120B |
| chr16_-_69176036 | 4.50 |
ENSRNOT00000018369
|
Prosc
|
proline synthetase co-transcribed homolog (bacterial) |
| chr9_-_86103158 | 4.35 |
ENSRNOT00000021528
|
Cul3
|
cullin 3 |
| chrX_-_31013030 | 4.31 |
ENSRNOT00000004451
|
AABR07037798.1
|
|
| chr4_-_161658519 | 4.21 |
ENSRNOT00000007634
ENSRNOT00000067895 |
Tulp3
|
tubby-like protein 3 |
| chr2_+_149843282 | 4.14 |
ENSRNOT00000074805
|
RGD1561998
|
similar to hypothetical protein C130079G13 |
| chr7_+_44009069 | 4.06 |
ENSRNOT00000005523
|
Mgat4c
|
MGAT4 family, member C |
| chr5_+_36566783 | 4.05 |
ENSRNOT00000077650
|
Fbxl4
|
F-box and leucine-rich repeat protein 4 |
| chr11_-_71135493 | 3.91 |
ENSRNOT00000050535
|
Fyttd1
|
forty-two-three domain containing 1 |
| chr12_+_46869836 | 3.91 |
ENSRNOT00000084421
|
Sirt4
|
sirtuin 4 |
| chr4_-_161850875 | 3.88 |
ENSRNOT00000009467
|
Pzp
|
pregnancy-zone protein |
| chr3_-_102432479 | 3.82 |
ENSRNOT00000047270
|
Olr747
|
olfactory receptor 747 |
| chr6_-_103616342 | 3.81 |
ENSRNOT00000008621
|
RGD1559921
|
similar to Macrophage migration inhibitory factor (MIF) (Delayed early response protein 6) |
| chr8_+_70952203 | 3.78 |
ENSRNOT00000019671
|
Mtfmt
|
mitochondrial methionyl-tRNA formyltransferase |
| chr13_-_34251942 | 3.50 |
ENSRNOT00000044095
|
Tsn
|
translin |
| chr1_+_116604550 | 3.46 |
ENSRNOT00000083587
|
Ube3a
|
ubiquitin protein ligase E3A |
| chr17_+_54181419 | 3.39 |
ENSRNOT00000023861
|
Kif5b
|
kinesin family member 5B |
| chr9_-_65442257 | 3.28 |
ENSRNOT00000037660
|
Fam126b
|
family with sequence similarity 126, member B |
| chr1_+_204959174 | 3.24 |
ENSRNOT00000023257
|
Zranb1
|
zinc finger RANBP2-type containing 1 |
| chr7_+_14865941 | 3.18 |
ENSRNOT00000066654
|
Cyp4f40
|
cytochrome P450, family 4, subfamily f, polypeptide 40 |
| chr6_+_99444013 | 3.17 |
ENSRNOT00000058642
|
Ppp1r36
|
protein phosphatase 1, regulatory subunit 36 |
| chr14_-_21909646 | 3.17 |
ENSRNOT00000088024
|
Csn1s2b
|
casein alpha s2-like B |
| chr15_-_6587367 | 3.16 |
ENSRNOT00000038449
|
Zfp385d
|
zinc finger protein 385D |
| chr1_+_51619875 | 3.14 |
ENSRNOT00000023319
|
Pabpc6
|
poly(A) binding protein, cytoplasmic 6 |
| chr16_-_50358809 | 3.11 |
ENSRNOT00000039331
|
Mtnr1a
|
melatonin receptor 1A |
| chr11_-_43099412 | 3.08 |
ENSRNOT00000002281
|
Gabrr3
|
gamma-aminobutyric acid type A receptor rho3 subunit |
| chr1_+_99398248 | 3.04 |
ENSRNOT00000072699
|
AABR07003230.1
|
|
| chr8_-_116993193 | 3.00 |
ENSRNOT00000026327
|
Dag1
|
dystroglycan 1 |
| chr15_+_10120206 | 2.96 |
ENSRNOT00000033048
|
Rarb
|
retinoic acid receptor, beta |
| chr14_+_85871597 | 2.95 |
ENSRNOT00000079671
|
Ankrd36
|
ankyrin repeat domain 36 |
| chr2_+_147496229 | 2.94 |
ENSRNOT00000022105
|
Tm4sf4
|
transmembrane 4 L six family member 4 |
| chr3_-_63211842 | 2.93 |
ENSRNOT00000008371
ENSRNOT00000050355 |
Pde11a
|
phosphodiesterase 11A |
| chr6_-_136436818 | 2.87 |
ENSRNOT00000082600
|
Ppp1r13b
|
protein phosphatase 1, regulatory subunit 13B |
| chr3_-_73636542 | 2.86 |
ENSRNOT00000074870
|
LOC100909831
|
olfactory receptor 8K3-like |
| chr3_-_145810834 | 2.85 |
ENSRNOT00000075429
|
LOC102555217
|
zinc finger protein 120-like |
| chr3_-_102773801 | 2.72 |
ENSRNOT00000047051
|
Olr767
|
olfactory receptor 767 |
| chr3_-_173371835 | 2.70 |
ENSRNOT00000073650
|
LOC102557590
|
zinc finger protein 709-like |
| chr2_-_154508877 | 2.68 |
ENSRNOT00000086472
|
RGD1565059
|
similar to hypothetical protein E130311K13 |
| chr3_-_74749960 | 2.59 |
ENSRNOT00000046197
|
Olr491
|
olfactory receptor 491 |
| chr20_-_43932361 | 2.51 |
ENSRNOT00000091030
|
Rfpl4b
|
ret finger protein-like 4B |
| chr1_-_170916059 | 2.49 |
ENSRNOT00000041974
|
Olr217
|
olfactory receptor 217 |
| chr8_-_18408179 | 2.41 |
ENSRNOT00000040032
|
AABR07069371.1
|
|
| chr7_-_9104719 | 2.41 |
ENSRNOT00000088247
|
LOC103692758
|
olfactory receptor 6C74-like |
| chr2_-_155381839 | 2.37 |
ENSRNOT00000057657
|
Vom2r47
|
vomeronasal 2 receptor, 47 |
| chr3_-_21904133 | 2.34 |
ENSRNOT00000090576
ENSRNOT00000087611 ENSRNOT00000066377 |
Strbp
|
spermatid perinuclear RNA binding protein |
| chr1_-_248898607 | 2.32 |
ENSRNOT00000074393
|
NEWGENE_1307313
|
dickkopf WNT signaling pathway inhibitor 1 |
| chr13_+_50873605 | 2.28 |
ENSRNOT00000004382
|
Fmod
|
fibromodulin |
| chr2_+_27630285 | 2.22 |
ENSRNOT00000032960
|
Ankrd31
|
ankyrin repeat domain 31 |
| chr16_-_75499012 | 2.17 |
ENSRNOT00000058039
|
Defa10
|
defensin alpha 10 |
| chr9_+_111597037 | 2.13 |
ENSRNOT00000021758
|
Fer
|
FER tyrosine kinase |
| chr19_+_22699808 | 2.12 |
ENSRNOT00000023169
|
RGD1308706
|
similar to RIKEN cDNA 4921524J17 |
| chr1_+_127604197 | 2.09 |
ENSRNOT00000018463
|
Lins1
|
lines homolog 1 |
| chr11_+_84827062 | 2.08 |
ENSRNOT00000058006
|
A930003A15Rik
|
RIKEN cDNA A930003A15 gene |
| chr12_+_48677905 | 2.07 |
ENSRNOT00000083196
|
1700069L16Rik
|
RIKEN cDNA 1700069L16 gene |
| chr2_+_46186105 | 2.05 |
ENSRNOT00000071256
|
LOC100910378
|
olfactory receptor 145-like |
| chr5_-_126323799 | 2.01 |
ENSRNOT00000089934
|
Mroh7
|
maestro heat-like repeat family member 7 |
| chr9_+_42945358 | 2.00 |
ENSRNOT00000059806
|
Fer1l5
|
fer-1-like family member 5 |
| chr3_-_76256129 | 1.98 |
ENSRNOT00000072741
|
LOC100912605
|
olfactory receptor 5D14-like |
| chr5_-_4975436 | 1.97 |
ENSRNOT00000062006
|
Xkr9
|
XK related 9 |
| chr17_-_39782860 | 1.96 |
ENSRNOT00000042298
|
Prl3d1
|
Prolactin family 3, subfamily d, member 1 |
| chr8_-_114010277 | 1.96 |
ENSRNOT00000045087
|
Atp2c1
|
ATPase secretory pathway Ca2+ transporting 1 |
| chr1_+_68436593 | 1.94 |
ENSRNOT00000080325
|
LOC108348118
|
leucyl-cystinyl aminopeptidase |
| chr2_+_93712992 | 1.94 |
ENSRNOT00000059326
|
Fabp12
|
fatty acid binding protein 12 |
| chr1_+_95397991 | 1.93 |
ENSRNOT00000039649
|
Zfp939
|
zinc finger protein 939 |
| chr3_-_55951584 | 1.92 |
ENSRNOT00000036585
|
Fastkd1
|
FAST kinase domains 1 |
| chr9_+_26841299 | 1.89 |
ENSRNOT00000016664
|
Il17a
|
interleukin 17A |
| chr12_-_29958050 | 1.85 |
ENSRNOT00000058725
|
Tmem248
|
transmembrane protein 248 |
| chr2_-_154508641 | 1.84 |
ENSRNOT00000065346
|
RGD1565059
|
similar to hypothetical protein E130311K13 |
| chr4_+_167017816 | 1.84 |
ENSRNOT00000055734
|
Tas2r145
|
taste receptor, type 2, member 145 |
| chr2_-_115307494 | 1.78 |
ENSRNOT00000072964
|
LOC100910294
|
olfactory receptor 8D1-like |
| chr1_-_172943853 | 1.72 |
ENSRNOT00000047040
|
Olr278
|
olfactory receptor 278 |
| chr13_+_92504374 | 1.69 |
ENSRNOT00000033697
|
Olr1602
|
olfactory receptor 1602 |
| chr2_+_41467064 | 1.68 |
ENSRNOT00000073231
|
AABR07008066.2
|
|
| chr17_-_42926523 | 1.68 |
ENSRNOT00000022512
|
Prl3d4
|
prolactin family 3, subfamily d, member 4 |
| chr9_-_5329305 | 1.68 |
ENSRNOT00000078055
|
Slc5a7
|
solute carrier family 5 member 7 |
| chr4_+_14109864 | 1.65 |
ENSRNOT00000076349
|
RGD1565355
|
similar to fatty acid translocase/CD36 |
| chr3_+_102947730 | 1.63 |
ENSRNOT00000071260
|
Olr773
|
olfactory receptor 773 |
| chr2_+_189857587 | 1.61 |
ENSRNOT00000048214
|
Ilf2
|
interleukin enhancer binding factor 2 |
| chr2_+_243701962 | 1.59 |
ENSRNOT00000016891
|
Adh4
|
alcohol dehydrogenase 4 (class II), pi polypeptide |
| chr8_+_17928358 | 1.59 |
ENSRNOT00000029911
|
Mbd3l2
|
methyl-CpG binding domain protein 3-like 2 |
| chr7_-_139953999 | 1.57 |
ENSRNOT00000051304
|
Olr1105
|
olfactory receptor 1105 |
| chr7_+_16394354 | 1.54 |
ENSRNOT00000041157
|
Olr1058
|
olfactory receptor 1058 |
| chr1_-_71710374 | 1.51 |
ENSRNOT00000078556
ENSRNOT00000046152 |
Nlrp4
|
NLR family, pyrin domain containing 4 |
| chrX_+_45614888 | 1.40 |
ENSRNOT00000058473
|
LOC100909677
|
uncharacterized LOC100909677 |
| chr2_-_210454737 | 1.38 |
ENSRNOT00000079993
|
Ahcyl1
|
adenosylhomocysteinase-like 1 |
| chr20_-_9291610 | 1.38 |
ENSRNOT00000000650
|
Glo1
|
glyoxalase 1 |
| chr1_-_173456488 | 1.37 |
ENSRNOT00000044753
|
Olr282
|
olfactory receptor 282 |
| chr4_-_179339795 | 1.31 |
ENSRNOT00000080410
|
Bcat1
|
branched chain amino acid transaminase 1 |
| chr4_-_155690869 | 1.30 |
ENSRNOT00000012216
|
C3ar1
|
complement C3a receptor 1 |
| chrX_-_159244879 | 1.27 |
ENSRNOT00000030445
|
Map7d3
|
MAP7 domain containing 3 |
| chr1_-_149529350 | 1.24 |
ENSRNOT00000052226
|
Vom2r43
|
vomeronasal 2 receptor, 43 |
| chr10_+_36499361 | 1.23 |
ENSRNOT00000047984
|
Olr1407
|
olfactory receptor 1407 |
| chr1_+_229063714 | 1.22 |
ENSRNOT00000087526
|
Glyat
|
glycine-N-acyltransferase |
| chr1_+_62964901 | 1.19 |
ENSRNOT00000075013
|
LOC100365824
|
vomeronasal 2 receptor, 22-like |
| chr16_+_8737974 | 1.18 |
ENSRNOT00000064255
|
Ercc6
|
ERCC excision repair 6, chromatin remodeling factor |
| chr8_-_113689681 | 1.17 |
ENSRNOT00000056435
|
LOC688828
|
similar to Nucleoside diphosphate-linked moiety X motif 16 (Nudix motif 16) |
| chr20_+_4143321 | 1.16 |
ENSRNOT00000060366
|
Btnl2
|
butyrophilin-like 2 |
| chr2_-_118882562 | 1.16 |
ENSRNOT00000058860
|
Kcnmb3
|
potassium calcium-activated channel subfamily M regulatory beta subunit 3 |
| chr14_-_86333424 | 1.15 |
ENSRNOT00000083191
|
Nudcd3
|
NudC domain containing 3 |
| chr3_+_76468294 | 1.13 |
ENSRNOT00000037779
|
Olr619
|
olfactory receptor 619 |
| chr1_-_168283863 | 1.13 |
ENSRNOT00000021115
|
Olr80
|
olfactory receptor 80 |
| chr10_-_12434118 | 1.12 |
ENSRNOT00000074072
|
Olr1365
|
olfactory receptor 1365 |
| chr11_+_43340505 | 1.12 |
ENSRNOT00000043299
|
Olr1541
|
olfactory receptor 1541 |
| chr3_+_75970593 | 1.11 |
ENSRNOT00000075834
|
Olr592
|
olfactory receptor 592 |
| chr20_-_5140304 | 1.07 |
ENSRNOT00000092646
|
Prrc2a
|
proline-rich coiled-coil 2A |
| chr10_+_76320041 | 1.07 |
ENSRNOT00000037693
|
Coil
|
coilin |
| chr5_-_17399801 | 1.06 |
ENSRNOT00000011900
|
RGD1563405
|
similar to protein tyrosine phosphatase 4a2 |
| chr3_+_103556674 | 1.06 |
ENSRNOT00000050168
|
Olr792
|
olfactory receptor 792 |
| chr5_-_25721072 | 0.95 |
ENSRNOT00000021839
|
Tmem67
|
transmembrane protein 67 |
| chr4_-_165828814 | 0.91 |
ENSRNOT00000007481
|
Tas2r105
|
taste receptor, type 2, member 105 |
| chr14_+_22072024 | 0.87 |
ENSRNOT00000002680
|
ste2
|
estrogen sulfotransferase |
| chr1_+_68436917 | 0.83 |
ENSRNOT00000088586
|
LOC108348118
|
leucyl-cystinyl aminopeptidase |
| chr2_-_242828629 | 0.82 |
ENSRNOT00000043369
|
LOC499715
|
LRRGT00095 |
| chr4_-_13565838 | 0.81 |
ENSRNOT00000048882
|
Olr987
|
olfactory receptor 987 |
| chr3_-_74597393 | 0.76 |
ENSRNOT00000013201
|
Olr536
|
olfactory receptor 536 |
| chr1_+_220071811 | 0.72 |
ENSRNOT00000090642
|
AC126581.1
|
|
| chrX_+_92131209 | 0.71 |
ENSRNOT00000004462
|
Pabpc5
|
poly A binding protein, cytoplasmic 5 |
| chr4_+_72272809 | 0.69 |
ENSRNOT00000048987
|
Olr808
|
olfactory receptor 808 |
| chr17_+_69960160 | 0.66 |
ENSRNOT00000023887
|
Ucn3
|
urocortin 3 |
| chr6_-_51018050 | 0.65 |
ENSRNOT00000082691
|
Gpr22
|
G protein-coupled receptor 22 |
| chr14_-_21707280 | 0.65 |
ENSRNOT00000002669
|
Smr3a
|
submaxillary gland androgen regulated protein 3A |
| chr5_+_103251986 | 0.55 |
ENSRNOT00000008757
|
Cntln
|
centlein |
| chr10_+_36466229 | 0.55 |
ENSRNOT00000004865
|
Olr1404
|
olfactory receptor 1404 |
| chr13_+_98311827 | 0.52 |
ENSRNOT00000082844
|
Cdc42bpa
|
CDC42 binding protein kinase alpha |
| chr7_-_7311272 | 0.52 |
ENSRNOT00000040812
|
Olr1020
|
olfactory receptor 1020 |
| chr3_-_173944396 | 0.50 |
ENSRNOT00000079019
|
Sycp2
|
synaptonemal complex protein 2 |
| chr1_-_172465446 | 0.48 |
ENSRNOT00000088386
|
LOC103690410
|
olfactory receptor 484-like |
| chrX_-_80354604 | 0.47 |
ENSRNOT00000049790
|
RGD1562039
|
similar to MGC82337 protein |
| chr13_+_98231326 | 0.45 |
ENSRNOT00000003837
|
Cdc42bpa
|
CDC42 binding protein kinase alpha |
| chrX_-_105417323 | 0.45 |
ENSRNOT00000015494
|
Gla
|
galactosidase, alpha |
| chr7_-_5195955 | 0.44 |
ENSRNOT00000040141
|
Olr896
|
olfactory receptor 896 |
| chrX_-_124002073 | 0.39 |
ENSRNOT00000072249
|
LOC100364002
|
reproductive homeobox 9-like |
| chr15_-_4055539 | 0.38 |
ENSRNOT00000090352
|
Sec24c
|
SEC24 homolog C, COPII coat complex component |
| chr11_-_17340373 | 0.35 |
ENSRNOT00000089762
|
AABR07033324.1
|
|
| chr3_-_14571640 | 0.35 |
ENSRNOT00000060013
|
Ggta1l1
|
glycoprotein, alpha-galactosyltransferase 1-like 1 |
| chr5_-_12199283 | 0.34 |
ENSRNOT00000007769
|
Pcmtd1
|
protein-L-isoaspartate (D-aspartate) O-methyltransferase domain containing 1 |
| chr1_+_116869957 | 0.32 |
ENSRNOT00000075203
|
Vom2r25
|
vomeronasal 2 receptor, 25 |
| chr8_-_17860348 | 0.31 |
ENSRNOT00000046875
|
Olr1118
|
olfactory receptor 1118 |
| chr17_+_1305016 | 0.31 |
ENSRNOT00000025965
|
Ercc6l2
|
ERCC excision repair 6 like 2 |
| chr2_+_9526209 | 0.29 |
ENSRNOT00000021818
|
Lysmd3
|
LysM domain containing 3 |
| chr2_+_190628525 | 0.27 |
ENSRNOT00000023564
|
S100vp
|
S100 calcium-binding protein, ventral prostate |
| chr16_+_70644474 | 0.25 |
ENSRNOT00000045955
|
LOC100359503
|
ribosomal protein S28-like |
| chr3_-_76187045 | 0.24 |
ENSRNOT00000075650
|
LOC686683
|
similar to olfactory receptor 73 |
| chr3_-_75576520 | 0.24 |
ENSRNOT00000083330
|
Olr567
|
olfactory receptor 567 |
| chr1_-_185569190 | 0.23 |
ENSRNOT00000090773
|
RGD1311703
|
similar to sid2057p |
| chr12_-_40332612 | 0.12 |
ENSRNOT00000001691
|
Atxn2
|
ataxin 2 |
| chr8_+_59420123 | 0.11 |
ENSRNOT00000077922
|
Ireb2
|
iron responsive element binding protein 2 |
| chr5_-_56753832 | 0.08 |
ENSRNOT00000073045
|
Sec61gl
|
SEC61 gamma subunit-like |
| chr13_+_76942928 | 0.05 |
ENSRNOT00000040505
|
Rfwd2
|
ring finger and WD repeat domain 2 |
| chr3_-_77605962 | 0.04 |
ENSRNOT00000090062
|
Olr665
|
olfactory receptor 665 |
| chrY_-_1398030 | 0.01 |
ENSRNOT00000088719
|
Usp9y
|
ubiquitin specific peptidase 9, Y-linked |
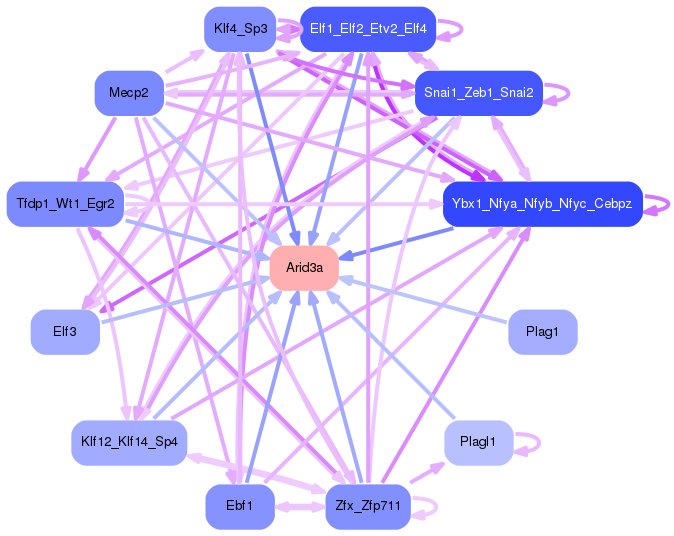
Network of associatons between targets according to the STRING database.

First level regulatory network of Arid3a
Gene Ontology Analysis
Gene overrepresentation in biological process category:
| Log-likelihood per target | Total log-likelihood | Term | Description |
|---|---|---|---|
| 6.6 | 19.8 | GO:1901856 | negative regulation of cellular respiration(GO:1901856) |
| 3.2 | 22.2 | GO:0060075 | regulation of resting membrane potential(GO:0060075) |
| 2.9 | 8.7 | GO:0006435 | threonyl-tRNA aminoacylation(GO:0006435) |
| 2.9 | 11.5 | GO:0098964 | dendritic transport of ribonucleoprotein complex(GO:0098961) dendritic transport of messenger ribonucleoprotein complex(GO:0098963) anterograde dendritic transport of messenger ribonucleoprotein complex(GO:0098964) |
| 2.8 | 11.3 | GO:0016080 | synaptic vesicle targeting(GO:0016080) |
| 2.6 | 7.7 | GO:0090247 | cell motility involved in somitogenic axis elongation(GO:0090247) regulation of cell motility involved in somitogenic axis elongation(GO:0090249) |
| 2.4 | 25.9 | GO:0046710 | GDP metabolic process(GO:0046710) |
| 2.1 | 8.4 | GO:0072318 | clathrin coat disassembly(GO:0072318) |
| 2.0 | 6.0 | GO:0071395 | response to jasmonic acid(GO:0009753) cellular response to jasmonic acid stimulus(GO:0071395) |
| 1.8 | 5.5 | GO:1901740 | negative regulation of myoblast fusion(GO:1901740) |
| 1.6 | 6.5 | GO:0070213 | protein auto-ADP-ribosylation(GO:0070213) |
| 1.5 | 6.2 | GO:2000157 | regulation of protein K48-linked deubiquitination(GO:1903093) negative regulation of protein K48-linked deubiquitination(GO:1903094) negative regulation of ubiquitin-specific protease activity(GO:2000157) |
| 1.2 | 6.1 | GO:0018243 | protein O-linked glycosylation via serine(GO:0018242) protein O-linked glycosylation via threonine(GO:0018243) |
| 1.1 | 4.4 | GO:0001831 | trophectodermal cellular morphogenesis(GO:0001831) |
| 1.1 | 3.2 | GO:1990168 | protein deubiquitination involved in ubiquitin-dependent protein catabolic process(GO:0071947) protein K33-linked deubiquitination(GO:1990168) |
| 1.1 | 3.2 | GO:0042360 | leukotriene catabolic process(GO:0036100) leukotriene B4 catabolic process(GO:0036101) leukotriene B4 metabolic process(GO:0036102) vitamin E metabolic process(GO:0042360) icosanoid catabolic process(GO:1901523) fatty acid derivative catabolic process(GO:1901569) |
| 0.9 | 15.2 | GO:0010248 | establishment or maintenance of transmembrane electrochemical gradient(GO:0010248) |
| 0.8 | 4.2 | GO:0021914 | negative regulation of smoothened signaling pathway involved in ventral spinal cord patterning(GO:0021914) |
| 0.8 | 11.2 | GO:2001214 | positive regulation of vasculogenesis(GO:2001214) |
| 0.8 | 13.6 | GO:0007183 | SMAD protein complex assembly(GO:0007183) |
| 0.7 | 10.8 | GO:0045821 | positive regulation of glycolytic process(GO:0045821) |
| 0.7 | 3.4 | GO:0035617 | stress granule disassembly(GO:0035617) regulation of voltage-gated sodium channel activity(GO:1905150) |
| 0.7 | 2.0 | GO:0032472 | Golgi calcium ion transport(GO:0032472) |
| 0.7 | 3.9 | GO:1903215 | negative regulation of protein targeting to mitochondrion(GO:1903215) |
| 0.6 | 6.2 | GO:0043569 | negative regulation of insulin-like growth factor receptor signaling pathway(GO:0043569) |
| 0.5 | 2.1 | GO:0050904 | Kit signaling pathway(GO:0038109) diapedesis(GO:0050904) |
| 0.5 | 7.8 | GO:0002827 | positive regulation of T-helper 1 type immune response(GO:0002827) |
| 0.4 | 1.3 | GO:0009098 | branched-chain amino acid biosynthetic process(GO:0009082) leucine biosynthetic process(GO:0009098) valine biosynthetic process(GO:0009099) |
| 0.4 | 1.3 | GO:0002462 | tolerance induction to nonself antigen(GO:0002462) |
| 0.4 | 1.9 | GO:0032747 | positive regulation of interleukin-23 production(GO:0032747) |
| 0.4 | 7.1 | GO:0021860 | pyramidal neuron development(GO:0021860) |
| 0.4 | 3.0 | GO:0003406 | retinal pigment epithelium development(GO:0003406) |
| 0.3 | 1.7 | GO:0008292 | acetylcholine biosynthetic process(GO:0008292) acetate ester biosynthetic process(GO:1900620) |
| 0.3 | 3.0 | GO:0071679 | cytoskeletal anchoring at plasma membrane(GO:0007016) commissural neuron axon guidance(GO:0071679) |
| 0.3 | 1.6 | GO:0006069 | ethanol oxidation(GO:0006069) |
| 0.2 | 4.1 | GO:0038166 | angiotensin-activated signaling pathway(GO:0038166) |
| 0.2 | 6.4 | GO:0007413 | axonal fasciculation(GO:0007413) |
| 0.2 | 2.9 | GO:0046069 | cGMP catabolic process(GO:0046069) |
| 0.2 | 7.0 | GO:0000028 | ribosomal small subunit assembly(GO:0000028) |
| 0.2 | 18.4 | GO:0032088 | negative regulation of NF-kappaB transcription factor activity(GO:0032088) |
| 0.2 | 8.7 | GO:0007214 | gamma-aminobutyric acid signaling pathway(GO:0007214) |
| 0.2 | 5.9 | GO:0015985 | energy coupled proton transport, down electrochemical gradient(GO:0015985) ATP synthesis coupled proton transport(GO:0015986) |
| 0.2 | 1.2 | GO:0006362 | transcription elongation from RNA polymerase I promoter(GO:0006362) |
| 0.2 | 1.4 | GO:0009438 | methylglyoxal metabolic process(GO:0009438) |
| 0.2 | 3.5 | GO:0060736 | prostate gland growth(GO:0060736) |
| 0.1 | 3.1 | GO:0030828 | positive regulation of cGMP biosynthetic process(GO:0030828) |
| 0.1 | 2.2 | GO:0002227 | innate immune response in mucosa(GO:0002227) |
| 0.1 | 0.5 | GO:0090598 | male genitalia morphogenesis(GO:0048808) male anatomical structure morphogenesis(GO:0090598) |
| 0.1 | 1.7 | GO:0042976 | activation of Janus kinase activity(GO:0042976) |
| 0.1 | 2.3 | GO:0007638 | mechanosensory behavior(GO:0007638) |
| 0.1 | 6.3 | GO:0007157 | heterophilic cell-cell adhesion via plasma membrane cell adhesion molecules(GO:0007157) |
| 0.1 | 1.2 | GO:1900042 | positive regulation of interleukin-2 secretion(GO:1900042) |
| 0.1 | 0.9 | GO:0010826 | negative regulation of centrosome duplication(GO:0010826) negative regulation of centrosome cycle(GO:0046606) |
| 0.1 | 12.2 | GO:0008637 | apoptotic mitochondrial changes(GO:0008637) |
| 0.1 | 9.2 | GO:0008033 | tRNA processing(GO:0008033) |
| 0.1 | 1.2 | GO:0005513 | detection of calcium ion(GO:0005513) |
| 0.1 | 2.6 | GO:0050913 | sensory perception of bitter taste(GO:0050913) |
| 0.1 | 15.8 | GO:0006941 | striated muscle contraction(GO:0006941) |
| 0.1 | 1.0 | GO:0007097 | nuclear migration(GO:0007097) |
| 0.1 | 6.0 | GO:0072332 | intrinsic apoptotic signaling pathway by p53 class mediator(GO:0072332) |
| 0.1 | 8.2 | GO:0007368 | determination of left/right symmetry(GO:0007368) |
| 0.1 | 1.2 | GO:0006544 | glycine metabolic process(GO:0006544) |
| 0.1 | 3.9 | GO:0007566 | embryo implantation(GO:0007566) |
| 0.1 | 0.4 | GO:0046477 | glycosylceramide catabolic process(GO:0046477) |
| 0.1 | 2.0 | GO:0007520 | myoblast fusion(GO:0007520) |
| 0.1 | 0.6 | GO:0010457 | centriole-centriole cohesion(GO:0010457) |
| 0.1 | 2.3 | GO:0030199 | collagen fibril organization(GO:0030199) |
| 0.1 | 9.3 | GO:0031032 | actomyosin structure organization(GO:0031032) |
| 0.0 | 2.9 | GO:0042246 | tissue regeneration(GO:0042246) |
| 0.0 | 3.2 | GO:0010923 | negative regulation of phosphatase activity(GO:0010923) |
| 0.0 | 0.7 | GO:0045838 | positive regulation of membrane potential(GO:0045838) |
| 0.0 | 8.3 | GO:0006790 | sulfur compound metabolic process(GO:0006790) |
| 0.0 | 3.1 | GO:1902476 | chloride transmembrane transport(GO:1902476) |
| 0.0 | 43.3 | GO:0050911 | detection of chemical stimulus involved in sensory perception of smell(GO:0050911) |
| 0.0 | 6.8 | GO:0017157 | regulation of exocytosis(GO:0017157) |
| 0.0 | 30.6 | GO:0055114 | oxidation-reduction process(GO:0055114) |
| 0.0 | 5.2 | GO:0051291 | protein heterooligomerization(GO:0051291) |
| 0.0 | 0.3 | GO:0030259 | lipid glycosylation(GO:0030259) |
| 0.0 | 0.1 | GO:0002091 | negative regulation of receptor internalization(GO:0002091) |
| 0.0 | 1.3 | GO:0046785 | microtubule polymerization(GO:0046785) |
| 0.0 | 2.3 | GO:0030178 | negative regulation of Wnt signaling pathway(GO:0030178) |
| 0.0 | 4.5 | GO:0051090 | regulation of sequence-specific DNA binding transcription factor activity(GO:0051090) |
| 0.0 | 8.3 | GO:0045596 | negative regulation of cell differentiation(GO:0045596) |
| 0.0 | 9.8 | GO:0016567 | protein ubiquitination(GO:0016567) |
| 0.0 | 0.1 | GO:0010040 | response to iron(II) ion(GO:0010040) |
| 0.0 | 10.1 | GO:0006629 | lipid metabolic process(GO:0006629) |
Gene overrepresentation in cellular component category:
| Log-likelihood per target | Total log-likelihood | Term | Description |
|---|---|---|---|
| 6.1 | 30.7 | GO:0005927 | muscle tendon junction(GO:0005927) |
| 3.8 | 11.3 | GO:0044317 | rod spherule(GO:0044317) |
| 1.6 | 25.9 | GO:0044224 | juxtaparanode region of axon(GO:0044224) |
| 1.4 | 11.2 | GO:0031466 | Cul5-RING ubiquitin ligase complex(GO:0031466) |
| 1.3 | 15.2 | GO:0005890 | sodium:potassium-exchanging ATPase complex(GO:0005890) |
| 1.2 | 7.1 | GO:0097441 | basilar dendrite(GO:0097441) |
| 0.7 | 5.9 | GO:0045261 | mitochondrial proton-transporting ATP synthase complex, catalytic core F(1)(GO:0000275) proton-transporting ATP synthase complex, catalytic core F(1)(GO:0045261) |
| 0.7 | 6.2 | GO:0034098 | VCP-NPL4-UFD1 AAA ATPase complex(GO:0034098) |
| 0.6 | 4.4 | GO:0005827 | polar microtubule(GO:0005827) |
| 0.6 | 4.2 | GO:0030991 | intraciliary transport particle A(GO:0030991) |
| 0.5 | 11.5 | GO:1990124 | messenger ribonucleoprotein complex(GO:1990124) |
| 0.4 | 3.0 | GO:0016011 | dystroglycan complex(GO:0016011) |
| 0.3 | 15.5 | GO:0030964 | mitochondrial respiratory chain complex I(GO:0005747) NADH dehydrogenase complex(GO:0030964) respiratory chain complex I(GO:0045271) |
| 0.3 | 7.7 | GO:0000159 | protein phosphatase type 2A complex(GO:0000159) |
| 0.3 | 7.9 | GO:0000314 | organellar small ribosomal subunit(GO:0000314) mitochondrial small ribosomal subunit(GO:0005763) |
| 0.2 | 6.5 | GO:0071782 | endoplasmic reticulum tubular network(GO:0071782) |
| 0.2 | 3.4 | GO:0035253 | ciliary rootlet(GO:0035253) |
| 0.2 | 11.8 | GO:0034707 | chloride channel complex(GO:0034707) |
| 0.2 | 6.3 | GO:0032809 | neuronal cell body membrane(GO:0032809) |
| 0.2 | 12.2 | GO:0005811 | lipid particle(GO:0005811) |
| 0.2 | 1.1 | GO:0001674 | female germ cell nucleus(GO:0001674) |
| 0.1 | 10.5 | GO:0031901 | early endosome membrane(GO:0031901) |
| 0.1 | 6.5 | GO:0032580 | Golgi cisterna membrane(GO:0032580) |
| 0.1 | 40.2 | GO:0005743 | mitochondrial inner membrane(GO:0005743) |
| 0.1 | 4.0 | GO:0005758 | mitochondrial intermembrane space(GO:0005758) |
| 0.1 | 4.8 | GO:0005637 | nuclear inner membrane(GO:0005637) |
| 0.1 | 0.9 | GO:0036038 | MKS complex(GO:0036038) |
| 0.1 | 1.7 | GO:0045334 | clathrin-coated endocytic vesicle(GO:0045334) |
| 0.0 | 1.1 | GO:0005868 | cytoplasmic dynein complex(GO:0005868) |
| 0.0 | 61.2 | GO:0005739 | mitochondrion(GO:0005739) |
| 0.0 | 0.7 | GO:0043196 | varicosity(GO:0043196) |
| 0.0 | 8.0 | GO:0014069 | postsynaptic density(GO:0014069) |
| 0.0 | 5.1 | GO:0008021 | synaptic vesicle(GO:0008021) |
| 0.0 | 0.4 | GO:0030127 | COPII vesicle coat(GO:0030127) |
| 0.0 | 0.5 | GO:0000800 | lateral element(GO:0000800) |
| 0.0 | 1.2 | GO:0008023 | transcription elongation factor complex(GO:0008023) |
| 0.0 | 5.8 | GO:0043235 | receptor complex(GO:0043235) |
| 0.0 | 8.3 | GO:0005764 | lytic vacuole(GO:0000323) lysosome(GO:0005764) |
| 0.0 | 1.2 | GO:0008076 | voltage-gated potassium channel complex(GO:0008076) |
| 0.0 | 2.0 | GO:0030133 | transport vesicle(GO:0030133) |
| 0.0 | 1.0 | GO:0042641 | actomyosin(GO:0042641) |
| 0.0 | 2.1 | GO:0030027 | lamellipodium(GO:0030027) |
Gene overrepresentation in molecular function category:
| Log-likelihood per target | Total log-likelihood | Term | Description |
|---|---|---|---|
| 3.6 | 43.5 | GO:0004032 | alditol:NADP+ 1-oxidoreductase activity(GO:0004032) |
| 2.9 | 8.7 | GO:0004829 | threonine-tRNA ligase activity(GO:0004829) |
| 2.8 | 22.2 | GO:0022840 | leak channel activity(GO:0022840) narrow pore channel activity(GO:0022842) |
| 2.7 | 10.8 | GO:0045134 | uridine-diphosphatase activity(GO:0045134) |
| 2.6 | 25.9 | GO:0004385 | guanylate kinase activity(GO:0004385) |
| 1.9 | 7.8 | GO:0005143 | interleukin-12 receptor binding(GO:0005143) |
| 1.5 | 4.4 | GO:0031208 | POZ domain binding(GO:0031208) |
| 1.3 | 3.9 | GO:0047708 | biotinidase activity(GO:0047708) |
| 1.2 | 6.2 | GO:0036435 | K48-linked polyubiquitin binding(GO:0036435) |
| 1.2 | 8.3 | GO:0004065 | arylsulfatase activity(GO:0004065) |
| 1.1 | 5.5 | GO:0048248 | CXCR3 chemokine receptor binding(GO:0048248) |
| 1.1 | 15.2 | GO:0005391 | sodium:potassium-exchanging ATPase activity(GO:0005391) |
| 1.1 | 3.2 | GO:0052870 | leukotriene-B4 20-monooxygenase activity(GO:0050051) tocopherol omega-hydroxylase activity(GO:0052870) alpha-tocopherol omega-hydroxylase activity(GO:0052871) |
| 0.9 | 14.9 | GO:0051371 | muscle alpha-actinin binding(GO:0051371) |
| 0.8 | 3.4 | GO:0099609 | microtubule lateral binding(GO:0099609) |
| 0.8 | 6.2 | GO:0004035 | alkaline phosphatase activity(GO:0004035) |
| 0.8 | 3.9 | GO:0048403 | brain-derived neurotrophic factor binding(GO:0048403) |
| 0.6 | 11.3 | GO:0005522 | profilin binding(GO:0005522) |
| 0.6 | 3.1 | GO:0008502 | melatonin receptor activity(GO:0008502) |
| 0.6 | 7.5 | GO:0043024 | ribosomal small subunit binding(GO:0043024) |
| 0.6 | 6.1 | GO:0004653 | polypeptide N-acetylgalactosaminyltransferase activity(GO:0004653) |
| 0.6 | 13.8 | GO:0031489 | myosin V binding(GO:0031489) |
| 0.5 | 13.6 | GO:0005545 | 1-phosphatidylinositol binding(GO:0005545) |
| 0.5 | 8.7 | GO:0050811 | GABA receptor binding(GO:0050811) |
| 0.5 | 3.8 | GO:0016742 | hydroxymethyl-, formyl- and related transferase activity(GO:0016742) |
| 0.5 | 3.2 | GO:0035375 | zymogen binding(GO:0035375) |
| 0.4 | 1.3 | GO:0052656 | branched-chain-amino-acid transaminase activity(GO:0004084) L-leucine transaminase activity(GO:0052654) L-valine transaminase activity(GO:0052655) L-isoleucine transaminase activity(GO:0052656) |
| 0.4 | 12.2 | GO:0016645 | oxidoreductase activity, acting on the CH-NH group of donors(GO:0016645) |
| 0.4 | 2.9 | GO:0004118 | cGMP-stimulated cyclic-nucleotide phosphodiesterase activity(GO:0004118) |
| 0.4 | 3.0 | GO:0043237 | laminin-1 binding(GO:0043237) |
| 0.3 | 1.4 | GO:0016802 | adenosylhomocysteinase activity(GO:0004013) trialkylsulfonium hydrolase activity(GO:0016802) |
| 0.3 | 1.7 | GO:0015220 | choline transmembrane transporter activity(GO:0015220) |
| 0.3 | 6.5 | GO:0003950 | NAD+ ADP-ribosyltransferase activity(GO:0003950) |
| 0.3 | 5.9 | GO:0046933 | proton-transporting ATP synthase activity, rotational mechanism(GO:0046933) |
| 0.3 | 1.7 | GO:0005148 | prolactin receptor binding(GO:0005148) |
| 0.3 | 5.4 | GO:0010181 | FMN binding(GO:0010181) |
| 0.3 | 11.5 | GO:0051019 | mitogen-activated protein kinase binding(GO:0051019) |
| 0.3 | 7.1 | GO:0005452 | inorganic anion exchanger activity(GO:0005452) |
| 0.2 | 3.0 | GO:0003708 | retinoic acid receptor activity(GO:0003708) |
| 0.2 | 3.1 | GO:0008143 | poly(A) binding(GO:0008143) |
| 0.2 | 1.2 | GO:0047961 | glycine N-acyltransferase activity(GO:0047961) |
| 0.2 | 2.0 | GO:0005384 | manganese ion transmembrane transporter activity(GO:0005384) |
| 0.2 | 0.7 | GO:0051431 | corticotropin-releasing hormone receptor 2 binding(GO:0051431) |
| 0.2 | 2.1 | GO:0045295 | gamma-catenin binding(GO:0045295) |
| 0.2 | 10.5 | GO:0005544 | calcium-dependent phospholipid binding(GO:0005544) |
| 0.1 | 3.2 | GO:0070530 | K63-linked polyubiquitin binding(GO:0070530) |
| 0.1 | 3.1 | GO:0004890 | GABA-A receptor activity(GO:0004890) |
| 0.1 | 1.8 | GO:0033038 | bitter taste receptor activity(GO:0033038) |
| 0.1 | 2.8 | GO:0070006 | metalloaminopeptidase activity(GO:0070006) |
| 0.1 | 12.8 | GO:0005200 | structural constituent of cytoskeleton(GO:0005200) |
| 0.1 | 1.3 | GO:0004875 | complement receptor activity(GO:0004875) |
| 0.1 | 1.4 | GO:0016846 | carbon-sulfur lyase activity(GO:0016846) |
| 0.1 | 0.9 | GO:0008527 | taste receptor activity(GO:0008527) |
| 0.1 | 0.3 | GO:0047276 | N-acetyllactosaminide 3-alpha-galactosyltransferase activity(GO:0047276) |
| 0.1 | 8.3 | GO:0030674 | protein binding, bridging(GO:0030674) |
| 0.1 | 0.9 | GO:0051787 | misfolded protein binding(GO:0051787) |
| 0.1 | 13.5 | GO:0061630 | ubiquitin protein ligase activity(GO:0061630) |
| 0.1 | 1.2 | GO:0030296 | protein tyrosine kinase activator activity(GO:0030296) |
| 0.1 | 0.4 | GO:0016936 | galactoside binding(GO:0016936) |
| 0.1 | 4.0 | GO:0003725 | double-stranded RNA binding(GO:0003725) |
| 0.0 | 3.2 | GO:0002039 | p53 binding(GO:0002039) |
| 0.0 | 1.2 | GO:0015269 | calcium-activated potassium channel activity(GO:0015269) |
| 0.0 | 43.3 | GO:0004984 | olfactory receptor activity(GO:0004984) |
| 0.0 | 1.1 | GO:0015036 | disulfide oxidoreductase activity(GO:0015036) |
| 0.0 | 0.1 | GO:0030350 | iron-responsive element binding(GO:0030350) |
| 0.0 | 4.1 | GO:0016758 | transferase activity, transferring hexosyl groups(GO:0016758) |
| 0.0 | 0.1 | GO:0050692 | DBD domain binding(GO:0050692) |
| 0.0 | 4.2 | GO:0035091 | phosphatidylinositol binding(GO:0035091) |
| 0.0 | 4.0 | GO:0004842 | ubiquitin-protein transferase activity(GO:0004842) |
| 0.0 | 3.2 | GO:0019902 | phosphatase binding(GO:0019902) |
| 0.0 | 2.0 | GO:0005179 | hormone activity(GO:0005179) |
Gene overrepresentation in curated gene sets: canonical pathways category:
| Log-likelihood per target | Total log-likelihood | Term | Description |
|---|---|---|---|
| 0.4 | 3.0 | ST PAC1 RECEPTOR PATHWAY | PAC1 Receptor Pathway |
| 0.2 | 9.7 | PID IL23 PATHWAY | IL23-mediated signaling events |
| 0.2 | 4.4 | PID WNT CANONICAL PATHWAY | Canonical Wnt signaling pathway |
| 0.2 | 2.9 | SIG IL4RECEPTOR IN B LYPHOCYTES | Genes related to IL4 rceptor signaling in B lymphocytes |
| 0.1 | 9.8 | PID TGFBR PATHWAY | TGF-beta receptor signaling |
| 0.1 | 5.5 | PID CXCR3 PATHWAY | CXCR3-mediated signaling events |
| 0.1 | 5.5 | PID HDAC CLASSI PATHWAY | Signaling events mediated by HDAC Class I |
| 0.1 | 3.0 | PID RETINOIC ACID PATHWAY | Retinoic acid receptors-mediated signaling |
| 0.1 | 10.5 | NABA ECM AFFILIATED | Genes encoding proteins affiliated structurally or functionally to extracellular matrix proteins |
| 0.1 | 2.1 | PID KIT PATHWAY | Signaling events mediated by Stem cell factor receptor (c-Kit) |
| 0.1 | 8.1 | PID P53 DOWNSTREAM PATHWAY | Direct p53 effectors |
| 0.1 | 2.3 | NABA PROTEOGLYCANS | Genes encoding proteoglycans |
| 0.1 | 3.5 | PID TELOMERASE PATHWAY | Regulation of Telomerase |
| 0.0 | 6.2 | NABA ECM GLYCOPROTEINS | Genes encoding structural ECM glycoproteins |
| 0.0 | 1.4 | PID MYC ACTIV PATHWAY | Validated targets of C-MYC transcriptional activation |
| 0.0 | 1.0 | PID CDC42 PATHWAY | CDC42 signaling events |
Gene overrepresentation in curated gene sets: REACTOME pathways category:
| Log-likelihood per target | Total log-likelihood | Term | Description |
|---|---|---|---|
| 0.8 | 8.3 | REACTOME THE ACTIVATION OF ARYLSULFATASES | Genes involved in The activation of arylsulfatases |
| 0.4 | 8.7 | REACTOME MITOCHONDRIAL TRNA AMINOACYLATION | Genes involved in Mitochondrial tRNA aminoacylation |
| 0.4 | 11.0 | REACTOME DOWNREGULATION OF TGF BETA RECEPTOR SIGNALING | Genes involved in Downregulation of TGF-beta receptor signaling |
| 0.4 | 5.9 | REACTOME FORMATION OF ATP BY CHEMIOSMOTIC COUPLING | Genes involved in Formation of ATP by chemiosmotic coupling |
| 0.4 | 17.1 | REACTOME ION TRANSPORT BY P TYPE ATPASES | Genes involved in Ion transport by P-type ATPases |
| 0.4 | 8.4 | REACTOME LYSOSOME VESICLE BIOGENESIS | Genes involved in Lysosome Vesicle Biogenesis |
| 0.2 | 4.1 | REACTOME N GLYCAN ANTENNAE ELONGATION | Genes involved in N-Glycan antennae elongation |
| 0.2 | 6.3 | REACTOME ADHERENS JUNCTIONS INTERACTIONS | Genes involved in Adherens junctions interactions |
| 0.2 | 1.6 | REACTOME ETHANOL OXIDATION | Genes involved in Ethanol oxidation |
| 0.2 | 2.3 | REACTOME KERATAN SULFATE DEGRADATION | Genes involved in Keratan sulfate degradation |
| 0.2 | 4.1 | REACTOME CGMP EFFECTS | Genes involved in cGMP effects |
| 0.1 | 6.1 | REACTOME O LINKED GLYCOSYLATION OF MUCINS | Genes involved in O-linked glycosylation of mucins |
| 0.1 | 28.8 | REACTOME ANTIGEN PROCESSING UBIQUITINATION PROTEASOME DEGRADATION | Genes involved in Antigen processing: Ubiquitination & Proteasome degradation |
| 0.1 | 1.7 | REACTOME ACETYLCHOLINE NEUROTRANSMITTER RELEASE CYCLE | Genes involved in Acetylcholine Neurotransmitter Release Cycle |
| 0.1 | 3.4 | REACTOME KINESINS | Genes involved in Kinesins |
| 0.1 | 1.3 | REACTOME BRANCHED CHAIN AMINO ACID CATABOLISM | Genes involved in Branched-chain amino acid catabolism |
| 0.1 | 2.7 | REACTOME CHEMOKINE RECEPTORS BIND CHEMOKINES | Genes involved in Chemokine receptors bind chemokines |
| 0.0 | 1.2 | REACTOME RNA POL I TRANSCRIPTION INITIATION | Genes involved in RNA Polymerase I Transcription Initiation |
| 0.0 | 0.4 | REACTOME ANTIGEN PRESENTATION FOLDING ASSEMBLY AND PEPTIDE LOADING OF CLASS I MHC | Genes involved in Antigen Presentation: Folding, assembly and peptide loading of class I MHC |
| 0.0 | 0.4 | REACTOME GLYCOSPHINGOLIPID METABOLISM | Genes involved in Glycosphingolipid metabolism |
| 0.0 | 1.2 | REACTOME PHASE II CONJUGATION | Genes involved in Phase II conjugation |
| 0.0 | 1.3 | REACTOME PEPTIDE LIGAND BINDING RECEPTORS | Genes involved in Peptide ligand-binding receptors |