Project
GSE49485: Hypoxia transcriptome sequencing of rat brain.
Navigation
Downloads
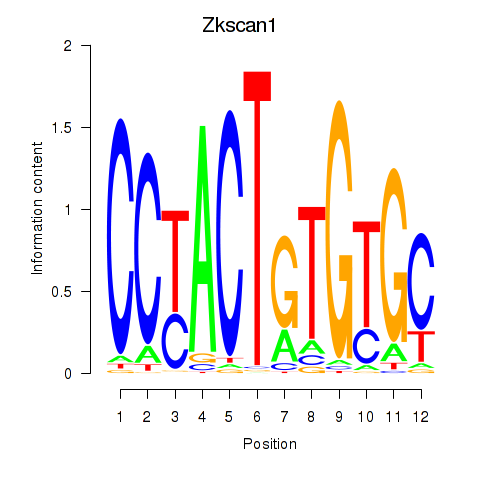
Results for Zkscan1
Z-value: 0.43
Motif logo
Transcription factors associated with Zkscan1
| Gene Symbol | Gene ID | Gene Info |
|---|---|---|
|
Zkscan1
|
ENSRNOG00000001335 | zinc finger with KRAB and SCAN domains 1 |
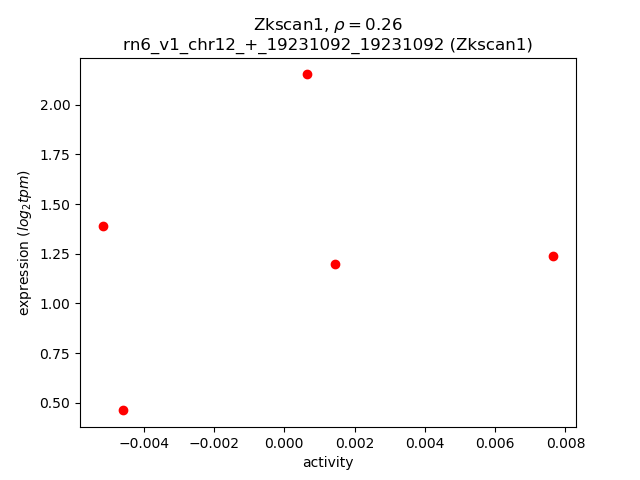
Activity-expression correlation:
| Gene | Promoter | Pearson corr. coef. | P-value | Plot |
|---|---|---|---|---|
| Zkscan1 | rn6_v1_chr12_+_19231092_19231092 | 0.26 | 6.7e-01 | Click! |
Activity profile of Zkscan1 motif
Sorted Z-values of Zkscan1 motif
| Promoter | Log-likelihood | Transcript | Gene | Gene Info |
|---|---|---|---|---|
| chr12_-_47987255 | 1.41 |
ENSRNOT00000074000
|
Ube3b
|
ubiquitin protein ligase E3B |
| chr14_+_1462358 | 0.31 |
ENSRNOT00000077243
|
Csf2ra
|
colony stimulating factor 2 receptor alpha subunit |
| chr2_-_187742747 | 0.25 |
ENSRNOT00000026530
|
Bglap
|
bone gamma-carboxyglutamate protein |
| chr2_+_198772937 | 0.18 |
ENSRNOT00000028812
|
Itga10
|
integrin subunit alpha 10 |
| chr7_-_119896925 | 0.14 |
ENSRNOT00000010609
|
Elfn2
|
extracellular leucine-rich repeat and fibronectin type III domain containing 2 |
| chr10_+_71278650 | 0.11 |
ENSRNOT00000092020
|
Synrg
|
synergin, gamma |
| chr8_+_116804451 | 0.11 |
ENSRNOT00000041402
|
Ip6k1
|
inositol hexakisphosphate kinase 1 |
| chr2_+_22427474 | 0.10 |
ENSRNOT00000061761
|
Mtx3
|
metaxin 3 |
| chrX_+_31140960 | 0.08 |
ENSRNOT00000084395
ENSRNOT00000004494 |
Mospd2
|
motile sperm domain containing 2 |
| chr7_-_123638702 | 0.08 |
ENSRNOT00000082473
ENSRNOT00000044470 ENSRNOT00000092017 |
Cyp2d1
|
cytochrome P450, family 2, subfamily d, polypeptide 1 |
| chr7_-_123767797 | 0.08 |
ENSRNOT00000012699
|
Tcf20
|
transcription factor 20 |
| chr8_-_115358046 | 0.08 |
ENSRNOT00000017607
|
Grm2
|
glutamate metabotropic receptor 2 |
| chr5_-_74366817 | 0.07 |
ENSRNOT00000076705
|
Ptpn3
|
protein tyrosine phosphatase, non-receptor type 3 |
| chr9_+_98668231 | 0.07 |
ENSRNOT00000027528
|
Asb1
|
ankyrin repeat and SOCS box-containing 1 |
| chr1_-_228755866 | 0.07 |
ENSRNOT00000083283
|
Dtx4
|
deltex E3 ubiquitin ligase 4 |
| chr3_-_10226286 | 0.07 |
ENSRNOT00000093627
|
Fubp3
|
far upstream element binding protein 3 |
| chr17_-_10818835 | 0.07 |
ENSRNOT00000091046
|
Cplx2
|
complexin 2 |
| chr3_+_95715193 | 0.07 |
ENSRNOT00000089525
|
Pax6
|
paired box 6 |
| chr4_+_57378069 | 0.07 |
ENSRNOT00000080173
ENSRNOT00000011851 |
Nrf1
|
nuclear respiratory factor 1 |
| chr13_+_90244681 | 0.06 |
ENSRNOT00000078162
|
Cd84
|
CD84 molecule |
| chr7_+_13039781 | 0.06 |
ENSRNOT00000067771
ENSRNOT00000090048 |
Mier2
|
mesoderm induction early response 1, family member 2 |
| chr12_-_52644260 | 0.06 |
ENSRNOT00000073986
|
Plcxd1
|
phosphatidylinositol-specific phospholipase C, X domain containing 1 |
| chr1_+_203971152 | 0.06 |
ENSRNOT00000075540
|
Gpr26
|
G protein-coupled receptor 26 |
| chr17_+_20619324 | 0.06 |
ENSRNOT00000079788
|
AABR07027235.1
|
|
| chr17_+_70684539 | 0.06 |
ENSRNOT00000025700
|
Pfkfb3
|
6-phosphofructo-2-kinase/fructose-2,6-biphosphatase 3 |
| chr1_+_85438105 | 0.06 |
ENSRNOT00000048905
|
Supt5h
|
SPT5 homolog, DSIF elongation factor subunit |
| chr7_-_118840634 | 0.06 |
ENSRNOT00000031568
|
Apol11a
|
apolipoprotein L 11a |
| chr19_-_55257876 | 0.05 |
ENSRNOT00000017564
|
Cyba
|
cytochrome b-245 alpha chain |
| chr9_+_10305470 | 0.05 |
ENSRNOT00000072592
|
Nrtn
|
neurturin |
| chr1_+_219000844 | 0.05 |
ENSRNOT00000022486
|
Kmt5b
|
lysine methyltransferase 5B |
| chr16_+_71738718 | 0.05 |
ENSRNOT00000022097
|
Plekha2
|
pleckstrin homology domain containing A2 |
| chr7_-_141001993 | 0.05 |
ENSRNOT00000092068
|
Fmnl3
|
formin-like 3 |
| chr16_-_6404957 | 0.05 |
ENSRNOT00000048459
|
Cacna1d
|
calcium voltage-gated channel subunit alpha1 D |
| chr5_-_159602251 | 0.05 |
ENSRNOT00000011394
|
Necap2
|
NECAP endocytosis associated 2 |
| chr6_-_3254779 | 0.05 |
ENSRNOT00000061975
|
Cdkl4
|
cyclin-dependent kinase-like 4 |
| chr14_+_113202419 | 0.05 |
ENSRNOT00000004764
|
Efemp1
|
EGF-containing fibulin-like extracellular matrix protein 1 |
| chr5_-_137112927 | 0.05 |
ENSRNOT00000078302
|
Ptprf
|
protein tyrosine phosphatase, receptor type, F |
| chr7_-_119797098 | 0.05 |
ENSRNOT00000009994
|
Rac2
|
ras-related C3 botulinum toxin substrate 2 (rho family, small GTP binding protein Rac2) |
| chr7_-_12673659 | 0.05 |
ENSRNOT00000091650
ENSRNOT00000041277 ENSRNOT00000044865 |
Ptbp1
|
polypyrimidine tract binding protein 1 |
| chr3_-_80875817 | 0.04 |
ENSRNOT00000091265
|
Dgkz
|
diacylglycerol kinase zeta |
| chr1_+_251145253 | 0.04 |
ENSRNOT00000083555
ENSRNOT00000014979 |
Papss2
|
3'-phosphoadenosine 5'-phosphosulfate synthase 2 |
| chr6_+_26390689 | 0.04 |
ENSRNOT00000079762
ENSRNOT00000091528 |
Ift172
|
intraflagellar transport 172 |
| chr6_-_126582034 | 0.04 |
ENSRNOT00000010656
ENSRNOT00000080829 |
Itpk1
|
inositol-tetrakisphosphate 1-kinase |
| chr3_+_100787956 | 0.04 |
ENSRNOT00000073636
|
Bdnf
|
brain-derived neurotrophic factor |
| chr3_-_148312791 | 0.04 |
ENSRNOT00000091419
|
Bcl2l1
|
Bcl2-like 1 |
| chr17_+_15966234 | 0.04 |
ENSRNOT00000084304
|
Wnk2
|
WNK lysine deficient protein kinase 2 |
| chr5_+_151413382 | 0.04 |
ENSRNOT00000012626
|
Cd164l2
|
CD164 molecule like 2 |
| chr10_-_65424802 | 0.04 |
ENSRNOT00000018468
|
Traf4
|
Tnf receptor associated factor 4 |
| chr18_-_69944632 | 0.04 |
ENSRNOT00000047271
|
Mapk4
|
mitogen-activated protein kinase 4 |
| chr8_-_120446455 | 0.04 |
ENSRNOT00000085161
ENSRNOT00000042854 ENSRNOT00000037199 |
Arpp21
|
cAMP regulated phosphoprotein 21 |
| chr3_+_100787449 | 0.04 |
ENSRNOT00000078543
|
Bdnf
|
brain-derived neurotrophic factor |
| chr10_+_14248399 | 0.03 |
ENSRNOT00000077689
|
Spsb3
|
splA/ryanodine receptor domain and SOCS box containing 3 |
| chr1_+_61095171 | 0.03 |
ENSRNOT00000042702
|
Vom1r19
|
vomeronasal 1 receptor 19 |
| chr10_+_46722109 | 0.03 |
ENSRNOT00000032685
|
Drc3
|
dynein regulatory complex subunit 3 |
| chr15_-_12513931 | 0.03 |
ENSRNOT00000010103
|
Atxn7
|
ataxin 7 |
| chr3_-_148312420 | 0.03 |
ENSRNOT00000047416
ENSRNOT00000081272 |
Bcl2l1
|
Bcl2-like 1 |
| chr1_-_262014066 | 0.03 |
ENSRNOT00000087083
|
Hps1
|
HPS1, biogenesis of lysosomal organelles complex 3 subunit 1 |
| chr17_+_26785029 | 0.03 |
ENSRNOT00000022065
|
Eef1e1
|
eukaryotic translation elongation factor 1 epsilon 1 |
| chr4_-_85915099 | 0.03 |
ENSRNOT00000016182
|
Neurod6
|
neuronal differentiation 6 |
| chr6_+_108936664 | 0.03 |
ENSRNOT00000007298
|
Dlst
|
dihydrolipoamide S-succinyltransferase |
| chr1_-_204817080 | 0.03 |
ENSRNOT00000077956
|
Fam53b
|
family with sequence similarity 53, member B |
| chr19_-_38484611 | 0.02 |
ENSRNOT00000077960
|
Nfat5
|
nuclear factor of activated T-cells 5 |
| chr6_+_137184820 | 0.02 |
ENSRNOT00000073796
|
Adssl1
|
adenylosuccinate synthase like 1 |
| chr17_-_55346279 | 0.02 |
ENSRNOT00000025037
|
Svil
|
supervillin |
| chr13_-_82753438 | 0.02 |
ENSRNOT00000075948
|
Atp1b1
|
ATPase Na+/K+ transporting subunit beta 1 |
| chr6_+_69971227 | 0.02 |
ENSRNOT00000075349
|
Foxg1
|
forkhead box G1 |
| chr1_-_87147308 | 0.02 |
ENSRNOT00000027773
ENSRNOT00000089305 ENSRNOT00000090402 |
Actn4
|
actinin alpha 4 |
| chr14_-_45165207 | 0.02 |
ENSRNOT00000002960
|
Klf3
|
Kruppel like factor 3 |
| chr4_+_77554269 | 0.02 |
ENSRNOT00000037248
|
Zfp282
|
zinc finger protein 282 |
| chr15_+_18399733 | 0.01 |
ENSRNOT00000061158
|
Fam107a
|
family with sequence similarity 107, member A |
| chr7_+_18409147 | 0.01 |
ENSRNOT00000086336
ENSRNOT00000011849 |
Adamts10
|
ADAM metallopeptidase with thrombospondin type 1 motif, 10 |
| chr15_-_18695133 | 0.01 |
ENSRNOT00000012271
|
Abhd6
|
abhydrolase domain containing 6 |
| chr10_-_104718621 | 0.01 |
ENSRNOT00000011560
|
Fbf1
|
Fas binding factor 1 |
| chrX_-_1369384 | 0.01 |
ENSRNOT00000013745
|
Timp1
|
TIMP metallopeptidase inhibitor 1 |
| chr7_+_11545024 | 0.01 |
ENSRNOT00000073221
|
Slc39a3
|
solute carrier family 39 member 3 |
| chr3_-_151258580 | 0.01 |
ENSRNOT00000026120
|
Edem2
|
ER degradation enhancing alpha-mannosidase like protein 2 |
| chr11_+_82848853 | 0.01 |
ENSRNOT00000073743
|
Thpo
|
thrombopoietin |
| chr3_+_80362858 | 0.01 |
ENSRNOT00000021353
ENSRNOT00000086242 |
Lrp4
|
LDL receptor related protein 4 |
| chr8_-_62893087 | 0.01 |
ENSRNOT00000058490
|
Ccdc33
|
coiled-coil domain containing 33 |
| chr6_+_111642411 | 0.01 |
ENSRNOT00000016962
|
Adck1
|
aarF domain containing kinase 1 |
| chr2_-_219097619 | 0.01 |
ENSRNOT00000078806
|
Vcam1
|
vascular cell adhesion molecule 1 |
| chr7_+_12798868 | 0.01 |
ENSRNOT00000038553
|
Prss57
|
protease, serine, 57 |
| chr14_-_5378726 | 0.01 |
ENSRNOT00000002896
|
Lrrc8c
|
leucine rich repeat containing 8 family, member C |
| chr8_+_19888667 | 0.01 |
ENSRNOT00000078593
|
Zfp317
|
zinc finger protein 317 |
| chr10_-_98018014 | 0.01 |
ENSRNOT00000005367
|
Fam20a
|
FAM20A, golgi associated secretory pathway pseudokinase |
| chr6_+_136682126 | 0.01 |
ENSRNOT00000017454
|
Aspg
|
asparaginase |
| chr5_-_153252021 | 0.01 |
ENSRNOT00000023221
|
Tmem50a
|
transmembrane protein 50A |
| chr6_+_107999846 | 0.01 |
ENSRNOT00000058095
|
Ptgr2
|
prostaglandin reductase 2 |
| chr8_+_67295727 | 0.01 |
ENSRNOT00000020443
|
Anp32a
|
acidic nuclear phosphoprotein 32 family member A |
| chr1_-_219682287 | 0.01 |
ENSRNOT00000026092
|
Rhod
|
ras homolog family member D |
| chr16_-_62373253 | 0.00 |
ENSRNOT00000034325
|
Tex15
|
testis expressed 15, meiosis and synapsis associated |
| chr3_+_72134731 | 0.00 |
ENSRNOT00000083592
|
Ypel4
|
yippee-like 4 |
| chr3_-_59688692 | 0.00 |
ENSRNOT00000078752
|
Sp3
|
Sp3 transcription factor |
| chr5_-_128839433 | 0.00 |
ENSRNOT00000065280
|
Osbpl9
|
oxysterol binding protein-like 9 |
| chr6_-_102196138 | 0.00 |
ENSRNOT00000014132
|
Tmem229b
|
transmembrane protein 229B |
| chr2_-_30577218 | 0.00 |
ENSRNOT00000024674
|
Ocln
|
occludin |
| chr12_-_36587839 | 0.00 |
ENSRNOT00000001295
|
Bri3bp
|
Bri3 binding protein |
| chr3_+_152909189 | 0.00 |
ENSRNOT00000066341
|
Tgif2
|
TGFB-induced factor homeobox 2 |
| chr8_-_21995806 | 0.00 |
ENSRNOT00000028034
|
S1pr2
|
sphingosine-1-phosphate receptor 2 |
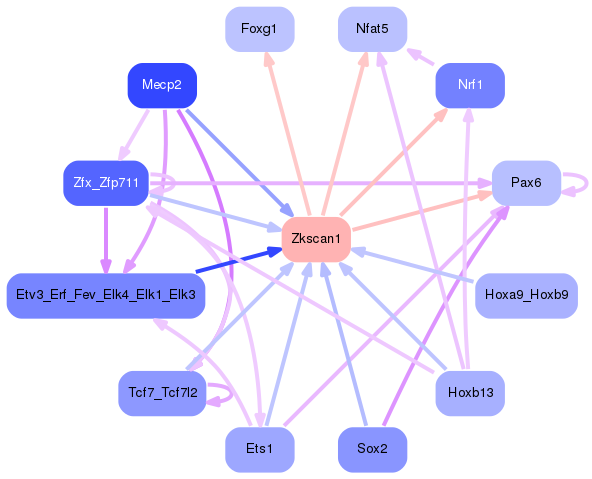
Network of associatons between targets according to the STRING database.

First level regulatory network of Zkscan1
Gene Ontology Analysis
Gene overrepresentation in biological process category:
| Log-likelihood per target | Total log-likelihood | Term | Description |
|---|---|---|---|
| 0.1 | 0.3 | GO:0038158 | granulocyte colony-stimulating factor signaling pathway(GO:0038158) |
| 0.0 | 0.3 | GO:0032571 | response to vitamin K(GO:0032571) |
| 0.0 | 0.1 | GO:1905217 | response to astaxanthin(GO:1905217) cellular response to astaxanthin(GO:1905218) |
| 0.0 | 0.1 | GO:0021918 | pancreatic A cell development(GO:0003322) forebrain-midbrain boundary formation(GO:0021905) somatic motor neuron fate commitment(GO:0021917) regulation of transcription from RNA polymerase II promoter involved in somatic motor neuron fate commitment(GO:0021918) sensory neuron migration(GO:1904937) |
| 0.0 | 0.1 | GO:1904844 | regulation of renal output by angiotensin(GO:0002019) response to L-glutamine(GO:1904844) cellular response to L-glutamine(GO:1904845) |
| 0.0 | 0.1 | GO:0032701 | negative regulation of interleukin-18 production(GO:0032701) |
| 0.0 | 0.1 | GO:0051045 | negative regulation of membrane protein ectodomain proteolysis(GO:0051045) |
Gene overrepresentation in cellular component category:
| Log-likelihood per target | Total log-likelihood | Term | Description |
|---|---|---|---|
| 0.0 | 0.1 | GO:0032044 | DSIF complex(GO:0032044) |
| 0.0 | 0.1 | GO:0070033 | synaptobrevin 2-SNAP-25-syntaxin-1a-complexin II complex(GO:0070033) |
| 0.0 | 0.1 | GO:0097136 | Bcl-2 family protein complex(GO:0097136) |
Gene overrepresentation in molecular function category:
| Log-likelihood per target | Total log-likelihood | Term | Description |
|---|---|---|---|
| 0.1 | 0.3 | GO:0051916 | granulocyte colony-stimulating factor binding(GO:0051916) |
| 0.0 | 0.1 | GO:0052723 | inositol hexakisphosphate 1-kinase activity(GO:0052723) inositol hexakisphosphate 3-kinase activity(GO:0052724) |
| 0.0 | 0.2 | GO:0098639 | collagen binding involved in cell-matrix adhesion(GO:0098639) |
| 0.0 | 0.1 | GO:0001641 | group II metabotropic glutamate receptor activity(GO:0001641) |
| 0.0 | 0.1 | GO:0042799 | histone methyltransferase activity (H4-K20 specific)(GO:0042799) |
| 0.0 | 0.0 | GO:0001069 | regulatory region RNA binding(GO:0001069) |
| 0.0 | 0.0 | GO:0004781 | adenylylsulfate kinase activity(GO:0004020) sulfate adenylyltransferase activity(GO:0004779) sulfate adenylyltransferase (ATP) activity(GO:0004781) |
| 0.0 | 0.0 | GO:0005006 | epidermal growth factor-activated receptor activity(GO:0005006) |
| 0.0 | 0.1 | GO:0051434 | BH3 domain binding(GO:0051434) |
| 0.0 | 0.0 | GO:0035373 | chondroitin sulfate proteoglycan binding(GO:0035373) |
Gene overrepresentation in curated gene sets: canonical pathways category:
| Log-likelihood per target | Total log-likelihood | Term | Description |
|---|---|---|---|
| 0.0 | 0.3 | PID INTEGRIN A9B1 PATHWAY | Alpha9 beta1 integrin signaling events |