Project
GSE49485: Hypoxia transcriptome sequencing of rat brain.
Navigation
Downloads
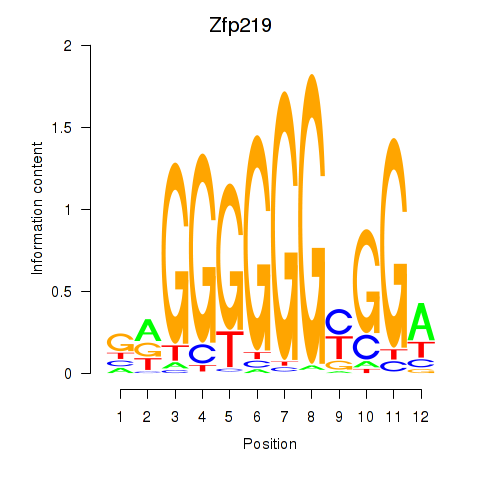
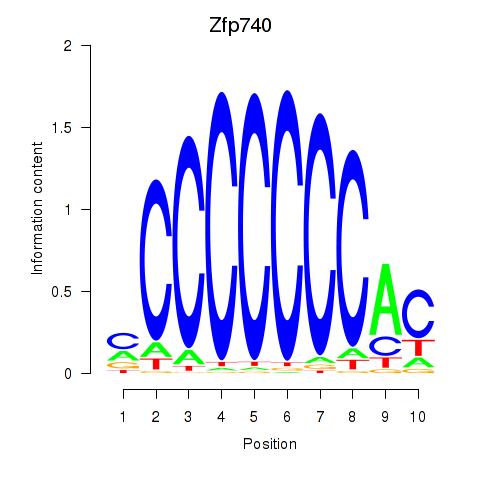
Results for Zfp219_Zfp740
Z-value: 0.61
Motif logo
Transcription factors associated with Zfp219_Zfp740
| Gene Symbol | Gene ID | Gene Info |
|---|---|---|
|
Zfp219
|
ENSRNOG00000011544 | zinc finger protein 219 |
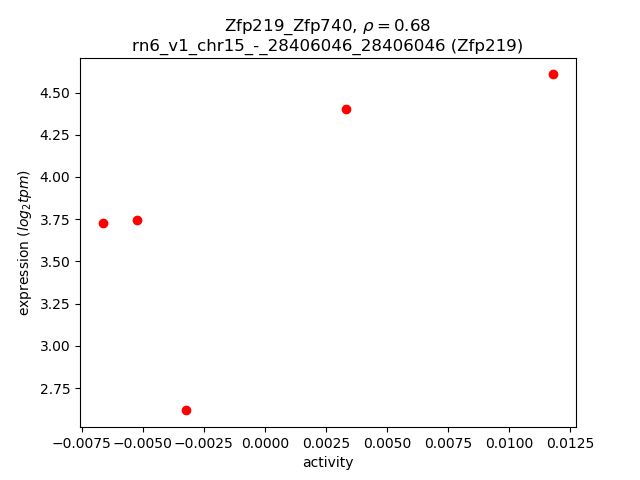
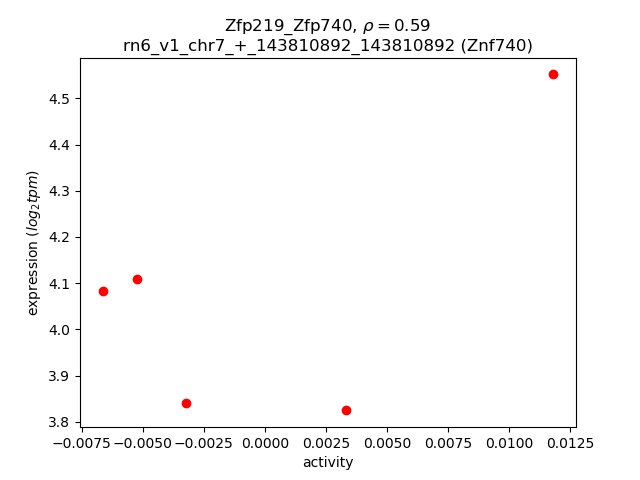
Activity-expression correlation:
| Gene | Promoter | Pearson corr. coef. | P-value | Plot |
|---|---|---|---|---|
| Zfp219 | rn6_v1_chr15_-_28406046_28406046 | 0.68 | 2.1e-01 | Click! |
| Znf740 | rn6_v1_chr7_+_143810892_143810892 | 0.59 | 2.9e-01 | Click! |
Activity profile of Zfp219_Zfp740 motif
Sorted Z-values of Zfp219_Zfp740 motif
| Promoter | Log-likelihood | Transcript | Gene | Gene Info |
|---|---|---|---|---|
| chr19_+_20607507 | 0.51 |
ENSRNOT00000000011
|
Cbln1
|
cerebellin 1 precursor |
| chr8_-_98738446 | 0.34 |
ENSRNOT00000019860
|
Zic1
|
Zic family member 1 |
| chr2_-_188718704 | 0.26 |
ENSRNOT00000028010
|
Zbtb7b
|
zinc finger and BTB domain containing 7B |
| chr20_-_5064469 | 0.23 |
ENSRNOT00000001120
|
Ly6g6d
|
lymphocyte antigen 6 complex, locus G6D |
| chr10_+_84152152 | 0.20 |
ENSRNOT00000010724
|
Hoxb5
|
homeo box B5 |
| chr6_-_146195819 | 0.18 |
ENSRNOT00000007625
|
Sp4
|
Sp4 transcription factor |
| chr12_-_9331195 | 0.17 |
ENSRNOT00000044134
|
Pan3
|
PAN3 poly(A) specific ribonuclease subunit |
| chr2_+_195996521 | 0.17 |
ENSRNOT00000082849
|
Pogz
|
pogo transposable element with ZNF domain |
| chr1_+_226435979 | 0.16 |
ENSRNOT00000048704
ENSRNOT00000036232 ENSRNOT00000035576 ENSRNOT00000036180 ENSRNOT00000036168 ENSRNOT00000047964 ENSRNOT00000036283 ENSRNOT00000007429 |
Syt7
|
synaptotagmin 7 |
| chr3_+_134413170 | 0.15 |
ENSRNOT00000074338
|
AABR07054000.1
|
|
| chr10_-_85684138 | 0.15 |
ENSRNOT00000017989
|
Pip4k2b
|
phosphatidylinositol-5-phosphate 4-kinase type 2 beta |
| chr5_-_60559533 | 0.15 |
ENSRNOT00000092899
|
Zbtb5
|
zinc finger and BTB domain containing 5 |
| chr18_-_5314511 | 0.15 |
ENSRNOT00000022637
ENSRNOT00000079682 |
Zfp521
|
zinc finger protein 521 |
| chr1_-_127599257 | 0.14 |
ENSRNOT00000018436
|
Asb7
|
ankyrin repeat and SOCS box-containing 7 |
| chr7_+_144052061 | 0.14 |
ENSRNOT00000020103
ENSRNOT00000091378 |
Amhr2
|
anti-Mullerian hormone receptor type 2 |
| chr17_-_20364714 | 0.14 |
ENSRNOT00000070962
|
Jarid2
|
jumonji and AT-rich interaction domain containing 2 |
| chr7_+_70364813 | 0.14 |
ENSRNOT00000084012
ENSRNOT00000031230 |
Agap2
|
ArfGAP with GTPase domain, ankyrin repeat and PH domain 2 |
| chr2_+_43266739 | 0.13 |
ENSRNOT00000087031
|
Mier3
|
mesoderm induction early response 1, family member 3 |
| chr3_-_60795951 | 0.13 |
ENSRNOT00000002174
|
Atf2
|
activating transcription factor 2 |
| chr16_+_20740826 | 0.13 |
ENSRNOT00000038057
|
Crtc1
|
CREB regulated transcription coactivator 1 |
| chr10_-_90240509 | 0.13 |
ENSRNOT00000028407
|
Atxn7l3
|
ataxin 7-like 3 |
| chr6_-_99783047 | 0.13 |
ENSRNOT00000009028
|
Sptb
|
spectrin, beta, erythrocytic |
| chr13_-_94355219 | 0.12 |
ENSRNOT00000005332
|
Pld5
|
phospholipase D family, member 5 |
| chr3_+_41019898 | 0.12 |
ENSRNOT00000007335
|
Kcnj3
|
potassium voltage-gated channel subfamily J member 3 |
| chr11_-_83926524 | 0.12 |
ENSRNOT00000041777
ENSRNOT00000040029 |
Eif4g1
|
eukaryotic translation initiation factor 4 gamma, 1 |
| chr5_-_137014375 | 0.12 |
ENSRNOT00000066165
ENSRNOT00000091866 |
Kdm4a
|
lysine demethylase 4A |
| chr5_-_60559329 | 0.12 |
ENSRNOT00000017046
|
Zbtb5
|
zinc finger and BTB domain containing 5 |
| chrX_+_71155601 | 0.11 |
ENSRNOT00000076453
ENSRNOT00000048521 |
Foxo4
|
forkhead box O4 |
| chr11_+_64601029 | 0.11 |
ENSRNOT00000004138
|
Arhgap31
|
Rho GTPase activating protein 31 |
| chr3_-_112789282 | 0.11 |
ENSRNOT00000090680
ENSRNOT00000066181 |
Ttbk2
|
tau tubulin kinase 2 |
| chr10_-_64657089 | 0.11 |
ENSRNOT00000080703
|
Abr
|
active BCR-related |
| chr1_+_154377447 | 0.11 |
ENSRNOT00000084268
ENSRNOT00000092086 ENSRNOT00000091470 ENSRNOT00000025415 |
Picalm
|
phosphatidylinositol binding clathrin assembly protein |
| chr10_-_56444847 | 0.10 |
ENSRNOT00000056872
ENSRNOT00000092662 |
Nlgn2
|
neuroligin 2 |
| chr7_-_118332577 | 0.10 |
ENSRNOT00000090370
|
Rbfox2
|
RNA binding protein, fox-1 homolog 2 |
| chr13_+_89524329 | 0.09 |
ENSRNOT00000004279
|
Mpz
|
myelin protein zero |
| chr6_+_110624856 | 0.09 |
ENSRNOT00000014017
|
Vash1
|
vasohibin 1 |
| chr10_+_86157608 | 0.09 |
ENSRNOT00000082668
ENSRNOT00000008256 |
Cdk12
|
cyclin-dependent kinase 12 |
| chr10_-_89084885 | 0.09 |
ENSRNOT00000027452
|
Plekhh3
|
pleckstrin homology, MyTH4 and FERM domain containing H3 |
| chr5_-_147375009 | 0.09 |
ENSRNOT00000009436
|
S100pbp
|
S100P binding protein |
| chr3_+_151126591 | 0.09 |
ENSRNOT00000025859
|
Myh7b
|
myosin heavy chain 7B |
| chr10_+_61685645 | 0.08 |
ENSRNOT00000003933
|
Mnt
|
MAX network transcriptional repressor |
| chr10_-_27179254 | 0.08 |
ENSRNOT00000004619
|
Gabrg2
|
gamma-aminobutyric acid type A receptor gamma 2 subunit |
| chr4_-_118472179 | 0.08 |
ENSRNOT00000023856
|
Mxd1
|
max dimerization protein 1 |
| chr15_+_46784963 | 0.08 |
ENSRNOT00000015540
|
Xkr6
|
XK related 6 |
| chr2_+_198303168 | 0.08 |
ENSRNOT00000056262
|
Mtmr11
|
myotubularin related protein 11 |
| chr1_+_198932870 | 0.08 |
ENSRNOT00000055003
|
Fbrs
|
fibrosin |
| chr2_+_187512164 | 0.08 |
ENSRNOT00000051394
|
Mef2d
|
myocyte enhancer factor 2D |
| chr10_+_23661013 | 0.07 |
ENSRNOT00000076664
|
Ebf1
|
early B-cell factor 1 |
| chr17_+_76532611 | 0.07 |
ENSRNOT00000024099
|
Camk1d
|
calcium/calmodulin-dependent protein kinase ID |
| chr10_-_110182291 | 0.07 |
ENSRNOT00000015178
ENSRNOT00000054936 |
Csnk1d
|
casein kinase 1, delta |
| chr1_-_174289647 | 0.07 |
ENSRNOT00000064902
|
St5
|
suppression of tumorigenicity 5 |
| chr5_-_82168347 | 0.07 |
ENSRNOT00000084959
ENSRNOT00000084147 |
Astn2
|
astrotactin 2 |
| chr10_-_64862268 | 0.07 |
ENSRNOT00000056234
|
Phf12
|
PHD finger protein 12 |
| chr10_+_56627411 | 0.07 |
ENSRNOT00000089108
ENSRNOT00000068493 |
Dlg4
|
discs large MAGUK scaffold protein 4 |
| chr1_-_64147251 | 0.07 |
ENSRNOT00000088502
|
Cnot3
|
CCR4-NOT transcription complex, subunit 3 |
| chr15_+_3936786 | 0.07 |
ENSRNOT00000066163
|
Camk2g
|
calcium/calmodulin-dependent protein kinase II gamma |
| chr18_+_27576129 | 0.07 |
ENSRNOT00000070930
|
Kdm3b
|
lysine demethylase 3B |
| chr20_+_4572100 | 0.06 |
ENSRNOT00000000476
|
Zbtb12
|
zinc finger and BTB domain containing 12 |
| chr7_-_119071712 | 0.06 |
ENSRNOT00000037611
|
Myh9l1
|
myosin heavy chain 9-like 1 |
| chr7_-_93502571 | 0.06 |
ENSRNOT00000077033
ENSRNOT00000076080 |
Samd12
|
sterile alpha motif domain containing 12 |
| chr1_-_126227469 | 0.06 |
ENSRNOT00000087332
|
Tjp1
|
tight junction protein 1 |
| chr10_+_89339029 | 0.06 |
ENSRNOT00000031208
|
Rundc1
|
RUN domain containing 1 |
| chr1_+_199196059 | 0.06 |
ENSRNOT00000090428
|
Fbxl19
|
F-box and leucine-rich repeat protein 19 |
| chr3_+_148510779 | 0.05 |
ENSRNOT00000012156
|
Xkr7
|
XK related 7 |
| chr11_-_71695000 | 0.05 |
ENSRNOT00000073550
|
Ubxn7
|
UBX domain protein 7 |
| chr4_-_77706994 | 0.05 |
ENSRNOT00000038517
|
Zfp777
|
zinc finger protein 777 |
| chr5_-_100647727 | 0.05 |
ENSRNOT00000067435
|
Nfib
|
nuclear factor I/B |
| chr5_+_151211342 | 0.05 |
ENSRNOT00000067939
|
Ahdc1
|
AT hook, DNA binding motif, containing 1 |
| chr1_+_40816107 | 0.05 |
ENSRNOT00000060767
|
Akap12
|
A-kinase anchoring protein 12 |
| chrX_+_80213332 | 0.05 |
ENSRNOT00000042827
|
Sh3bgrl
|
SH3 domain binding glutamate-rich protein like |
| chr6_-_27512287 | 0.05 |
ENSRNOT00000085937
ENSRNOT00000081278 ENSRNOT00000081323 |
Selenoi
|
selenoprotein I |
| chr1_+_199225100 | 0.05 |
ENSRNOT00000088606
|
Setd1a
|
SET domain containing 1A |
| chr15_+_52241801 | 0.05 |
ENSRNOT00000082639
|
Hr
|
HR, lysine demethylase and nuclear receptor corepressor |
| chr7_-_140546908 | 0.05 |
ENSRNOT00000077502
|
Kmt2d
|
lysine methyltransferase 2D |
| chr1_+_85112834 | 0.05 |
ENSRNOT00000026107
|
Dyrk1b
|
dual specificity tyrosine phosphorylation regulated kinase 1B |
| chr19_+_25181564 | 0.05 |
ENSRNOT00000008104
|
Rfx1
|
regulatory factor X1 |
| chr8_+_75625174 | 0.05 |
ENSRNOT00000013742
|
Ice2
|
interactor of little elongation complex ELL subunit 2 |
| chr7_-_70926903 | 0.05 |
ENSRNOT00000031005
|
Lrp1
|
LDL receptor related protein 1 |
| chr10_-_76039964 | 0.05 |
ENSRNOT00000003164
|
Msi2
|
musashi RNA-binding protein 2 |
| chr2_+_205553163 | 0.05 |
ENSRNOT00000039572
|
Nras
|
neuroblastoma RAS viral oncogene homolog |
| chr3_+_62481323 | 0.05 |
ENSRNOT00000078872
|
Hnrnpa3
|
heterogeneous nuclear ribonucleoprotein A3 |
| chr8_+_118821729 | 0.05 |
ENSRNOT00000028409
|
Setd2
|
SET domain containing 2 |
| chr3_+_120726906 | 0.04 |
ENSRNOT00000051069
|
Bcl2l11
|
BCL2 like 11 |
| chr3_+_108795235 | 0.04 |
ENSRNOT00000007028
|
Spred1
|
sprouty-related, EVH1 domain containing 1 |
| chr10_+_11206226 | 0.04 |
ENSRNOT00000006979
|
Tfap4
|
transcription factor AP-4 |
| chrX_-_15707436 | 0.04 |
ENSRNOT00000085907
|
Syp
|
synaptophysin |
| chr8_+_12823155 | 0.04 |
ENSRNOT00000011008
|
Sesn3
|
sestrin 3 |
| chr1_-_72339395 | 0.04 |
ENSRNOT00000021772
|
Zfp580
|
zinc finger protein 580 |
| chr2_+_113984824 | 0.04 |
ENSRNOT00000086399
|
Tnik
|
TRAF2 and NCK interacting kinase |
| chr7_+_78092037 | 0.04 |
ENSRNOT00000050753
|
Rims2
|
regulating synaptic membrane exocytosis 2 |
| chrX_-_142131545 | 0.04 |
ENSRNOT00000077402
|
Fgf13
|
fibroblast growth factor 13 |
| chr14_+_81819415 | 0.04 |
ENSRNOT00000018515
ENSRNOT00000075863 ENSRNOT00000077060 |
Mxd4
|
Max dimerization protein 4 |
| chr18_-_37776453 | 0.03 |
ENSRNOT00000087876
|
Dpysl3
|
dihydropyrimidinase-like 3 |
| chr2_-_189400323 | 0.03 |
ENSRNOT00000024364
|
Ubap2l
|
ubiquitin associated protein 2-like |
| chrX_-_63203643 | 0.03 |
ENSRNOT00000065194
ENSRNOT00000076974 |
Zfx
|
zinc finger protein X-linked |
| chr13_-_48400632 | 0.03 |
ENSRNOT00000074204
|
Avpr1b
|
arginine vasopressin receptor 1B |
| chr1_-_188895223 | 0.03 |
ENSRNOT00000032796
|
Gpr139
|
G protein-coupled receptor 139 |
| chr5_-_141242131 | 0.03 |
ENSRNOT00000081482
|
Macf1
|
microtubule-actin crosslinking factor 1 |
| chr13_+_52976507 | 0.03 |
ENSRNOT00000090599
ENSRNOT00000011324 |
Kif21b
|
kinesin family member 21B |
| chr14_+_4125380 | 0.03 |
ENSRNOT00000002882
|
Zfp644
|
zinc finger protein 644 |
| chr5_-_24560063 | 0.03 |
ENSRNOT00000037869
|
Dpy19l4
|
dpy-19-like 4 (C. elegans) |
| chr4_+_145017608 | 0.03 |
ENSRNOT00000066723
|
Setd5
|
SET domain containing 5 |
| chr18_+_28781349 | 0.03 |
ENSRNOT00000026112
|
Psd2
|
pleckstrin and Sec7 domain containing 2 |
| chr7_-_91538673 | 0.03 |
ENSRNOT00000006209
|
Rad21
|
RAD21 cohesin complex component |
| chr6_+_28235695 | 0.03 |
ENSRNOT00000047210
|
Dnmt3a
|
DNA methyltransferase 3 alpha |
| chr1_+_190671696 | 0.03 |
ENSRNOT00000084934
|
AABR07005633.1
|
|
| chr7_-_142132173 | 0.03 |
ENSRNOT00000026613
|
Csrnp2
|
cysteine and serine rich nuclear protein 2 |
| chr10_+_84955864 | 0.03 |
ENSRNOT00000038572
|
Sp6
|
Sp6 transcription factor |
| chr8_-_23084879 | 0.03 |
ENSRNOT00000018874
|
Zfp653
|
zinc finger protein 653 |
| chr7_-_143863186 | 0.03 |
ENSRNOT00000017096
|
Rarg
|
retinoic acid receptor, gamma |
| chr12_+_23151180 | 0.03 |
ENSRNOT00000059486
|
Cux1
|
cut-like homeobox 1 |
| chr12_-_22417980 | 0.03 |
ENSRNOT00000072208
|
Ephb4
|
EPH receptor B4 |
| chr3_-_80873887 | 0.03 |
ENSRNOT00000024280
|
Dgkz
|
diacylglycerol kinase zeta |
| chr3_+_33641616 | 0.02 |
ENSRNOT00000051953
|
Epc2
|
enhancer of polycomb homolog 2 |
| chr6_+_86651196 | 0.02 |
ENSRNOT00000034756
|
RGD1307621
|
hypothetical LOC314168 |
| chr7_-_70969905 | 0.02 |
ENSRNOT00000057745
|
Nab2
|
Ngfi-A binding protein 2 |
| chr16_+_3051449 | 0.02 |
ENSRNOT00000074069
|
Fam208a
|
family with sequence similarity 208, member A |
| chr14_+_60764409 | 0.02 |
ENSRNOT00000005168
|
Lgi2
|
leucine-rich repeat LGI family, member 2 |
| chr4_-_100099517 | 0.02 |
ENSRNOT00000014277
|
Atoh8
|
atonal bHLH transcription factor 8 |
| chr2_+_201289357 | 0.02 |
ENSRNOT00000067358
|
Tbx15
|
T-box 15 |
| chr13_+_110677810 | 0.02 |
ENSRNOT00000006340
|
Slc30a1
|
solute carrier family 30 member 1 |
| chr1_-_197919480 | 0.02 |
ENSRNOT00000068529
ENSRNOT00000080605 |
Atxn2l
|
ataxin 2-like |
| chr19_+_37600148 | 0.02 |
ENSRNOT00000023853
|
Ctcf
|
CCCTC-binding factor |
| chr10_+_56610051 | 0.02 |
ENSRNOT00000024348
|
Dvl2
|
dishevelled segment polarity protein 2 |
| chr1_+_82151669 | 0.02 |
ENSRNOT00000091357
|
Cic
|
capicua transcriptional repressor |
| chr10_+_94407559 | 0.02 |
ENSRNOT00000013046
|
Ddx42
|
DEAD-box helicase 42 |
| chr5_-_150609352 | 0.02 |
ENSRNOT00000074374
|
Phactr4
|
phosphatase and actin regulator 4 |
| chr10_+_84200880 | 0.02 |
ENSRNOT00000011213
|
Hoxb2
|
homeobox B2 |
| chr4_-_157486844 | 0.02 |
ENSRNOT00000038281
ENSRNOT00000022874 |
Cops7a
|
COP9 signalosome subunit 7A |
| chr5_-_151824633 | 0.02 |
ENSRNOT00000043959
|
Sfn
|
stratifin |
| chr10_+_74910713 | 0.02 |
ENSRNOT00000091619
|
Hsf5
|
heat shock transcription factor 5 |
| chr2_+_206392200 | 0.02 |
ENSRNOT00000026631
|
Rsbn1
|
round spermatid basic protein 1 |
| chr1_-_64405149 | 0.02 |
ENSRNOT00000089944
|
Cacng7
|
calcium voltage-gated channel auxiliary subunit gamma 7 |
| chr4_-_7252950 | 0.02 |
ENSRNOT00000084777
ENSRNOT00000087120 |
Agap3
|
ArfGAP with GTPase domain, ankyrin repeat and PH domain 3 |
| chrX_-_63204530 | 0.02 |
ENSRNOT00000076175
|
Zfx
|
zinc finger protein X-linked |
| chr13_+_89643881 | 0.02 |
ENSRNOT00000004735
|
B4galt3
|
beta-1,4-galactosyltransferase 3 |
| chr1_+_162549420 | 0.02 |
ENSRNOT00000037050
|
Rsf1
|
remodeling and spacing factor 1 |
| chr15_+_23665202 | 0.02 |
ENSRNOT00000089226
|
Samd4a
|
sterile alpha motif domain containing 4A |
| chr11_-_86793791 | 0.02 |
ENSRNOT00000044635
|
Arvcf
|
armadillo repeat gene deleted in velo-cardio-facial syndrome |
| chr7_-_12405022 | 0.02 |
ENSRNOT00000021648
|
Cirbp
|
cold inducible RNA binding protein |
| chr8_+_44990014 | 0.01 |
ENSRNOT00000044608
|
Hspa8
|
heat shock protein family A (Hsp70) member 8 |
| chr6_+_12253788 | 0.01 |
ENSRNOT00000061675
|
Ppp1r21
|
protein phosphatase 1, regulatory subunit 21 |
| chr17_-_77340934 | 0.01 |
ENSRNOT00000024697
|
Sephs1
|
selenophosphate synthetase 1 |
| chr1_-_88111293 | 0.01 |
ENSRNOT00000077195
|
Spred3
|
sprouty-related, EVH1 domain containing 3 |
| chr10_-_108150511 | 0.01 |
ENSRNOT00000073337
|
Cbx8
|
chromobox 8 |
| chr1_+_282265370 | 0.01 |
ENSRNOT00000015687
|
Grk5
|
G protein-coupled receptor kinase 5 |
| chr10_-_83888823 | 0.01 |
ENSRNOT00000055500
|
Ube2z
|
ubiquitin-conjugating enzyme E2Z |
| chr2_+_198040536 | 0.01 |
ENSRNOT00000028744
|
Anp32e
|
acidic nuclear phosphoprotein 32 family member E |
| chr1_+_103172987 | 0.01 |
ENSRNOT00000018688
|
Tmem86a
|
transmembrane protein 86A |
| chr5_+_144779681 | 0.01 |
ENSRNOT00000016493
|
LOC100294508
|
dyslexia susceptibility 2-like |
| chr3_-_93734282 | 0.01 |
ENSRNOT00000012428
|
Caprin1
|
cell cycle associated protein 1 |
| chr15_+_34493138 | 0.01 |
ENSRNOT00000089584
ENSRNOT00000027789 |
Nfatc4
|
nuclear factor of activated T-cells 4 |
| chr19_-_10358695 | 0.01 |
ENSRNOT00000019770
|
Katnb1
|
katanin regulatory subunit B1 |
| chr4_-_99546905 | 0.01 |
ENSRNOT00000077447
|
Kdm3a
|
lysine demethylase 3A |
| chr1_+_23977688 | 0.01 |
ENSRNOT00000014805
|
Tbpl1
|
TATA-box binding protein like 1 |
| chr5_-_100647298 | 0.01 |
ENSRNOT00000067538
ENSRNOT00000013092 |
Nfib
|
nuclear factor I/B |
| chr17_-_67904674 | 0.01 |
ENSRNOT00000078532
|
Klf6
|
Kruppel-like factor 6 |
| chr6_+_33786197 | 0.01 |
ENSRNOT00000082598
|
Pum2
|
pumilio RNA-binding family member 2 |
| chr14_+_113202419 | 0.01 |
ENSRNOT00000004764
|
Efemp1
|
EGF-containing fibulin-like extracellular matrix protein 1 |
| chr3_-_157099306 | 0.01 |
ENSRNOT00000022861
|
Chd6
|
chromodomain helicase DNA binding protein 6 |
| chr3_+_12262822 | 0.01 |
ENSRNOT00000022585
|
Angptl2
|
angiopoietin-like 2 |
| chr19_-_11669578 | 0.01 |
ENSRNOT00000026373
|
Gnao1
|
G protein subunit alpha o1 |
| chr18_-_14016713 | 0.01 |
ENSRNOT00000041125
|
Nol4
|
nucleolar protein 4 |
| chr2_-_188528127 | 0.01 |
ENSRNOT00000064715
ENSRNOT00000086683 |
Mtx1
|
Metaxin 1 |
| chr19_-_25220010 | 0.01 |
ENSRNOT00000008786
|
Dcaf15
|
DDB1 and CUL4 associated factor 15 |
| chr1_-_192025350 | 0.01 |
ENSRNOT00000071946
|
Ears2
|
glutamyl-tRNA synthetase 2, mitochondrial |
| chr1_+_100447998 | 0.01 |
ENSRNOT00000026259
|
Lrrc4b
|
leucine rich repeat containing 4B |
| chr6_-_107080524 | 0.01 |
ENSRNOT00000011662
|
Zfyve1
|
zinc finger FYVE-type containing 1 |
| chr17_+_36335804 | 0.01 |
ENSRNOT00000091334
|
E2f3
|
E2F transcription factor 3 |
| chr5_+_147661618 | 0.00 |
ENSRNOT00000011054
|
Bsdc1
|
BSD domain containing 1 |
| chr20_+_5125349 | 0.00 |
ENSRNOT00000085598
ENSRNOT00000001129 |
Bag6
|
BCL2-associated athanogene 6 |
| chr20_+_4355175 | 0.00 |
ENSRNOT00000000510
|
Gpsm3
|
G-protein signaling modulator 3 |
| chr9_+_82674202 | 0.00 |
ENSRNOT00000027208
|
Tmem198
|
transmembrane protein 198 |
| chr7_-_144966370 | 0.00 |
ENSRNOT00000083935
|
Zfp385a
|
zinc finger protein 385A |
| chrX_+_27015884 | 0.00 |
ENSRNOT00000065814
|
Msl3
|
male-specific lethal 3 homolog (Drosophila) |
| chr15_-_25505691 | 0.00 |
ENSRNOT00000074488
|
LOC100911492
|
homeobox protein OTX2-like |
| chr13_+_48607308 | 0.00 |
ENSRNOT00000063882
|
Slc41a1
|
solute carrier family 41 member 1 |
| chr6_-_95998529 | 0.00 |
ENSRNOT00000050138
|
Six4
|
SIX homeobox 4 |
| chr17_+_26808330 | 0.00 |
ENSRNOT00000022108
|
Bloc1s5
|
biogenesis of lysosomal organelles complex 1 subunit 5 |
| chr5_+_151741817 | 0.00 |
ENSRNOT00000081318
|
Kdf1
|
keratinocyte differentiation factor 1 |
| chr10_-_56409017 | 0.00 |
ENSRNOT00000020152
|
Fgf11
|
fibroblast growth factor 11 |
| chr13_+_73708815 | 0.00 |
ENSRNOT00000071482
ENSRNOT00000077874 ENSRNOT00000050734 |
Tor1aip2
Tor1aip2
|
torsin 1A interacting protein 2 torsin 1A interacting protein 2 |
| chr1_-_167347490 | 0.00 |
ENSRNOT00000076499
|
Rhog
|
ras homolog family member G |
| chr10_-_84915471 | 0.00 |
ENSRNOT00000087322
|
Sp2
|
Sp2 transcription factor |
| chr1_+_190852985 | 0.00 |
ENSRNOT00000040963
|
Polr3e
|
RNA polymerase III subunit E |
Network of associatons between targets according to the STRING database.

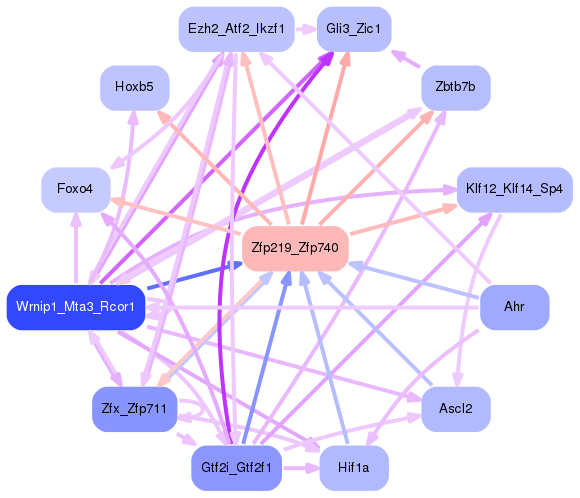
First level regulatory network of Zfp219_Zfp740
Gene Ontology Analysis
Gene overrepresentation in biological process category:
| Log-likelihood per target | Total log-likelihood | Term | Description |
|---|---|---|---|
| 0.1 | 0.2 | GO:1990926 | short-term synaptic potentiation(GO:1990926) |
| 0.0 | 0.1 | GO:0032915 | positive regulation of transforming growth factor beta2 production(GO:0032915) |
| 0.0 | 0.5 | GO:0021707 | cerebellar granular layer formation(GO:0021684) cerebellar granule cell differentiation(GO:0021707) |
| 0.0 | 0.1 | GO:0043314 | negative regulation of neutrophil degranulation(GO:0043314) |
| 0.0 | 0.1 | GO:0001966 | thigmotaxis(GO:0001966) |
| 0.0 | 0.1 | GO:1902630 | regulation of membrane hyperpolarization(GO:1902630) |
| 0.0 | 0.3 | GO:2001185 | regulation of CD8-positive, alpha-beta T cell activation(GO:2001185) |
| 0.0 | 0.1 | GO:1901491 | negative regulation of lymphangiogenesis(GO:1901491) |
| 0.0 | 0.2 | GO:0010606 | positive regulation of cytoplasmic mRNA processing body assembly(GO:0010606) |
| 0.0 | 0.1 | GO:1990573 | potassium ion import across plasma membrane(GO:1990573) |
| 0.0 | 0.1 | GO:1990785 | response to water-immersion restraint stress(GO:1990785) |
| 0.0 | 0.1 | GO:0021730 | trigeminal sensory nucleus development(GO:0021730) principal sensory nucleus of trigeminal nerve development(GO:0021740) |
| 0.0 | 0.0 | GO:0097198 | histone H3-K36 trimethylation(GO:0097198) |
| 0.0 | 0.1 | GO:1900113 | negative regulation of histone H3-K9 trimethylation(GO:1900113) |
| 0.0 | 0.1 | GO:0048104 | establishment of body hair or bristle planar orientation(GO:0048104) establishment of body hair planar orientation(GO:0048105) |
| 0.0 | 0.1 | GO:0051574 | positive regulation of histone H3-K9 methylation(GO:0051574) |
| 0.0 | 0.1 | GO:0010724 | regulation of definitive erythrocyte differentiation(GO:0010724) |
| 0.0 | 0.1 | GO:0098953 | receptor diffusion trapping(GO:0098953) postsynaptic neurotransmitter receptor diffusion trapping(GO:0098970) neurotransmitter receptor diffusion trapping(GO:0099628) |
| 0.0 | 0.0 | GO:1902963 | regulation of aspartic-type endopeptidase activity involved in amyloid precursor protein catabolic process(GO:1902959) positive regulation of aspartic-type endopeptidase activity involved in amyloid precursor protein catabolic process(GO:1902961) regulation of metalloendopeptidase activity involved in amyloid precursor protein catabolic process(GO:1902962) negative regulation of metalloendopeptidase activity involved in amyloid precursor protein catabolic process(GO:1902963) regulation of aspartic-type peptidase activity(GO:1905245) positive regulation of aspartic-type peptidase activity(GO:1905247) |
| 0.0 | 0.2 | GO:2000786 | positive regulation of autophagosome assembly(GO:2000786) |
| 0.0 | 0.0 | GO:2000474 | regulation of opioid receptor signaling pathway(GO:2000474) |
| 0.0 | 0.1 | GO:0051382 | kinetochore assembly(GO:0051382) |
| 0.0 | 0.1 | GO:0060267 | positive regulation of respiratory burst(GO:0060267) |
| 0.0 | 0.0 | GO:2000587 | negative regulation of platelet-derived growth factor receptor-beta signaling pathway(GO:2000587) |
| 0.0 | 0.1 | GO:0033601 | positive regulation of mammary gland epithelial cell proliferation(GO:0033601) |
| 0.0 | 0.1 | GO:2000507 | positive regulation of energy homeostasis(GO:2000507) |
| 0.0 | 0.0 | GO:1902263 | apoptotic process involved in embryonic digit morphogenesis(GO:1902263) |
Gene overrepresentation in cellular component category:
| Log-likelihood per target | Total log-likelihood | Term | Description |
|---|---|---|---|
| 0.0 | 0.1 | GO:0002944 | cyclin K-CDK12 complex(GO:0002944) |
| 0.0 | 0.1 | GO:0060187 | cell pole(GO:0060187) |
| 0.0 | 0.1 | GO:0016281 | eukaryotic translation initiation factor 4F complex(GO:0016281) |
| 0.0 | 0.2 | GO:0032009 | early phagosome(GO:0032009) |
| 0.0 | 0.1 | GO:0030015 | CCR4-NOT core complex(GO:0030015) |
| 0.0 | 0.1 | GO:0044300 | cerebellar mossy fiber(GO:0044300) |
| 0.0 | 0.1 | GO:0008091 | spectrin(GO:0008091) |
| 0.0 | 0.0 | GO:0035363 | histone locus body(GO:0035363) |
| 0.0 | 0.1 | GO:0097512 | cardiac myofibril(GO:0097512) |
Gene overrepresentation in molecular function category:
| Log-likelihood per target | Total log-likelihood | Term | Description |
|---|---|---|---|
| 0.1 | 0.2 | GO:0016309 | 1-phosphatidylinositol-5-phosphate 4-kinase activity(GO:0016309) |
| 0.0 | 0.3 | GO:0008140 | cAMP response element binding protein binding(GO:0008140) |
| 0.0 | 0.1 | GO:0015467 | G-protein activated inward rectifier potassium channel activity(GO:0015467) |
| 0.0 | 0.1 | GO:0051864 | histone demethylase activity (H3-K36 specific)(GO:0051864) |
| 0.0 | 0.1 | GO:0043533 | inositol 1,3,4,5 tetrakisphosphate binding(GO:0043533) |
| 0.0 | 0.0 | GO:0004307 | ethanolaminephosphotransferase activity(GO:0004307) |
| 0.0 | 0.1 | GO:0005024 | transforming growth factor beta-activated receptor activity(GO:0005024) |
| 0.0 | 0.1 | GO:0031697 | beta-1 adrenergic receptor binding(GO:0031697) |
| 0.0 | 0.1 | GO:0030550 | acetylcholine receptor inhibitor activity(GO:0030550) |
| 0.0 | 0.2 | GO:0004535 | poly(A)-specific ribonuclease activity(GO:0004535) |
Gene overrepresentation in curated gene sets: canonical pathways category:
| Log-likelihood per target | Total log-likelihood | Term | Description |
|---|---|---|---|
| 0.0 | 0.1 | PID ALK2 PATHWAY | ALK2 signaling events |