Project
GSE49485: Hypoxia transcriptome sequencing of rat brain.
Navigation
Downloads
Results for Zfp110
Z-value: 2.03
Motif logo

Transcription factors associated with Zfp110
| Gene Symbol | Gene ID | Gene Info |
|---|---|---|
|
Zfp110
|
ENSRNOG00000031328 | zinc finger protein 110 |
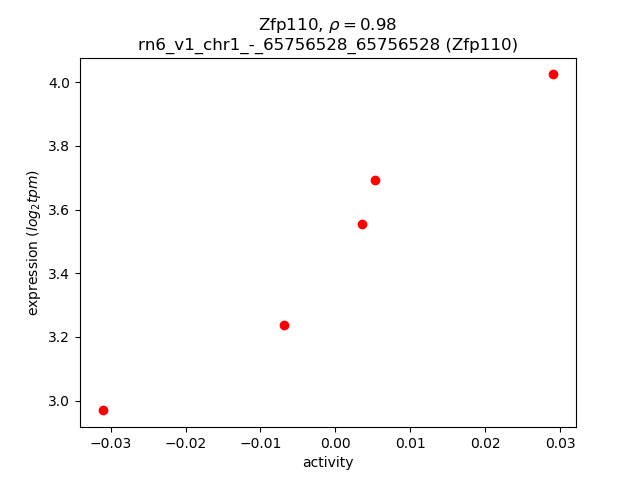
Activity-expression correlation:
| Gene | Promoter | Pearson corr. coef. | P-value | Plot |
|---|---|---|---|---|
| Zfp110 | rn6_v1_chr1_-_65756528_65756528 | 0.98 | 3.9e-03 | Click! |
Activity profile of Zfp110 motif
Sorted Z-values of Zfp110 motif
| Promoter | Log-likelihood | Transcript | Gene | Gene Info |
|---|---|---|---|---|
| chr12_-_37185548 | 4.40 |
ENSRNOT00000001338
|
LOC102556092
|
uncharacterized LOC102556092 |
| chr1_+_80973739 | 3.50 |
ENSRNOT00000026088
ENSRNOT00000081983 |
AC118165.1
|
|
| chr1_-_88558696 | 3.16 |
ENSRNOT00000038642
|
AABR07002896.1
|
|
| chr10_-_74769637 | 3.06 |
ENSRNOT00000008889
|
LOC102555183
|
zinc finger protein OZF-like |
| chr1_-_87777668 | 2.66 |
ENSRNOT00000037288
|
AABR07002870.1
|
|
| chr1_-_62316450 | 2.53 |
ENSRNOT00000079171
|
AABR07001926.3
|
|
| chr16_-_21473808 | 1.97 |
ENSRNOT00000066776
|
Zfp964
|
zinc finger protein 964 |
| chr14_+_6298872 | 1.91 |
ENSRNOT00000065071
|
Znf442
|
zinc finger protein 442 |
| chr7_-_9976367 | 1.80 |
ENSRNOT00000044241
|
Zfp347
|
zinc finger protein 347 |
| chr7_-_15821927 | 1.74 |
ENSRNOT00000050658
|
LOC691422
|
similar to zinc finger protein 101 |
| chr5_-_164648328 | 1.69 |
ENSRNOT00000090811
|
Zfp933
|
zinc finger protein 933 |
| chr7_+_15279611 | 1.36 |
ENSRNOT00000043826
|
Zfp952
|
zinc finger protein 952 |
| chr1_-_199061107 | 1.13 |
ENSRNOT00000085954
|
Zfp689
|
zinc finger protein 689 |
| chr1_-_87777359 | 1.07 |
ENSRNOT00000074090
|
AABR07002870.1
|
|
| chr1_+_84758233 | 1.06 |
ENSRNOT00000072734
|
AABR07002775.1
|
|
| chr1_-_88558387 | 1.04 |
ENSRNOT00000074174
|
AABR07002896.1
|
|
| chr1_+_88542035 | 1.01 |
ENSRNOT00000032973
|
Zfp420
|
zinc finger protein 420 |
| chr15_-_30147793 | 0.99 |
ENSRNOT00000060399
|
AABR07017693.1
|
|
| chr1_+_88451958 | 0.82 |
ENSRNOT00000074301
|
LOC102549115
|
zinc finger protein 260-like |
| chr2_+_230901126 | 0.72 |
ENSRNOT00000016026
ENSRNOT00000015564 ENSRNOT00000068198 |
Camk2d
|
calcium/calmodulin-dependent protein kinase II delta |
| chr15_-_48445588 | 0.68 |
ENSRNOT00000077197
ENSRNOT00000018583 |
Extl3
|
exostosin-like glycosyltransferase 3 |
| chr9_+_50892605 | 0.63 |
ENSRNOT00000033133
|
Bivm
|
basic, immunoglobulin-like variable motif containing |
| chr8_+_131965134 | 0.61 |
ENSRNOT00000078308
|
Znf660
|
zinc finger protein 660 |
| chr16_-_19583386 | 0.57 |
ENSRNOT00000090131
|
Zfp617
|
zinc finger protein 617 |
| chr1_+_61374379 | 0.51 |
ENSRNOT00000015343
|
Zfp53
|
zinc finger protein 53 |
| chr5_-_113939127 | 0.50 |
ENSRNOT00000039554
|
Mysm1
|
myb-like, SWIRM and MPN domains 1 |
| chr19_-_37907714 | 0.44 |
ENSRNOT00000026361
|
Ctrl
|
chymotrypsin-like |
| chr1_-_65611815 | 0.43 |
ENSRNOT00000036874
|
Zfp324
|
zinc finger protein 324 |
| chr3_-_105663457 | 0.39 |
ENSRNOT00000067646
|
Zfp770
|
zinc finger protein 770 |
| chr13_-_98078946 | 0.37 |
ENSRNOT00000035875
|
Ahctf1
|
AT hook containing transcription factor 1 |
| chr1_-_61872975 | 0.34 |
ENSRNOT00000078809
|
AABR07001910.1
|
|
| chr1_+_84652632 | 0.31 |
ENSRNOT00000041861
|
AABR07002774.2
|
|
| chr18_+_79813759 | 0.27 |
ENSRNOT00000021768
|
Zfp516
|
zinc finger protein 516 |
| chr1_-_101323960 | 0.27 |
ENSRNOT00000041513
|
Trpm4
|
transient receptor potential cation channel, subfamily M, member 4 |
| chr1_-_282492912 | 0.23 |
ENSRNOT00000047883
|
AABR07007130.1
|
|
| chr4_+_149908375 | 0.23 |
ENSRNOT00000019504
|
LOC100909657
|
uncharacterized LOC100909657 |
| chr18_-_76653056 | 0.22 |
ENSRNOT00000078496
|
Adnp2
|
ADNP homeobox 2 |
| chr4_+_49369296 | 0.21 |
ENSRNOT00000007822
|
Wnt16
|
wingless-type MMTV integration site family, member 16 |
| chrX_+_43535737 | 0.21 |
ENSRNOT00000087073
|
LOC102557137
|
E3 ubiquitin-protein ligase RNF168-like |
| chr10_+_59533480 | 0.20 |
ENSRNOT00000087723
|
Atp2a3
|
ATPase sarcoplasmic/endoplasmic reticulum Ca2+ transporting 3 |
| chr1_-_62558033 | 0.20 |
ENSRNOT00000015520
|
Zfp40
|
zinc finger protein 40 |
| chr7_-_15852930 | 0.16 |
ENSRNOT00000009270
|
LOC691422
|
similar to zinc finger protein 101 |
| chr10_-_70172739 | 0.16 |
ENSRNOT00000010015
|
Rffl
|
ring finger and FYVE-like domain containing E3 ubiquitin protein ligase |
| chrX_-_62698830 | 0.15 |
ENSRNOT00000076359
|
Pola1
|
DNA polymerase alpha 1, catalytic subunit |
| chr2_+_22950018 | 0.15 |
ENSRNOT00000071804
|
Homer1
|
homer scaffolding protein 1 |
| chr10_+_29606748 | 0.13 |
ENSRNOT00000080720
|
AABR07029467.2
|
|
| chr7_-_120518653 | 0.13 |
ENSRNOT00000016362
|
Baiap2l2
|
BAI1-associated protein 2-like 2 |
| chr7_+_116655145 | 0.13 |
ENSRNOT00000009823
|
Zfp41
|
zinc finger protein 41 |
| chr1_-_199655147 | 0.12 |
ENSRNOT00000026979
|
LOC103691238
|
zinc finger protein 239-like |
| chr3_-_8979889 | 0.10 |
ENSRNOT00000065128
|
Crat
|
carnitine O-acetyltransferase |
| chr20_+_4369178 | 0.09 |
ENSRNOT00000088079
|
Agpat1
|
1-acylglycerol-3-phosphate O-acyltransferase 1 |
| chr9_-_120101098 | 0.08 |
ENSRNOT00000002917
|
Fam114a1l1
|
family with sequence similarity 114, member A1-like 1 |
| chr14_+_71424083 | 0.08 |
ENSRNOT00000004274
|
Tapt1
|
transmembrane anterior posterior transformation 1 |
| chr5_-_99566317 | 0.07 |
ENSRNOT00000051028
ENSRNOT00000089235 |
Mpdz
|
multiple PDZ domain crumbs cell polarity complex component |
| chr17_+_36690249 | 0.06 |
ENSRNOT00000089476
ENSRNOT00000082140 |
LOC688583
|
similar to High mobility group protein 4 (HMG-4) (High mobility group protein 2a) (HMG-2a) |
| chr2_+_264864351 | 0.03 |
ENSRNOT00000015434
|
Lrrc40
|
leucine rich repeat containing 40 |
| chr1_-_72468738 | 0.03 |
ENSRNOT00000029136
|
Zfp628
|
zinc finger protein 628 |
| chr14_-_45002719 | 0.03 |
ENSRNOT00000002883
|
Fam114a1
|
family with sequence similarity 114, member A1 |
| chr12_-_11157583 | 0.02 |
ENSRNOT00000082535
|
Zkscan5
|
zinc finger with KRAB and SCAN domains 5 |
| chr11_+_85508300 | 0.02 |
ENSRNOT00000038646
|
AABR07034730.3
|
|
| chr4_+_110699557 | 0.01 |
ENSRNOT00000030588
ENSRNOT00000092261 |
Lrrtm4
|
leucine rich repeat transmembrane neuronal 4 |
| chrX_-_77295426 | 0.00 |
ENSRNOT00000090833
|
Taf9b
|
TATA-box binding protein associated factor 9b |
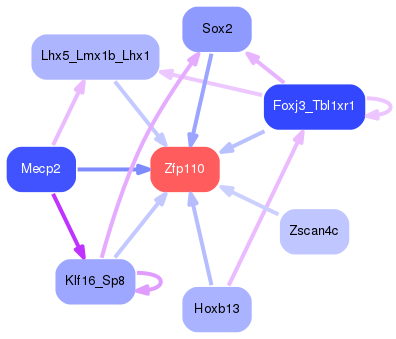
Network of associatons between targets according to the STRING database.

First level regulatory network of Zfp110
Gene Ontology Analysis
Gene overrepresentation in biological process category:
| Log-likelihood per target | Total log-likelihood | Term | Description |
|---|---|---|---|
| 0.2 | 0.7 | GO:0035022 | positive regulation of Rac protein signal transduction(GO:0035022) |
| 0.1 | 0.5 | GO:0035521 | monoubiquitinated histone deubiquitination(GO:0035521) monoubiquitinated histone H2A deubiquitination(GO:0035522) |
| 0.1 | 0.3 | GO:1903116 | positive regulation of actin filament-based movement(GO:1903116) |
| 0.0 | 0.1 | GO:0006272 | leading strand elongation(GO:0006272) |
| 0.0 | 0.2 | GO:0090403 | oxidative stress-induced premature senescence(GO:0090403) |
| 0.0 | 0.7 | GO:0015012 | heparan sulfate proteoglycan biosynthetic process(GO:0015012) |
| 0.0 | 0.4 | GO:0051292 | nuclear pore complex assembly(GO:0051292) |
| 0.0 | 0.2 | GO:2001271 | negative regulation of cysteine-type endopeptidase activity involved in execution phase of apoptosis(GO:2001271) |
| 0.0 | 0.1 | GO:0019254 | carnitine metabolic process, CoA-linked(GO:0019254) |
| 0.0 | 1.1 | GO:0035914 | skeletal muscle cell differentiation(GO:0035914) |
Gene overrepresentation in cellular component category:
| Log-likelihood per target | Total log-likelihood | Term | Description |
|---|---|---|---|
| 0.0 | 0.2 | GO:0002947 | tumor necrosis factor receptor superfamily complex(GO:0002947) |
| 0.0 | 0.4 | GO:0031080 | nuclear pore outer ring(GO:0031080) |
| 0.0 | 0.7 | GO:0043194 | axon initial segment(GO:0043194) |
| 0.0 | 0.1 | GO:0005658 | alpha DNA polymerase:primase complex(GO:0005658) |
| 0.0 | 0.1 | GO:0071439 | clathrin complex(GO:0071439) |
| 0.0 | 0.3 | GO:0034706 | sodium channel complex(GO:0034706) |
Gene overrepresentation in molecular function category:
| Log-likelihood per target | Total log-likelihood | Term | Description |
|---|---|---|---|
| 0.1 | 0.7 | GO:0019871 | sodium channel inhibitor activity(GO:0019871) |
| 0.0 | 0.1 | GO:0031802 | type 5 metabotropic glutamate receptor binding(GO:0031802) |
| 0.0 | 0.1 | GO:0003896 | DNA primase activity(GO:0003896) |
| 0.0 | 0.1 | GO:0016413 | O-acetyltransferase activity(GO:0016413) |
| 0.0 | 13.2 | GO:0001071 | nucleic acid binding transcription factor activity(GO:0001071) transcription factor activity, sequence-specific DNA binding(GO:0003700) |
Gene overrepresentation in curated gene sets: canonical pathways category:
| Log-likelihood per target | Total log-likelihood | Term | Description |
|---|---|---|---|
| 0.0 | 0.7 | ST WNT CA2 CYCLIC GMP PATHWAY | Wnt/Ca2+/cyclic GMP signaling. |
Gene overrepresentation in curated gene sets: REACTOME pathways category:
| Log-likelihood per target | Total log-likelihood | Term | Description |
|---|---|---|---|
| 0.0 | 0.7 | REACTOME CREB PHOSPHORYLATION THROUGH THE ACTIVATION OF CAMKII | Genes involved in CREB phosphorylation through the activation of CaMKII |
| 0.0 | 0.7 | REACTOME ACTIVATION OF CHAPERONE GENES BY XBP1S | Genes involved in Activation of Chaperone Genes by XBP1(S) |
| 0.0 | 0.2 | REACTOME PRE NOTCH PROCESSING IN GOLGI | Genes involved in Pre-NOTCH Processing in Golgi |
| 0.0 | 1.9 | REACTOME GENERIC TRANSCRIPTION PATHWAY | Genes involved in Generic Transcription Pathway |