Project
GSE49485: Hypoxia transcriptome sequencing of rat brain.
Navigation
Downloads
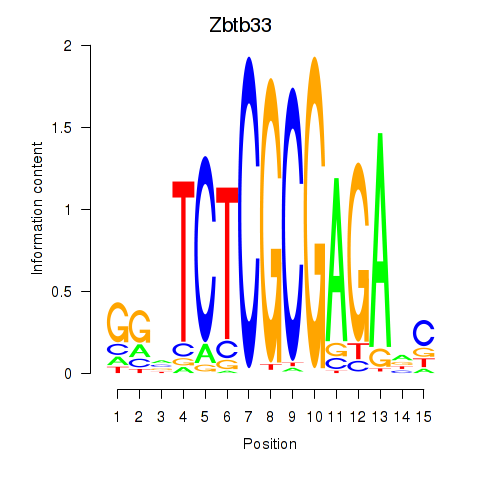
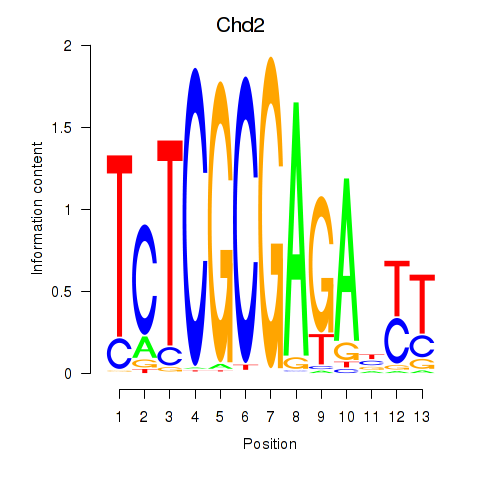
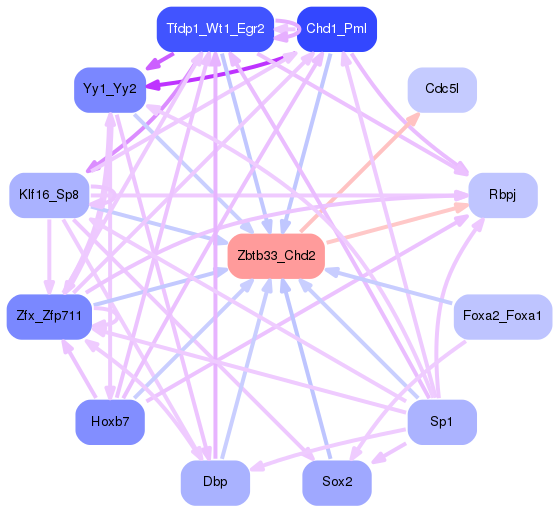
Results for Zbtb33_Chd2
Z-value: 1.21
Motif logo
Transcription factors associated with Zbtb33_Chd2
| Gene Symbol | Gene ID | Gene Info |
|---|---|---|
|
Zbtb33
|
ENSRNOG00000028899 | zinc finger and BTB domain containing 33 |
|
Chd2
|
ENSRNOG00000012716 | chromodomain helicase DNA binding protein 2 |
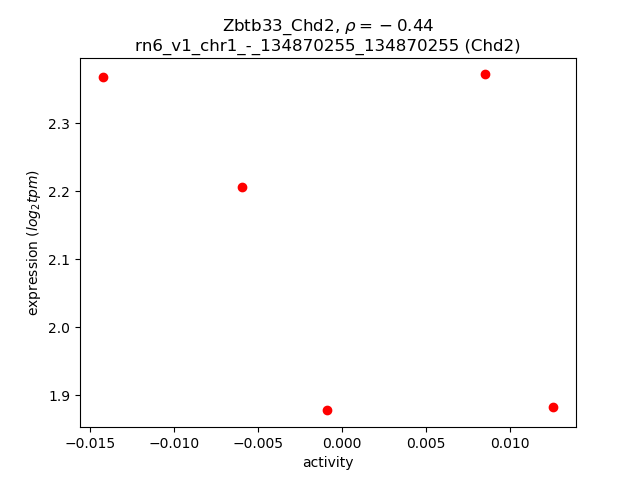
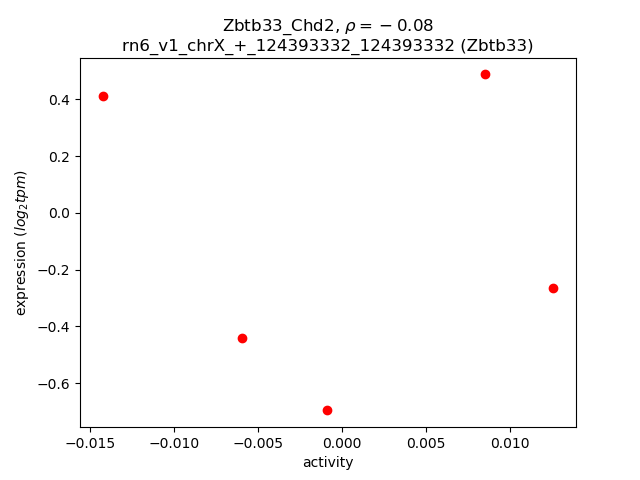
Activity-expression correlation:
| Gene | Promoter | Pearson corr. coef. | P-value | Plot |
|---|---|---|---|---|
| Chd2 | rn6_v1_chr1_-_134870255_134870255 | -0.44 | 4.6e-01 | Click! |
| Zbtb33 | rn6_v1_chrX_+_124393332_124393332 | -0.08 | 9.0e-01 | Click! |
Activity profile of Zbtb33_Chd2 motif
Sorted Z-values of Zbtb33_Chd2 motif
| Promoter | Log-likelihood | Transcript | Gene | Gene Info |
|---|---|---|---|---|
| chr10_-_19652898 | 0.56 |
ENSRNOT00000009648
|
Spdl1
|
spindle apparatus coiled-coil protein 1 |
| chr6_+_144291974 | 0.44 |
ENSRNOT00000035255
|
Ncapg2
|
non-SMC condensin II complex, subunit G2 |
| chr12_+_23954574 | 0.44 |
ENSRNOT00000046343
|
Styxl1
|
serine/threonine/tyrosine interacting-like 1 |
| chr1_+_280103695 | 0.42 |
ENSRNOT00000065289
|
Eno4
|
enolase family member 4 |
| chr1_+_205706468 | 0.41 |
ENSRNOT00000089957
ENSRNOT00000023877 |
Edrf1
|
erythroid differentiation regulatory factor 1 |
| chr6_+_49529669 | 0.40 |
ENSRNOT00000079520
|
Tmem18
|
transmembrane protein 18 |
| chr18_+_52917124 | 0.38 |
ENSRNOT00000021921
|
Slc12a2
|
solute carrier family 12 member 2 |
| chr6_+_49529228 | 0.32 |
ENSRNOT00000006836
|
Tmem18
|
transmembrane protein 18 |
| chr3_-_151724654 | 0.31 |
ENSRNOT00000026964
|
Rbm39
|
RNA binding motif protein 39 |
| chr8_-_79119720 | 0.29 |
ENSRNOT00000086562
|
Tex9
|
testis expressed 9 |
| chr10_-_57268081 | 0.28 |
ENSRNOT00000005144
|
Slc25a11
|
solute carrier family 25 member 11 |
| chr20_+_5933595 | 0.27 |
ENSRNOT00000000618
|
Mapk14
|
mitogen activated protein kinase 14 |
| chr9_+_20765296 | 0.25 |
ENSRNOT00000016291
|
Cd2ap
|
CD2-associated protein |
| chr15_-_60766579 | 0.25 |
ENSRNOT00000079978
|
Akap11
|
A-kinase anchoring protein 11 |
| chr12_+_22259713 | 0.24 |
ENSRNOT00000001913
|
Pop7
|
POP7 homolog, ribonuclease P/MRP subunit |
| chr10_+_59259955 | 0.24 |
ENSRNOT00000021816
|
Ankfy1
|
ankyrin repeat and FYVE domain containing 1 |
| chr7_+_126028350 | 0.23 |
ENSRNOT00000042412
|
Ribc2
|
RIB43A domain with coiled-coils 2 |
| chr5_+_169475270 | 0.22 |
ENSRNOT00000014625
|
Icmt
|
isoprenylcysteine carboxyl methyltransferase |
| chr19_-_52206310 | 0.22 |
ENSRNOT00000087886
|
Mbtps1
|
membrane-bound transcription factor peptidase, site 1 |
| chr12_-_38093050 | 0.22 |
ENSRNOT00000057814
|
Ccdc62
|
coiled-coil domain containing 62 |
| chr2_-_165600748 | 0.22 |
ENSRNOT00000013216
|
Ift80
|
intraflagellar transport 80 |
| chr16_-_55132191 | 0.22 |
ENSRNOT00000017025
|
Micu3
|
mitochondrial calcium uptake family, member 3 |
| chr4_+_62299044 | 0.21 |
ENSRNOT00000032077
|
Agbl3
|
ATP/GTP binding protein-like 3 |
| chr20_+_5933303 | 0.21 |
ENSRNOT00000000617
|
Mapk14
|
mitogen activated protein kinase 14 |
| chr13_-_47440682 | 0.21 |
ENSRNOT00000037679
ENSRNOT00000005729 ENSRNOT00000050354 ENSRNOT00000050859 |
Pfkfb2
|
6-phosphofructo-2-kinase/fructose-2,6-biphosphatase 2 |
| chr18_+_44468784 | 0.21 |
ENSRNOT00000031812
|
Dmxl1
|
Dmx-like 1 |
| chr2_+_208577197 | 0.21 |
ENSRNOT00000076654
|
Wdr77
|
WD repeat domain 77 |
| chr7_+_140758615 | 0.21 |
ENSRNOT00000089448
|
Troap
|
trophinin associated protein |
| chr17_+_78915604 | 0.20 |
ENSRNOT00000057855
|
Rpp38
|
ribonuclease P/MRP 38 subunit |
| chrX_+_29562165 | 0.20 |
ENSRNOT00000006074
|
Ofd1
|
OFD1, centriole and centriolar satellite protein |
| chr16_+_74292438 | 0.20 |
ENSRNOT00000026197
|
Vdac3
|
voltage-dependent anion channel 3 |
| chr13_-_35858390 | 0.19 |
ENSRNOT00000003568
|
Ptpn4
|
protein tyrosine phosphatase, non-receptor type 4 |
| chr3_-_110021149 | 0.19 |
ENSRNOT00000007808
|
Fsip1
|
fibrous sheath interacting protein 1 |
| chr8_-_58253688 | 0.18 |
ENSRNOT00000010956
|
Cul5
|
cullin 5 |
| chr4_-_57823283 | 0.18 |
ENSRNOT00000032772
ENSRNOT00000091255 |
Tmem209
|
transmembrane protein 209 |
| chr2_-_227160379 | 0.18 |
ENSRNOT00000066581
|
Usp53
|
ubiquitin specific peptidase 53 |
| chrX_-_10413984 | 0.18 |
ENSRNOT00000039551
ENSRNOT00000091448 |
Ddx3x
|
DEAD-box helicase 3, X-linked |
| chr1_+_114186853 | 0.18 |
ENSRNOT00000055989
|
Tubgcp5
|
tubulin, gamma complex associated protein 5 |
| chr15_+_24159647 | 0.18 |
ENSRNOT00000082675
|
Lgals3
|
galectin 3 |
| chr9_+_17949764 | 0.18 |
ENSRNOT00000027264
|
Cdc5l
|
cell division cycle 5-like |
| chr10_+_55653946 | 0.17 |
ENSRNOT00000008787
|
Tmem107
|
transmembrane protein 107 |
| chr10_-_55997299 | 0.17 |
ENSRNOT00000074505
|
Cyb5d1
|
cytochrome b5 domain containing 1 |
| chr2_-_208420163 | 0.17 |
ENSRNOT00000021920
|
LOC100911417
|
ATP synthase subunit b, mitochondrial-like |
| chr10_-_86144880 | 0.17 |
ENSRNOT00000067901
|
Med1
|
mediator complex subunit 1 |
| chr13_+_47440803 | 0.17 |
ENSRNOT00000030476
|
Yod1
|
YOD1 deubiquitinase |
| chr2_+_166402838 | 0.17 |
ENSRNOT00000064244
|
Nmd3
|
NMD3 ribosome export adaptor |
| chr7_+_28715300 | 0.17 |
ENSRNOT00000006760
ENSRNOT00000089161 |
Nup37
|
nucleoporin 37 |
| chr13_+_25656983 | 0.17 |
ENSRNOT00000020892
|
RGD1307235
|
similar to RIKEN cDNA 2310035C23 |
| chr3_+_46286712 | 0.17 |
ENSRNOT00000085563
|
March7
|
membrane associated ring-CH-type finger 7 |
| chr15_-_40545824 | 0.17 |
ENSRNOT00000017204
|
Nup58
|
nucleoporin 58 |
| chr4_+_66290389 | 0.16 |
ENSRNOT00000008557
|
Luc7l2
|
LUC7-like 2 pre-mRNA splicing factor |
| chr8_+_63379087 | 0.16 |
ENSRNOT00000012091
ENSRNOT00000012295 |
Nptn
|
neuroplastin |
| chr2_-_257425242 | 0.16 |
ENSRNOT00000017381
|
Dnajb4
|
DnaJ heat shock protein family (Hsp40) member B4 |
| chr16_+_8302950 | 0.16 |
ENSRNOT00000066062
|
Ncoa4
|
nuclear receptor coactivator 4 |
| chr3_-_5458782 | 0.16 |
ENSRNOT00000066193
|
LOC100911917
|
mediator of RNA polymerase II transcription subunit 22-like |
| chr3_-_13933658 | 0.16 |
ENSRNOT00000025433
|
Psmd5
|
proteasome 26S subunit, non-ATPase 5 |
| chr11_-_54404612 | 0.15 |
ENSRNOT00000033837
|
RGD1310335
|
similar to RIKEN cDNA C330027C09 |
| chr3_-_4866833 | 0.15 |
ENSRNOT00000006720
|
Med22
|
mediator complex subunit 22 |
| chr4_+_57823411 | 0.15 |
ENSRNOT00000030462
ENSRNOT00000088235 |
Ssmem1
|
serine-rich single-pass membrane protein 1 |
| chr9_-_86129073 | 0.15 |
ENSRNOT00000093730
|
Cul3
|
cullin 3 |
| chr1_-_193459396 | 0.15 |
ENSRNOT00000020281
|
Zkscan2
|
zinc finger with KRAB and SCAN domains 2 |
| chr1_-_229639187 | 0.15 |
ENSRNOT00000016804
|
Zfp91
|
zinc finger protein 91 |
| chr1_+_257614731 | 0.15 |
ENSRNOT00000075680
|
LOC100911660
|
lymphocyte-specific helicase-like |
| chr12_+_19599834 | 0.14 |
ENSRNOT00000092039
ENSRNOT00000042006 |
Stag3
|
stromal antigen 3 |
| chr18_+_28361283 | 0.14 |
ENSRNOT00000026949
|
Matr3
|
matrin 3 |
| chr6_-_26685235 | 0.14 |
ENSRNOT00000066743
|
Atraid
|
all-trans retinoic acid-induced differentiation factor |
| chr8_-_60086403 | 0.14 |
ENSRNOT00000020544
|
Etfa
|
electron transfer flavoprotein alpha subunit |
| chr15_-_89339323 | 0.14 |
ENSRNOT00000013297
|
Rbm26
|
RNA binding motif protein 26 |
| chr10_-_59892960 | 0.13 |
ENSRNOT00000084432
|
Aspa
|
aspartoacylase |
| chr9_+_98279022 | 0.13 |
ENSRNOT00000038536
|
Rbm44
|
RNA binding motif protein 44 |
| chr16_+_71090045 | 0.13 |
ENSRNOT00000020832
|
Ddhd2
|
DDHD domain containing 2 |
| chr1_+_257615088 | 0.13 |
ENSRNOT00000083183
|
LOC100911660
|
lymphocyte-specific helicase-like |
| chr10_-_78168609 | 0.13 |
ENSRNOT00000041119
|
Stxbp4
|
syntaxin binding protein 4 |
| chr18_+_1142782 | 0.13 |
ENSRNOT00000046718
|
Thoc1
|
THO complex 1 |
| chr13_-_45127815 | 0.13 |
ENSRNOT00000005127
|
Dars
|
aspartyl-tRNA synthetase |
| chr10_+_104155805 | 0.13 |
ENSRNOT00000005089
|
Mrps7
|
mitochondrial ribosomal protein S7 |
| chr2_+_138194136 | 0.13 |
ENSRNOT00000014928
|
RGD1307595
|
similar to RIKEN cDNA 1700018B24 |
| chr3_-_164964702 | 0.13 |
ENSRNOT00000014595
|
Adnp
|
activity-dependent neuroprotector homeobox |
| chrX_+_156999826 | 0.12 |
ENSRNOT00000081819
|
Idh3g
|
isocitrate dehydrogenase 3 (NAD), gamma |
| chr9_+_114022137 | 0.12 |
ENSRNOT00000007657
|
Map3k7
|
mitogen activated protein kinase kinase kinase 7 |
| chr1_+_201981357 | 0.12 |
ENSRNOT00000027999
|
Acadsb
|
acyl-CoA dehydrogenase, short/branched chain |
| chr10_-_95407997 | 0.12 |
ENSRNOT00000077888
|
Nol11
|
nucleolar protein 11 |
| chr15_-_59215803 | 0.12 |
ENSRNOT00000032301
|
Lacc1
|
laccase domain containing 1 |
| chr1_+_31967978 | 0.12 |
ENSRNOT00000081471
ENSRNOT00000021532 |
Trip13
|
thyroid hormone receptor interactor 13 |
| chr4_+_45555077 | 0.12 |
ENSRNOT00000089007
|
Lsm8
|
LSM8 homolog, U6 small nuclear RNA associated |
| chr10_-_18090932 | 0.12 |
ENSRNOT00000064744
ENSRNOT00000006591 |
Npm1
|
nucleophosmin 1 |
| chr1_+_56949712 | 0.12 |
ENSRNOT00000020889
|
LOC100125364
|
hypothetical protein LOC100125364 |
| chr5_+_47186558 | 0.11 |
ENSRNOT00000007654
|
LOC100910771
|
mitogen-activated protein kinase kinase kinase 7-like |
| chr1_-_241046249 | 0.11 |
ENSRNOT00000067796
ENSRNOT00000081866 |
Smc5
|
structural maintenance of chromosomes 5 |
| chr12_-_52452040 | 0.11 |
ENSRNOT00000067453
|
Pole
|
DNA polymerase epsilon, catalytic subunit |
| chr14_+_113570150 | 0.11 |
ENSRNOT00000005170
|
Ppp4r3b
|
protein phosphatase 4, regulatory subunit 3B |
| chr18_-_62965538 | 0.11 |
ENSRNOT00000025164
|
Mppe1
|
metallophosphoesterase 1 |
| chr1_+_257766691 | 0.11 |
ENSRNOT00000088148
|
Hells
|
helicase, lymphoid specific |
| chr1_-_201981229 | 0.11 |
ENSRNOT00000077246
ENSRNOT00000035531 |
Ikzf5
|
IKAROS family zinc finger 5 |
| chr9_+_17120759 | 0.11 |
ENSRNOT00000025787
|
Polr1c
|
RNA polymerase I subunit C |
| chr2_-_208152179 | 0.11 |
ENSRNOT00000068152
|
Ddx20
|
DEAD-box helicase 20 |
| chr10_-_73690860 | 0.10 |
ENSRNOT00000004876
ENSRNOT00000075843 |
Ints2
|
integrator complex subunit 2 |
| chr16_-_70665796 | 0.10 |
ENSRNOT00000080051
ENSRNOT00000084974 |
Thap1
|
THAP domain containing 1 |
| chr4_+_123162086 | 0.10 |
ENSRNOT00000011557
|
Lsm3
|
LSM3 homolog, U6 small nuclear RNA and mRNA degradation associated |
| chr3_+_33641616 | 0.10 |
ENSRNOT00000051953
|
Epc2
|
enhancer of polycomb homolog 2 |
| chrX_-_10630281 | 0.10 |
ENSRNOT00000080651
ENSRNOT00000048980 |
Usp9x
|
ubiquitin specific peptidase 9, X-linked |
| chr5_-_57845509 | 0.10 |
ENSRNOT00000035541
|
Kif24
|
kinesin family member 24 |
| chr20_+_47494270 | 0.10 |
ENSRNOT00000036365
|
Sec63
|
SEC63 homolog, protein translocation regulator |
| chr15_+_3936786 | 0.10 |
ENSRNOT00000066163
|
Camk2g
|
calcium/calmodulin-dependent protein kinase II gamma |
| chr1_+_257901985 | 0.10 |
ENSRNOT00000073015
|
Hells
|
helicase, lymphoid specific |
| chr3_+_56125924 | 0.10 |
ENSRNOT00000011380
|
Ubr3
|
ubiquitin protein ligase E3 component n-recognin 3 |
| chr16_-_21131795 | 0.09 |
ENSRNOT00000078005
|
Sugp1
|
SURP and G patch domain containing 1 |
| chr20_+_27352276 | 0.09 |
ENSRNOT00000076534
|
Rn50_20_0292.1
|
|
| chr1_-_217748628 | 0.09 |
ENSRNOT00000075089
|
Fadd
|
Fas associated via death domain |
| chr8_+_95968652 | 0.09 |
ENSRNOT00000015057
|
Nt5e
|
5' nucleotidase, ecto |
| chr12_+_52452273 | 0.09 |
ENSRNOT00000056680
ENSRNOT00000088381 |
Pxmp2
|
peroxisomal membrane protein 2 |
| chr6_+_99817431 | 0.09 |
ENSRNOT00000009621
|
Churc1
|
churchill domain containing 1 |
| chr2_+_84678948 | 0.09 |
ENSRNOT00000046325
|
Fam173b
|
family with sequence similarity 173, member B |
| chr2_-_58534211 | 0.09 |
ENSRNOT00000089178
|
Skp2
|
S-phase kinase associated protein 2 |
| chrX_+_43497763 | 0.09 |
ENSRNOT00000005014
|
Prdx4
|
peroxiredoxin 4 |
| chr1_-_142720257 | 0.09 |
ENSRNOT00000032294
|
Wdr73
|
WD repeat domain 73 |
| chr14_-_20992753 | 0.09 |
ENSRNOT00000014650
|
Mob1b
|
MOB kinase activator 1B |
| chr5_+_113592919 | 0.08 |
ENSRNOT00000011336
|
Ift74
|
intraflagellar transport 74 |
| chr10_-_56185857 | 0.08 |
ENSRNOT00000014261
|
Wrap53
|
WD repeat containing, antisense to TP53 |
| chr19_-_37370429 | 0.08 |
ENSRNOT00000022497
|
Kctd19
|
potassium channel tetramerization domain containing 19 |
| chrX_+_120860178 | 0.08 |
ENSRNOT00000088661
|
Wdr44
|
WD repeat domain 44 |
| chr15_-_83494423 | 0.08 |
ENSRNOT00000037588
|
Dis3
|
DIS3 homolog, exosome endoribonuclease and 3'-5' exoribonuclease |
| chr8_+_72029489 | 0.08 |
ENSRNOT00000089336
|
Herc1
|
HECT and RLD domain containing E3 ubiquitin protein ligase family member 1 |
| chrX_+_77065397 | 0.08 |
ENSRNOT00000090007
|
Cox7b
|
cytochrome c oxidase subunit 7B |
| chr2_-_210088949 | 0.08 |
ENSRNOT00000070994
|
Rbm15
|
RNA binding motif protein 15 |
| chr4_-_168323751 | 0.08 |
ENSRNOT00000082102
|
Lrp6
|
LDL receptor related protein 6 |
| chr9_-_11027506 | 0.08 |
ENSRNOT00000071107
|
Chaf1a
|
chromatin assembly factor 1 subunit A |
| chr1_-_101151308 | 0.08 |
ENSRNOT00000093319
ENSRNOT00000027992 |
Aldh16a1
|
aldehyde dehydrogenase 16 family, member A1 |
| chr10_-_76407857 | 0.08 |
ENSRNOT00000003179
|
Dgke
|
diacylglycerol kinase epsilon |
| chr10_-_81587858 | 0.08 |
ENSRNOT00000003582
|
Utp18
|
UTP18 small subunit processome component |
| chr16_+_64729221 | 0.08 |
ENSRNOT00000015297
|
Mak16
|
MAK16 homolog |
| chr14_-_59735450 | 0.07 |
ENSRNOT00000071929
|
Rbpj
|
recombination signal binding protein for immunoglobulin kappa J region |
| chrX_+_120859968 | 0.07 |
ENSRNOT00000085185
|
Wdr44
|
WD repeat domain 44 |
| chr5_+_169213115 | 0.07 |
ENSRNOT00000013535
|
Nol9
|
nucleolar protein 9 |
| chr2_+_251863069 | 0.07 |
ENSRNOT00000036282
|
Syde2
|
synapse defective Rho GTPase homolog 2 |
| chr10_-_14247886 | 0.07 |
ENSRNOT00000020504
|
Nubp2
|
nucleotide binding protein 2 |
| chr19_+_14523554 | 0.07 |
ENSRNOT00000084271
ENSRNOT00000064731 |
Mcm5
|
minichromosome maintenance complex component 5 |
| chr11_-_27141881 | 0.07 |
ENSRNOT00000002169
|
Cct8
|
chaperonin containing TCP1 subunit 8 |
| chr17_+_89951752 | 0.07 |
ENSRNOT00000057572
ENSRNOT00000091023 |
Abi1
|
abl-interactor 1 |
| chr17_-_955615 | 0.07 |
ENSRNOT00000022884
|
Fancc
|
Fanconi anemia, complementation group C |
| chr1_-_32140136 | 0.07 |
ENSRNOT00000081339
ENSRNOT00000022635 |
Slc12a7
|
solute carrier family 12 member 7 |
| chr12_+_9034308 | 0.07 |
ENSRNOT00000001248
|
Flt1
|
FMS-related tyrosine kinase 1 |
| chr18_-_6587080 | 0.07 |
ENSRNOT00000040815
|
LOC103694404
|
60S ribosomal protein L39 |
| chr7_-_124020574 | 0.07 |
ENSRNOT00000055988
|
Poldip3
|
DNA polymerase delta interacting protein 3 |
| chr6_-_1466201 | 0.06 |
ENSRNOT00000089185
|
Eif2ak2
|
eukaryotic translation initiation factor 2-alpha kinase 2 |
| chr19_-_50367187 | 0.06 |
ENSRNOT00000072416
|
Mphosph6
|
M phase phosphoprotein 6 |
| chr9_-_74048244 | 0.06 |
ENSRNOT00000018293
|
Lancl1
|
LanC like 1 |
| chr19_-_43149210 | 0.06 |
ENSRNOT00000038452
|
Pdpr
|
pyruvate dehydrogenase phosphatase regulatory subunit |
| chr19_-_44095250 | 0.06 |
ENSRNOT00000074824
|
Tmem170a
|
transmembrane protein 170A |
| chr1_+_56982821 | 0.06 |
ENSRNOT00000059845
|
Ermard
|
ER membrane-associated RNA degradation |
| chr9_+_76913639 | 0.06 |
ENSRNOT00000089203
|
AABR07068007.2
|
|
| chr7_-_126028279 | 0.06 |
ENSRNOT00000044883
|
Smc1b
|
structural maintenance of chromosomes 1B |
| chr5_+_151796814 | 0.06 |
ENSRNOT00000009394
|
Gpatch3
|
G patch domain containing 3 |
| chr2_-_219842986 | 0.06 |
ENSRNOT00000055735
|
Agl
|
amylo-alpha-1, 6-glucosidase, 4-alpha-glucanotransferase |
| chr4_+_100166863 | 0.06 |
ENSRNOT00000014505
|
Sftpb
|
surfactant protein B |
| chr20_+_41083317 | 0.06 |
ENSRNOT00000000660
|
Tspyl1
|
TSPY-like 1 |
| chr8_+_107826424 | 0.06 |
ENSRNOT00000019769
|
Dbr1
|
debranching RNA lariats 1 |
| chrX_-_33665821 | 0.06 |
ENSRNOT00000066676
|
Rbbp7
|
RB binding protein 7, chromatin remodeling factor |
| chr16_-_2227258 | 0.06 |
ENSRNOT00000089377
ENSRNOT00000067464 |
Slmap
|
sarcolemma associated protein |
| chr4_-_38240848 | 0.06 |
ENSRNOT00000007567
|
Ndufa4
|
NADH:ubiquinone oxidoreductase subunit A4 |
| chr17_-_45154355 | 0.06 |
ENSRNOT00000084976
|
Zkscan4
|
zinc finger with KRAB and SCAN domains 4 |
| chr10_-_59698168 | 0.06 |
ENSRNOT00000074018
|
Gsg2
|
germ cell associated 2 (haspin) |
| chr5_+_104941066 | 0.05 |
ENSRNOT00000009225
|
Rraga
|
Ras-related GTP binding A |
| chr16_-_41234095 | 0.05 |
ENSRNOT00000000120
|
Aga
|
aspartylglucosaminidase |
| chr9_+_93080615 | 0.05 |
ENSRNOT00000024306
|
Psmd1
|
proteasome 26S subunit, non-ATPase 1 |
| chr6_+_26517840 | 0.05 |
ENSRNOT00000031842
|
Ppm1g
|
protein phosphatase, Mg2+/Mn2+ dependent, 1G |
| chr3_-_117389456 | 0.05 |
ENSRNOT00000007103
ENSRNOT00000081533 |
Myef2
|
myelin expression factor 2 |
| chr2_+_140541619 | 0.05 |
ENSRNOT00000017396
|
Rab33b
|
RAB33B, member RAS oncogene family |
| chr16_+_81756971 | 0.05 |
ENSRNOT00000044085
|
Pcid2
|
PCI domain containing 2 |
| chr10_-_94460732 | 0.05 |
ENSRNOT00000014508
|
Smarcd2
|
SWI/SNF related, matrix associated, actin dependent regulator of chromatin, subfamily d, member 2 |
| chr9_-_93377643 | 0.05 |
ENSRNOT00000024712
|
Ncl
|
nucleolin |
| chr17_-_70325855 | 0.05 |
ENSRNOT00000024952
|
Gdi2
|
GDP dissociation inhibitor 2 |
| chr6_-_103935122 | 0.05 |
ENSRNOT00000058354
|
LOC500684
|
hypothetical protein LOC500684 |
| chr1_-_260460791 | 0.05 |
ENSRNOT00000018179
|
Tll2
|
tolloid-like 2 |
| chr10_+_13000090 | 0.05 |
ENSRNOT00000004845
|
Cldn6
|
claudin 6 |
| chr1_+_216254979 | 0.05 |
ENSRNOT00000046669
|
Tssc4
|
tumor suppressing subtransferable candidate 4 |
| chr18_-_27725694 | 0.05 |
ENSRNOT00000026398
|
Etf1
|
eukaryotic translation termination factor 1 |
| chr3_+_65815080 | 0.05 |
ENSRNOT00000006429
|
Ube2e3
|
ubiquitin-conjugating enzyme E2E 3 |
| chr2_-_208577146 | 0.05 |
ENSRNOT00000075083
|
Atp5f1
|
ATP synthase, H+ transporting, mitochondrial Fo complex, subunit B1 |
| chr11_+_89511191 | 0.05 |
ENSRNOT00000002510
|
Mcm4
|
minichromosome maintenance complex component 4 |
| chr5_-_152746588 | 0.05 |
ENSRNOT00000022908
|
Mtfr1l
|
mitochondrial fission regulator 1-like |
| chr10_+_86157608 | 0.05 |
ENSRNOT00000082668
ENSRNOT00000008256 |
Cdk12
|
cyclin-dependent kinase 12 |
| chr8_+_49081080 | 0.05 |
ENSRNOT00000019011
|
Ift46
|
intraflagellar transport 46 |
| chr5_-_113939127 | 0.05 |
ENSRNOT00000039554
|
Mysm1
|
myb-like, SWIRM and MPN domains 1 |
| chr16_-_81756654 | 0.05 |
ENSRNOT00000026653
|
Cul4a
|
cullin 4A |
| chrY_-_1238420 | 0.05 |
ENSRNOT00000092078
|
Ddx3
|
DEAD (Asp-Glu-Ala-Asp) box polypeptide 3 |
| chr14_-_83476568 | 0.05 |
ENSRNOT00000025241
|
Drg1
|
developmentally regulated GTP binding protein 1 |
| chr7_-_144223429 | 0.04 |
ENSRNOT00000020527
|
Atf7
|
activating transcription factor 7 |
| chr10_+_35637133 | 0.04 |
ENSRNOT00000043085
|
Tbc1d9b
|
TBC1 domain family member 9B |
| chr18_-_29587760 | 0.04 |
ENSRNOT00000023811
|
Ndufa2
|
NADH:ubiquinone oxidoreductase subunit A2 |
| chr2_-_195935878 | 0.04 |
ENSRNOT00000028440
|
Cgn
|
cingulin |
| chrX_-_156155014 | 0.04 |
ENSRNOT00000088637
|
LOC102552182
|
L antigen family member 3-like |
| chrX_-_6620722 | 0.04 |
ENSRNOT00000066674
|
Maoa
|
monoamine oxidase A |
| chr15_-_88622413 | 0.04 |
ENSRNOT00000092174
|
Pou4f1
|
POU class 4 homeobox 1 |
| chr1_-_187766670 | 0.04 |
ENSRNOT00000092513
ENSRNOT00000092282 |
Rps15a
|
ribosomal protein S15a |
| chr10_+_93415399 | 0.04 |
ENSRNOT00000066484
|
Tlk2
|
tousled-like kinase 2 |
| chr3_-_60795951 | 0.04 |
ENSRNOT00000002174
|
Atf2
|
activating transcription factor 2 |
| chr4_-_34282351 | 0.04 |
ENSRNOT00000011123
|
Rpa3
|
replication protein A3 |
| chr7_+_2737765 | 0.04 |
ENSRNOT00000004895
|
Cnpy2
|
canopy FGF signaling regulator 2 |
| chr12_-_40680374 | 0.04 |
ENSRNOT00000048984
ENSRNOT00000080418 |
Naa25
|
N(alpha)-acetyltransferase 25, NatB auxiliary subunit |
Network of associatons between targets according to the STRING database.

First level regulatory network of Zbtb33_Chd2
Gene Ontology Analysis
Gene overrepresentation in biological process category:
| Log-likelihood per target | Total log-likelihood | Term | Description |
|---|---|---|---|
| 0.1 | 0.4 | GO:0070634 | transepithelial ammonium transport(GO:0070634) |
| 0.1 | 0.5 | GO:0014835 | myoblast differentiation involved in skeletal muscle regeneration(GO:0014835) |
| 0.1 | 0.2 | GO:0060825 | fibroblast growth factor receptor signaling pathway involved in neural plate anterior/posterior pattern formation(GO:0060825) regulation of fibroblast growth factor receptor signaling pathway involved in neural plate anterior/posterior pattern formation(GO:2000313) |
| 0.1 | 0.2 | GO:0000448 | cleavage in ITS2 between 5.8S rRNA and LSU-rRNA of tricistronic rRNA transcript (SSU-rRNA, 5.8S rRNA, LSU-rRNA)(GO:0000448) |
| 0.1 | 0.3 | GO:0032911 | negative regulation of transforming growth factor beta1 production(GO:0032911) |
| 0.1 | 0.2 | GO:1903769 | negative regulation of cell proliferation in bone marrow(GO:1903769) |
| 0.1 | 0.2 | GO:1990167 | protein K27-linked deubiquitination(GO:1990167) protein K33-linked deubiquitination(GO:1990168) |
| 0.1 | 0.2 | GO:0070682 | proteasome regulatory particle assembly(GO:0070682) |
| 0.0 | 0.1 | GO:0001831 | trophectodermal cellular morphogenesis(GO:0001831) |
| 0.0 | 0.2 | GO:0048549 | positive regulation of pinocytosis(GO:0048549) |
| 0.0 | 0.2 | GO:0060332 | positive regulation of response to interferon-gamma(GO:0060332) positive regulation of interferon-gamma-mediated signaling pathway(GO:0060335) |
| 0.0 | 0.2 | GO:0031508 | pericentric heterochromatin assembly(GO:0031508) |
| 0.0 | 0.2 | GO:0060528 | secretory columnal luminar epithelial cell differentiation involved in prostate glandular acinus development(GO:0060528) |
| 0.0 | 0.2 | GO:1902683 | regulation of receptor localization to synapse(GO:1902683) |
| 0.0 | 0.0 | GO:0072714 | response to selenite ion(GO:0072714) |
| 0.0 | 0.2 | GO:1904751 | positive regulation of protein localization to nucleolus(GO:1904751) |
| 0.0 | 0.5 | GO:0034501 | protein localization to kinetochore(GO:0034501) |
| 0.0 | 0.3 | GO:2000051 | negative regulation of non-canonical Wnt signaling pathway(GO:2000051) |
| 0.0 | 0.1 | GO:0021698 | cerebellar cortex structural organization(GO:0021698) |
| 0.0 | 0.1 | GO:2000407 | CD8-positive, alpha-beta T cell extravasation(GO:0035697) regulation of T cell extravasation(GO:2000407) |
| 0.0 | 0.2 | GO:0007221 | positive regulation of transcription of Notch receptor target(GO:0007221) |
| 0.0 | 0.1 | GO:0046086 | adenosine biosynthetic process(GO:0046086) |
| 0.0 | 0.2 | GO:0035610 | protein side chain deglutamylation(GO:0035610) |
| 0.0 | 0.2 | GO:0051415 | interphase microtubule nucleation by interphase microtubule organizing center(GO:0051415) microtubule nucleation by microtubule organizing center(GO:0051418) |
| 0.0 | 0.1 | GO:0006272 | leading strand elongation(GO:0006272) |
| 0.0 | 0.1 | GO:0071033 | nuclear retention of pre-mRNA at the site of transcription(GO:0071033) |
| 0.0 | 0.2 | GO:0033133 | positive regulation of glucokinase activity(GO:0033133) |
| 0.0 | 0.4 | GO:0001833 | inner cell mass cell proliferation(GO:0001833) |
| 0.0 | 0.2 | GO:0042256 | mature ribosome assembly(GO:0042256) |
| 0.0 | 0.2 | GO:1990646 | cellular response to prolactin(GO:1990646) |
| 0.0 | 0.2 | GO:1904491 | protein localization to ciliary transition zone(GO:1904491) |
| 0.0 | 0.2 | GO:0018410 | C-terminal protein amino acid modification(GO:0018410) |
| 0.0 | 0.1 | GO:0006102 | isocitrate metabolic process(GO:0006102) |
| 0.0 | 0.1 | GO:0071034 | CUT catabolic process(GO:0071034) CUT metabolic process(GO:0071043) |
| 0.0 | 0.1 | GO:2000255 | negative regulation of male germ cell proliferation(GO:2000255) |
| 0.0 | 0.1 | GO:0045716 | positive regulation of low-density lipoprotein particle receptor biosynthetic process(GO:0045716) |
| 0.0 | 0.2 | GO:1901838 | positive regulation of transcription of nuclear large rRNA transcript from RNA polymerase I promoter(GO:1901838) |
| 0.0 | 0.1 | GO:0045829 | negative regulation of isotype switching(GO:0045829) |
| 0.0 | 0.1 | GO:0090666 | scaRNA localization to Cajal body(GO:0090666) |
| 0.0 | 0.2 | GO:0021942 | radial glia guided migration of Purkinje cell(GO:0021942) |
| 0.0 | 0.1 | GO:0050828 | regulation of liquid surface tension(GO:0050828) |
| 0.0 | 0.1 | GO:0034184 | positive regulation of maintenance of mitotic sister chromatid cohesion(GO:0034184) |
| 0.0 | 0.1 | GO:0031204 | posttranslational protein targeting to membrane, translocation(GO:0031204) |
| 0.0 | 0.1 | GO:0010835 | regulation of protein ADP-ribosylation(GO:0010835) |
| 0.0 | 0.1 | GO:0045054 | constitutive secretory pathway(GO:0045054) |
| 0.0 | 0.2 | GO:0033689 | negative regulation of osteoblast proliferation(GO:0033689) |
| 0.0 | 0.1 | GO:0007144 | female meiosis I(GO:0007144) |
| 0.0 | 0.2 | GO:0070072 | vacuolar proton-transporting V-type ATPase complex assembly(GO:0070072) |
| 0.0 | 0.3 | GO:0007250 | activation of NF-kappaB-inducing kinase activity(GO:0007250) |
| 0.0 | 0.1 | GO:0071460 | cellular response to cell-matrix adhesion(GO:0071460) |
| 0.0 | 0.1 | GO:0070370 | cellular heat acclimation(GO:0070370) |
| 0.0 | 0.0 | GO:0048880 | sensory system development(GO:0048880) |
| 0.0 | 0.0 | GO:0032915 | positive regulation of transforming growth factor beta2 production(GO:0032915) |
| 0.0 | 0.1 | GO:1904867 | protein localization to nuclear body(GO:1903405) protein localization to Cajal body(GO:1904867) regulation of protein localization to Cajal body(GO:1904869) positive regulation of protein localization to Cajal body(GO:1904871) protein localization to nucleoplasm(GO:1990173) |
| 0.0 | 0.0 | GO:0042412 | taurine biosynthetic process(GO:0042412) |
| 0.0 | 0.1 | GO:0033539 | fatty acid beta-oxidation using acyl-CoA dehydrogenase(GO:0033539) |
| 0.0 | 0.0 | GO:0006543 | glutamine catabolic process(GO:0006543) |
| 0.0 | 0.0 | GO:0097010 | eukaryotic translation initiation factor 4F complex assembly(GO:0097010) |
| 0.0 | 0.0 | GO:0061153 | trachea submucosa development(GO:0061152) trachea gland development(GO:0061153) |
| 0.0 | 0.1 | GO:0035735 | intraciliary transport involved in cilium morphogenesis(GO:0035735) |
| 0.0 | 0.0 | GO:0035522 | monoubiquitinated histone deubiquitination(GO:0035521) monoubiquitinated histone H2A deubiquitination(GO:0035522) |
| 0.0 | 0.1 | GO:1905150 | regulation of voltage-gated sodium channel activity(GO:1905150) |
| 0.0 | 0.1 | GO:0048597 | post-embryonic camera-type eye morphogenesis(GO:0048597) |
| 0.0 | 0.1 | GO:1904263 | positive regulation of cytolysis(GO:0045919) positive regulation of TORC1 signaling(GO:1904263) |
| 0.0 | 0.3 | GO:0015985 | energy coupled proton transport, down electrochemical gradient(GO:0015985) ATP synthesis coupled proton transport(GO:0015986) |
| 0.0 | 0.0 | GO:0043060 | meiotic metaphase I plate congression(GO:0043060) |
Gene overrepresentation in cellular component category:
| Log-likelihood per target | Total log-likelihood | Term | Description |
|---|---|---|---|
| 0.1 | 0.4 | GO:0000015 | phosphopyruvate hydratase complex(GO:0000015) |
| 0.1 | 0.2 | GO:0000931 | gamma-tubulin large complex(GO:0000931) gamma-tubulin ring complex(GO:0008274) |
| 0.1 | 0.4 | GO:0000796 | condensin complex(GO:0000796) |
| 0.1 | 0.2 | GO:0000802 | transverse filament(GO:0000802) |
| 0.0 | 0.1 | GO:0005962 | mitochondrial isocitrate dehydrogenase complex (NAD+)(GO:0005962) isocitrate dehydrogenase complex (NAD+)(GO:0045242) |
| 0.0 | 0.5 | GO:0000940 | condensed chromosome outer kinetochore(GO:0000940) |
| 0.0 | 0.2 | GO:0005655 | nucleolar ribonuclease P complex(GO:0005655) ribonuclease P complex(GO:0030677) multimeric ribonuclease P complex(GO:0030681) |
| 0.0 | 0.0 | GO:0002945 | cyclin K-CDK13 complex(GO:0002945) |
| 0.0 | 0.1 | GO:1990851 | Wnt-Frizzled-LRP5/6 complex(GO:1990851) |
| 0.0 | 0.1 | GO:0033186 | CAF-1 complex(GO:0033186) |
| 0.0 | 0.1 | GO:0032777 | Piccolo NuA4 histone acetyltransferase complex(GO:0032777) |
| 0.0 | 0.1 | GO:0002193 | MAML1-RBP-Jkappa- ICN1 complex(GO:0002193) |
| 0.0 | 0.1 | GO:0034455 | t-UTP complex(GO:0034455) |
| 0.0 | 0.2 | GO:0005688 | U6 snRNP(GO:0005688) |
| 0.0 | 0.2 | GO:0031466 | Cul5-RING ubiquitin ligase complex(GO:0031466) |
| 0.0 | 0.1 | GO:0035061 | interchromatin granule(GO:0035061) |
| 0.0 | 0.1 | GO:0008622 | epsilon DNA polymerase complex(GO:0008622) |
| 0.0 | 0.2 | GO:0044354 | pinosome(GO:0044352) macropinosome(GO:0044354) |
| 0.0 | 0.0 | GO:0030690 | Noc1p-Noc2p complex(GO:0030690) |
| 0.0 | 0.1 | GO:0005827 | polar microtubule(GO:0005827) |
| 0.0 | 0.1 | GO:0030289 | protein phosphatase 4 complex(GO:0030289) |
| 0.0 | 0.1 | GO:0031265 | CD95 death-inducing signaling complex(GO:0031265) |
| 0.0 | 0.2 | GO:0031080 | nuclear pore outer ring(GO:0031080) |
| 0.0 | 0.1 | GO:0001652 | granular component(GO:0001652) |
| 0.0 | 0.2 | GO:0034709 | methylosome(GO:0034709) |
| 0.0 | 0.2 | GO:0000176 | nuclear exosome (RNase complex)(GO:0000176) |
| 0.0 | 0.0 | GO:0002944 | cyclin K-CDK12 complex(GO:0002944) |
| 0.0 | 0.2 | GO:0008540 | proteasome regulatory particle, base subcomplex(GO:0008540) |
| 0.0 | 0.1 | GO:0090571 | RNA polymerase II transcription repressor complex(GO:0090571) |
| 0.0 | 0.2 | GO:0000974 | Prp19 complex(GO:0000974) |
| 0.0 | 0.1 | GO:0000445 | THO complex(GO:0000347) THO complex part of transcription export complex(GO:0000445) |
| 0.0 | 0.3 | GO:0030992 | intraciliary transport particle B(GO:0030992) |
| 0.0 | 0.2 | GO:0044754 | autolysosome(GO:0044754) |
| 0.0 | 0.5 | GO:0016592 | mediator complex(GO:0016592) |
| 0.0 | 0.1 | GO:0008385 | IkappaB kinase complex(GO:0008385) |
| 0.0 | 0.2 | GO:0005685 | U1 snRNP(GO:0005685) |
| 0.0 | 0.1 | GO:0042555 | MCM complex(GO:0042555) |
Gene overrepresentation in molecular function category:
| Log-likelihood per target | Total log-likelihood | Term | Description |
|---|---|---|---|
| 0.1 | 0.4 | GO:0008511 | sodium:potassium:chloride symporter activity(GO:0008511) |
| 0.1 | 0.4 | GO:0004634 | phosphopyruvate hydratase activity(GO:0004634) |
| 0.1 | 0.6 | GO:0043515 | kinetochore binding(GO:0043515) |
| 0.1 | 0.5 | GO:0048273 | mitogen-activated protein kinase p38 binding(GO:0048273) NFAT protein binding(GO:0051525) |
| 0.0 | 0.1 | GO:0031208 | POZ domain binding(GO:0031208) |
| 0.0 | 0.1 | GO:0019807 | aspartoacylase activity(GO:0019807) |
| 0.0 | 0.2 | GO:0050785 | IgE binding(GO:0019863) advanced glycation end-product receptor activity(GO:0050785) |
| 0.0 | 0.3 | GO:0015556 | C4-dicarboxylate transmembrane transporter activity(GO:0015556) |
| 0.0 | 0.2 | GO:0005105 | type 1 fibroblast growth factor receptor binding(GO:0005105) |
| 0.0 | 0.2 | GO:0010340 | carboxyl-O-methyltransferase activity(GO:0010340) protein carboxyl O-methyltransferase activity(GO:0051998) |
| 0.0 | 0.2 | GO:0004726 | non-membrane spanning protein tyrosine phosphatase activity(GO:0004726) |
| 0.0 | 0.1 | GO:0004449 | isocitrate dehydrogenase (NAD+) activity(GO:0004449) |
| 0.0 | 0.2 | GO:0033592 | RNA strand annealing activity(GO:0033592) |
| 0.0 | 0.3 | GO:0043023 | ribosomal large subunit binding(GO:0043023) |
| 0.0 | 0.2 | GO:0004526 | ribonuclease P activity(GO:0004526) |
| 0.0 | 0.1 | GO:0036033 | mediator complex binding(GO:0036033) |
| 0.0 | 0.1 | GO:0035877 | death effector domain binding(GO:0035877) |
| 0.0 | 0.1 | GO:0008310 | single-stranded DNA 3'-5' exodeoxyribonuclease activity(GO:0008310) |
| 0.0 | 0.3 | GO:0005172 | vascular endothelial growth factor receptor binding(GO:0005172) |
| 0.0 | 0.1 | GO:0071936 | coreceptor activity involved in Wnt signaling pathway(GO:0071936) |
| 0.0 | 0.2 | GO:0003873 | 6-phosphofructo-2-kinase activity(GO:0003873) fructose-2,6-bisphosphate 2-phosphatase activity(GO:0004331) |
| 0.0 | 0.1 | GO:0034235 | GPI anchor binding(GO:0034235) |
| 0.0 | 0.1 | GO:0071987 | WD40-repeat domain binding(GO:0071987) |
| 0.0 | 0.1 | GO:0051731 | polynucleotide 5'-hydroxyl-kinase activity(GO:0051731) |
| 0.0 | 0.2 | GO:0051011 | microtubule minus-end binding(GO:0051011) |
| 0.0 | 0.4 | GO:0015288 | porin activity(GO:0015288) |
| 0.0 | 0.1 | GO:0004741 | [pyruvate dehydrogenase (lipoamide)] phosphatase activity(GO:0004741) |
| 0.0 | 0.1 | GO:0035368 | selenocysteine insertion sequence binding(GO:0035368) |
| 0.0 | 0.2 | GO:0005000 | vasopressin receptor activity(GO:0005000) |
| 0.0 | 0.1 | GO:0051920 | peroxiredoxin activity(GO:0051920) |
| 0.0 | 0.1 | GO:1990380 | Lys48-specific deubiquitinase activity(GO:1990380) |
| 0.0 | 0.1 | GO:0016149 | translation release factor activity, codon specific(GO:0016149) |
| 0.0 | 0.2 | GO:0008327 | methyl-CpG binding(GO:0008327) |
| 0.0 | 0.1 | GO:0001054 | RNA polymerase I activity(GO:0001054) |
| 0.0 | 0.1 | GO:0070087 | chromo shadow domain binding(GO:0070087) |
| 0.0 | 0.2 | GO:0046933 | proton-transporting ATP synthase activity, rotational mechanism(GO:0046933) |
| 0.0 | 0.1 | GO:0004694 | eukaryotic translation initiation factor 2alpha kinase activity(GO:0004694) |
| 0.0 | 0.2 | GO:0034236 | protein kinase A catalytic subunit binding(GO:0034236) |
Gene overrepresentation in curated gene sets: canonical pathways category:
| Log-likelihood per target | Total log-likelihood | Term | Description |
|---|---|---|---|
| 0.0 | 0.4 | PID NFKAPPAB ATYPICAL PATHWAY | Atypical NF-kappaB pathway |
| 0.0 | 0.3 | PID VEGFR1 PATHWAY | VEGFR1 specific signals |
| 0.0 | 0.1 | PID TCR JNK PATHWAY | JNK signaling in the CD4+ TCR pathway |
| 0.0 | 0.2 | PID WNT CANONICAL PATHWAY | Canonical Wnt signaling pathway |
Gene overrepresentation in curated gene sets: REACTOME pathways category:
| Log-likelihood per target | Total log-likelihood | Term | Description |
|---|---|---|---|
| 0.0 | 0.5 | REACTOME ACTIVATION OF THE AP1 FAMILY OF TRANSCRIPTION FACTORS | Genes involved in Activation of the AP-1 family of transcription factors |
| 0.0 | 0.2 | REACTOME RECRUITMENT OF NUMA TO MITOTIC CENTROSOMES | Genes involved in Recruitment of NuMA to mitotic centrosomes |
| 0.0 | 0.2 | REACTOME ADVANCED GLYCOSYLATION ENDPRODUCT RECEPTOR SIGNALING | Genes involved in Advanced glycosylation endproduct receptor signaling |
| 0.0 | 0.2 | REACTOME ACTIVATION OF CHAPERONES BY ATF6 ALPHA | Genes involved in Activation of Chaperones by ATF6-alpha |
| 0.0 | 0.1 | REACTOME IRAK2 MEDIATED ACTIVATION OF TAK1 COMPLEX UPON TLR7 8 OR 9 STIMULATION | Genes involved in IRAK2 mediated activation of TAK1 complex upon TLR7/8 or 9 stimulation |
| 0.0 | 0.1 | REACTOME UNWINDING OF DNA | Genes involved in Unwinding of DNA |
| 0.0 | 0.5 | REACTOME METABOLISM OF NON CODING RNA | Genes involved in Metabolism of non-coding RNA |